BREEDING STATUS AND POPULATION TRENDS OF SEABIRDS IN ... · AMNWR 2014/03 BREEDING STATUS AND...
75
BREEDING STATUS AND POPULATION TRENDS OF SEABIRDS IN ALASKA, 2013 U.S. FISH AND WILDLIFE SERVICE
Transcript of BREEDING STATUS AND POPULATION TRENDS OF SEABIRDS IN ... · AMNWR 2014/03 BREEDING STATUS AND...
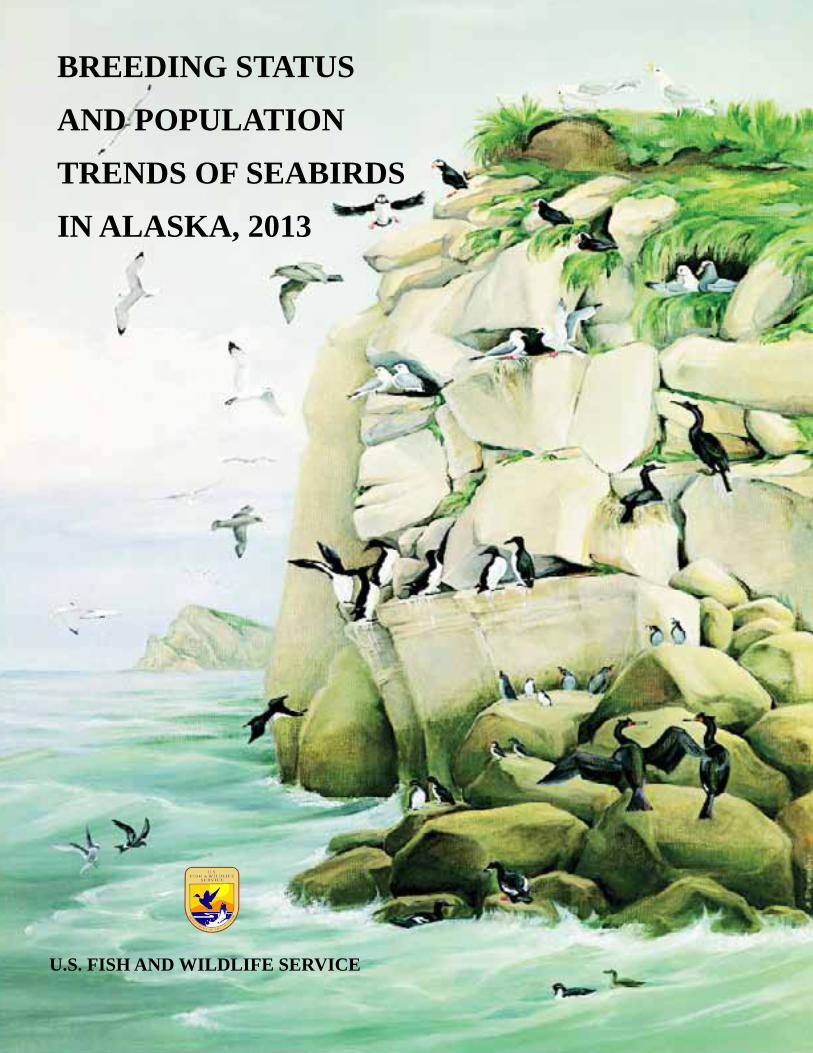
BREEDING STATUS
AND POPULATION
TRENDS OF SEABIRDS
IN ALASKA, 2013
U.S. FISH AND WILDLIFE SERVICE

AMNWR 2014/03
BREEDING STATUS AND POPULATION TRENDS OF SEABIRDS IN ALASKA, 2013
Compiled By:
Donald E. Dragoo, Heather M. Renner and David B. Ironsa
Key words: Aethia, Alaska, Aleutian Islands, ancient murrelet, Bering Sea, black-legged kittiwake, Cepphus, Cerorhinca, Chukchi Sea, common murre, crested auklet, fork-tailed storm-petrel, Fratercula, Fulmarus, glaucous-winged gull, Gulf of Alaska, hatching chronology, horned puffin, Larus, Leach’s storm-petrel, least auklet, long-term monitoring, northern fulmar, Oceanodroma, parakeet auklet, pelagic cormorant, Phalacrocorax, pigeon guillemot, Prince William Sound, productivity, red-faced cormorant, red-legged kittiwake, rhinoceros auklet, Rissa, seabirds, Synthliboramphus, thick-billed murre, tufted puffin, Uria, whiskered auklet.
U.S. Fish and Wildlife ServiceAlaska Maritime National Wildlife Refuge
95 Sterling Highway, Suite 1Homer, Alaska, USA 99603
January 2014
_____ Cite as: Dragoo, D. E., H. M. Renner, and D. B. Irons. 2014. Breeding status and population trends of seabirds in Alaska, 2013. U.S. Fish and Wildlife Service Report AMNWR 2014/03. Homer, Alaska.

aDragoo ([email protected]) and Renner ([email protected]), Alaska Maritime NWR, Homer; Irons ([email protected]), U. S. Fish and Wildlife Service, Migratory Bird Management, 1011 East Tudor Road, Anchorage, Alaska USA 99503
When using information from this report, data, results or conclusions specific to a location(s) should not be used in other publications without first obtaining permission from the original contributor(s). Results and conclusions general to large geographic areas may be cited without permission. This report updates previous reports.
The findings and conclusions in this report are those of the author(s) and do not necessarily represent the views of the U.S. Fish and Wildlife Service.
i
Executive Summary
Data are collected annually for selected species of marine birds at breeding colonies on the far-flung Alaska Maritime National Wildlife Refuge (NWR), and at other areas in Alaska, to monitor the condition of the marine ecosystem and to evaluate the conservation status of species under the trust of the U. S. Fish and Wildlife Service. The strategy for colony monitoring includes estimating timing of nesting events, rates of reproductive success and population trends of representative species of various foraging guilds (e.g., offshore diving fish-feeders, diving plankton-feeders) at geographically dispersed breeding sites. This information enables managers to better understand ecosystem processes and respond appropriately to resource issues. It also provides a basis for researchers to test hypotheses about ecosystem change. The value of the marine bird monitoring program is enhanced by having sufficiently long time-series to describe patterns for these long-lived species.
In summer 2013 data were gathered on northern fulmars, storm-petrels, cormorants, kittiwakes, glaucous-winged gulls, murres, ancient murrelets, auklets and/or puffins at eight annual monitoring sites on the Alaska Maritime NWR. In addition, data were gathered at other locations which are visited intermittently or were part of a research or monitoring program off refuges.
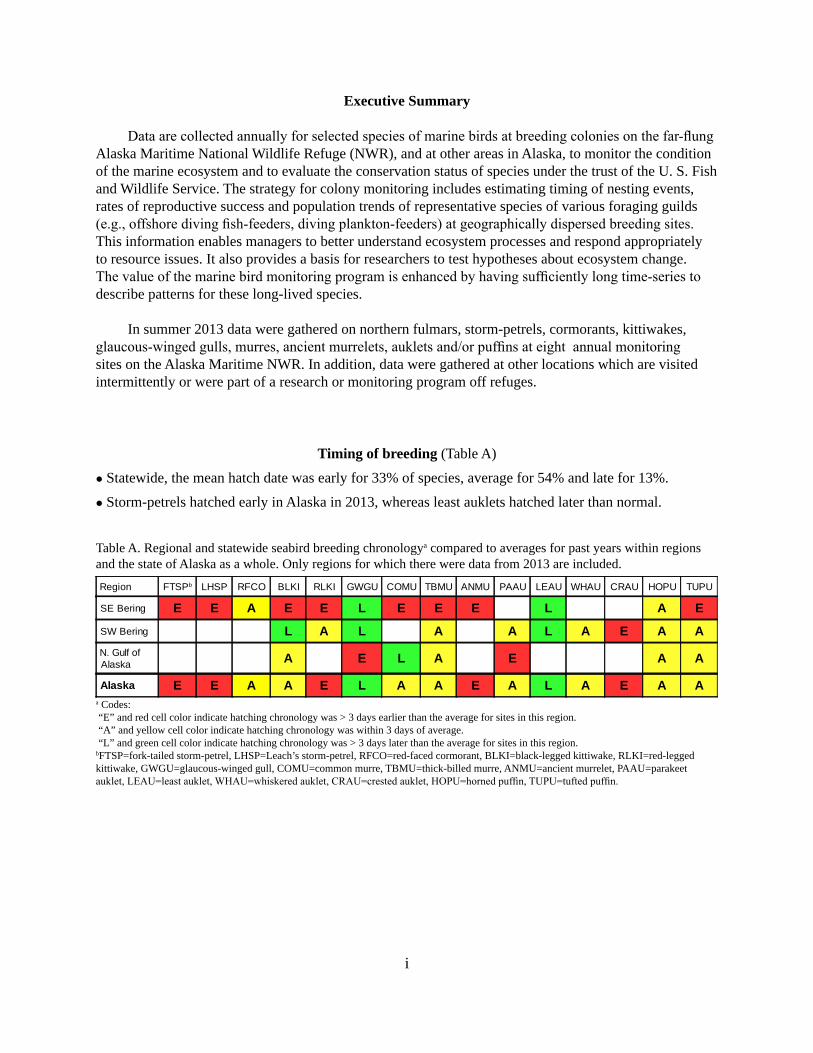
Timing of breeding (Table A)
l Statewide, the mean hatch date was early for 33% of species, average for 54% and late for 13%.
l Storm-petrels hatched early in Alaska in 2013, whereas least auklets hatched later than normal.
Table A. Regional and statewide seabird breeding chronologya compared to averages for past years within regions and the state of Alaska as a whole. Only regions for which there were data from 2013 are included.
a Codes: “E” and red cell color indicate hatching chronology was > 3 days earlier than the average for sites in this region. “A” and yellow cell color indicate hatching chronology was within 3 days of average. “L” and green cell color indicate hatching chronology was > 3 days later than the average for sites in this region.bFTSP=fork-tailed storm-petrel, LHSP=Leach’s storm-petrel, RFCO=red-faced cormorant, BLKI=black-legged kittiwake, RLKI=red-legged kittiwake, GWGU=glaucous-winged gull, COMU=common murre, TBMU=thick-billed murre, ANMU=ancient murrelet, PAAU=parakeet auklet, LEAU=least auklet, WHAU=whiskered auklet, CRAU=crested auklet, HOPU=horned puffin, TUPU=tufted puffin.
Region FTSPb LHSP RFCO BLKI RLKI GWGU COMU TBMU ANMU PAAU LEAU WHAU CRAU HOPU TUPU
SE Bering E E A E E L E E E L A E
SW Bering L A L A A L A E A AN. Gulf ofAlaska A E L A E A A
Alaska E E A A E L A A E A L A E A A
ii
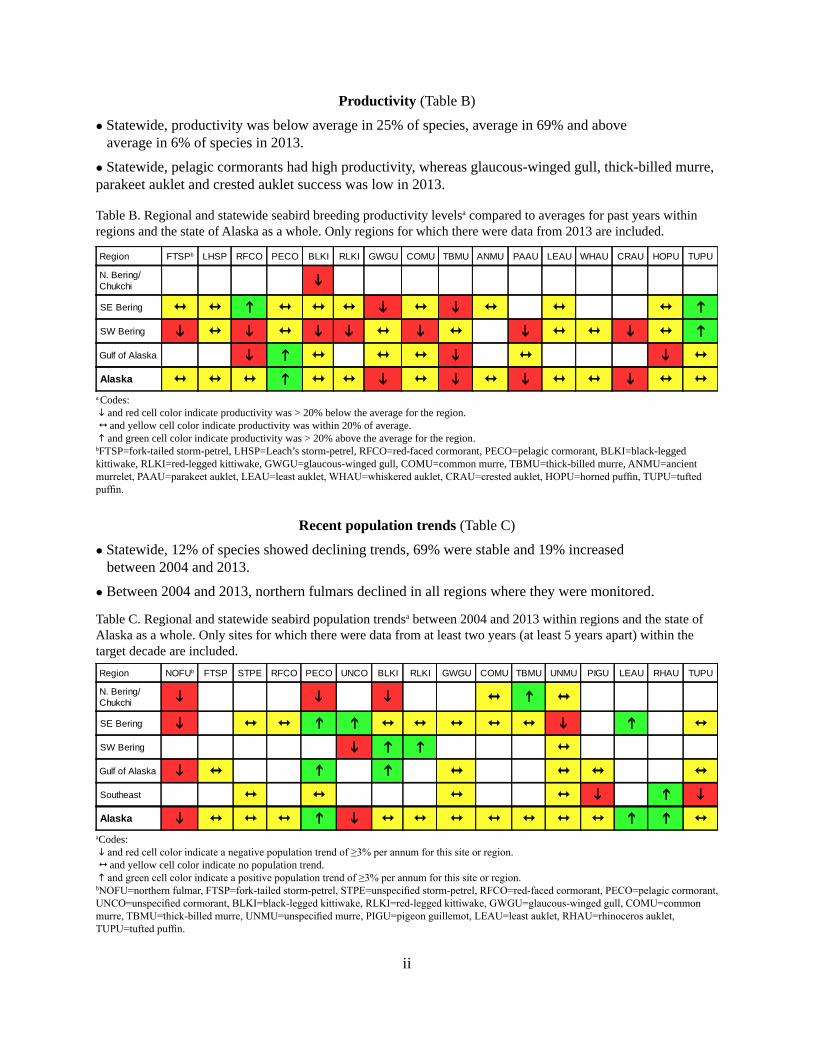
Table B. Regional and statewide seabird breeding productivity levelsa compared to averages for past years within regions and the state of Alaska as a whole. Only regions for which there were data from 2013 are included.
a Codes: i and red cell color indicate productivity was > 20% below the average for the region. 1 and yellow cell color indicate productivity was within 20% of average. h and green cell color indicate productivity was > 20% above the average for the region.bFTSP=fork-tailed storm-petrel, LHSP=Leach’s storm-petrel, RFCO=red-faced cormorant, PECO=pelagic cormorant, BLKI=black-legged kittiwake, RLKI=red-legged kittiwake, GWGU=glaucous-winged gull, COMU=common murre, TBMU=thick-billed murre, ANMU=ancient murrelet, PAAU=parakeet auklet, LEAU=least auklet, WHAU=whiskered auklet, CRAU=crested auklet, HOPU=horned puffin, TUPU=tufted puffin.
Recent population trends (Table C)
l Statewide, 12% of species showed declining trends, 69% were stable and 19% increased between 2004 and 2013.
l Between 2004 and 2013, northern fulmars declined in all regions where they were monitored.
Table C. Regional and statewide seabird population trendsa between 2004 and 2013 within regions and the state of Alaska as a whole. Only sites for which there were data from at least two years (at least 5 years apart) within the target decade are included.
aCodes: i and red cell color indicate a negative population trend of ≥3% per annum for this site or region. 1 and yellow cell color indicate no population trend. h and green cell color indicate a positive population trend of ≥3% per annum for this site or region.bNOFU=northern fulmar, FTSP=fork-tailed storm-petrel, STPE=unspecified storm-petrel, RFCO=red-faced cormorant, PECO=pelagic cormorant, UNCO=unspecified cormorant, BLKI=black-legged kittiwake, RLKI=red-legged kittiwake, GWGU=glaucous-winged gull, COMU=common murre, TBMU=thick-billed murre, UNMU=unspecified murre, PIGU=pigeon guillemot, LEAU=least auklet, RHAU=rhinoceros auklet, TUPU=tufted puffin.
Productivity (Table B)
l Statewide, productivity was below average in 25% of species, average in 69% and above average in 6% of species in 2013.
l Statewide, pelagic cormorants had high productivity, whereas glaucous-winged gull, thick-billed murre, parakeet auklet and crested auklet success was low in 2013.
Region FTSPb LHSP RFCO PECO BLKI RLKI GWGU COMU TBMU ANMU PAAU LEAU WHAU CRAU HOPU TUPU
N. Bering/Chukchi i
SE Bering 1 1 h 1 1 1 i 1 i 1 1 1 h
SW Bering i 1 i 1 i i 1 i 1 i 1 1 i 1 h
Gulf of Alaska i h 1 1 1 i 1 i 1
Alaska 1 1 1 h 1 1 i 1 i 1 i 1 1 i 1 1
Region NOFUb FTSP STPE RFCO PECO UNCO BLKI RLKI GWGU COMU TBMU UNMU PIGU LEAU RHAU TUPU
N. Bering/Chukchi i i i 1 h 1
SE Bering i 1 1 h h 1 1 1 1 1 i h 1
SW Bering i h h 1
Gulf of Alaska i 1 h h 1 1 1 1
Southeast 1 1 1 1 i h i
Alaska i 1 1 1 h i 1 1 1 1 1 1 1 h h 1
iii
Table of Contents
Executive Summary ........................................................................................................................................i
Table of Contents ......................................................................................................................................... iii
Introduction ...................................................................................................................................................1
Methods ........................................................................................................................................................3
Results ............................................................................................................................................................5 Northern fulmar (Fulmarus glacialis) ..............................................................................................5 Populations ..........................................................................................................................5
Fork-tailed storm-petrel (Oceanodroma furcata) .............................................................................6 Breeding chronology ...........................................................................................................6 Productivity ..........................................................................................................................6 Populations ..........................................................................................................................9
Leach’s storm-petrel (Oceanodroma leucorhoa) ............................................................................10 Breeding chronology .........................................................................................................10 Productivity ........................................................................................................................10 Populations ..........................................................................................................................9
Red-faced cormorant (Phalacrocorax urile)...................................................................................13 Productivity ........................................................................................................................13 Populations ........................................................................................................................15
Pelagic cormorant (Phalacrocorax pelagicus) ...............................................................................17 Productivity ........................................................................................................................17 Populations ........................................................................................................................15
Black-legged kittiwake (Rissa tridactyla) ......................................................................................19 Breeding chronology .........................................................................................................19 Productivity ........................................................................................................................19 Populations ........................................................................................................................22
Red-legged kittiwake (Rissa brevirostris) ......................................................................................24 Breeding chronology .........................................................................................................24 Productivity ........................................................................................................................24 Populations ........................................................................................................................27
Glaucous-winged gull (Larus glaucescens) ....................................................................................28 Breeding chronology .........................................................................................................28 Productivity ........................................................................................................................28 Populations ........................................................................................................................31
iv
Table of Contents (continued)
Common murre (Uria aalge) ..........................................................................................................32 Breeding chronology .........................................................................................................32 Productivity ........................................................................................................................32 Populations ........................................................................................................................35
Thick-billed murre (Uria lomvia) ...................................................................................................38 Breeding chronology .........................................................................................................38 Productivity ........................................................................................................................38 Populations ........................................................................................................................35
Pigeon guillemot (Cepphus columba) .............................................................................................41 Populations ........................................................................................................................41
Ancient murrelet (Synthliboramphus antiquus) ..............................................................................42 Breeding chronology .........................................................................................................42 Productivity ........................................................................................................................42
Parakeet auklet (Aethia psittacula) .................................................................................................43 Breeding chronology .........................................................................................................43 Productivity ........................................................................................................................43
Least auklet (Aethia pusilla) ...........................................................................................................46 Breeding chronology .........................................................................................................46 Productivity ........................................................................................................................46 Populations ........................................................................................................................46
Whiskered auklet (Aethia pygmaea) ...............................................................................................49 Breeding chronology .........................................................................................................49 Productivity ........................................................................................................................49
Crested auklet (Aethia cristatella) ..................................................................................................50 Breeding chronology .........................................................................................................50 Productivity ........................................................................................................................50 Rhinoceros auklet (Cerorhinca monocerata) .................................................................................53 Populations ........................................................................................................................53
Horned puffin (Fratercula corniculata) ..........................................................................................55 Breeding chronology .........................................................................................................55 Productivity ........................................................................................................................55
v
Table of Contents (continued)
Tufted puffin (Fratercula cirrhata) ................................................................................................58 Breeding chronology .........................................................................................................58 Productivity ........................................................................................................................58 Populations ........................................................................................................................61
Summary tables ............................................................................................................................................62
Acknowledgments ........................................................................................................................................65
References ...................................................................................................................................................65
1
Introduction
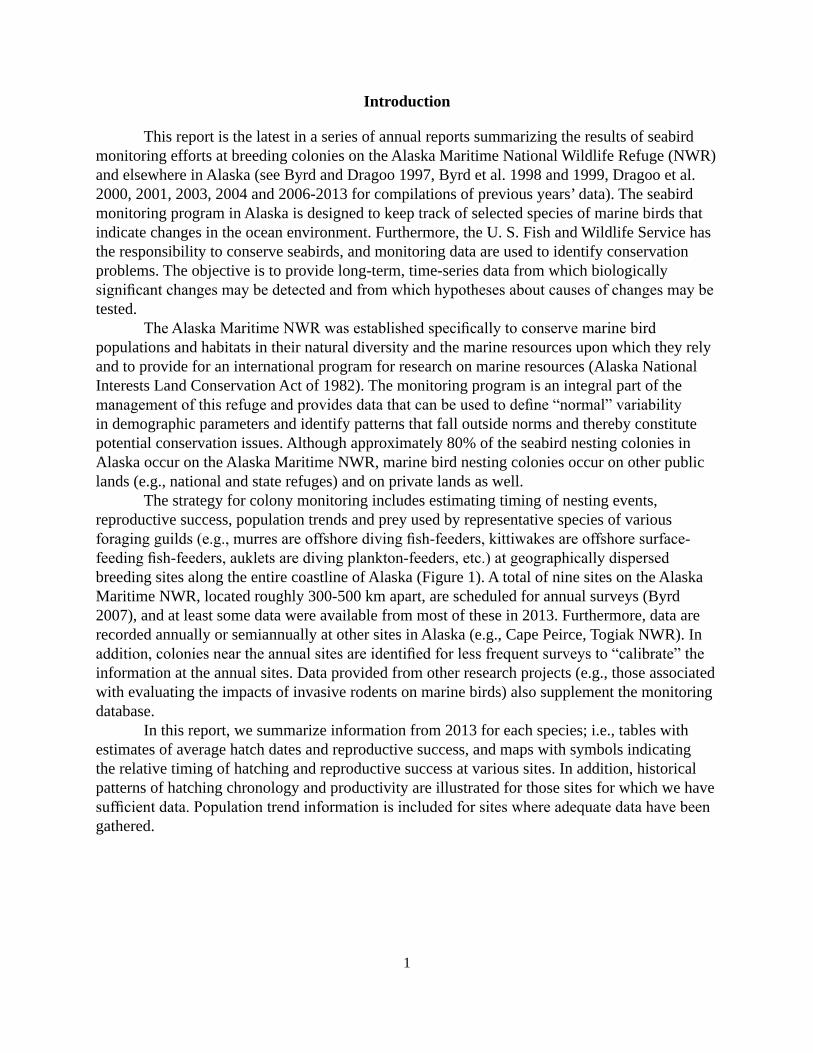
This report is the latest in a series of annual reports summarizing the results of seabird monitoring efforts at breeding colonies on the Alaska Maritime National Wildlife Refuge (NWR) and elsewhere in Alaska (see Byrd and Dragoo 1997, Byrd et al. 1998 and 1999, Dragoo et al. 2000, 2001, 2003, 2004 and 2006-2013 for compilations of previous years’ data). The seabird monitoring program in Alaska is designed to keep track of selected species of marine birds that indicate changes in the ocean environment. Furthermore, the U. S. Fish and Wildlife Service has the responsibility to conserve seabirds, and monitoring data are used to identify conservation problems. The objective is to provide long-term, time-series data from which biologically significant changes may be detected and from which hypotheses about causes of changes may be tested. The Alaska Maritime NWR was established specifically to conserve marine bird populations and habitats in their natural diversity and the marine resources upon which they rely and to provide for an international program for research on marine resources (Alaska National Interests Land Conservation Act of 1982). The monitoring program is an integral part of the management of this refuge and provides data that can be used to define “normal” variability in demographic parameters and identify patterns that fall outside norms and thereby constitute potential conservation issues. Although approximately 80% of the seabird nesting colonies in Alaska occur on the Alaska Maritime NWR, marine bird nesting colonies occur on other public lands (e.g., national and state refuges) and on private lands as well. The strategy for colony monitoring includes estimating timing of nesting events, reproductive success, population trends and prey used by representative species of various foraging guilds (e.g., murres are offshore diving fish-feeders, kittiwakes are offshore surface-feeding fish-feeders, auklets are diving plankton-feeders, etc.) at geographically dispersed breeding sites along the entire coastline of Alaska (Figure 1). A total of nine sites on the Alaska Maritime NWR, located roughly 300-500 km apart, are scheduled for annual surveys (Byrd 2007), and at least some data were available from most of these in 2013. Furthermore, data are recorded annually or semiannually at other sites in Alaska (e.g., Cape Peirce, Togiak NWR). In addition, colonies near the annual sites are identified for less frequent surveys to “calibrate” the information at the annual sites. Data provided from other research projects (e.g., those associated with evaluating the impacts of invasive rodents on marine birds) also supplement the monitoring database. In this report, we summarize information from 2013 for each species; i.e., tables with estimates of average hatch dates and reproductive success, and maps with symbols indicating the relative timing of hatching and reproductive success at various sites. In addition, historical patterns of hatching chronology and productivity are illustrated for those sites for which we have sufficient data. Population trend information is included for sites where adequate data have been gathered.
2
Figure 1. Map of Alaska showing the locations of seabird monitoring sites summarized in this report. Text color indicates geographic regions.
500
KMN
Cape
Lisb
urne
Cape
Peir
ceSt
. Pau
l I.
St. G
eorg
e I.
Buldi
r I.
Koniu
ji I./U
lak I.
Aikta
k I.
Roun
d I.
Chow
iet I.
E. A
matul
i I.Midd
leton
I.Princ
e Willi
am S
ound
St. L
azar
ia I.
Nor
ther
n Be
ring/
Chu
kchi
Sout
heas
tern
Ber
ing
Nor
ther
n G
ulf o
f Ala
ska
Sout
hwes
tern
Ber
ing
Sout
heas
t Ala
ska
Kisk
a I.
Hall I
.
Puale
Bay

3
Methods
Data collection methods generally followed standardized protocols (e.g., USFWS 2013). Timing of nesting events and productivity usually were based on periodic checks of samples of nests (frequently in plots) throughout the breeding season, but a few estimates of productivity were based on single visits to colonies late in the breeding season (as noted in tables). Hatch dates were used to describe nesting chronology. Productivity typically was expressed as chicks fledged per egg, but occasionally other variables were used (Table 1). Population surveys were conducted for ledge-nesting species at times of the day and breeding season when variability in attendance was reduced. Most burrow-nester counts were made early in the season before vegetation obscured burrow entrances. Deviations from standard methods are indicated in reports from individual sites which are appropriately referenced.
Table 1. Productivity parameters used in this report.Species Productivity Value Storm-petrels Chicks Fledged/Egg (Total chicks fledged/Total eggs) Cormorants Chicks Fledged/Nest (Total chicks fledged/Total nests)Glaucous-winged gull Hatching Success (Total chicks/Total eggs)Kittiwakes Chicks Fledged/Nest (Total chicks fledged/Total nests)Murres Chicks Fledged/Nest Site (Total chicks fledged/Total sites where egg was laid)Ancient murrelet Chicks Fledged/Egg (Total chicks fledged/Total eggs)Auklets (except RHAU) Chicks Fledged/Nest Site (Total chicks fledged/Total sites where egg was laid)Rhinoceros auklet Chicks Fledged/Egg (Total chicks fledged/Total eggs)Puffins Chicks Fledged/Egg (Total chicks fledged/Total eggs)
This report summarizes monitoring data for 2013, and compares 2013 results with previous years. For sites with at least two years of data prior to 2013, site averages were used for comparisons. For chronology, we considered dates within 3 days of the long-term average to be “normal”; larger deviations represented relatively early or late dates. For productivity, we defined significant deviations from “normal” as any that differed by more than 20% from the site or regional average. Population trends were analyzed using linear regression models on log-transformed data (ln) to calculate the slope of the line. The resultant slope is equivalent to the annual rate of population change. A trend was defined as any change greater than or equal to a three percent per annum increase or decline (≥3% p.a.). Population counts were analyzed using two time frames: 1) data from all available years, and 2) data from the last decade (2004-2013 for this report). A percent per annum change was calculated for each data set during both time periods, if sufficient data were available. We also summarized seabird phenology and productivity, as well as population trends (from 2004-2013), by region and for the entire state. Chronology was calculated for each species in a region using data from all colonies. Each colony was weighted equally within each region. The chronology was averaged for all sites within each region resulting in a value for each species, thus producing one statewide value for each species. Productivity was calculated for each species in a region using data from all colonies. Each colony was weighted equally within each region. The productivity was averaged for all sites within each region resulting in a value for each species. Species productivities were then

4
averaged to calculate a statewide value for each species. Population trends were calculated for each species in a region using data from all colonies. Each colony was weighted equally within each region. Trends (line slopes) were averaged for all sites within each region resulting in a regional value for each species. Only sites for which there were data from at least two years (at least 5 years apart) between 2004 and 2013 were included.

5
Results
Northern fulmar (Fulmarus glacialis)
Figure 2. Trends in populations of northern fulmars at Alaskan sites. Error bars (90% confidence intervals) are shown for years with multiple counts. Percent per annum (p.a.) changes are indicated for all years and for just the last decade (2004-2013, in parentheses).
Year1976 1981 1986 1991 1996 2001 2006 2011
Per
cent
of
max
imum
(62
3 bi
rds)
0
100
Northern fulmar, Chowiet I. -0.7% p.a. (-4.4% p.a.)
Year1976 1981 1986 1991 1996 2001 2006 2011
Per
cent
of
Max
imum
(48
7 bi
rds)
0
100
Northern fulmar, Hall I. +0.2% p.a. (-7.3% p.a.)
Year1976 1981 1986 1991 1996 2001 2006 2011
Per
cent
of
Max
imum
(14
2 bi
rds)
0
100
Northern fulmar, St. Paul I. +1.3% p.a. (-0.9% p.a.)
Year1976 1981 1986 1991 1996 2001 2006 2011
Per
cent
of
Max
imum
(23
50 b
irds
)
0
100
Northern fulmar, St. George I. -1.6% p.a. (-16.5% p.a.)

6
Fork-tailed storm-petrel (Oceanodroma furcata)
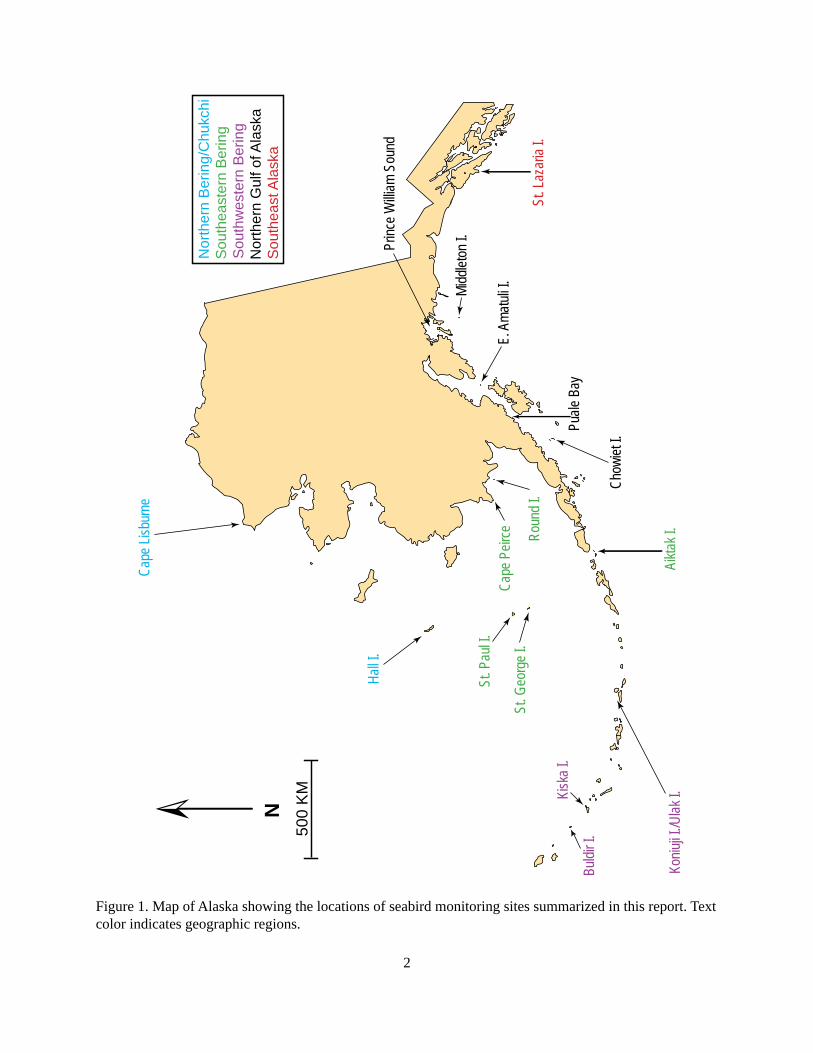
Table 2. Hatching chronology of fork-tailed storm-petrels at Alaskan sites monitored in 2013. Long-term Site Mean Average ReferenceAiktak I. 16 Jul (18)a 16 Jul (16)a Howie et al. 2014aSample size in parentheses represents the number of nest sites used to calculate the mean hatch date and the number of years used to calculate the long-term average. Current year not included in long-term average.
Table 3. Reproductive performance of fork-tailed storm-petrels at Alaskan sites monitored in 2013. Chicks No. of Long-termSite Fledgeda/Egg Plots Average ReferenceBuldir I. 0.55 5 (44)b 0.73 (26)b Kohley and Herman 2014Aiktak I. 0.82 14 (68) 0.81 (13) Howie et al. 2014aFledged chick defined as being alive at last check in August or September.bSample size in parentheses represents the number of eggs used to calculate productivity and the number of years used to calculate the long-term average. Current year not used in long-term average.
7
Figure 3. Hatching chronology of fork-tailed storm-petrels at Alaskan sites. Graphs indicate the departure in days (if any) from the site mean (in parentheses; current year not included).
Aik
tak
(16
Jul)
St.
Laza
ria (1
1 Ju
l)
Aver
age
=La
te+-E
arly
NN
o H
atch
2013
FTS
PH
atch
ing
Chr
onol
ogy
-
00
-20
-1001020
7580
8590
9500
0510
-20
-1001020
7580
8590
9500
0510
8
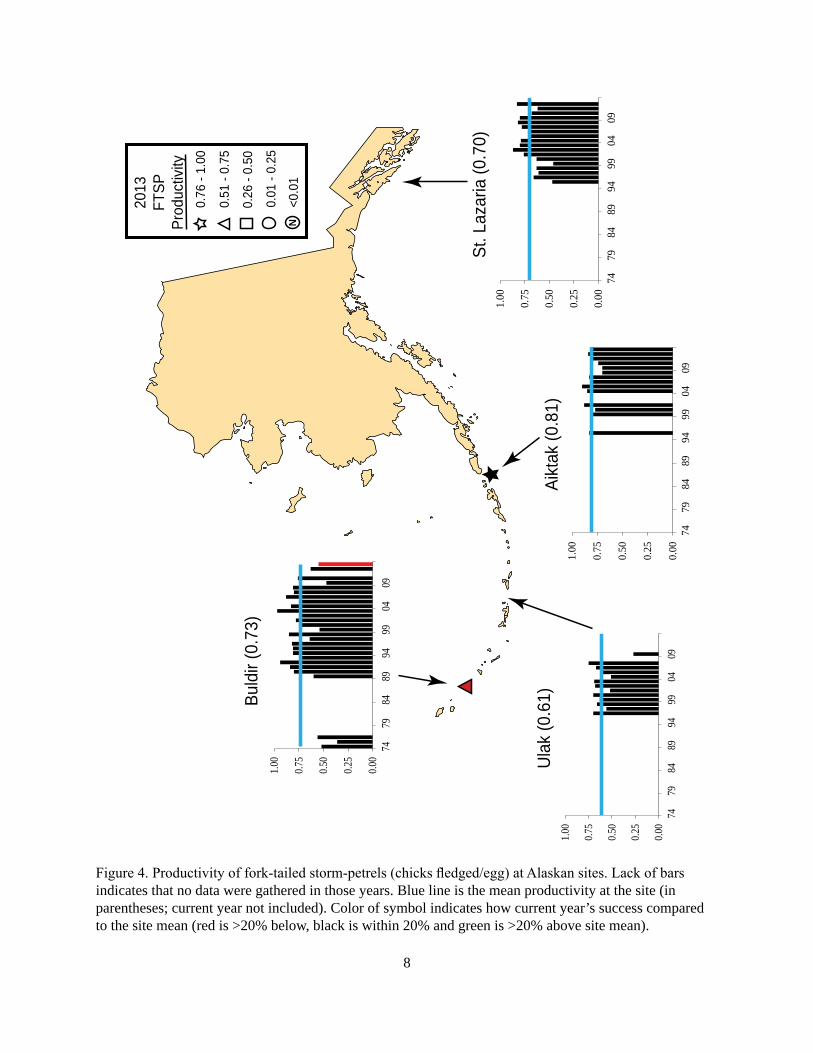
Figure 4. Productivity of fork-tailed storm-petrels (chicks fledged/egg) at Alaskan sites. Lack of bars indicates that no data were gathered in those years. Blue line is the mean productivity at the site (in parentheses; current year not included). Color of symbol indicates how current year’s success compared to the site mean (red is >20% below, black is within 20% and green is >20% above site mean).
N
0.76
- 1.
00
0.51
- 0.
75
0.26
- 0.
50
0.01
- 0.
25
<0.0
1
2013
FTSP
Prod
uctiv
ity
Buld
ir (0
.73)
Ula
k (0
.61)
Aikt
ak (0
.81)
St. L
azar
ia (0
.70)
0.00
0.25
0.50
0.75
1.00
7479
8489
9499
0409
0.00
0.25
0.50
0.75
1.00
7479
8489
9499
0409
0.00
0.25
0.50
0.75
1.00
7479
8489
9499
0409
0.00
0.25
0.50
0.75
1.00
7479
8489
9499
0409
9
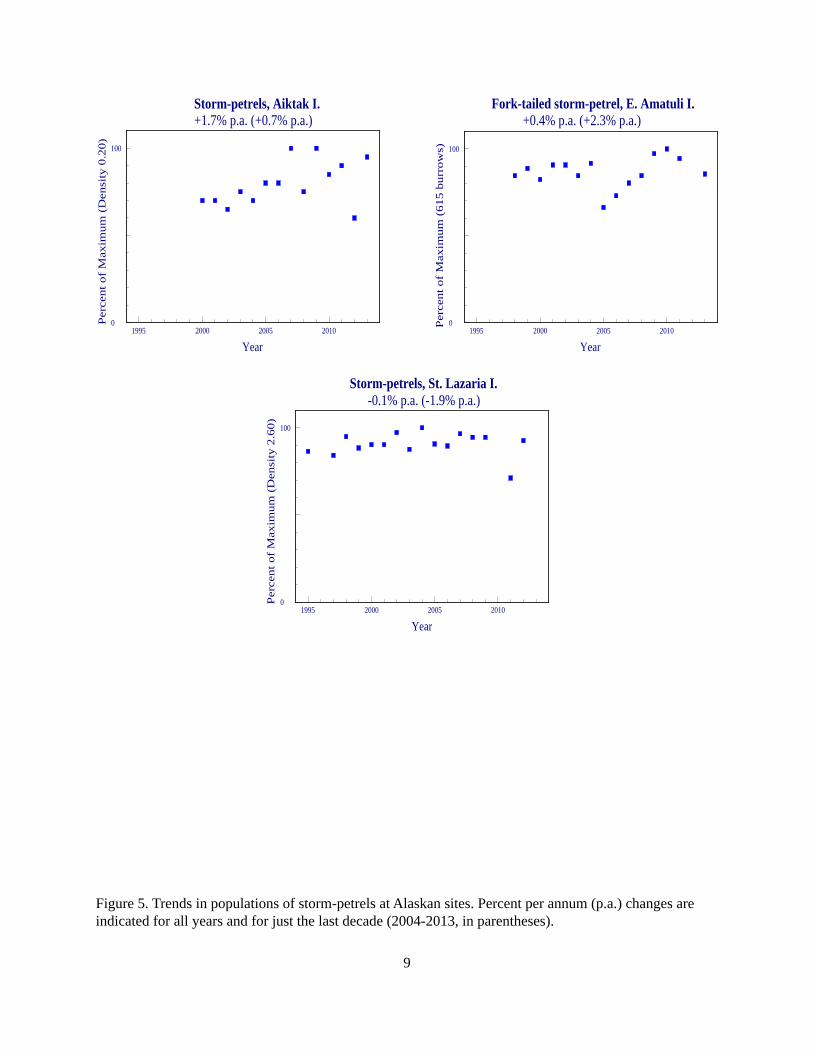
Figure 5. Trends in populations of storm-petrels at Alaskan sites. Percent per annum (p.a.) changes are indicated for all years and for just the last decade (2004-2013, in parentheses).
Year1995 2000 2005 2010
Per
cent
of
Max
imum
(D
ensi
ty 0
.20)
0
100
Storm-petrels, Aiktak I. +1.7% p.a. (+0.7% p.a.)
Year1995 2000 2005 2010
Per
cent
of
Max
imum
(61
5 bu
rrow
s)
0
100
Fork-tailed storm-petrel, E. Amatuli I. +0.4% p.a. (+2.3% p.a.)
Year1995 2000 2005 2010
Per
cent
of
Max
imum
(D
ensi
ty 2
.60)
0
100
Storm-petrels, St. Lazaria I. -0.1% p.a. (-1.9% p.a.)
10
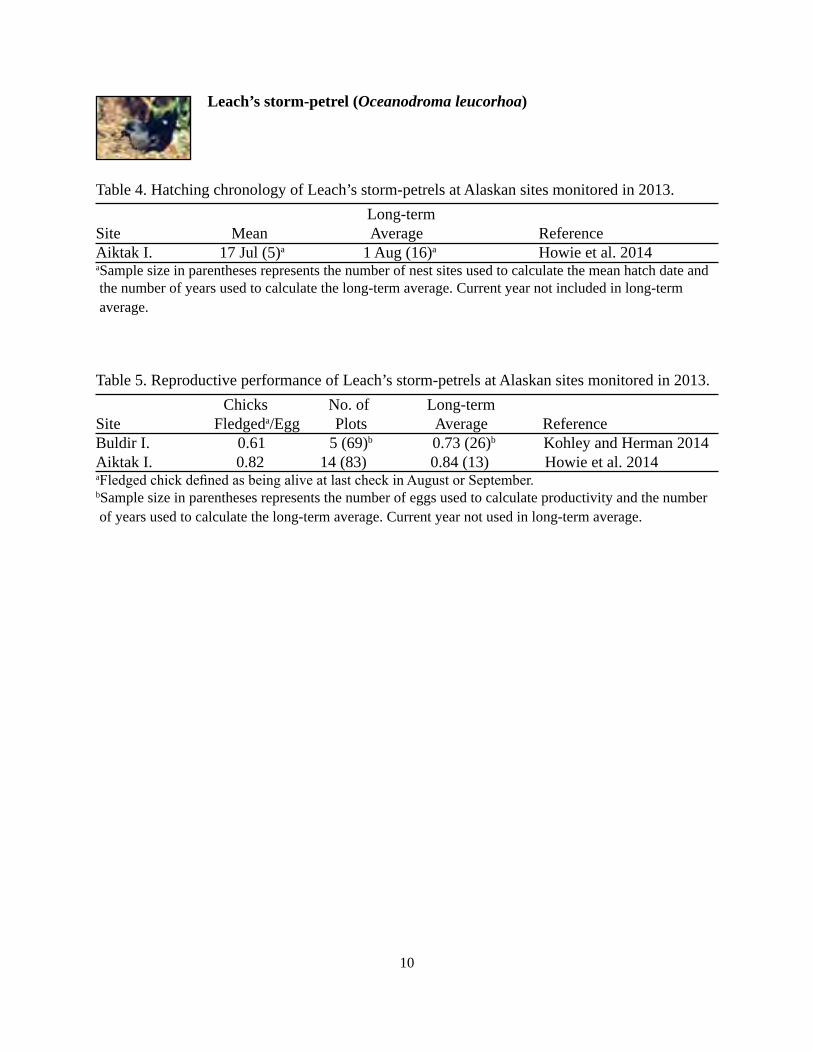
Leach’s storm-petrel (Oceanodroma leucorhoa)
Table 4. Hatching chronology of Leach’s storm-petrels at Alaskan sites monitored in 2013. Long-term Site Mean Average ReferenceAiktak I. 17 Jul (5)a 1 Aug (16)a Howie et al. 2014aSample size in parentheses represents the number of nest sites used to calculate the mean hatch date and the number of years used to calculate the long-term average. Current year not included in long-term average.
Table 5. Reproductive performance of Leach’s storm-petrels at Alaskan sites monitored in 2013. Chicks No. of Long-term Site Fledgeda/Egg Plots Average ReferenceBuldir I. 0.61 5 (69)b 0.73 (26)b Kohley and Herman 2014Aiktak I. 0.82 14 (83) 0.84 (13) Howie et al. 2014aFledged chick defined as being alive at last check in August or September.bSample size in parentheses represents the number of eggs used to calculate productivity and the number of years used to calculate the long-term average. Current year not used in long-term average.
11
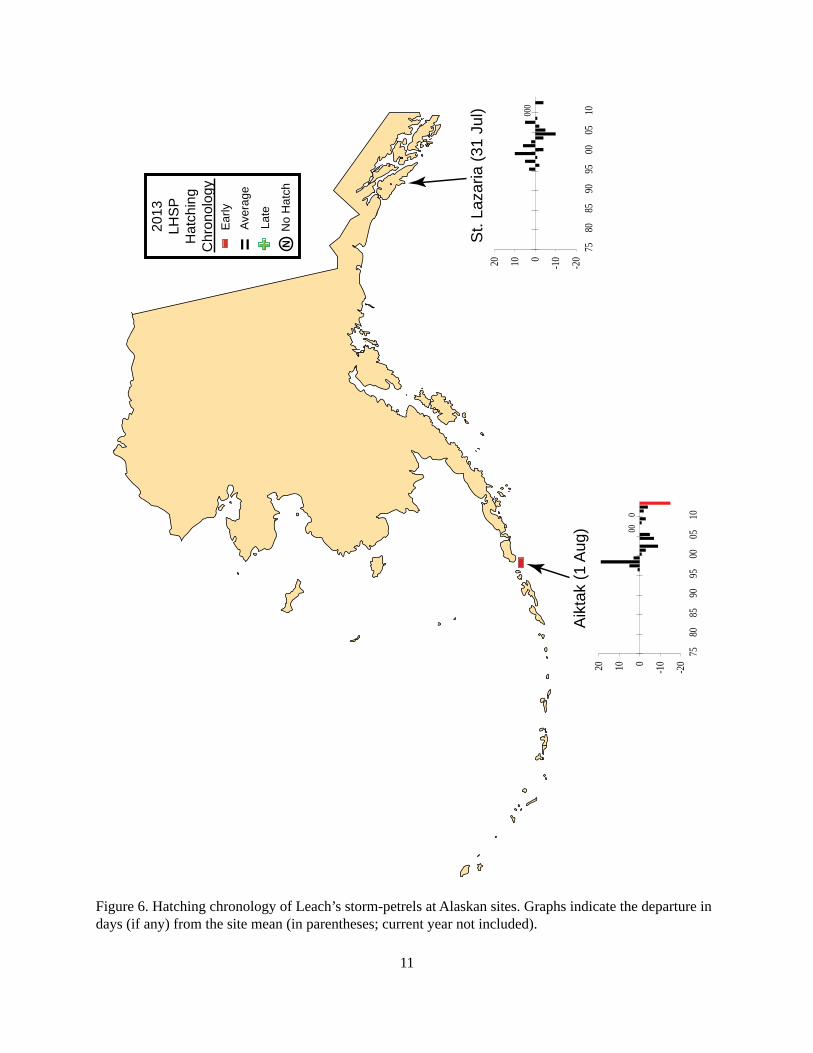
Figure 6. Hatching chronology of Leach’s storm-petrels at Alaskan sites. Graphs indicate the departure in days (if any) from the site mean (in parentheses; current year not included).
Aver
age
=La
te+-E
arly
NN
o H
atch
2013
LHS
PH
atch
ing
Chr
onol
ogy
Aik
tak
(1 A
ug)
St.
Laza
ria (3
1 Ju
l)
-
000
-20
-1001020
7580
8590
9500
0510
000
-20
-1001020
7580
8590
9500
0510

12
Figure 7. Productivity of Leach’s storm-petrels (chicks fledged/egg) at Alaskan sites. Lack of bars indicates that no data were gathered in those years. Blue line is the mean productivity at the site (in parentheses; current year not included). Color of symbol indicates how current year’s success compared to the site mean (red is >20% below, black is within 20% and green is >20% above site mean).
N
0.76
- 1.
00
0.51
- 0.
75
0.26
- 0.
50
0.01
- 0.
25
<0.0
1
2013
LHSP
Prod
uctiv
ityBu
ldir
(0.7
3)
Aikt
ak (0
.84)
St. L
azar
ia (0
.70)
0.00
0.25
0.50
0.75
1.00
7479
8489
9499
0409
0.00
0.25
0.50
0.75
1.00
7479
8489
9499
0409
0.00
0.25
0.50
0.75
1.00
7479
8489
9499
0409

13
Red-faced cormorant (Phalacrocorax urile)
Table 6. Hatching chronology of red-faced cormorants at Alaskan sites monitored in 2013. Long-term Site Mean Average Reference St. Paul I. 27 Jun (16)a 30 Jun (23)a Thomson and Romano 2013aSample size in parentheses represents the number of nest sites used to calculate the mean hatch date and the number of years used to calculate the long-term average. Current year not included in long-term average.
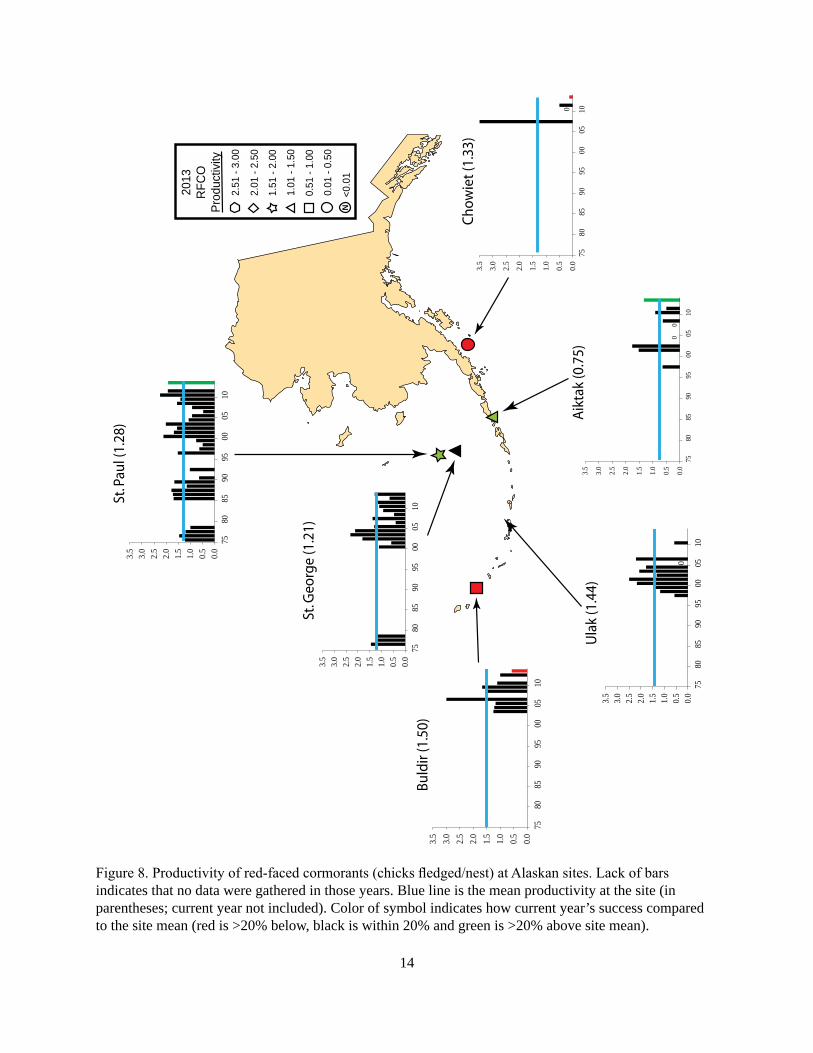
Table 7. Reproductive performance of red-faced cormorants at Alaskan sites monitored in 2013. Chicks No. of Long-termSite Fledged/Nest Plots Average ReferenceSt. Paul I. 1.92 2 (24)a 1.28 (28)a Thomson and Romano 2013St. George I. 1.29 4 (52) 1.21 (16) Klostermann et al. 2013Buldir I. 0.57 NAb (7) 1.50 (8) Kohley and Herman 2014Aiktak I. 1.33 NA (9) 0.75 (8) Howie et al. 2014Chowiet I. 0.13 3 (125) 1.33 (3) Henschen et al. 2013aSample size in parentheses represents the number of nests used to calculate productivity and the number of years used to calculate the long-term average. Current year not used in long-term average.bNot applicable or not reported.
14
Figure 8. Productivity of red-faced cormorants (chicks fledged/nest) at Alaskan sites. Lack of bars indicates that no data were gathered in those years. Blue line is the mean productivity at the site (in parentheses; current year not included). Color of symbol indicates how current year’s success compared to the site mean (red is >20% below, black is within 20% and green is >20% above site mean).
N
1.51
- 2.
00
1.01
- 1.
50
0.51
- 1.
00
0.01
- 0.
50
<0.0
1
2.01
- 2.
50
2.51
- 3.
00
2013
RFC
OPr
oduc
tivity
St. P
aul (
1.28
)
St. G
eorg
e (1
.21)
Ula
k (1
.44)
Aik
tak
(0.7
5)
Buld
ir (1
.50)
Cho
wie
t (1.
33)
0.0
0.5
1.0
1.5
2.0
2.5
3.0
3.5
7580
8590
9500
0510
0.0
0.5
1.0
1.5
2.0
2.5
3.0
3.5
7580
8590
9500
0510
00.
00.
51.
01.
52.
02.
53.
03.
5
7580
8590
9500
0510
0.00.51.01.52.02.53.03.5
7580
8590
9500
0510
00
0.0
0.5
1.0
1.5
2.0
2.5
3.0
3.5
7580
8590
9500
0510
00.
0
0.5
1.0
1.5
2.0
2.5
3.0
3.5
7580
8590
9500
0510
15
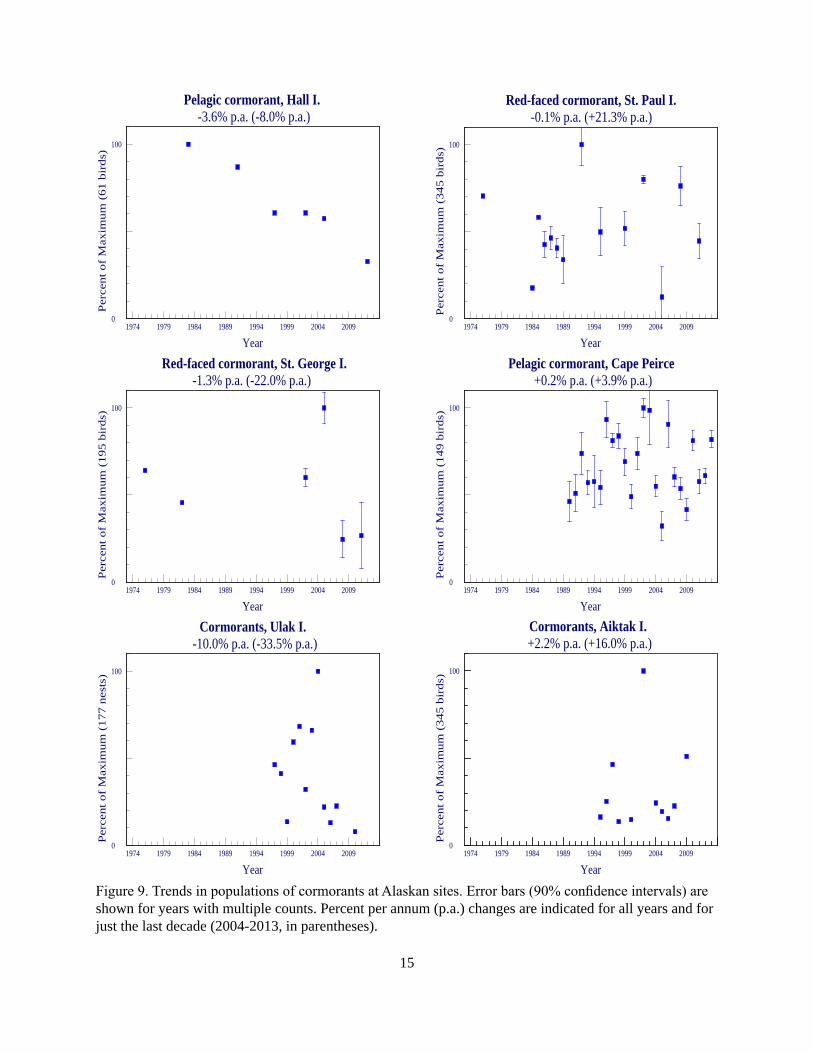
Figure 9. Trends in populations of cormorants at Alaskan sites. Error bars (90% confidence intervals) are shown for years with multiple counts. Percent per annum (p.a.) changes are indicated for all years and for just the last decade (2004-2013, in parentheses).
Year1974 1979 1984 1989 1994 1999 2004 2009
Per
cent
of
Max
imum
(61
bir
ds)
0
100
Pelagic cormorant, Hall I. -3.6% p.a. (-8.0% p.a.)
Year1974 1979 1984 1989 1994 1999 2004 2009
Per
cent
of
Max
imum
(34
5 bi
rds)
0
100
Red-faced cormorant, St. Paul I. -0.1% p.a. (+21.3% p.a.)
Year1974 1979 1984 1989 1994 1999 2004 2009
Per
cent
of
Max
imum
(19
5 bi
rds)
0
100
Red-faced cormorant, St. George I. -1.3% p.a. (-22.0% p.a.)
Year1974 1979 1984 1989 1994 1999 2004 2009
Per
cent
of
Max
imum
(14
9 bi
rds)
0
100
Pelagic cormorant, Cape Peirce +0.2% p.a. (+3.9% p.a.)
Year1974 1979 1984 1989 1994 1999 2004 2009
Per
cent
of
Max
imum
(17
7 ne
sts)
0
100
Cormorants, Ulak I. -10.0% p.a. (-33.5% p.a.)
Year1974 1979 1984 1989 1994 1999 2004 2009
0
Per
cent
of
Max
imum
(34
5 bi
rds)
100
Cormorants, Aiktak I. +2.2% p.a. (+16.0% p.a.)
16
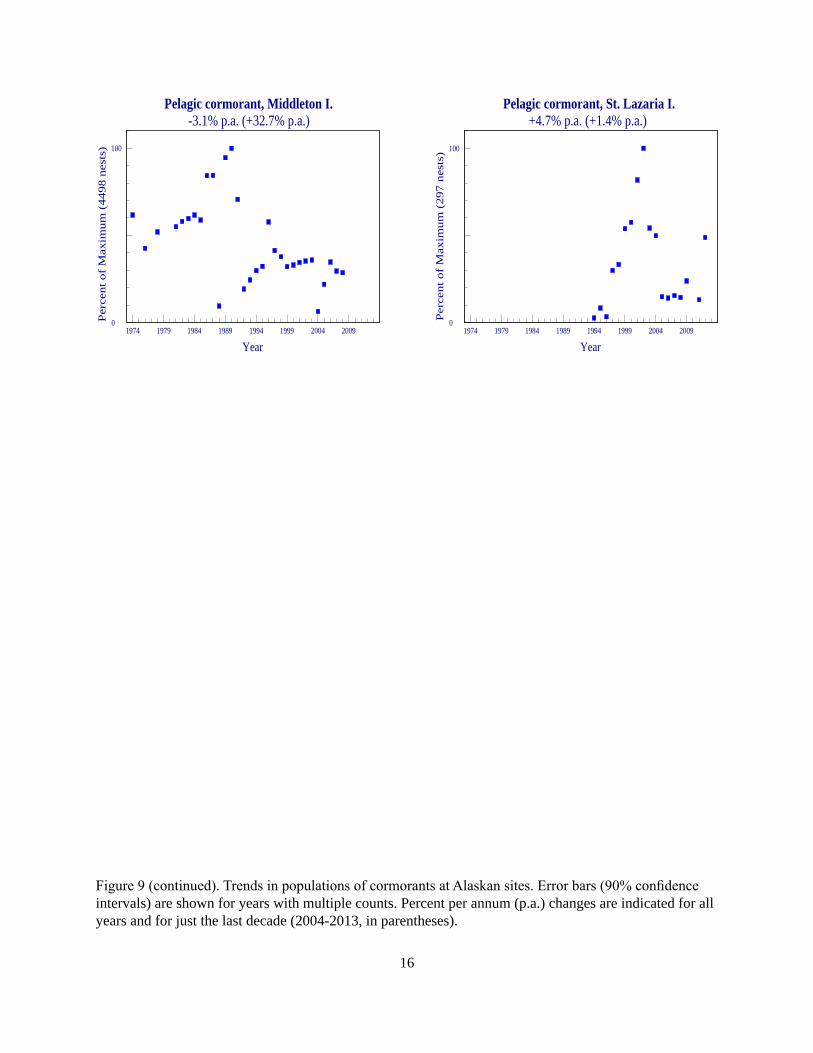
Figure 9 (continued). Trends in populations of cormorants at Alaskan sites. Error bars (90% confidence intervals) are shown for years with multiple counts. Percent per annum (p.a.) changes are indicated for all years and for just the last decade (2004-2013, in parentheses).
Year1974 1979 1984 1989 1994 1999 2004 2009
0Per
cent
of
Max
imum
(44
98 n
ests
) 100
Pelagic cormorant, Middleton I.-3.1% p.a. (+32.7% p.a.)
Year1974 1979 1984 1989 1994 1999 2004 2009
Per
cent
of
Max
imum
(29
7 ne
sts)
0
100
Pelagic cormorant, St. Lazaria I.+4.7% p.a. (+1.4% p.a.)
17
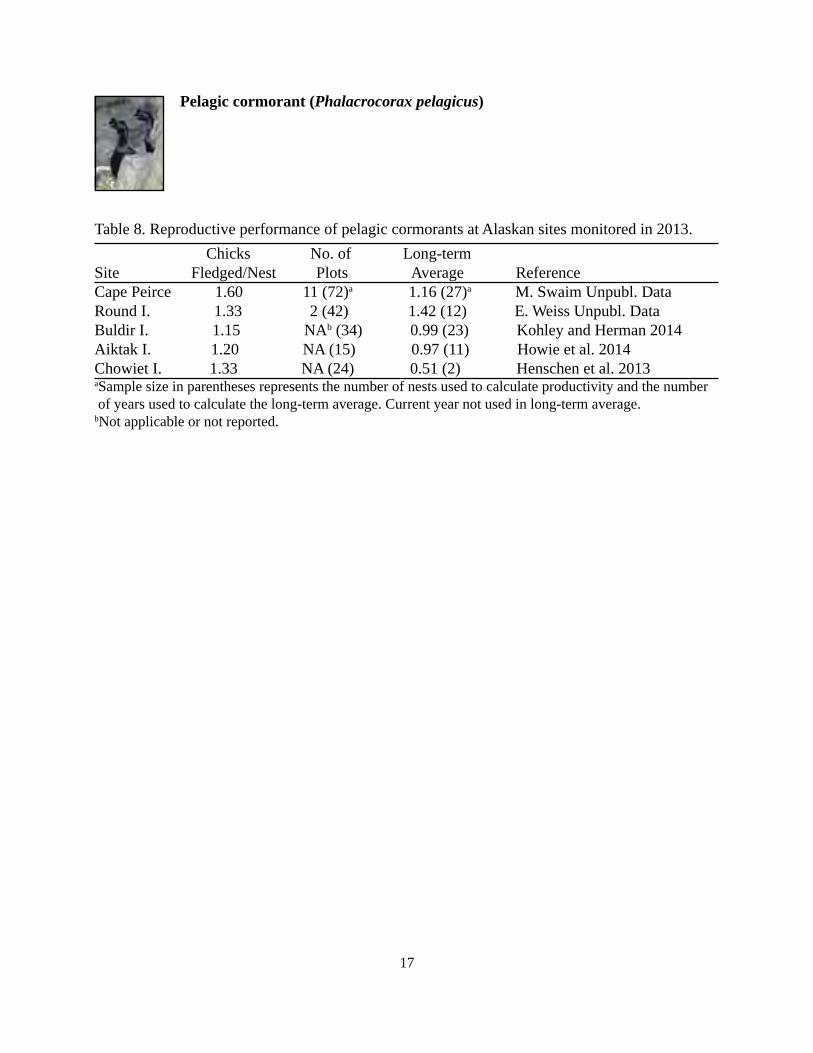
Pelagic cormorant (Phalacrocorax pelagicus)
Table 8. Reproductive performance of pelagic cormorants at Alaskan sites monitored in 2013. Chicks No. of Long-termSite Fledged/Nest Plots Average ReferenceCape Peirce 1.60 11 (72)a 1.16 (27)a M. Swaim Unpubl. DataRound I. 1.33 2 (42) 1.42 (12) E. Weiss Unpubl. DataBuldir I. 1.15 NAb (34) 0.99 (23) Kohley and Herman 2014Aiktak I. 1.20 NA (15) 0.97 (11) Howie et al. 2014Chowiet I. 1.33 NA (24) 0.51 (2) Henschen et al. 2013aSample size in parentheses represents the number of nests used to calculate productivity and the number of years used to calculate the long-term average. Current year not used in long-term average.bNot applicable or not reported.
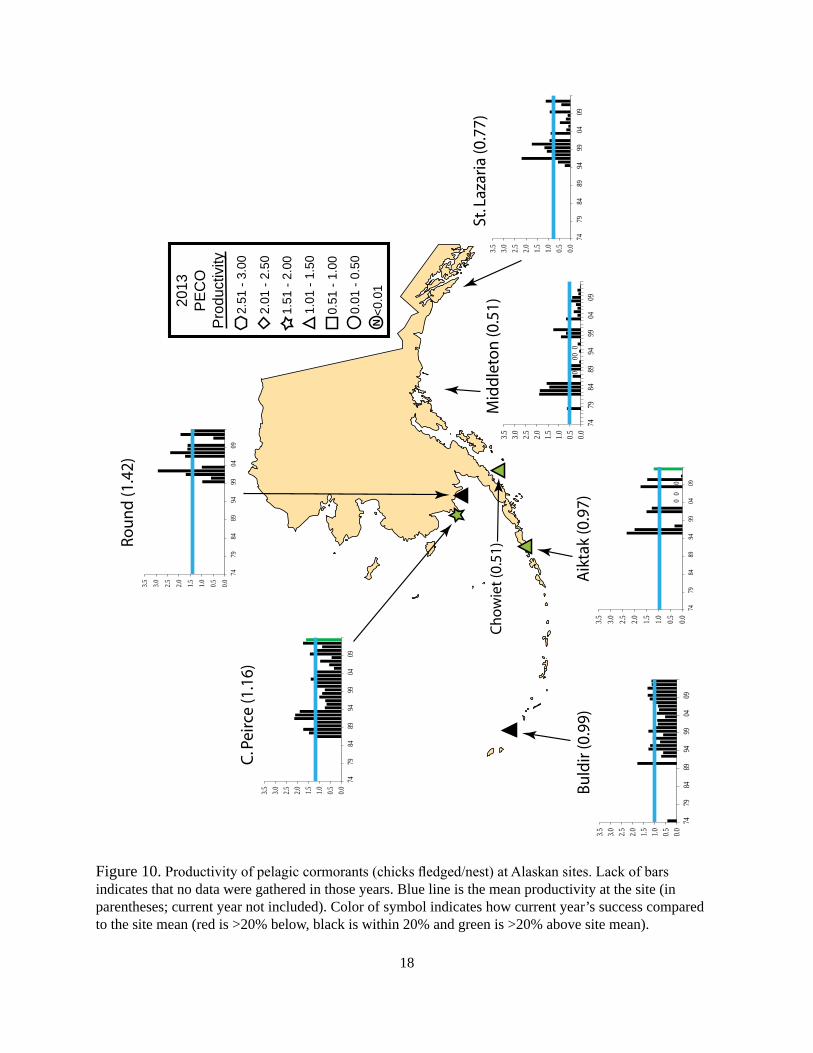
18
Figure 10. Productivity of pelagic cormorants (chicks fledged/nest) at Alaskan sites. Lack of bars indicates that no data were gathered in those years. Blue line is the mean productivity at the site (in parentheses; current year not included). Color of symbol indicates how current year’s success compared to the site mean (red is >20% below, black is within 20% and green is >20% above site mean).
1.51
- 2.
00
1.01
- 1.
50
0.51
- 1.
00
0.01
- 0.
50
<0.0
1
2.01
- 2.
50
2.51
- 3.
00
N
2013
PEC
OPr
oduc
tivity
C. P
eirc
e (1
.16)
Roun
d (1
.42)
Buld
ir (0
.99)
Aik
tak
(0.9
7)
St. L
azar
ia (0
.77)
Mid
dle
ton
(0.5
1)C
how
iet (
0.51
)
0.00.51.01.52.02.53.03.5
7479
8489
9499
0409
0.00.51.01.52.02.53.03.5
7479
8489
9499
0409
0.00.51.01.52.02.53.03.5
7479
8489
9499
0409
00
00.00.51.01.52.02.53.03.5
7479
8489
9499
0409
000
00.00.51.01.52.02.53.03.5
7479
8489
9499
0409
0.00.51.01.52.02.53.03.5
7479
8489
9499
0409
19
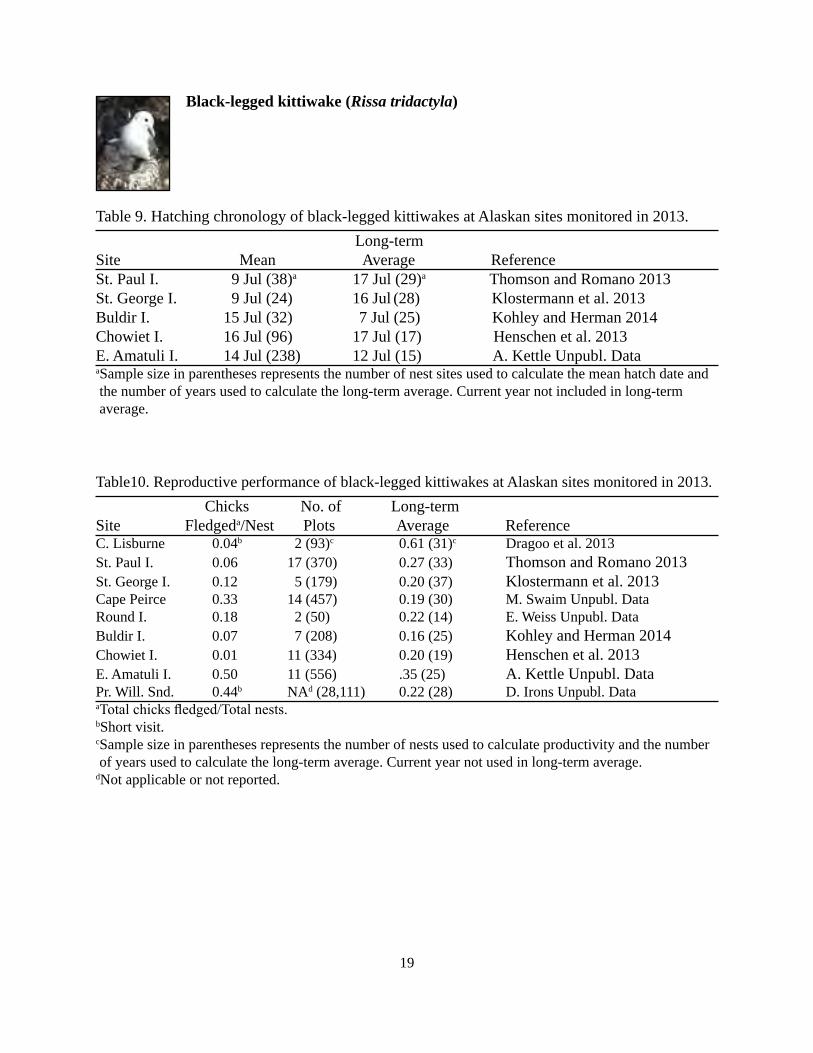
Black-legged kittiwake (Rissa tridactyla)
Table 9. Hatching chronology of black-legged kittiwakes at Alaskan sites monitored in 2013. Long-term Site Mean Average ReferenceSt. Paul I. 9 Jul (38)a 17 Jul (29)a Thomson and Romano 2013St. George I. 9 Jul (24) 16 Jul (28) Klostermann et al. 2013Buldir I. 15 Jul (32) 7 Jul (25) Kohley and Herman 2014Chowiet I. 16 Jul (96) 17 Jul (17) Henschen et al. 2013E. Amatuli I. 14 Jul (238) 12 Jul (15) A. Kettle Unpubl. DataaSample size in parentheses represents the number of nest sites used to calculate the mean hatch date and the number of years used to calculate the long-term average. Current year not included in long-term average.
Table10. Reproductive performance of black-legged kittiwakes at Alaskan sites monitored in 2013. Chicks No. of Long-termSite Fledgeda/Nest Plots Average ReferenceC. Lisburne 0.04b 2 (93)c 0.61 (31)c Dragoo et al. 2013St. Paul I. 0.06 17 (370) 0.27 (33) Thomson and Romano 2013St. George I. 0.12 5 (179) 0.20 (37) Klostermann et al. 2013Cape Peirce 0.33 14 (457) 0.19 (30) M. Swaim Unpubl. DataRound I. 0.18 2 (50) 0.22 (14) E. Weiss Unpubl. DataBuldir I. 0.07 7 (208) 0.16 (25) Kohley and Herman 2014Chowiet I. 0.01 11 (334) 0.20 (19) Henschen et al. 2013E. Amatuli I. 0.50 11 (556) .35 (25) A. Kettle Unpubl. DataPr. Will. Snd. 0.44b NAd (28,111) 0.22 (28) D. Irons Unpubl. DataaTotal chicks fledged/Total nests.bShort visit.cSample size in parentheses represents the number of nests used to calculate productivity and the number of years used to calculate the long-term average. Current year not used in long-term average.dNot applicable or not reported.

20
Figure 11. Hatching chronology of black-legged kittiwakes at Alaskan sites. Graphs indicate the departure in days (if any) from the site mean (in parentheses; current year not included).
Aver
age
=La
te+-E
arly
NN
o H
atch
2013
BLK
IH
atch
ing
Chr
onol
ogy
St.
Pau
l (17
Jul
)
St.
Geo
rge
(16
Jul)
Bul
dir (
7 Ju
l)
Cho
wie
t (17
Jul
)
E. A
mat
uli (
12 J
ul)
--+
=
=
-20
-1001020
7580
8590
9500
0510
-20
-1001020
7580
8590
9500
0510 -2
0
-1001020
7580
8590
9500
0510
00
-20
-1001020
7580
8590
9500
0510
0
-20
-1001020
7580
8590
9500
0510

21
Figure 12. Productivity of black-legged kittiwakes (chicks fledged/nest) at Alaskan sites. Lack of bars indicates that no data were gathered in those years. Blue line is the mean productivity at the site (in parentheses; current year not included). Color of symbol indicates how current year’s success compared to the site mean (red is >20% below, black is within 20% and green is >20% above site mean).
C. L
isb
urn
e (0
.61)
St. P
aul (
0.27
)
St. G
eorg
e (0
.20)
C. P
eirc
e (0
.19)
Ro
un
d (0
.22)
Bu
ldir
(0.1
6)
Ko
niu
ji (0
.48)
Mid
dle
ton
(0.1
5)
Ch
ow
iet
(0.2
0)
Pr. W
illia
m S
nd
. (0.
22)
E. A
mat
uli
(0.3
5)
N
0.76
- 1.
00
0.51
- 0.
75
0.26
- 0.
50
0.01
- 0.
25
<0.0
1
2013
BLK
IP
rodu
ctiv
ity1.
01 -
1.25
00
0.0
0.3
0.6
0.9
1.2
1.5
1.8
7580
8590
9500
0510
00
0.00.30.60.91.21.51.8
7580
8590
9500
0510
00
00
00.00.30.60.91.21.51.8
7580
8590
9500
0510
000
00
0
0.0
0.3
0.6
0.9
1.2
1.5
1.8
7580
8590
9500
0510
000
00
0.00.30.60.91.21.51.8
7580
8590
9500
0510
00.00.30.60.91.21.51.8
7580
8590
9500
0510 0.00.30.60.91.21.51.8
7580
8590
9500
0510
00
00
0
0.0
0.3
0.6
0.9
1.2
1.5
1.8
7580
8590
9500
0510
00
00
0.00.30.60.91.21.51.8
7580
8590
9500
0510
0.0
0.3
0.6
0.9
1.2
1.5
1.8
7580
8590
9500
0510
000
0000
0000
0.0
0.3
0.6
0.9
1.2
1.5
1.8
7580
8590
9500
0510

22
Figure 13. Trends in populations of black-legged kittiwakes at Alaskan sites. Error bars (90% confidence intervals) are shown for years with multiple counts. Percent per annum (p.a.) changes are indicated for all years and for just the last decade (2004-2013, in parentheses).
Year1970 1980 1990 2000 2010
Per
cent
of
Max
imum
(10
69 b
irds
)
0
100
Black-legged kittiwake, Cape Lisburne+3.4% p.a. (+2.8% p.a.)
Year1970 1980 1990 2000 2010
Per
cent
of
Max
imum
(37
4 bi
rds)
0
100
Black-legged kittiwake, Hall I.-5.8% p.a. (-16.4% p.a.)
Year1970 1980 1990 2000 2010
Per
cent
of
Max
imum
(29
39 b
irds
)
0
100
Black-legged kittiwake, St. Paul I.-1.9% p.a. (+1.5% p.a.)
Year1970 1980 1990 2000 2010
Per
cent
of
Max
imum
(18
82 b
irds
)
0
100
Black-legged kittiwake, St. George I.+0.1% p.a. (-2.5% p.a.)
Year1970 1980 1990 2000 2010
Per
cent
of
Max
imum
(19
06 b
irds
)
0
100
Black-legged kittiwake, Cape Peirce-2.6% p.a (+5.7% p.a.)
Year1970 1980 1990 2000 2010
Per
cent
of
Max
imum
(44
5 bi
rds)
0
100
Black-legged kittiwake, Round I.-1.9% p.a. (-0.2% p.a.)
23
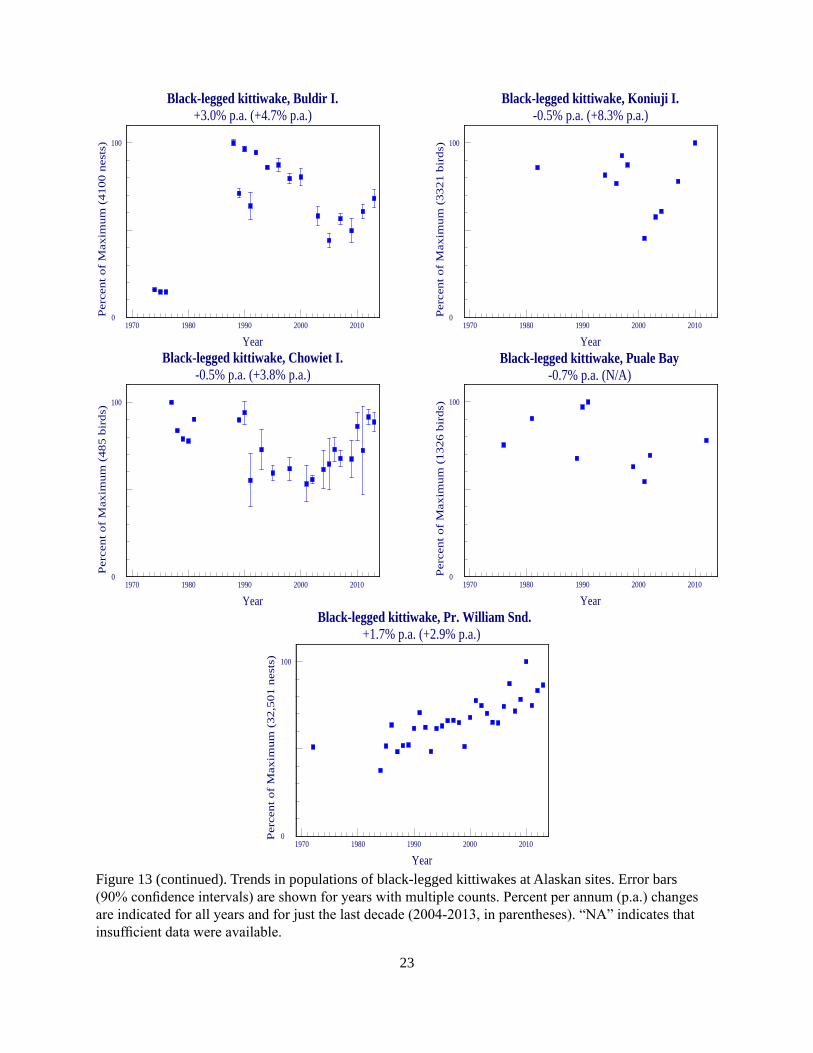
Figure 13 (continued). Trends in populations of black-legged kittiwakes at Alaskan sites. Error bars (90% confidence intervals) are shown for years with multiple counts. Percent per annum (p.a.) changes are indicated for all years and for just the last decade (2004-2013, in parentheses). “NA” indicates that insufficient data were available.
Year1970 1980 1990 2000 2010
Per
cent
of
Max
imum
(41
00 n
ests
)
0
100
Black-legged kittiwake, Buldir I.+3.0% p.a. (+4.7% p.a.)
Year1970 1980 1990 2000 2010
0
100
Per
cent
of
Max
imum
(33
21 b
irds
)
Black-legged kittiwake, Koniuji I.-0.5% p.a. (+8.3% p.a.)
Year1970 1980 1990 2000 2010
Per
cent
of
Max
imum
(48
5 bi
rds)
0
100
Black-legged kittiwake, Chowiet I.-0.5% p.a. (+3.8% p.a.)
Year1970 1980 1990 2000 2010
Per
cent
of
Max
imum
(13
26 b
irds
)
0
100
Black-legged kittiwake, Puale Bay-0.7% p.a. (N/A)
Year1970 1980 1990 2000 2010
Per
cent
of
Max
imum
(32
,501
nes
ts)
0
100
Black-legged kittiwake, Pr. William Snd.+1.7% p.a. (+2.9% p.a.)

24
Red-legged kittiwake (Rissa brevirostris)
Table 11. Hatching chronology of red-legged kittiwakes at Alaskan sites monitored in 2013. Long-term Site Mean Average ReferenceSt. George I. 6 Jul (89)a 16 Jul (32)a Klostermann et al. 2013Buldir I. 10 Jul (4) 11 Jul (22) Kohley and Herman 2014aSample size in parentheses represents the number of nest sites used to calculate the mean hatch date and the number of years used to calculate the long-term average. Current year not included in long-term average.
Table 12. Reproductive performance of red-legged kittiwakes at Alaskan sites monitored in 2013. Chicks No. of Long-term Site Fledgeda/Nest Plots Average ReferenceSt. Paul I. 0.16 5 (19)b 0.25 (33)b Thomson and Romano 2013St. George I. 0.25 8 (310) 0.24 (37) Klostermann et al. 2013Buldir I. 0.15 2 (27) 0.19 (25) Kohley and Herman 2014aTotal chicks fledged/Total nests.bSample size in parentheses represents the number of nests used to calculate productivity and the number of years used to calculate the long-term average. Current year not used in long-term average.
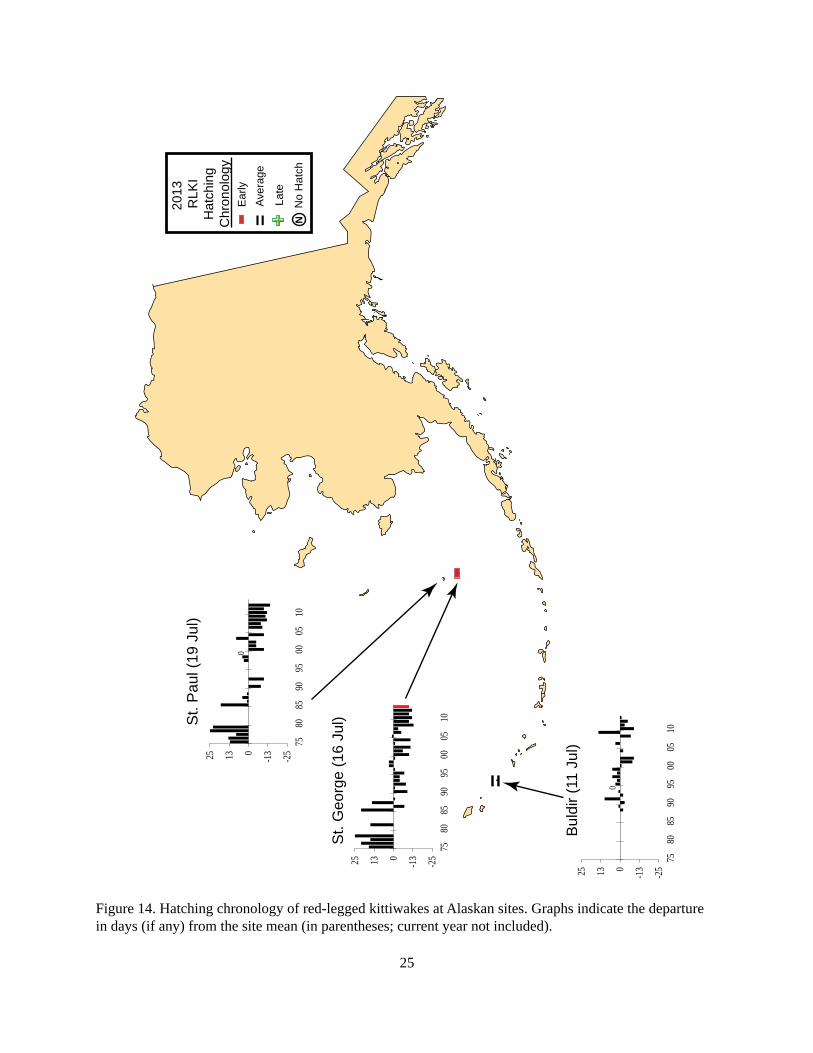
25
Figure 14. Hatching chronology of red-legged kittiwakes at Alaskan sites. Graphs indicate the departure in days (if any) from the site mean (in parentheses; current year not included).
Aver
age
=La
te+-E
arly
NN
o H
atch
2013
R
LKI
Hat
chin
gC
hron
olog
y
St.
Pau
l (19
Jul
)
St.
Geo
rge
(16
Jul)
Bul
dir (
11 J
ul)
-=
0
-25
-1301325
7580
8590
9500
0510
-25
-1301325
7580
8590
9500
0510
0
-25
-1301325
7580
8590
9500
0510

26
Figure 15. Productivity of red-legged kittiwakes (chicks fledged/nest) at Alaskan sites. Lack of bars indicates that no data were gathered in those years. Blue line is the mean productivity at the site (in parentheses; current year not included). Color of symbol indicates how current year’s success compared to the site mean (red is >20% below, black is within 20% and green is >20% above site mean).
N
0.76
- 1.
00
0.51
- 0.
75
0.26
- 0.
50
0.01
- 0.
25
<0.0
1
2013
RLK
IPr
oduc
tivity
St. P
aul (
0.25
)
St. G
eorg
e (0
.24)
Buld
ir (0
.19)
00
00
0.00.25.50.75
7580
8590
9500
0510
00
.00
.25
.50
.75
7580
8590
9500
0510
0.00.25.50.75
7580
8590
9500
0510

27
Figure 16. Trends in populations of red-legged kittiwakes at Alaskan sites. Error bars (90% confidence intervals) are shown for years with multiple counts. Percent per annum (p.a.) changes are indicated for all years and for just the last decade (2004-2013, in parentheses).
Year1975 1980 1985 1990 1995 2000 2005 2010
Per
cent
of
Max
imum
(18
0 bi
rds)
0
100
Red-legged kittiwake, St. Paul I.-4.4% p.a. (-6.2% p.a.)
Year1975 1980 1985 1990 1995 2000 2005 2010
Per
cent
of
Max
imum
(44
84 b
irds
)
0
100
Red-legged kittiwake, St. George I.+0.5% p.a. (+0.9% p.a.)
Year1975 1980 1985 1990 1995 2000 2005 2010
0
100
Per
cent
of
Max
imum
(10
95 n
ests
)
Red-legged kittiwake, Buldir I.+2.3% p.a. (+7.5% p.a.)

28
Glaucous-winged gull (Larus glaucescens)
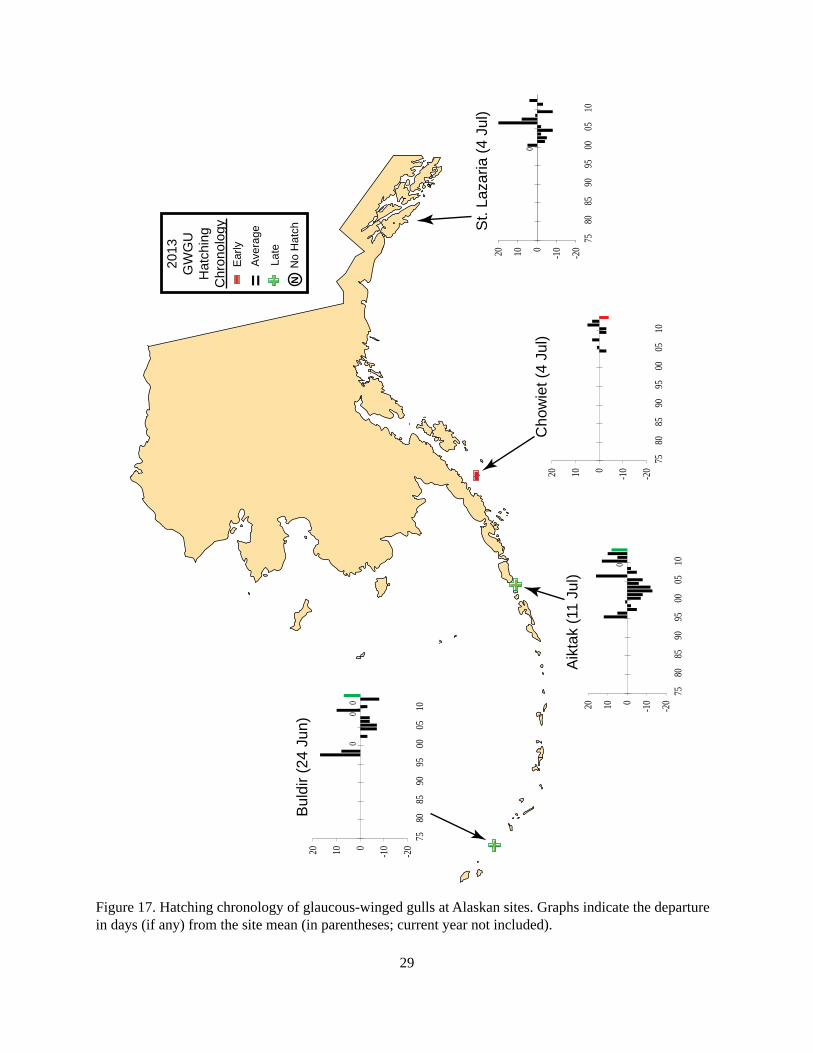
Table 13. Hatching chronology of glaucous-winged gulls at Alaskan sites monitored in 2013. Long-term Site Mean Average ReferenceBuldir I. 1 Jul (5)a 24 Jun (13)a Kohley and Herman 2014Aiktak I. 19 Jul (5) 11 Julb (18) Howie et al. 2014Chowiet I. 30 Jun (30) 4 Julb (7) Henschen et al. 2013aSample size in parentheses represents the number of nest sites used to calculate the mean hatch date and the number of years used to calculate the long-term average. Current year not included in long-term average.
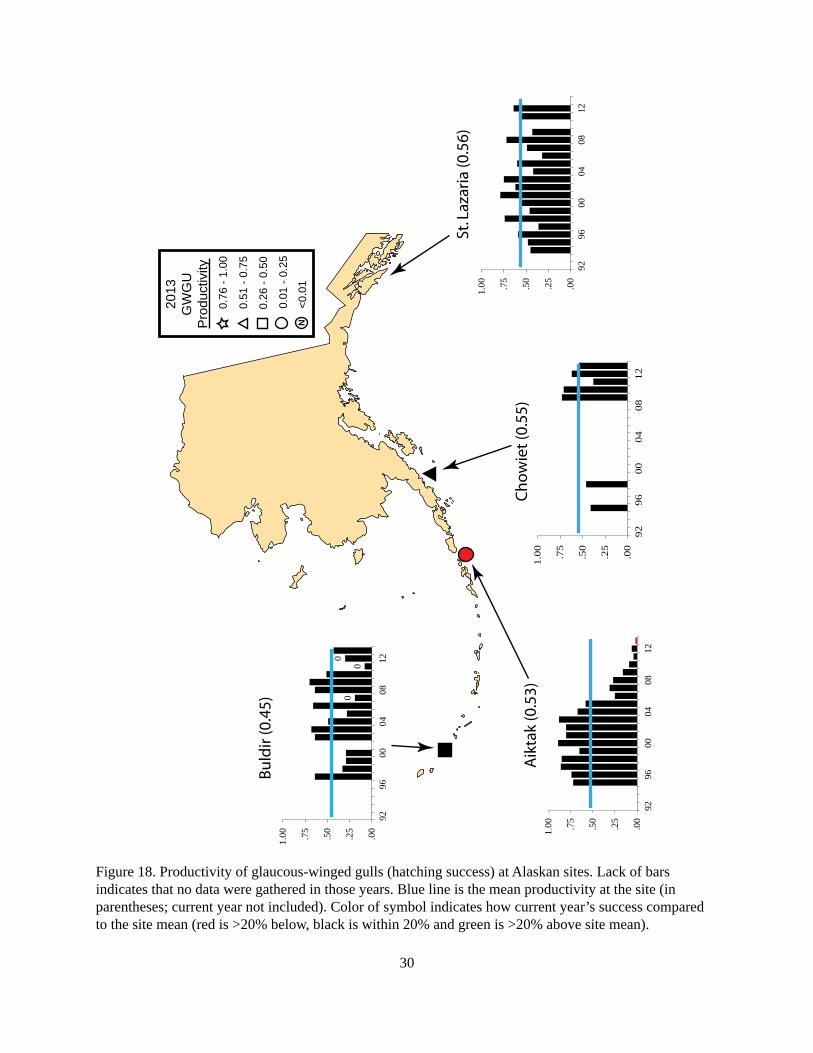
Table 14. Reproductive performance of glaucous-winged gulls at Alaskan sites monitored in 2013. Hatching No. of Long-term Site Successa Plots Average ReferenceBuldir I. 0.43 NAb (45)c 0.45 (15)c Kohley and Herman 2014Aiktak I. 0.02 4 (327) 0.53 (18) Howie et al. 2014Chowiet I. 0.54 3 (81) 0.55 (6) Henschen et al. 2013aTotal chicks/Total eggs.bNot applicable or not reported.cSample size in parentheses represents the number of eggs used to calculate hatching success and the number of years used to calculate the long-term average. Current year not used in long-term average.
29
Figure 17. Hatching chronology of glaucous-winged gulls at Alaskan sites. Graphs indicate the departure in days (if any) from the site mean (in parentheses; current year not included).
Aver
age
=La
te+-E
arly
NN
o H
atch
2013
GW
GU
Hat
chin
gC
hron
olog
y
Aik
tak
(11
Jul)
St.
Laza
ria (4
Jul
)
Cho
wie
t (4
Jul)
+
Bul
dir (
24 J
un)
+-
00
0
-20
-1001020
7580
8590
9500
0510
0
-20
-1001020
7580
8590
9500
0510
-20
-1001020
7580
8590
9500
0510
0
-20
-1001020
7580
8590
9500
0510
30
Figure 18. Productivity of glaucous-winged gulls (hatching success) at Alaskan sites. Lack of bars indicates that no data were gathered in those years. Blue line is the mean productivity at the site (in parentheses; current year not included). Color of symbol indicates how current year’s success compared to the site mean (red is >20% below, black is within 20% and green is >20% above site mean).
N
0.76
- 1.
00
0.51
- 0.
75
0.26
- 0.
50
0.01
- 0.
25
<0.0
1
2013
GW
GU
Pro
duct
ivity
Bu
ldir
(0.4
5)
Aik
tak
(0.5
3)C
ho
wie
t (0
.55)
St. L
azar
ia (0
.56)
00
0
.00
.25
.50
.75
1.00
9296
0004
0812
.00
.25
.50
.75
1.00
9296
0004
0812
.00
.25
.50
.75
1.00
9296
0004
0812
.00
.25
.50
.75
1.00
9296
0004
0812
31
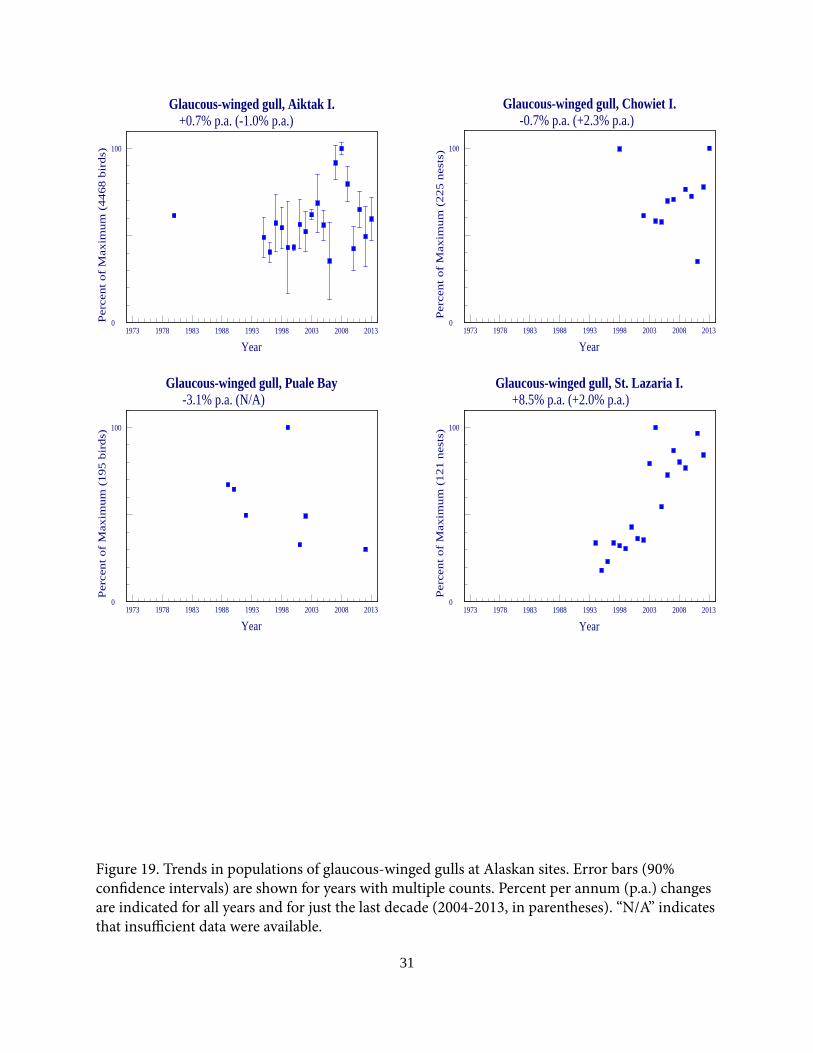
Figure 19. Trends in populations of glaucous-winged gulls at Alaskan sites. Error bars (90% confidence intervals) are shown for years with multiple counts. Percent per annum (p.a.) changes are indicated for all years and for just the last decade (2004-2013, in parentheses). “N/A” indicates that insufficient data were available.
Year1973 1978 1983 1988 1993 1998 2003 2008 2013
0
100
Per
cent
of
Max
imum
(44
68 b
irds
)Glaucous-winged gull, Aiktak I. +0.7% p.a. (-1.0% p.a.)
Year1973 1978 1983 1988 1993 1998 2003 2008 2013
0
Per
cent
of
Max
imum
(22
5 ne
sts)
100
Glaucous-winged gull, Chowiet I. -0.7% p.a. (+2.3% p.a.)
Year1973 1978 1983 1988 1993 1998 2003 2008 2013
0
Per
cent
of
Max
imum
(19
5 bi
rds)
100
Glaucous-winged gull, Puale Bay -3.1% p.a. (N/A)
Year1973 1978 1983 1988 1993 1998 2003 2008 2013
Per
cent
of
Max
imum
(12
1 ne
sts)
0
100
Glaucous-winged gull, St. Lazaria I. +8.5% p.a. (+2.0% p.a.)
32
Common murre (Uria aalge)
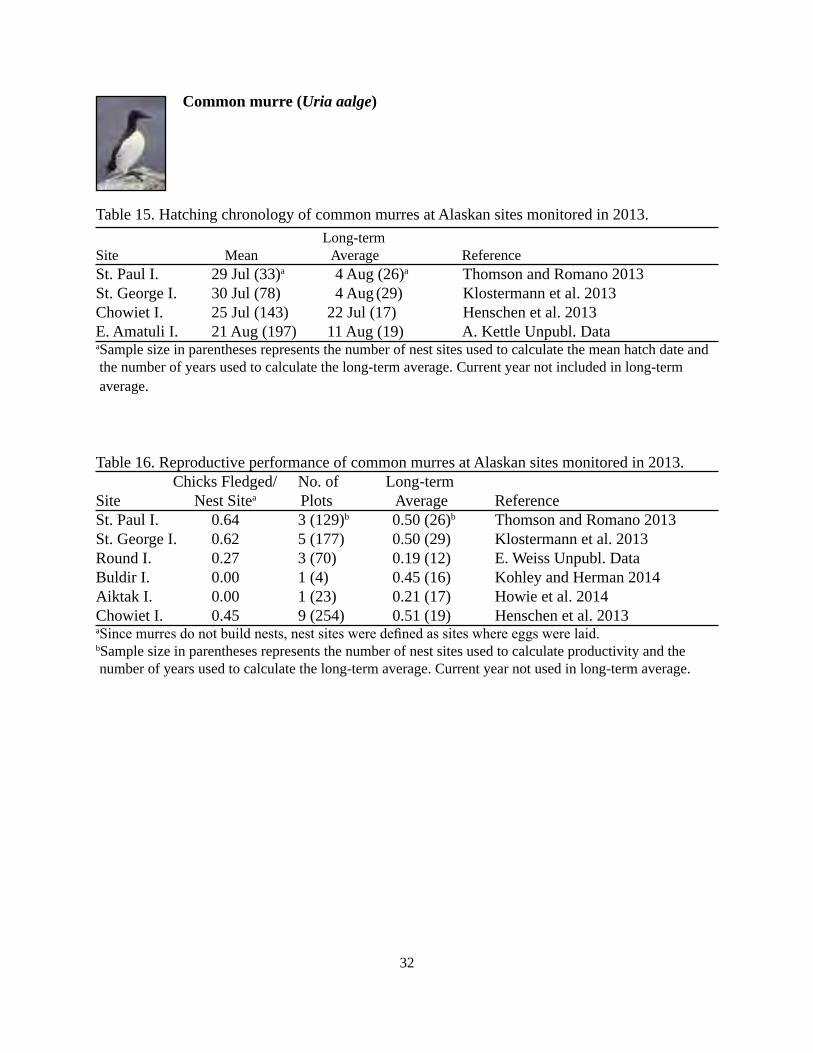
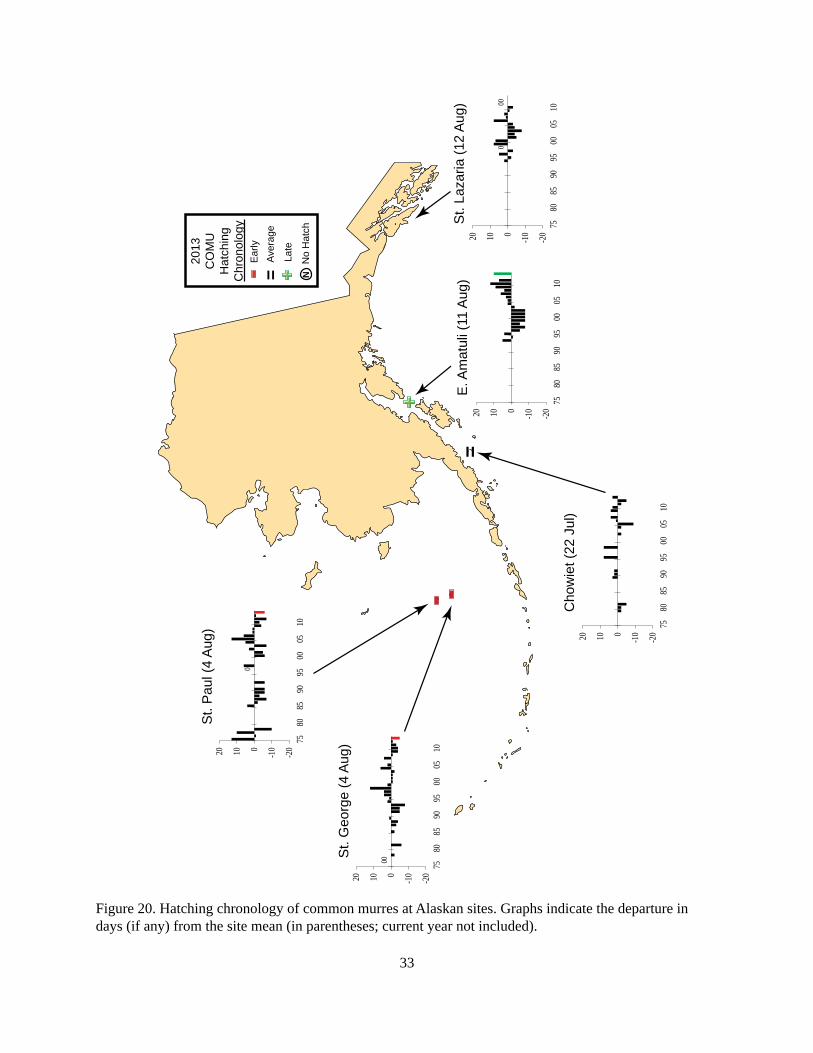
Table 15. Hatching chronology of common murres at Alaskan sites monitored in 2013. Long-term Site Mean Average ReferenceSt. Paul I. 29 Jul (33)a 4 Aug (26)a Thomson and Romano 2013St. George I. 30 Jul (78) 4 Aug (29) Klostermann et al. 2013Chowiet I. 25 Jul (143) 22 Jul (17) Henschen et al. 2013E. Amatuli I. 21 Aug (197) 11 Aug (19) A. Kettle Unpubl. DataaSample size in parentheses represents the number of nest sites used to calculate the mean hatch date and the number of years used to calculate the long-term average. Current year not included in long-term average.
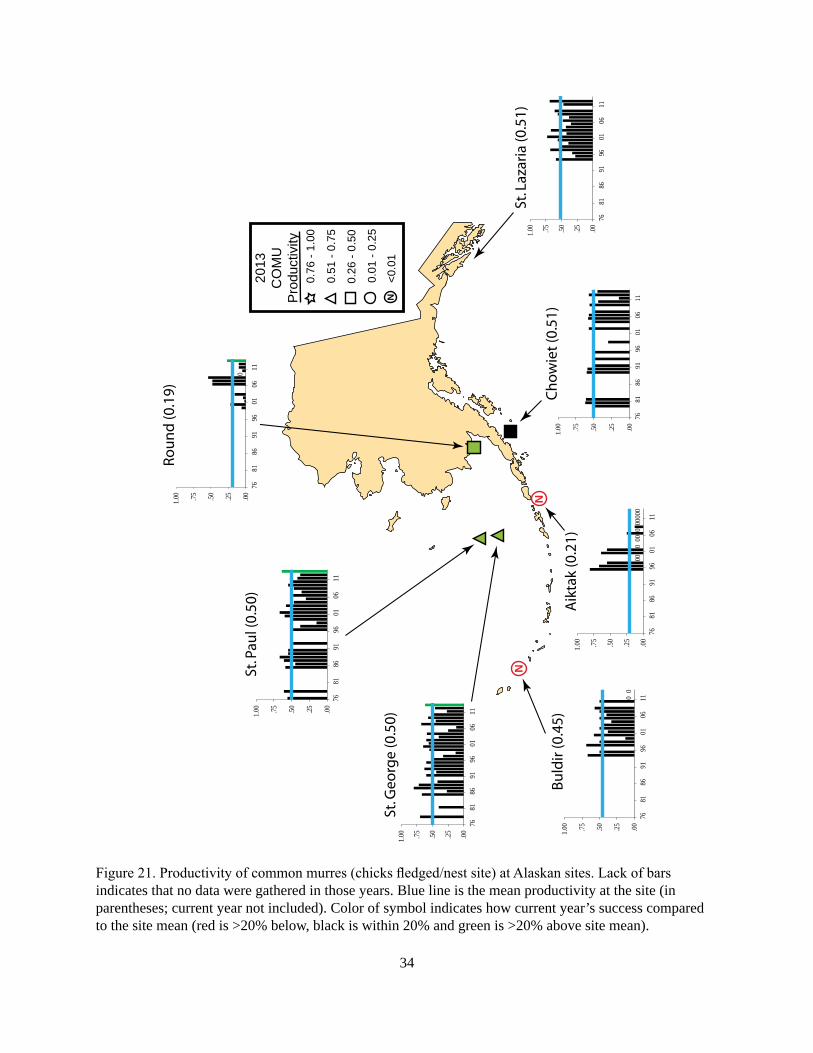
Table 16. Reproductive performance of common murres at Alaskan sites monitored in 2013. Chicks Fledged/ No. of Long-term Site Nest Sitea Plots Average ReferenceSt. Paul I. 0.64 3 (129)b 0.50 (26)b Thomson and Romano 2013St. George I. 0.62 5 (177) 0.50 (29) Klostermann et al. 2013Round I. 0.27 3 (70) 0.19 (12) E. Weiss Unpubl. DataBuldir I. 0.00 1 (4) 0.45 (16) Kohley and Herman 2014Aiktak I. 0.00 1 (23) 0.21 (17) Howie et al. 2014Chowiet I. 0.45 9 (254) 0.51 (19) Henschen et al. 2013aSince murres do not build nests, nest sites were defined as sites where eggs were laid.bSample size in parentheses represents the number of nest sites used to calculate productivity and the number of years used to calculate the long-term average. Current year not used in long-term average.
33
Figure 20. Hatching chronology of common murres at Alaskan sites. Graphs indicate the departure in days (if any) from the site mean (in parentheses; current year not included).
Aver
age
=La
te+-E
arly
NN
o H
atch
2013
CO
MU
Hat
chin
gC
hron
olog
y
St.
Pau
l (4
Aug
)
St.
Geo
rge
(4 A
ug)
Cho
wie
t (22
Jul
)
E. A
mat
uli (
11 A
ug)
St.
Laza
ria (1
2 A
ug)
-=
-+
0
-20
-1001020
7580
8590
9500
0510
00
-20
-1001020
7580
8590
9500
0510
-20
-1001020
7580
8590
9500
0510
-20
-1001020
7580
8590
9500
0510
000
-20
-1001020
7580
8590
9500
0510
34
Figure 21. Productivity of common murres (chicks fledged/nest site) at Alaskan sites. Lack of bars indicates that no data were gathered in those years. Blue line is the mean productivity at the site (in parentheses; current year not included). Color of symbol indicates how current year’s success compared to the site mean (red is >20% below, black is within 20% and green is >20% above site mean).
N
0.76
- 1.
00
0.51
- 0.
75
0.26
- 0.
50
0.01
- 0.
25
<0.0
1
2013
CO
MU
Pro
duct
ivity
St. P
aul (
0.50
)
St. G
eorg
e (0
.50)
Ro
un
d (0
.19)
Bu
ldir
(0.4
5)A
ikta
k (0
.21)
Ch
ow
iet
(0.5
1)
St. L
azar
ia (0
.51)
N
N
.00.25.50.751.00
7681
8691
9601
0611
.00
.25
.50
.75
1.00
7681
8691
9601
0611
0.0
0
.25
.50
.75
1.00
7681
8691
9601
0611
00
.00
.25
.50
.75
1.00
7681
8691
9601
0611
000
000
0000
0.0
0
.25
.50
.75
1.00
7681
8691
9601
0611
.00
.25
.50
.75
1.00
7681
8691
9601
0611
.00.25.50.751.00
7681
8691
9601
0611
35
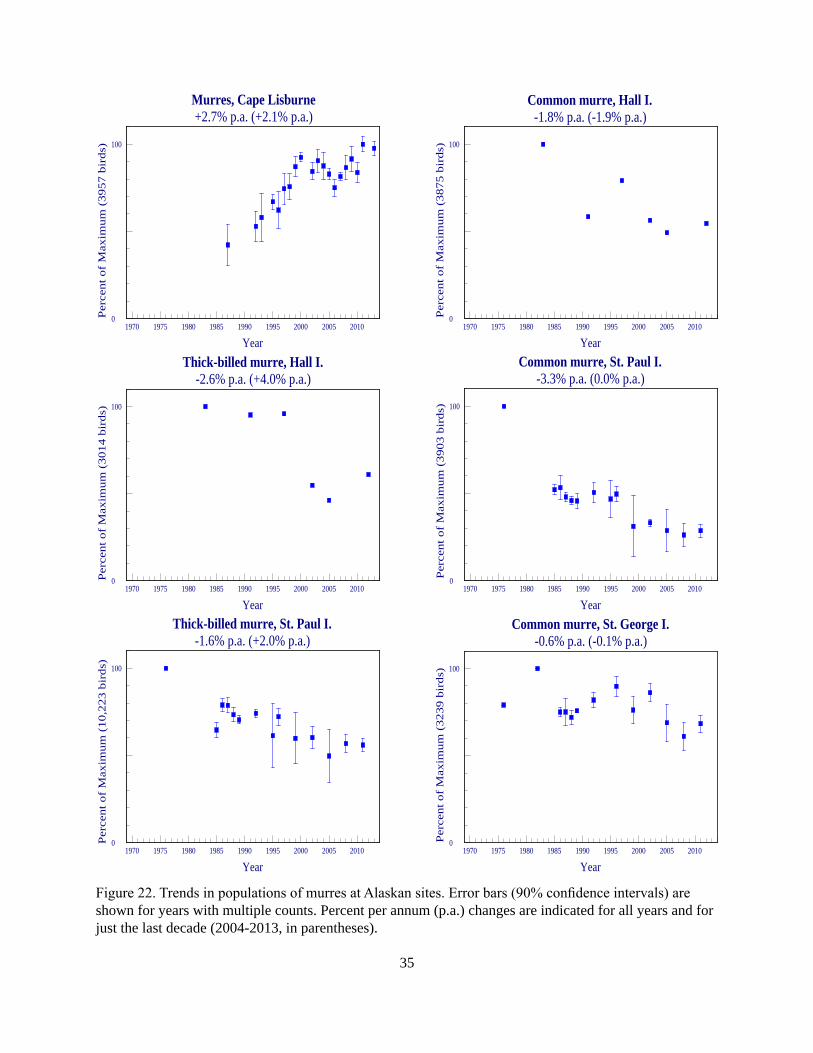
Figure 22. Trends in populations of murres at Alaskan sites. Error bars (90% confidence intervals) are shown for years with multiple counts. Percent per annum (p.a.) changes are indicated for all years and for just the last decade (2004-2013, in parentheses).
Year1970 1975 1980 1985 1990 1995 2000 2005 2010
Per
cent
of
Max
imum
(39
57 b
irds
)
0
100
Murres, Cape Lisburne+2.7% p.a. (+2.1% p.a.)
Year1970 1975 1980 1985 1990 1995 2000 2005 2010
Per
cent
of
Max
imum
(38
75 b
irds
)
0
100
Common murre, Hall I.-1.8% p.a. (-1.9% p.a.)
Year1970 1975 1980 1985 1990 1995 2000 2005 2010
Per
cent
of
Max
imum
(30
14 b
irds
)
0
100
Thick-billed murre, Hall I.-2.6% p.a. (+4.0% p.a.)
Year1970 1975 1980 1985 1990 1995 2000 2005 2010
Per
cent
of
Max
imum
(39
03 b
irds
)
0
100
Common murre, St. Paul I.-3.3% p.a. (0.0% p.a.)
Year1970 1975 1980 1985 1990 1995 2000 2005 2010
Per
cent
of
Max
imum
(10
,223
bir
ds)
0
100
Thick-billed murre, St. Paul I.-1.6% p.a. (+2.0% p.a.)
Year1970 1975 1980 1985 1990 1995 2000 2005 2010
Per
cent
of
Max
imum
(32
39 b
irds
)
0
100
Common murre, St. George I.-0.6% p.a. (-0.1% p.a.)

36
Figure 22 (continued). Trends in populations of murres at Alaskan sites. Error bars (90% confidence intervals) are shown for years with multiple counts. Percent per annum (p.a.) changes are indicated for all years and for just the last decade (2004-2013, in parentheses).
Year1970 1975 1980 1985 1990 1995 2000 2005 2010
Per
cent
of
Max
imum
(23
,596
bir
ds)
0
100
Thick-billed murre, St. George I.+0.5% p.a. (+0.2% p.a.)
Year1970 1975 1980 1985 1990 1995 2000 2005 2010
Per
cent
of
Max
imum
(44
90 b
irds
)
0
100
Common murre, Cape Peirce-1.5% p.a. (+0.6% p.a.)
Year1970 1975 1980 1985 1990 1995 2000 2005 2010
Per
cent
of
Max
imum
(14
32 b
irds
)
0
100
Common murre, Round I.+0.6% p.a. (-0.4% p.a.)
Year1970 1975 1980 1985 1990 1995 2000 2005 2010
0Per
cent
of
Max
imum
(32
03 b
irds
) 100
Murres, Buldir I.+8.6% p.a. (+4.8% p.a.)
Year1970 1975 1980 1985 1990 1995 2000 2005 2010
0Per
cent
of
Max
imum
(37
71 b
irds
) 100
Murres, Ulak I.+2.0% p.a. (-2.7% p.a.)
Year1970 1975 1980 1985 1990 1995 2000 2005 2010
0Per
cent
of
Max
imum
(57
32 b
irds
) 100
Murres, Koniuji I.+7.1% p.a. (+6.5% p.a.)
37
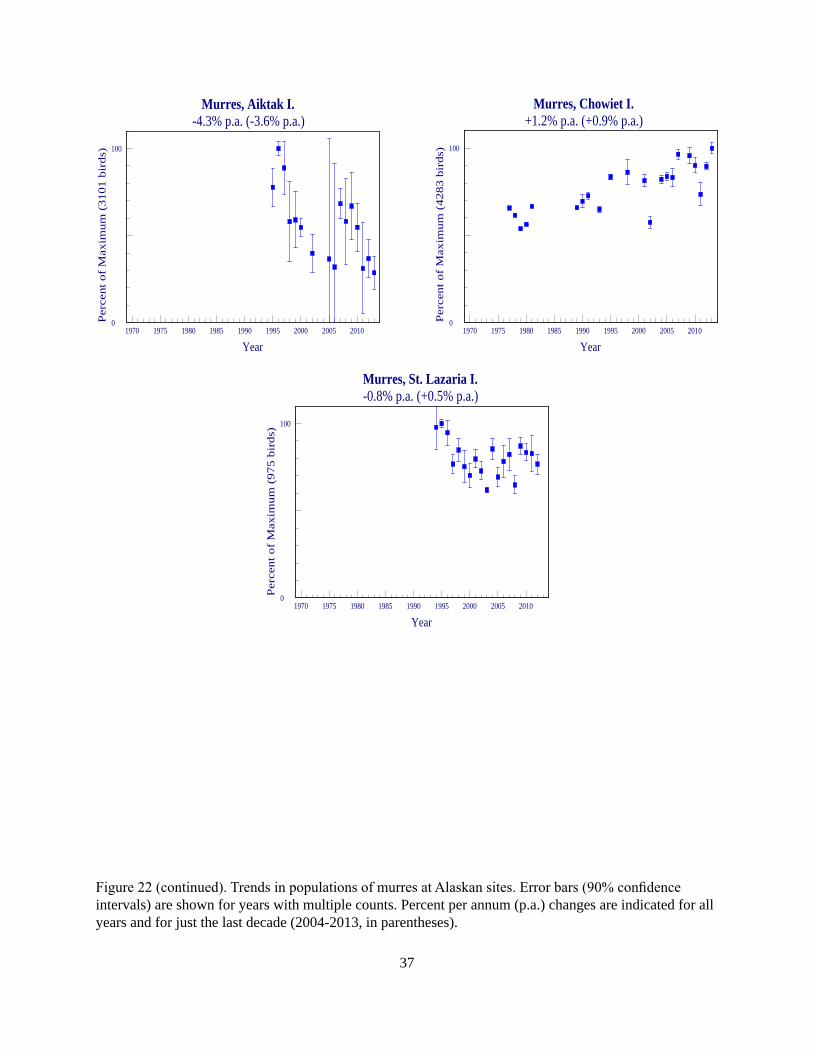
Figure 22 (continued). Trends in populations of murres at Alaskan sites. Error bars (90% confidence intervals) are shown for years with multiple counts. Percent per annum (p.a.) changes are indicated for all years and for just the last decade (2004-2013, in parentheses).
Year1970 1975 1980 1985 1990 1995 2000 2005 2010
0Per
cent
of
Max
imum
(31
01 b
irds
) 100
Murres, Aiktak I.-4.3% p.a. (-3.6% p.a.)
Year1970 1975 1980 1985 1990 1995 2000 2005 2010
Per
cent
of
Max
imum
(42
83 b
irds
)
0
100
Murres, Chowiet I.+1.2% p.a. (+0.9% p.a.)
Year1970 1975 1980 1985 1990 1995 2000 2005 2010
Per
cent
of
Max
imum
(97
5 bi
rds)
0
100
Murres, St. Lazaria I.-0.8% p.a. (+0.5% p.a.)
38
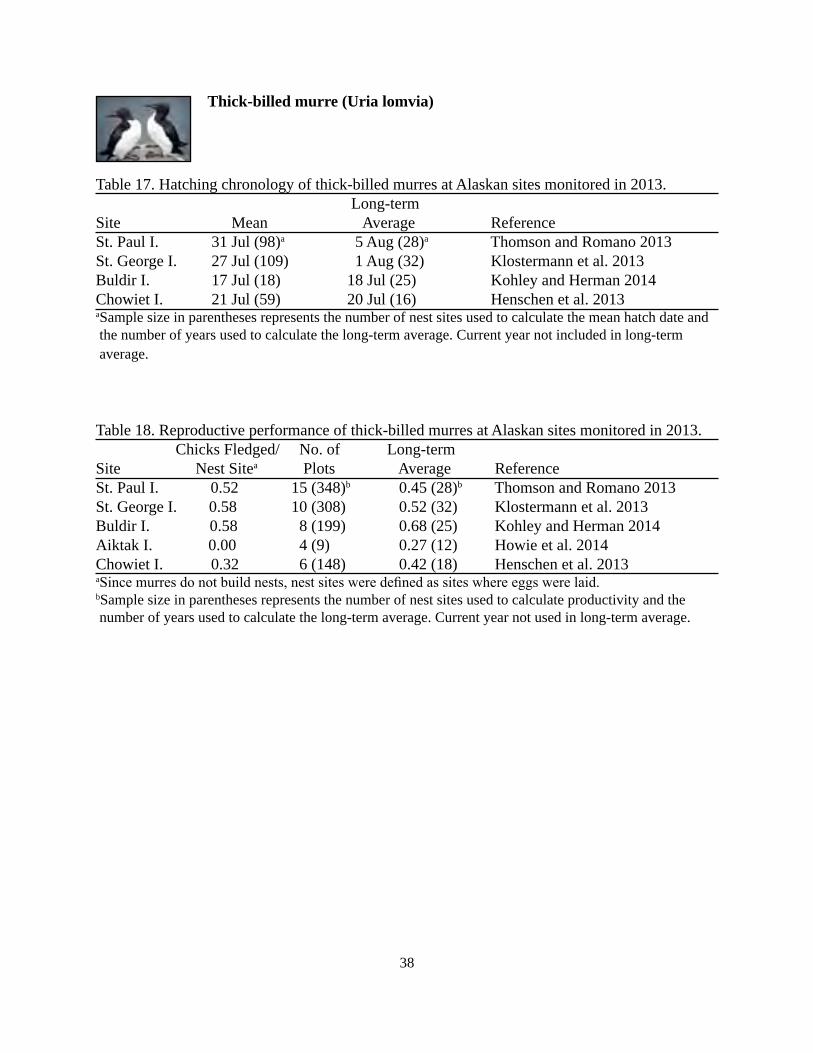
Thick-billed murre (Uria lomvia)
Table 17. Hatching chronology of thick-billed murres at Alaskan sites monitored in 2013. Long-termSite Mean Average ReferenceSt. Paul I. 31 Jul (98)a 5 Aug (28)a Thomson and Romano 2013St. George I. 27 Jul (109) 1 Aug (32) Klostermann et al. 2013Buldir I. 17 Jul (18) 18 Jul (25) Kohley and Herman 2014Chowiet I. 21 Jul (59) 20 Jul (16) Henschen et al. 2013aSample size in parentheses represents the number of nest sites used to calculate the mean hatch date and the number of years used to calculate the long-term average. Current year not included in long-term average.
Table 18. Reproductive performance of thick-billed murres at Alaskan sites monitored in 2013. Chicks Fledged/ No. of Long-termSite Nest Sitea Plots Average ReferenceSt. Paul I. 0.52 15 (348)b 0.45 (28)b Thomson and Romano 2013St. George I. 0.58 10 (308) 0.52 (32) Klostermann et al. 2013Buldir I. 0.58 8 (199) 0.68 (25) Kohley and Herman 2014Aiktak I. 0.00 4 (9) 0.27 (12) Howie et al. 2014Chowiet I. 0.32 6 (148) 0.42 (18) Henschen et al. 2013aSince murres do not build nests, nest sites were defined as sites where eggs were laid.bSample size in parentheses represents the number of nest sites used to calculate productivity and the number of years used to calculate the long-term average. Current year not used in long-term average.
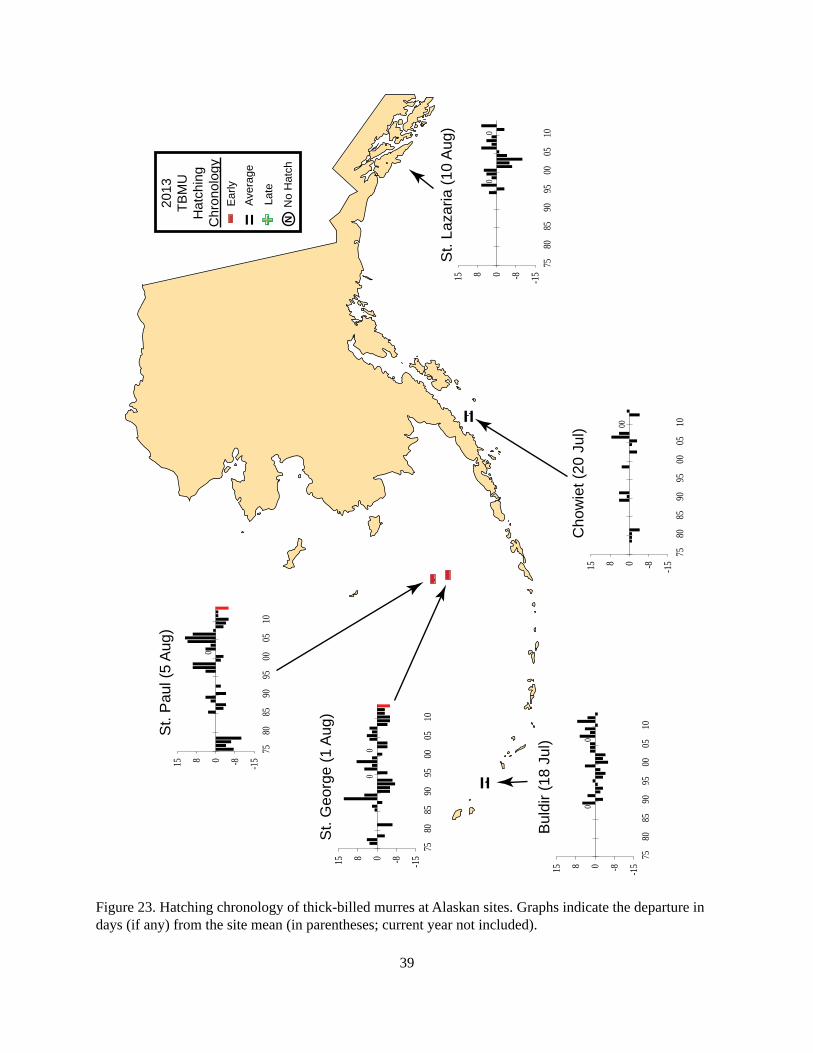
39
Figure 23. Hatching chronology of thick-billed murres at Alaskan sites. Graphs indicate the departure in days (if any) from the site mean (in parentheses; current year not included).
Aver
age
=La
te+-E
arly
NN
o H
atch
2013
TBM
UH
atch
ing
Chr
onol
ogy
St.
Pau
l (5
Aug
)
St.
Geo
rge
(1 A
ug)
Bul
dir (
18 J
ul)
Cho
wie
t (20
Jul
)
St.
Laza
ria (1
0 A
ug)
==
- -
0
-15-80815
7580
8590
9500
0510
00
-15-80815
7580
8590
9500
0510
00
-15-80815
7580
8590
9500
0510
00
-15-80815
7580
8590
9500
0510
00
-15-80815
7580
8590
9500
0510
40
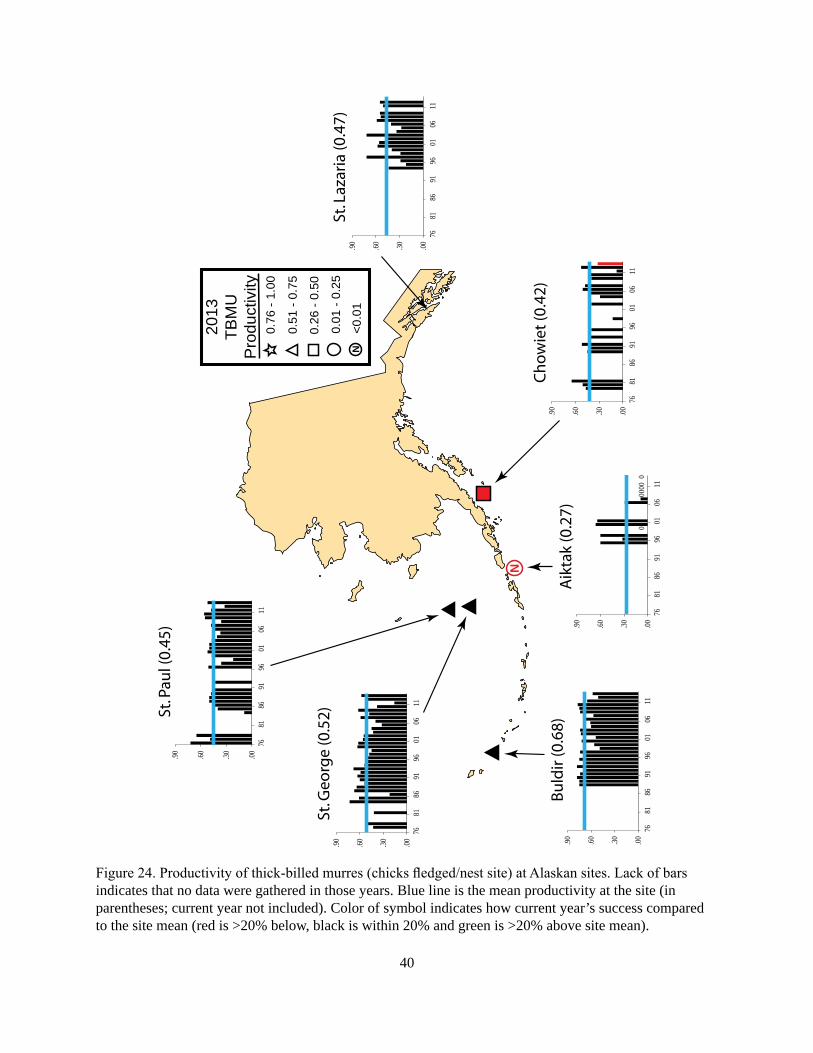
Figure 24. Productivity of thick-billed murres (chicks fledged/nest site) at Alaskan sites. Lack of bars indicates that no data were gathered in those years. Blue line is the mean productivity at the site (in parentheses; current year not included). Color of symbol indicates how current year’s success compared to the site mean (red is >20% below, black is within 20% and green is >20% above site mean).
N
0.76
- 1.
00
0.51
- 0.
75
0.26
- 0.
50
0.01
- 0.
25
<0.0
1
2013
TBM
UP
rodu
ctiv
ity
St. P
aul (
0.45
)
St. G
eorg
e (0
.52)
Bu
ldir
(0.6
8)A
ikta
k (0
.27)
Ch
ow
iet
(0.4
2)
St. L
azar
ia (0
.47)
N
.00.30.60.90
7681
8691
9601
0611
.00.30.60.90
7681
8691
9601
0611
.00.30.60.90
7681
8691
9601
0611
000
000
.00.30.60.90
7681
8691
9601
0611
.00.30.60.90
7681
8691
9601
0611
.00.30.60.90
7681
8691
9601
0611
41
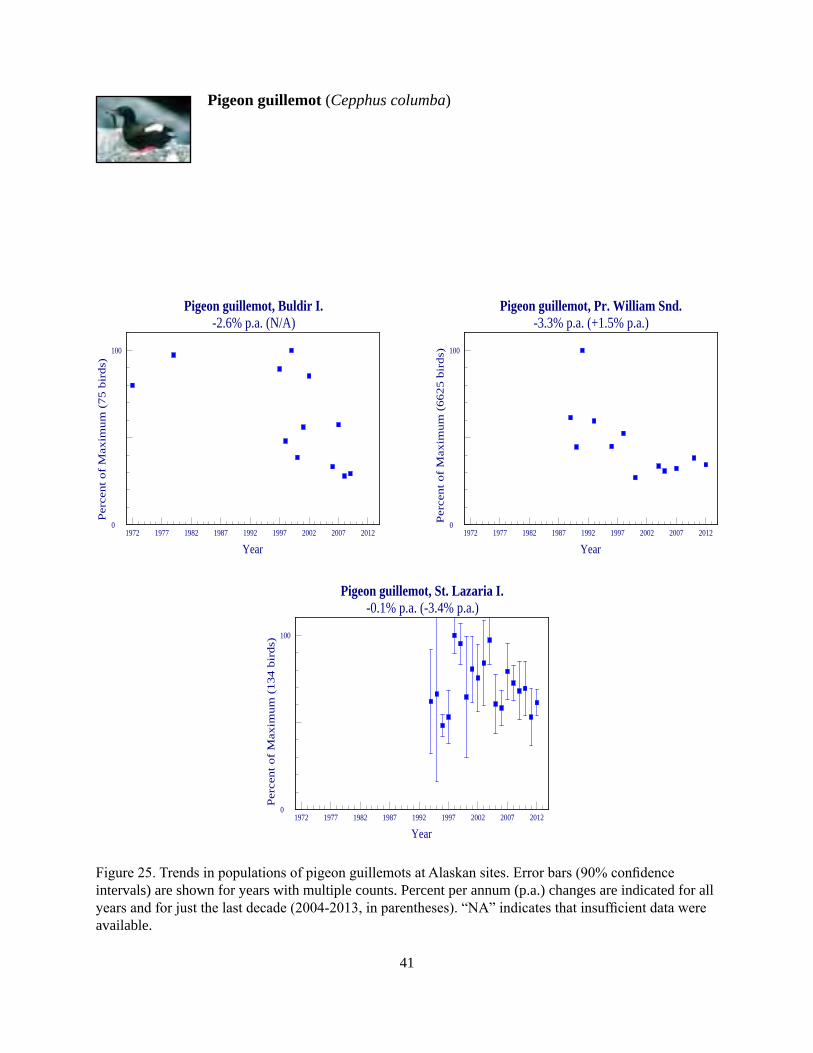
Pigeon guillemot (Cepphus columba)
Figure 25. Trends in populations of pigeon guillemots at Alaskan sites. Error bars (90% confidence intervals) are shown for years with multiple counts. Percent per annum (p.a.) changes are indicated for all years and for just the last decade (2004-2013, in parentheses). “NA” indicates that insufficient data were available.
Year1972 1977 1982 1987 1992 1997 2002 2007 2012
0
100
Per
cent
of
Max
imum
(75
bir
ds)
Pigeon guillemot, Buldir I.-2.6% p.a. (N/A)
Year1972 1977 1982 1987 1992 1997 2002 2007 2012
Per
cent
of
Max
imum
(66
25 b
irds
)
0
100
Pigeon guillemot, Pr. William Snd.-3.3% p.a. (+1.5% p.a.)
Year1972 1977 1982 1987 1992 1997 2002 2007 2012
Per
cent
of
Max
imum
(13
4 bi
rds)
0
100
Pigeon guillemot, St. Lazaria I.-0.1% p.a. (-3.4% p.a.)
42
Ancient murrelet (Synthliboramphus antiquus)
Table 19. Hatching chronology of ancient murrelets at Alaskan sites monitored in 2013. Long-term Site Mean Average ReferenceAiktak I. 30 Jun (36)a 4 Jul (16)a Howie et al. 2014aSample size in parentheses represents the number of nest sites used to calculate the mean hatch date and the number of years used to calculate the long-term average. Current year not included in long-term average.
Table 20. Reproductive performance of ancient murrelets at Alaskan sites monitored in 2013. Chicks No. of Long-term Site Fledged/Egga Plots Average ReferenceAiktak I. 0.77 NAb (202)c 0.78 (16)c Howie et al. 2014aTotal chicks fledged/Total eggs.bNot applicable or not reported.cSample size in parentheses represents the number of eggs used to calculate productivity and the number of years used to calculate the long-term average. Current year not used in long-term average.
43
Parakeet auklet (Aethia psittacula)
Table 21. Hatching chronology of parakeet auklets at Alaskan sites monitored in 2013. Long-term Site Mean Average ReferenceBuldir I. 3 Jul (12)a 4 Jul (21)a Kohley and Herman 2014Chowiet I. 1 Jul (13) 5 Jul (8) Henschen et al. 2013aSample size in parentheses represents the number of nest sites used to calculate the mean hatch date and the number of years used to calculate the long-term average. Current year not included in long-term average.
Table 22. Reproductive performance of parakeet auklets at Alaskan sites monitored in 2013. Chicks Fledged/ No. of Long-term Site Nest Sitea Plots Average ReferenceBuldir I. 0.36 NAb (50)c 0.54 (21)c Kohley and Herman 2014Chowiet I. 0.33 NA (55) 0.37 (8) Henschen et al. 2013aNest site is defined as a site where an egg was laid.bNot applicable or not reported.cSample size in parentheses represents the number of nest sites used to calculate productivity and the number of years used to calculate the long-term average. Current year not used in long-term average.
44
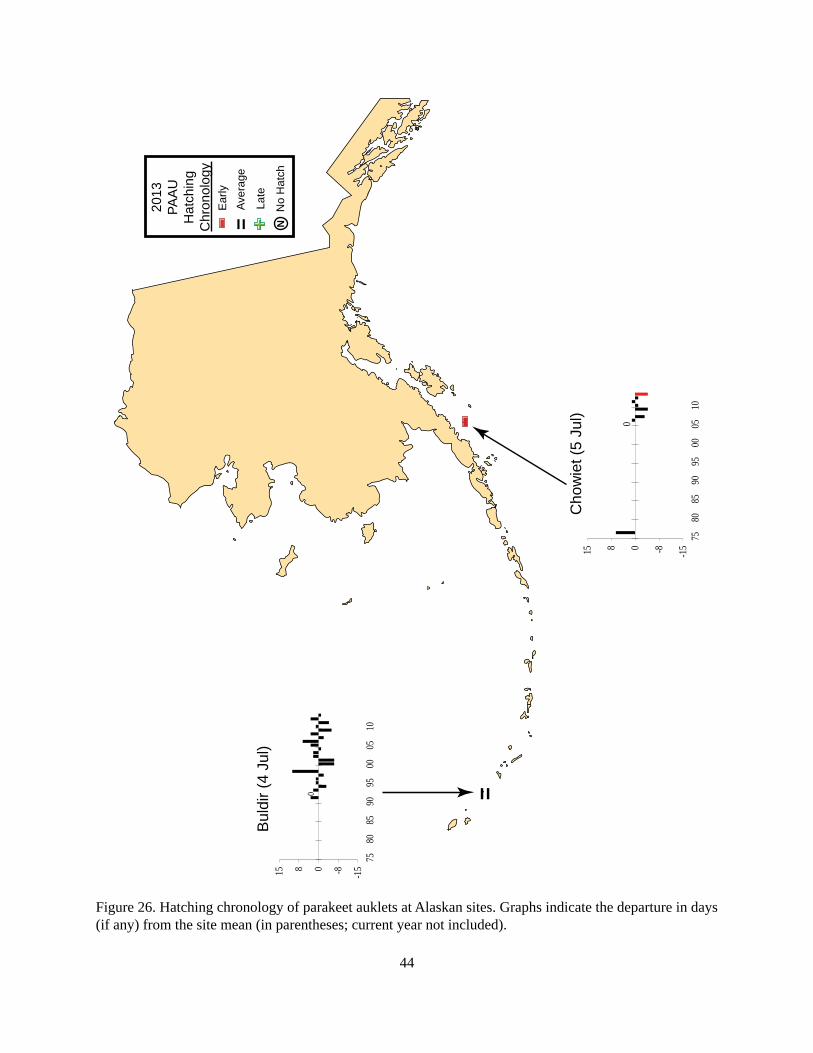
Figure 26. Hatching chronology of parakeet auklets at Alaskan sites. Graphs indicate the departure in days (if any) from the site mean (in parentheses; current year not included).
Aver
age
=La
te+-E
arly
NN
o H
atch
2013
PAAU
Hat
chin
gC
hron
olog
y
Buld
ir (4
Jul
)
Cho
wie
t (5
Jul)-
=
0
-15-80815
7580
8590
9500
0510
0
-15-80815
7580
8590
9500
0510

45
Figure 27. Productivity of parakeet auklets (chicks fledged/nest site) at Alaskan sites. Lack of bars indicates that no data were gathered in those years. Blue line is the mean productivity at the site (in parentheses; current year not included). Color of symbol indicates how current year’s success compared to the site mean (red is >20% below, black is within 20% and green is >20% above site mean).
N
0.76
- 1.
00
0.51
- 0.
75
0.26
- 0.
50
0.01
- 0.
25
<0.0
1
2013
PAA
UP
rodu
ctiv
ity
Bu
ldir
(0.5
4)
Ch
ow
iet
(0.3
7)
.00
.20
.40
.60
.80
1.00
9196
0106
11
0.0
0
.20
.40
.60
.80
1.00
9196
0106
11
46
Least auklet (Aethia pusilla)
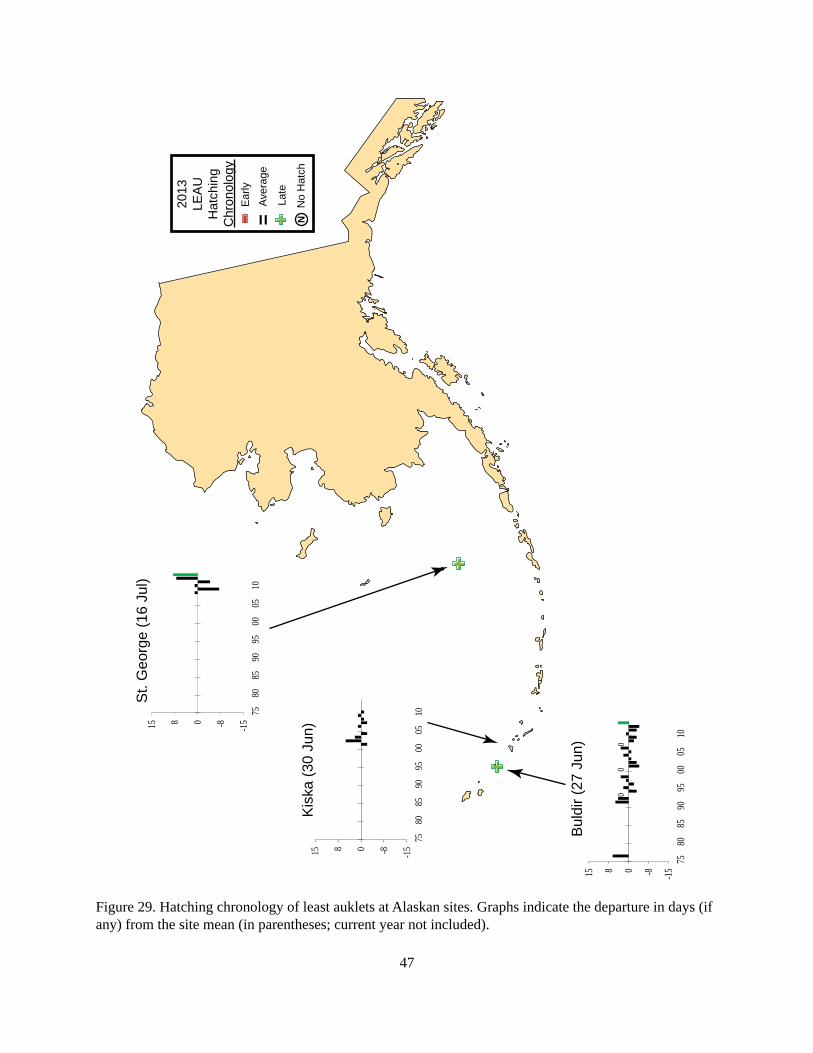
Table 23. Hatching chronology of least auklets at Alaskan sites monitored in 2013. Long-term Site Mean Average ReferenceSt. George I. 24 Jul (12)a 16 Jul (5)a Klostermann et al. 2013Buldir I. 1 Jul (26) 27 Jun (23) Kohley and Herman 2014aSample size in parentheses represents the number of nest sites used to calculate the mean hatch date and the number of years used to calculate the long-term average. Current year not included in long-term average.
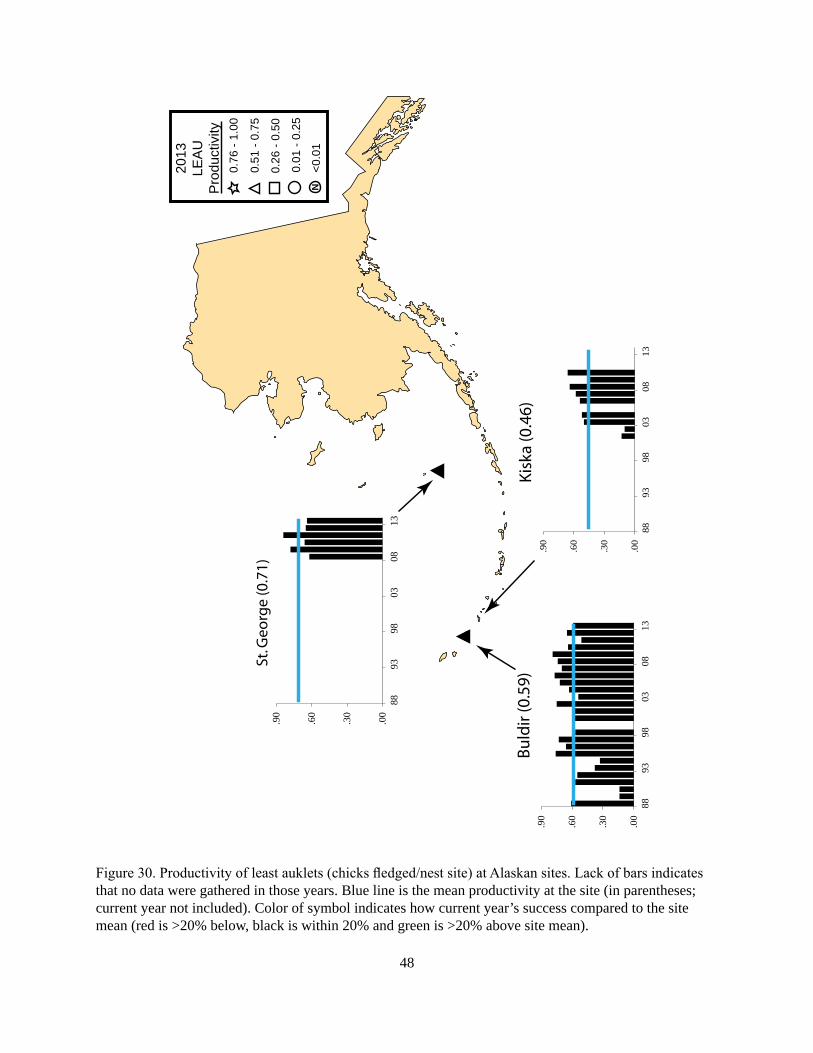
Table 24. Reproductive performance of least auklets at Alaskan sites monitored in 2013. Chicks Fledged/ No. of Long-termSite Nest Sitea Plots Average ReferenceSt. George I. 0.64 NAb (64)c 0.71 (5)c Klostermann et al. 2013Buldir I. 0.59 NA (76) 0.59 (24) Kohley and Herman 2014aNest site is defined as a site where an egg was laid.bNot applicable or not reported.cSample size in parentheses represents the number of nest sites used to calculate productivity and the number of years used to calculate the long-term average. Current year not used in long-term average.
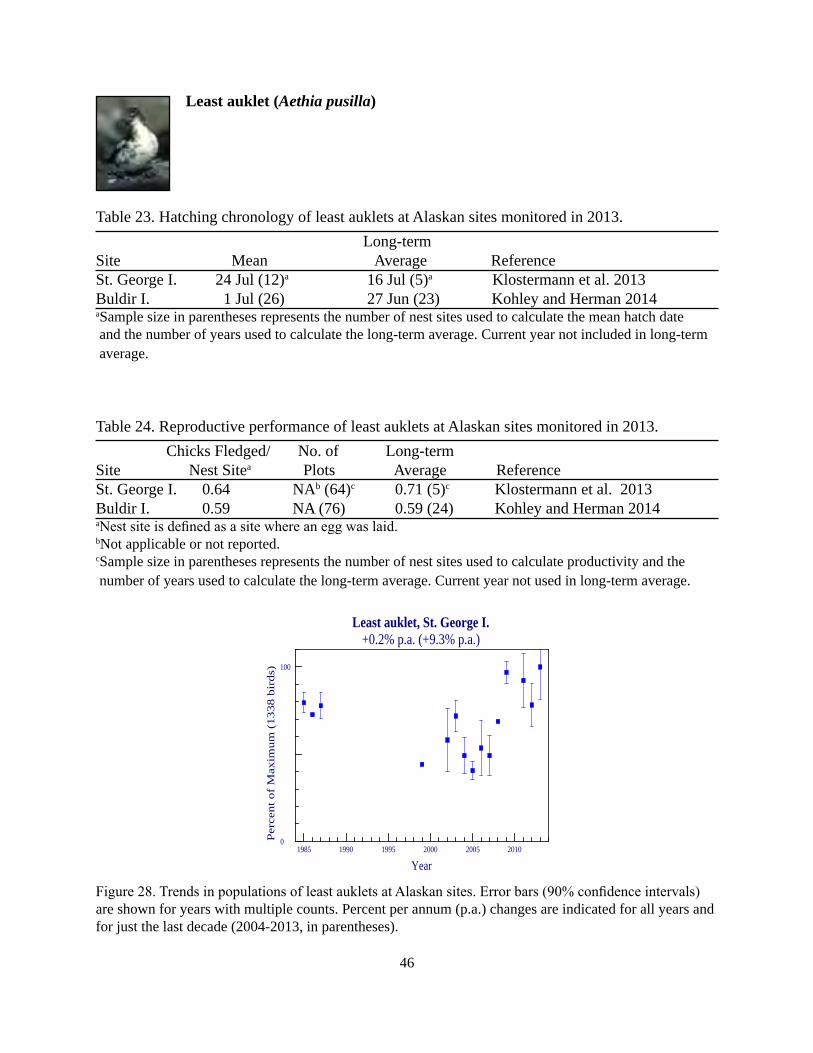
Figure 28. Trends in populations of least auklets at Alaskan sites. Error bars (90% confidence intervals) are shown for years with multiple counts. Percent per annum (p.a.) changes are indicated for all years and for just the last decade (2004-2013, in parentheses).
Year1985 1990 1995 2000 2005 2010
0Per
cent
of
Max
imum
(13
38 b
irds
) 100
Least auklet, St. George I.+0.2% p.a. (+9.3% p.a.)
47
Figure 29. Hatching chronology of least auklets at Alaskan sites. Graphs indicate the departure in days (if any) from the site mean (in parentheses; current year not included).
Aver
age
=La
te+-E
arly
NN
o H
atch
2013
LEAU
Hat
chin
gC
hron
olog
y
Buld
ir (2
7 Ju
n)
Kisk
a (3
0 Ju
n)
St. G
eorg
e (1
6 Ju
l)
+
+
-15-80815
7580
8590
9500
0510
00
0
-15-80815
7580
8590
9500
0510
-15-80815
7580
8590
9500
0510
48
Figure 30. Productivity of least auklets (chicks fledged/nest site) at Alaskan sites. Lack of bars indicates that no data were gathered in those years. Blue line is the mean productivity at the site (in parentheses; current year not included). Color of symbol indicates how current year’s success compared to the site mean (red is >20% below, black is within 20% and green is >20% above site mean).
N
0.76
- 1.
00
0.51
- 0.
75
0.26
- 0.
50
0.01
- 0.
25
<0.0
1
2013
LEA
UP
rodu
ctiv
ity
Bu
ldir
(0.5
9)K
iska
(0.4
6)
St. G
eorg
e (0
.71)
.00
.30
.60
.90
8893
9803
0813
.00
.30
.60
.90
8893
9803
0813
.00
.30
.60
.90
8893
9803
0813

49
Whiskered auklet (Aethia pygmaea)
Table 25. Hatching chronology of whiskered auklets at Alaskan sites monitored in 2013. Long-term Site Mean Average ReferenceBuldir I. 21 Jun (30)a 22 Jun (22)a Kohley and Herman 2014a Sample size in parentheses represents the number of nest sites used to calculate the mean hatch date and the number of years used to calculate the long-term average. Current year not included in long-term average.
Table 26. Reproductive performance of whiskered auklets at Alaskan sites monitored in 2013. Chicks Fledged/ No. of Long-term Site Nest Sitea Plots Average ReferenceBuldir I. 0.64 NAb (73)c 0.66 (22)c Kohley and Herman 2014aNest site is defined as a site where an egg was laid.bNot applicable or not reported.cSample size in parentheses represents the number of nest sites used to calculate productivity and the number of years used to calculate the long-term average. Current year not used in long-term average.
50
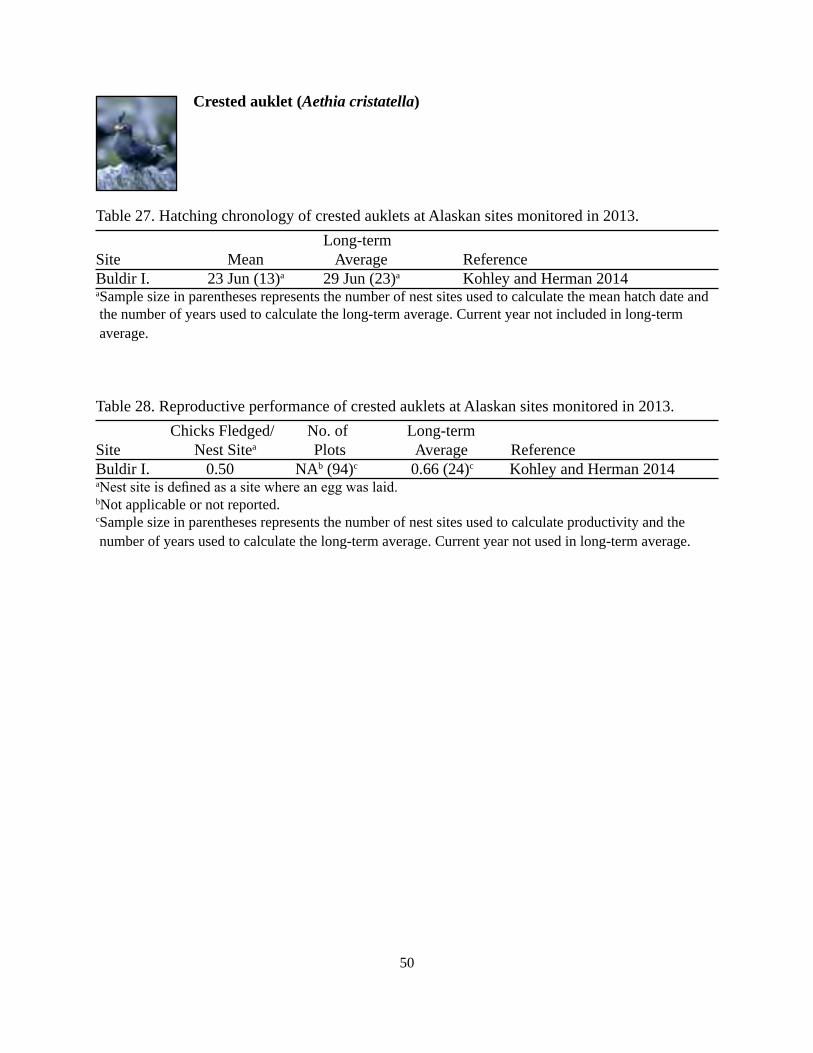
Crested auklet (Aethia cristatella)
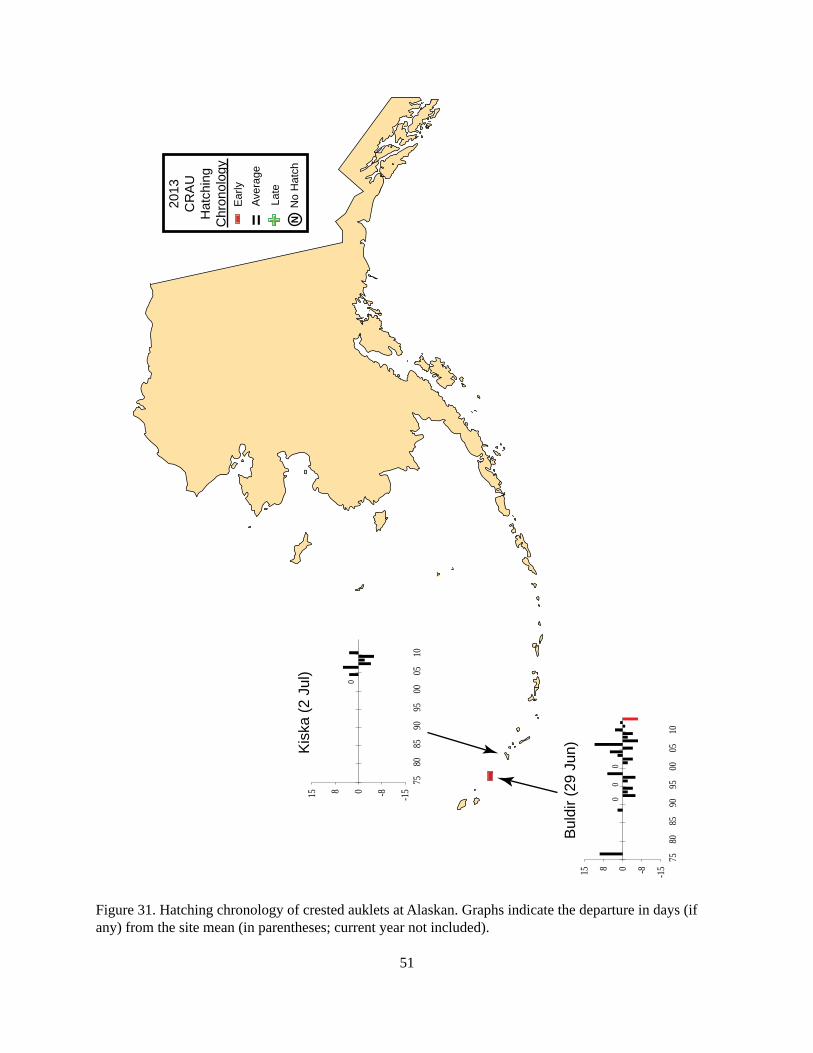
Table 27. Hatching chronology of crested auklets at Alaskan sites monitored in 2013. Long-termSite Mean Average ReferenceBuldir I. 23 Jun (13)a 29 Jun (23)a Kohley and Herman 2014aSample size in parentheses represents the number of nest sites used to calculate the mean hatch date and the number of years used to calculate the long-term average. Current year not included in long-term average.
Table 28. Reproductive performance of crested auklets at Alaskan sites monitored in 2013. Chicks Fledged/ No. of Long-termSite Nest Sitea Plots Average ReferenceBuldir I. 0.50 NAb (94)c 0.66 (24)c Kohley and Herman 2014aNest site is defined as a site where an egg was laid.bNot applicable or not reported.cSample size in parentheses represents the number of nest sites used to calculate productivity and the number of years used to calculate the long-term average. Current year not used in long-term average.
51
Figure 31. Hatching chronology of crested auklets at Alaskan. Graphs indicate the departure in days (if any) from the site mean (in parentheses; current year not included).
Aver
age
=La
te+-E
arly
NN
o H
atch
2013
CR
AUH
atch
ing
Chr
onol
ogy
Buld
ir (2
9 Ju
n)Kisk
a (2
Jul
)
-
00
0
-15-80815
7580
8590
9500
0510
0
-15-80815
7580
8590
9500
0510

52
Figure 32. Productivity of crested auklets (chicks fledged/nest site) at Alaskan sites. Lack of bars indicates that no data were gathered in those years. Blue line is the mean productivity at the site (in parentheses; current year not included). Color of symbol indicates how current year’s success compared to the site mean (red is >20% below, black is within 20% and green is >20% above site mean).
N
0.76
- 1.
00
0.51
- 0.
75
0.26
- 0.
50
0.01
- 0.
25
<0.0
1
2013
CR
AU
Pro
duct
ivity
Bu
ldir
(0.6
6)
Kis
ka (0
.57)
.00
.30
.60
.90
8893
9803
0813
.00
.30
.60
.90
8893
9803
0813
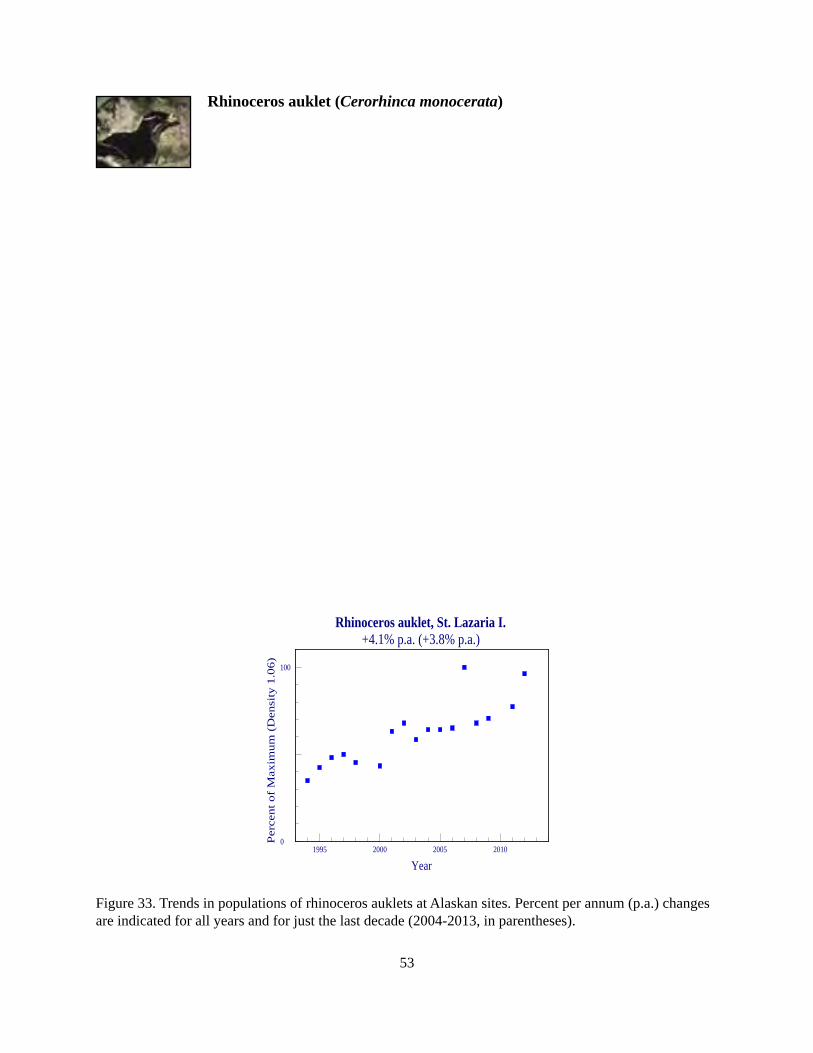
53
Rhinoceros auklet (Cerorhinca monocerata)
Figure 33. Trends in populations of rhinoceros auklets at Alaskan sites. Percent per annum (p.a.) changes are indicated for all years and for just the last decade (2004-2013, in parentheses).
Year1995 2000 2005 2010
Per
cent
of
Max
imum
(D
ensi
ty 1
.06)
0
100
Rhinoceros auklet, St. Lazaria I.+4.1% p.a. (+3.8% p.a.)
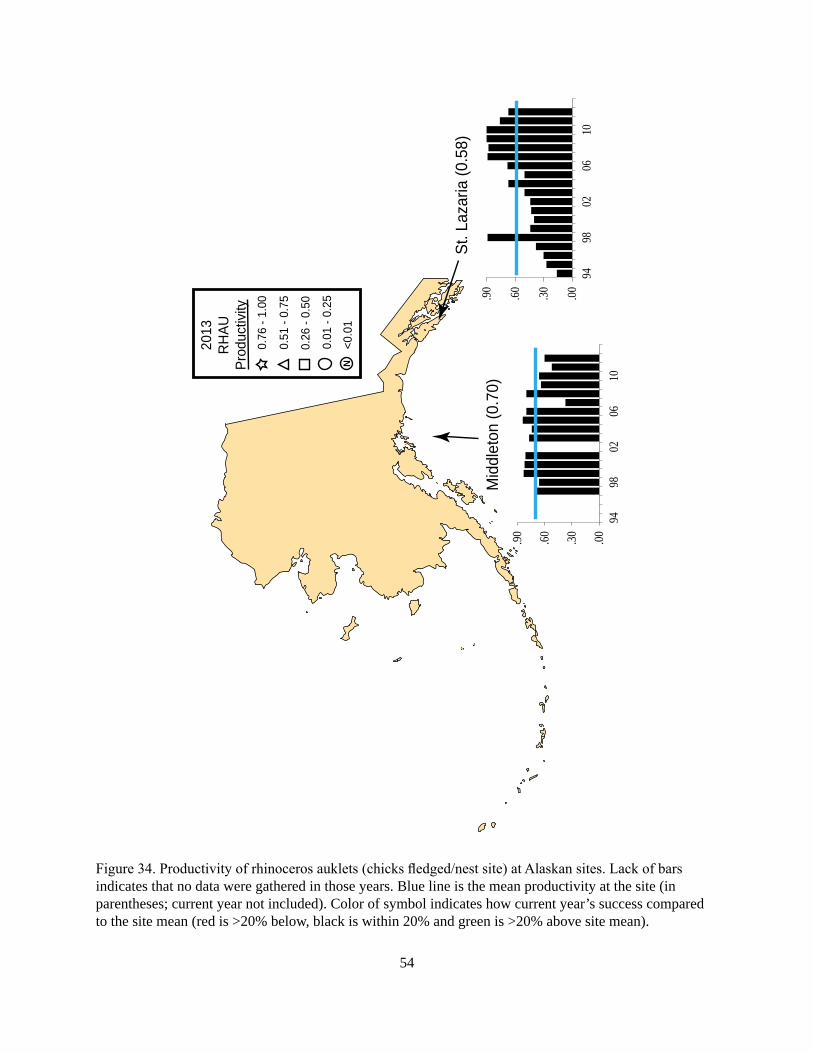
54
Figure 34. Productivity of rhinoceros auklets (chicks fledged/nest site) at Alaskan sites. Lack of bars indicates that no data were gathered in those years. Blue line is the mean productivity at the site (in parentheses; current year not included). Color of symbol indicates how current year’s success compared to the site mean (red is >20% below, black is within 20% and green is >20% above site mean).
N
0.76
- 1.
00
0.51
- 0.
75
0.26
- 0.
50
0.01
- 0.
25
<0.0
1
2013
RH
AUPr
oduc
tivity
Mid
dlet
on (0
.70)
St. L
azar
ia (0
.58)
.00.30.60.90
9498
0206
10
.00.30.60.90
9498
0206
10
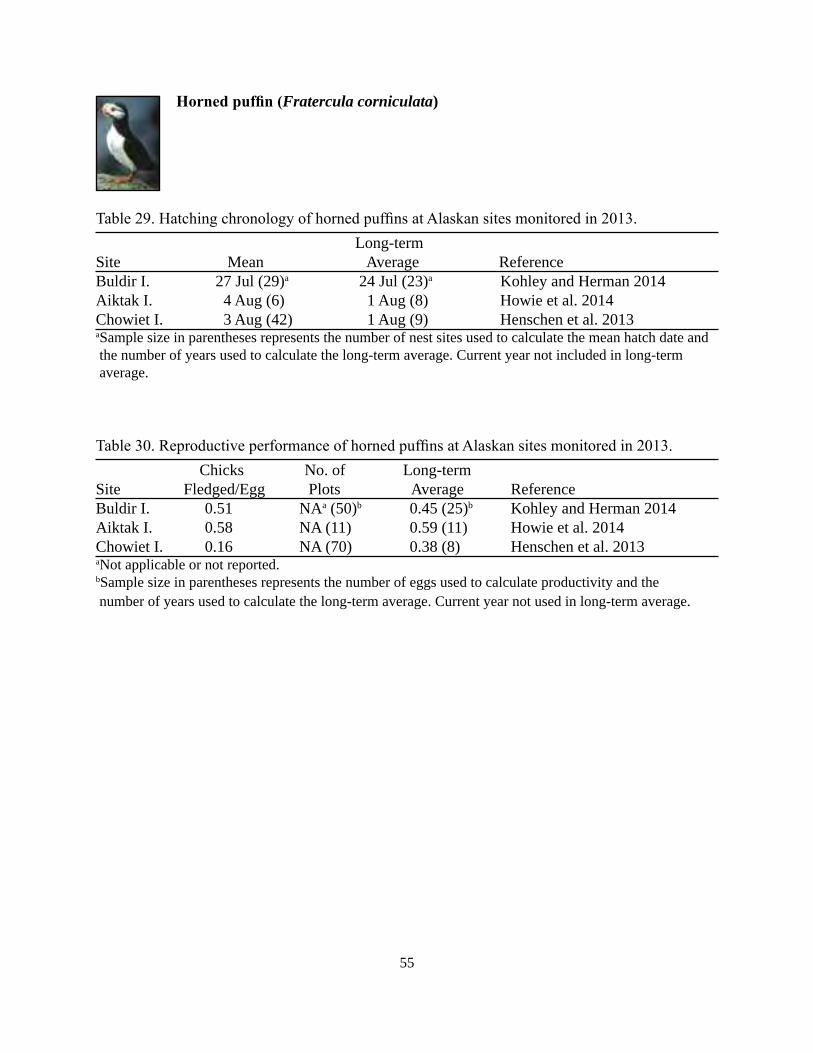
55
Horned puffin (Fratercula corniculata)
Table 29. Hatching chronology of horned puffins at Alaskan sites monitored in 2013. Long-term Site Mean Average ReferenceBuldir I. 27 Jul (29)a 24 Jul (23)a Kohley and Herman 2014Aiktak I. 4 Aug (6) 1 Aug (8) Howie et al. 2014Chowiet I. 3 Aug (42) 1 Aug (9) Henschen et al. 2013aSample size in parentheses represents the number of nest sites used to calculate the mean hatch date and the number of years used to calculate the long-term average. Current year not included in long-term average.
Table 30. Reproductive performance of horned puffins at Alaskan sites monitored in 2013. Chicks No. of Long-termSite Fledged/Egg Plots Average ReferenceBuldir I. 0.51 NAa (50)b 0.45 (25)b Kohley and Herman 2014Aiktak I. 0.58 NA (11) 0.59 (11) Howie et al. 2014Chowiet I. 0.16 NA (70) 0.38 (8) Henschen et al. 2013aNot applicable or not reported.bSample size in parentheses represents the number of eggs used to calculate productivity and the number of years used to calculate the long-term average. Current year not used in long-term average.
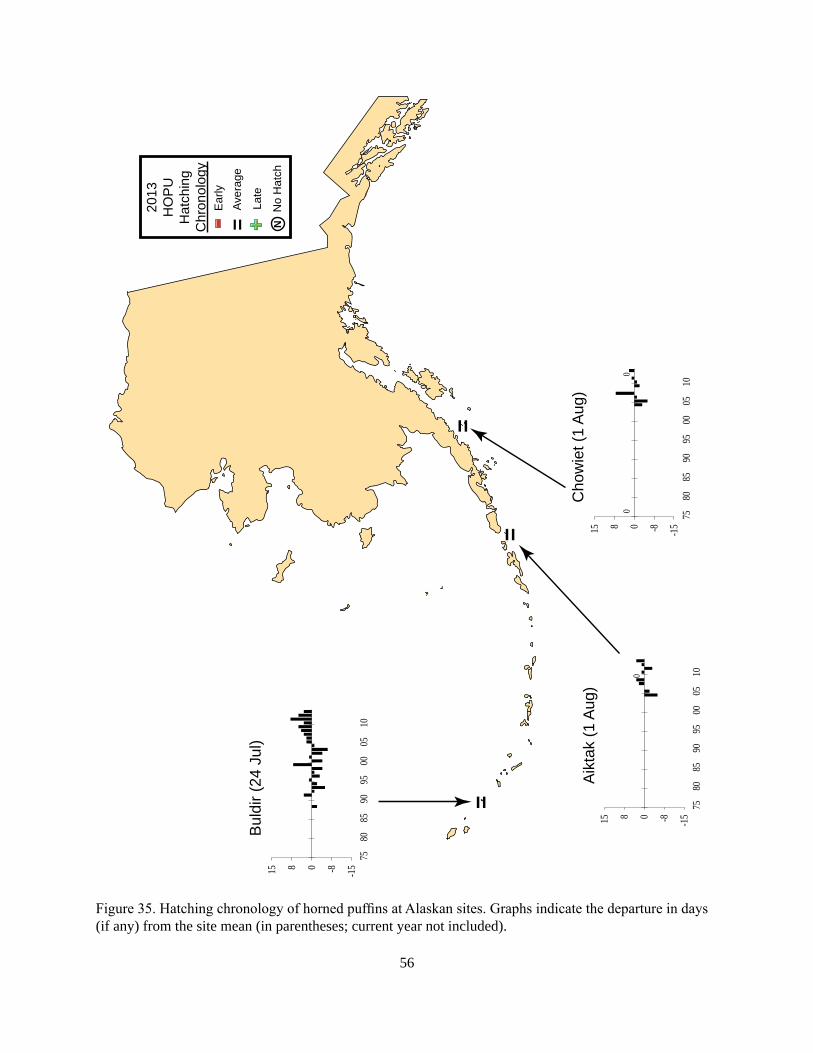
56
Figure 35. Hatching chronology of horned puffins at Alaskan sites. Graphs indicate the departure in days (if any) from the site mean (in parentheses; current year not included).
Aver
age
=La
te+-E
arly
NN
o H
atch
2013
HO
PUH
atch
ing
Chr
onol
ogy
Buld
ir (2
4 Ju
l)
Aikt
ak (1
Aug
)C
how
iet (
1 Au
g)
=
==
-15-80815
7580
8590
9500
0510
0
-15-80815
7580
8590
9500
0510
00
-15-80815
7580
8590
9500
0510
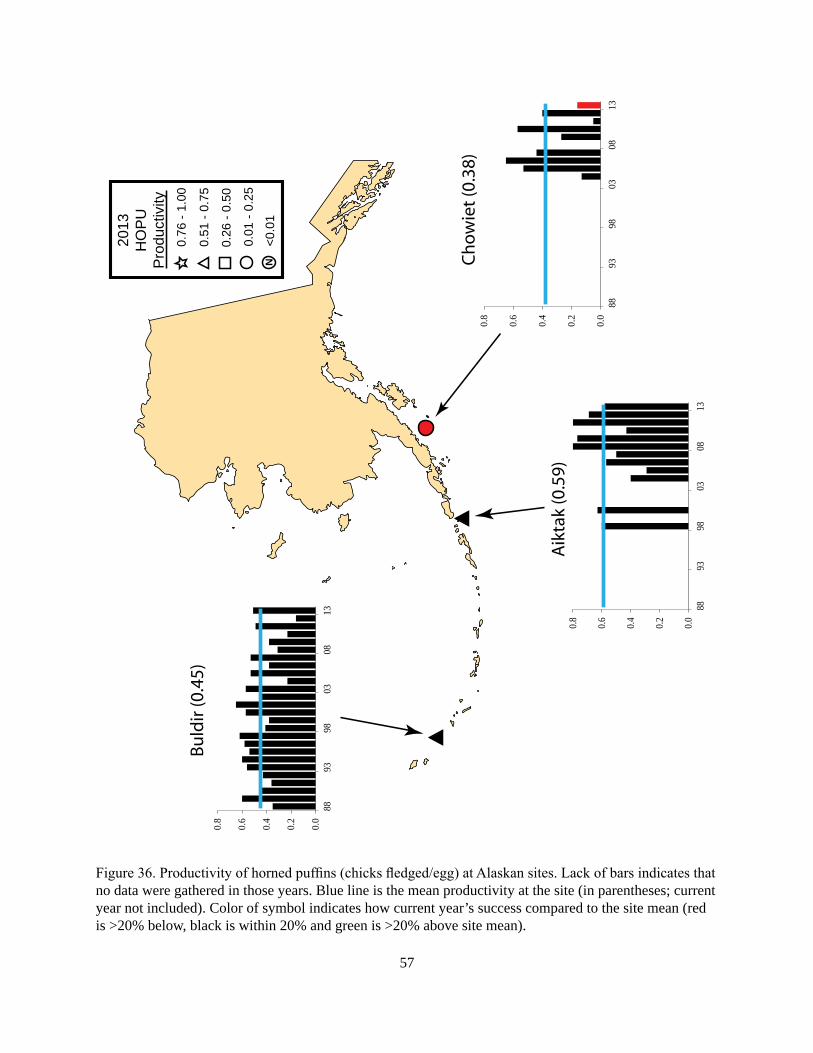
57
Figure 36. Productivity of horned puffins (chicks fledged/egg) at Alaskan sites. Lack of bars indicates that no data were gathered in those years. Blue line is the mean productivity at the site (in parentheses; current year not included). Color of symbol indicates how current year’s success compared to the site mean (red is >20% below, black is within 20% and green is >20% above site mean).
N
0.76
- 1.
00
0.51
- 0.
75
0.26
- 0.
50
0.01
- 0.
25
<0.0
1
2013
HO
PU
Pro
duct
ivity
Bu
ldir
(0.4
5)
Ch
ow
iet
(0.3
8)
Aik
tak
(0.5
9)
0.0
0.2
0.4
0.6
0.8
8893
9803
0813
0.00.20.40.60.8
8893
9803
0813
0.0
0.2
0.4
0.6
0.8
8893
9803
0813

58
Tufted puffin (Fratercula cirrhata)
Table 31. Hatching chronology of tufted puffins at Alaskan sites monitored in 2013. Long-term Site Mean Average ReferenceBuldir I. 16 Jul (6)a 13 Jul (18)a Kohley and Herman 2014Aiktak I. 27 Jul (23) 1 Aug (16) Howie et al. 2014Chowiet I. 27 Jul (24) 25 Jul (8) Henschen et al. 2013aSample size in parentheses represents the number of nest sites used to calculate the mean hatch date and the number of years used to calculate the long-term average. Current year not included in long-term average.
Table 32. Reproductive performance of tufted puffins at Alaskan sites monitored in 2013. Chicks No. of Long-term Site Fledgeda/Egg Plots Average ReferenceBuldir I. 0.50 NAb (11)c 0.39 (25)c Kohley and Herman 2014Aiktak I. 0.73 NA (76) 0.54 (17) Howie et al. 2014Chowiet I. 0.29 NA (49) 0.32 (7) Henschen et al. 2013aFledged chick defined as being still alive at last check in August or September.bNot applicable or not reported.cSample size in parentheses represents the number of eggs used to calculate productivity and the number of years used to calculate the long-term average. Current year not used in long-term average.
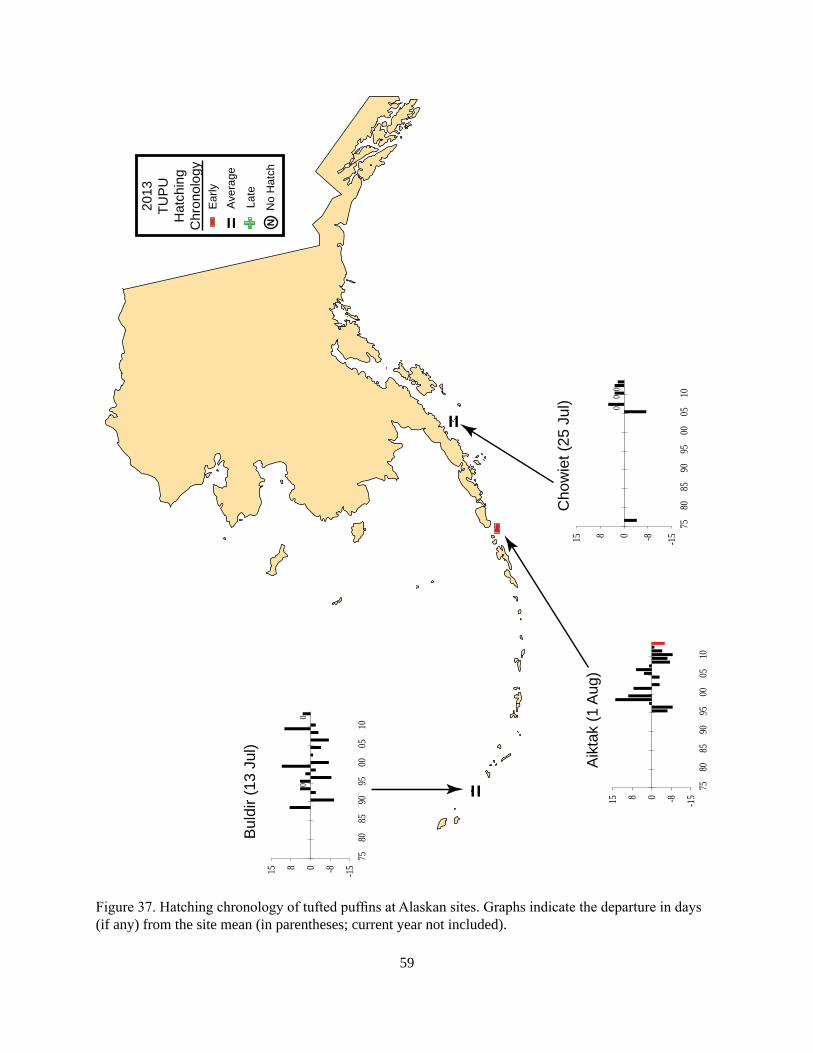
59
Figure 37. Hatching chronology of tufted puffins at Alaskan sites. Graphs indicate the departure in days (if any) from the site mean (in parentheses; current year not included).
Aver
age
=La
te+-E
arly
NN
o H
atch
2013
TUP
UH
atch
ing
Chr
onol
ogy
Bul
dir (
13 J
ul)
Aik
tak
(1 A
ug)
Cho
wie
t (25
Jul
)
==
-
-15-80815
7580
8590
9500
0510
00
-15-80815
7580
8590
9500
0510
00
0
-15-80815
7580
8590
9500
0510
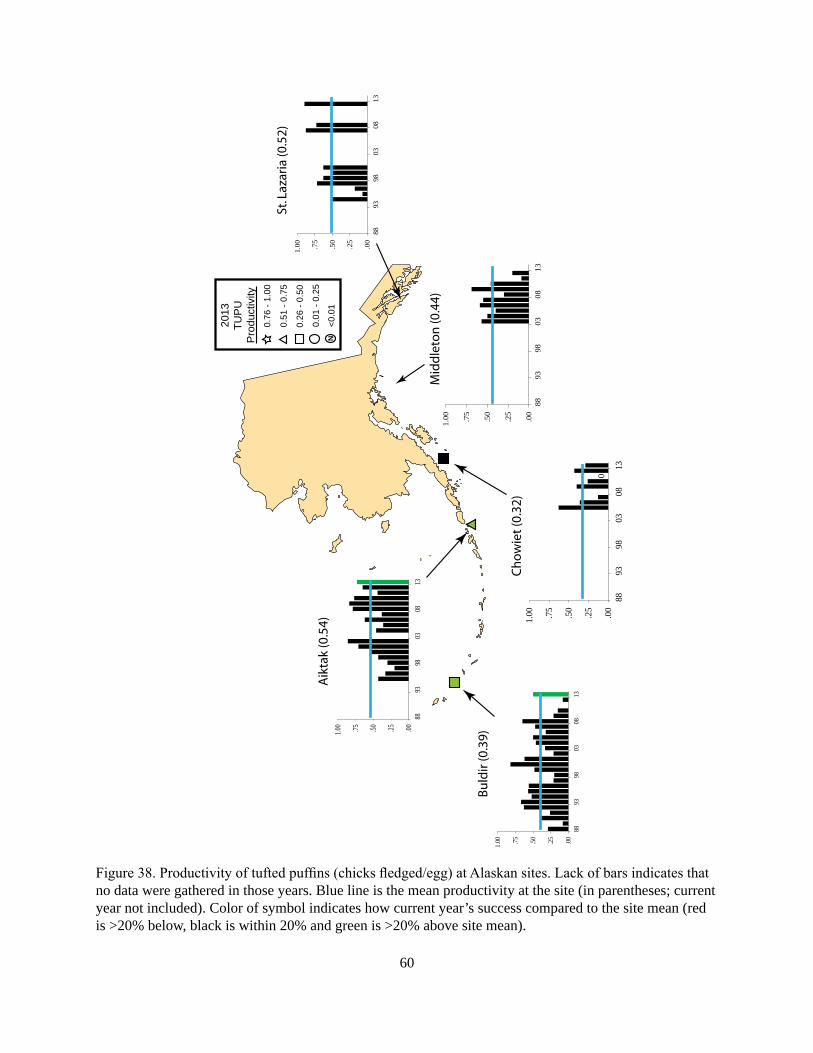
60
Figure 38. Productivity of tufted puffins (chicks fledged/egg) at Alaskan sites. Lack of bars indicates that no data were gathered in those years. Blue line is the mean productivity at the site (in parentheses; current year not included). Color of symbol indicates how current year’s success compared to the site mean (red is >20% below, black is within 20% and green is >20% above site mean).
N
0.76
- 1.
00
0.51
- 0.
75
0.26
- 0.
50
0.01
- 0.
25
<0.0
1
2013
TUP
UP
rodu
ctiv
ity
Bu
ldir
(0.3
9)
Aik
tak
(0.5
4)
Ch
ow
iet
(0.3
2)
Mid
dle
ton
(0.4
4)
St. L
azar
ia (0
.52)
.00
.25
.50
.75
1.00
8893
9803
0813
.00.25.50.751.00
8893
9803
0813
0.0
0
.25
.50
.75
1.00
8893
9803
0813
.00
.25
.50
.75
1.00
8893
9803
0813
.00
.25
.50
.75
1.00
8893
9803
0813

61
Figure 39. Trends in populations of tufted puffins at Alaskan sites. Percent per annum (p.a.) changes are indicated for all years and for just the last decade (2004-2013, in parentheses).
Year1995 2000 2005 2010
0
100
Per
cent
of
Max
imum
(D
ensi
ty 0
.62)
Tufted puffin, Aiktak I.+0.1% p.a. (+1.2% p.a.)
Year1995 2000 2005 2010
Per
cent
of
Max
imum
(19
9 bu
rrow
s)
0
100
Tufted puffin, E. Amatuli I.-3.2% p.a. (-2.6% p.a.)
Year1995 2000 2005 2010
Per
cent
of
Max
imum
(D
ensi
ty 0
.79)
0
100
Tufted puffin, St. Lazaria I.-2.2% p.a. (-5.1% p.a.)
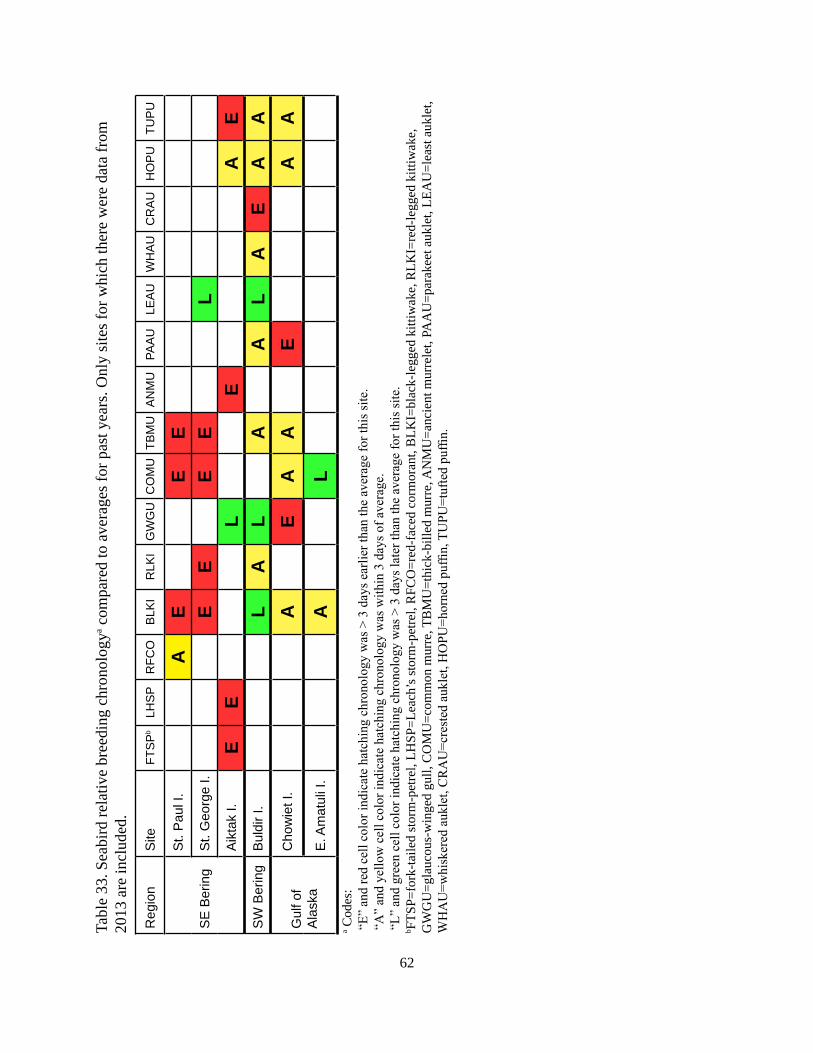
62
Tabl
e 33
. Sea
bird
rela
tive
bree
ding
chr
onol
ogya c
ompa
red
to a
vera
ges f
or p
ast y
ears
. Onl
y si
tes f
or w
hich
ther
e w
ere
data
from
20
13 a
re in
clud
ed.
a Cod
es:
“E”
and
red
cell
colo
r ind
icat
e ha
tchi
ng c
hron
olog
y w
as >
3 d
ays e
arlie
r tha
n th
e av
erag
e fo
r thi
s site
. “
A”
and
yello
w c
ell c
olor
indi
cate
hat
chin
g ch
rono
logy
was
with
in 3
day
s of a
vera
ge.
“L”
and
gre
en c
ell c
olor
indi
cate
hat
chin
g ch
rono
logy
was
> 3
day
s lat
er th
an th
e av
erag
e fo
r thi
s site
.b F
TSP=
fork
-taile
d st
orm
-pet
rel,
LHSP
=Lea
ch’s
stor
m-p
etre
l, R
FCO
=red
-fac
ed c
orm
oran
t, B
LKI=
blac
k-le
gged
kitt
iwak
e, R
LKI=
red-
legg
ed k
ittiw
ake,
G
WG
U=g
lauc
ous-
win
ged
gull,
CO
MU
=com
mon
mur
re, T
BM
U=t
hick
-bill
ed m
urre
, AN
MU
=anc
ient
mur
rele
t, PA
AU
=par
akee
t auk
let,
LEA
U=l
east
auk
let,
WH
AU
=whi
sker
ed a
ukle
t, C
RA
U=c
rest
ed a
ukle
t, H
OPU
=hor
ned
puffi
n, T
UPU
=tuf
ted
puffi
n.
Reg
ion
Site
FTS
Pb
LHS
PR
FCO
BLK
IR
LKI
GW
GU
CO
MU
TBM
UA
NM
UPA
AU
LEA
UW
HA
UC
RA
UH
OP
UTU
PU
SE
Ber
ing
St.
Pau
l I.
AE
EE
St.
Geo
rge
I.E
EE
EL
Aik
tak
I.E
EL
EA
ES
W B
erin
gB
uldi
r I.
LA
LA
AL
AE
AA
Gul
f of
Ala
ska
Cho
wie
t I.
AE
AA
EA
AE
. Am
atul
i I.
AL
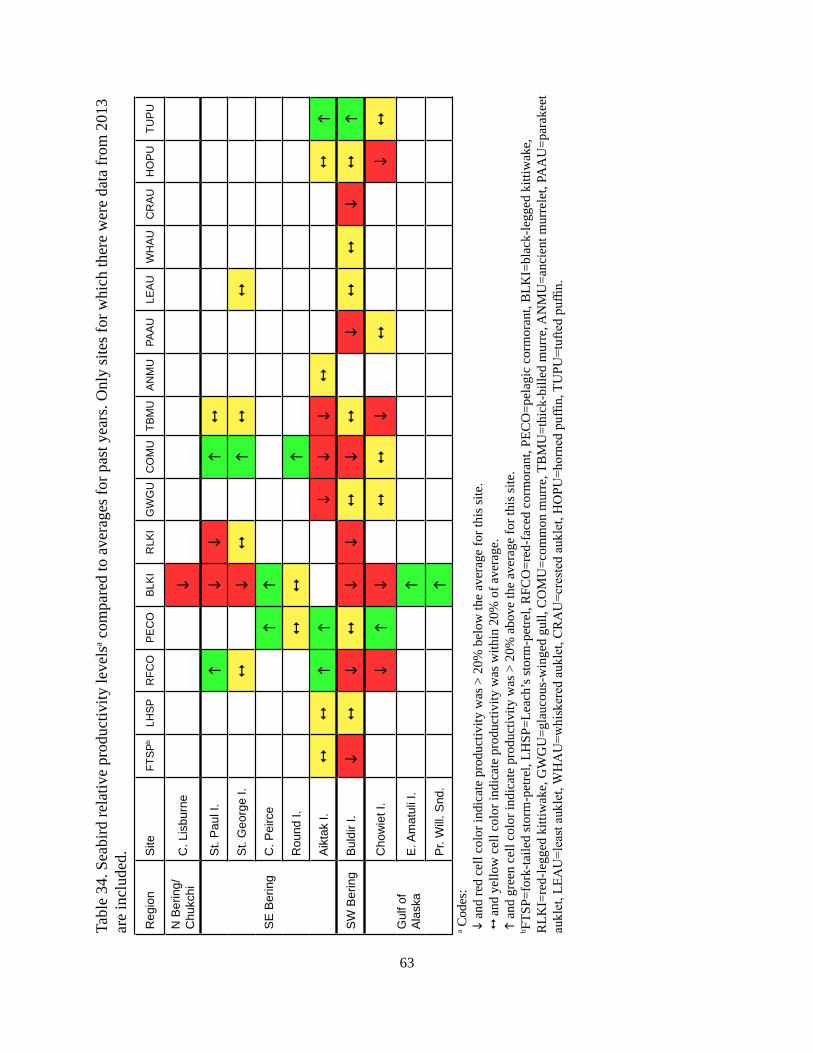
63
Tabl
e 34
. Sea
bird
rela
tive
prod
uctiv
ity le
vels
a com
pare
d to
ave
rage
s for
pas
t yea
rs. O
nly
site
s for
whi
ch th
ere
wer
e da
ta fr
om 2
013
are
incl
uded
.
a Cod
es:
i a
nd re
d ce
ll co
lor i
ndic
ate
prod
uctiv
ity w
as >
20%
bel
ow th
e av
erag
e fo
r thi
s site
. 1
and
yel
low
cel
l col
or in
dica
te p
rodu
ctiv
ity w
as w
ithin
20%
of a
vera
ge.
h a
nd g
reen
cel
l col
or in
dica
te p
rodu
ctiv
ity w
as >
20%
abo
ve th
e av
erag
e fo
r thi
s site
.b F
TSP=
fork
-taile
d st
orm
-pet
rel,
LHSP
=Lea
ch’s
stor
m-p
etre
l, R
FCO
=red
-fac
ed c
orm
oran
t, PE
CO
=pel
agic
cor
mor
ant,
BLK
I=bl
ack-
legg
ed k
ittiw
ake,
R
LKI=
red-
legg
ed k
ittiw
ake,
GW
GU
=gla
ucou
s-w
inge
d gu
ll, C
OM
U=c
omm
on m
urre
, TB
MU
=thi
ck-b
illed
mur
re, A
NM
U=a
ncie
nt m
urre
let,
PAA
U=p
arak
eet
aukl
et, L
EAU
=lea
st a
ukle
t, W
HA
U=w
hisk
ered
auk
let,
CR
AU
=cre
sted
auk
let,
HO
PU=h
orne
d pu
ffin,
TU
PU=t
ufte
d pu
ffin.
Reg
ion
Site
FTS
Pb
LHS
PR
FCO
PE
CO
BLK
IR
LKI
GW
GU
CO
MU
TBM
UA
NM
UPA
AU
LEA
UW
HA
UC
RA
UH
OP
UTU
PU
N B
erin
g/C
hukc
hiC
. Lis
burn
ei
SE
Ber
ing
St.
Pau
l I.
hi
ih
1
St.
Geo
rge
I.1
i1
h1
1
C. P
eirc
eh
h
Rou
nd I.
11
h
Aik
tak
I.1
1h
hi
ii
11
h
SW
Ber
ing
Bul
dir I
.i
1i
1i
i1
i1
i1
1i
1h
Gul
f of
Ala
ska
Cho
wie
t I.
ih
i1
1i
1i
1
E. A
mat
uli I
.h
Pr.
Will
. Snd
.h
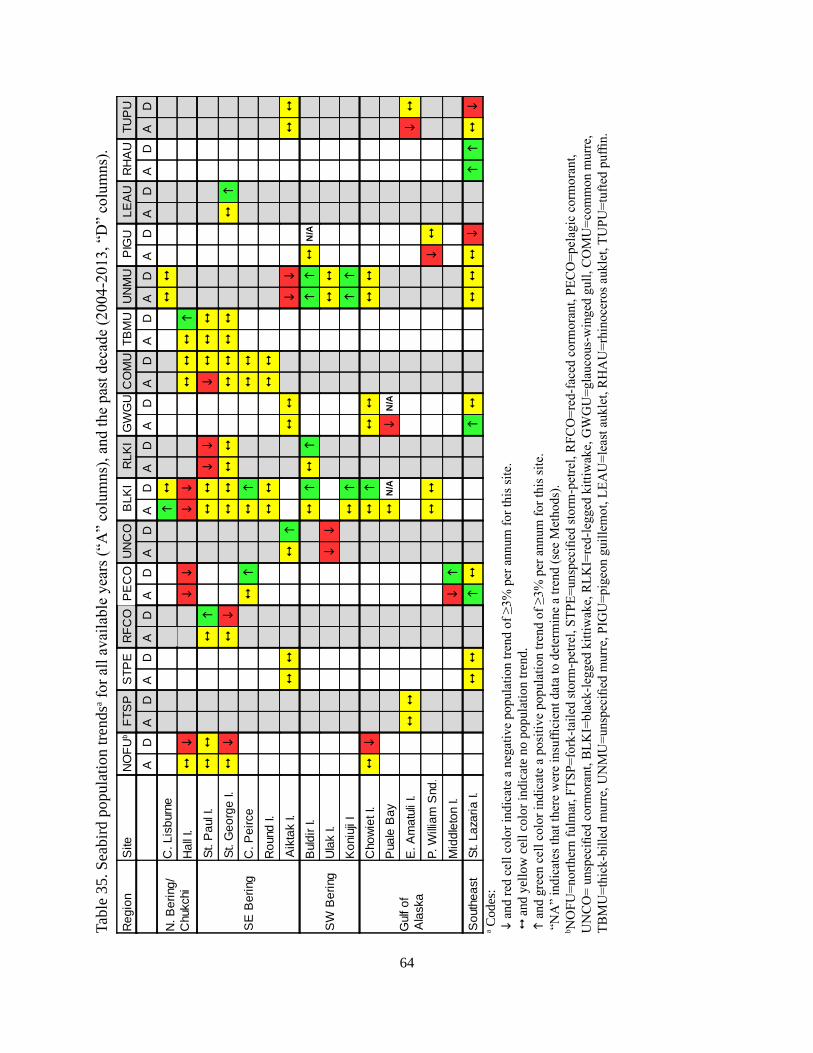
64
Tabl
e 35
. Sea
bird
pop
ulat
ion
trend
sa for
all
avai
labl
e ye
ars (
“A”
colu
mns
), an
d th
e pa
st d
ecad
e (2
004-
2013
, “D
” co
lum
ns).
a Cod
es:
i a
nd re
d ce
ll co
lor i
ndic
ate
a ne
gativ
e po
pula
tion
trend
of ≥
3% p
er a
nnum
for t
his s
ite.
1 a
nd y
ello
w c
ell c
olor
indi
cate
no
popu
latio
n tre
nd.
h a
nd g
reen
cel
l col
or in
dica
te a
pos
itive
pop
ulat
ion
trend
of ≥
3% p
er a
nnum
for t
his s
ite.
“N
A”
indi
cate
s tha
t the
re w
ere
insu
ffici
ent d
ata
to d
eter
min
e a
trend
(see
Met
hods
).b N
OFU
=nor
ther
n fu
lmar
, FTS
P=fo
rk-ta
iled
stor
m-p
etre
l, ST
PE=u
nspe
cifie
d st
orm
-pet
rel,
RFC
O=r
ed-f
aced
cor
mor
ant,
PEC
O=p
elag
ic c
orm
oran
t, U
NC
O=
unsp
ecifi
ed c
orm
oran
t, B
LKI=
blac
k-le
gged
kitt
iwak
e, R
LKI=
red-
legg
ed k
ittiw
ake,
GW
GU
=gla
ucou
s-w
inge
d gu
ll, C
OM
U=c
omm
on m
urre
, TB
MU
=thi
ck-b
illed
mur
re, U
NM
U=u
nspe
cifie
d m
urre
, PIG
U=p
igeo
n gu
illem
ot, L
EAU
=lea
st a
ukle
t, R
HA
U=r
hino
cero
s auk
let,
TUPU
=tuf
ted
puffi
n.
Reg
ion
Site
NO
FUb
FTS
PS
TPE
RFC
OP
EC
OU
NC
OB
LKI
RLK
IG
WG
UC
OM
UTB
MU
UN
MU
PIG
ULE
AU
RH
AU
TUP
UA
DA
DA
DA
DA
DA
DA
DA
DA
DA
DA
DA
DA
DA
DA
DA
D
N. B
erin
g/C
hukc
hiC
. Lis
burn
eh1
11
Hal
l I.
1i
ii
ii
11
1h
SE
Ber
ing
St. P
aul I
.1
11
h1
1i
ii
11
1
St. G
eorg
e I.
1i
1i
11
11
11
11
1h
C. P
eirc
e1
h1
h1
1
Rou
nd I.
11
11
Aik
tak
I.1
11
h1
1i
i1
1
SW
Ber
ing
Bul
dir I
.1
h1
hh
h1
N/A
Ula
k I.
ii
11
Kon
iuji
I1
hh
h
Gul
f of
Ala
ska
Cho
wie
t I.
1i
1h
11
11
Pua
le B
ay1
N/A
iN
/A
E. A
mat
uli I
.1
1i
1
P. W
illiam
Snd
.1
1i
1
Mid
dlet
on I.
ih
Sou
thea
stSt
. Laz
aria
I.1
1h1
h1
11
1i
hh1
i

65
Acknowledgments
The data summarized in this report were gathered by many people, most of whom are cited in the references section. We appreciate their efforts. We thank Arthur Kettle (Alaska Maritime NWR), Michael Swaim (Togiak NWR) and Ed Weiss (Alaska Dept. Fish and Game) for the unpublished data they kindly provided. We would like to extend our thanks to the staff of the Alaska Maritime NWR for their assistance during both the data collection and writing phases of this project. All photographs used in this report are Fish and Wildlife Service pictures except those of the fork-tailed storm-petrel, parakeet auklet, least auklet, tufted puffin and horned puffin which were taken by Ian Jones, and the ancient murrelet taken by Fiona Hunter, and used with permission. Cover art by Susan Steinacher.
References
Byrd, G. V. 2007. Seabird monitoring on Alaska Maritime National Wildlife Refuge. Pp. 33-39 in Community-based coastal observing in Alaska: Aleutian life forum 2006, R. Brewer, Ed. Alaska Sea Grant College Program Report No. 07-03. University of Alaska Fairbanks.
_____, and D. E. Dragoo. 1997. Breeding success and population trends of selected seabirds in Alaska in 1996. U. S. Fish and Wildlife Service Report AMNWR 97/11. Homer, Alaska.
_____, and D. B. Irons. 1998. Breeding status and population trends of seabirds in Alaska in 1997. U. S. Fish and Wildlife Service Report AMNWR 98/02. Homer, Alaska.
_____. 1999. Breeding status and population trends of seabirds in Alaska in 1998. U. S. Fish and Wildlife Service Report AMNWR 99/02. Homer, Alaska.
Dragoo, D. E., G. V. Byrd, and D. B. Irons. 2000. Breeding status and population trends of seabirds in Alaska in 1999. U. S. Fish and Wildlife Service Report AMNWR 2000/02. Homer, Alaska.
_____. 2001. Breeding status, population trends and diets of seabirds in Alaska, 2000. U. S. Fish and Wildlife Service Report AMNWR 01/07. Homer, Alaska.
_____. 2003. Breeding status, population trends and diets of seabirds in Alaska, 2001. U. S. Fish and Wildlife Service Report AMNWR 03/05. Homer, Alaska.
_____. 2004. Breeding status, population trends and diets of seabirds in Alaska, 2002. U. S Fish and Wildlife Service Report AMNWR 04/15. Homer, Alaska.

66
_____. 2006. Breeding status, population trends and diets of seabirds in Alaska, 2003. U. S Fish and Wildlife Service Report AMNWR 06/13. Homer, Alaska.
_____. 2007. Breeding status, population trends and diets of seabirds in Alaska, 2004. U. S Fish and Wildlife Service Report AMNWR 07/17. Homer, Alaska.
_____. 2008. Breeding status, population trends and diets of seabirds in Alaska, 2005. U. S Fish and Wildlife Service Report AMNWR 08/03. Homer, Alaska.
_____. 2009. Breeding status, population trends and diets of seabirds in Alaska, 2006. U. S Fish and Wildlife Service Report AMNWR 09/05. Homer, Alaska.
_____. 2010. Breeding status, population trends and diets of seabirds in Alaska, 2007. U. S Fish and Wildlife Service Report AMNWR 2010/08. Homer, Alaska.
_____. 2011. Breeding status, population trends and diets of seabirds in Alaska, 2008. U. S Fish and Wildlife Service Report AMNWR 2011/07. Homer, Alaska.
Dragoo, D. E., H. M. Renner, and David B. Irons. 2012. Breeding status, population trends and diets of seabirds in Alaska, 2009. U. S Fish and Wildlife Service Report AMNWR 2012/01. Homer, Alaska.
_____. 2013. Breeding status and population trends of seabirds in Alaska, 2012. U. S Fish and Wildlife Service Report AMNWR 2013/05. Homer, Alaska.
Dragoo, D. E., G. Thomson, and H. M. Renner. 2013. Biological monitoring at Cape Lisburne, Alaska in 2013. U. S Fish and Wildlife Service Report AMNWR 2013/07 Homer, Alaska.
Henschen, M. L., B. C. Soucie, and N. A. Rojek. 2013. Biological monitoring at Chowiet Island, Alaska in 2013. U. S. Fish and Wildlife Service Report AMNWR 2013/11. Homer, Alaska.
Howie, M. G., I. T. Nimz and B. A. Drummond. 2014. Biological monitoring at Aiktak Island, Alaska in 2013. U. S. Fish and Wildlife Service Report AMNWR 2014/01. Homer, Alaska.
Irons, D. Migratory Bird Management, USFWS, Unpubl. Data 2013. Anchorage, Alaska.
Kettle, A. Alaska Maritime NWR, USFWS. Unpublished Data, 2013. Homer, Alaska.
Klostermann, M. R., M. L. St. Pierre, and M. D. Romano. 2013. Biological monitoring at St. George Island, Alaska in 2013. U. S. Fish and Wildlife Service Report AMNWR 2013/08. Homer, Alaska.
67
Kohley, C. R. and R. W. Herman. 2014. Biological monitoring at Buldir Island, Alaska in 2013. U. S. Fish and Wildlife Service Report AMNWR 2014/02. Homer, Alaska.
Swaim, M. Togiak NWR, USFWS. Unpublished Data, 2013. Dillingham, Alaska.
Thomson, G., and M. D. Romano. 2013. Biological monitoring at St. Paul Island, Alaska in 2013. U. S. Fish and Wildlife Service Report AMNWR 2013/10. Homer, Alaska.
USFWS. 2013. Standardized protocols for annual seabird monitoring camps at Aiktak, Buldir, Chowiet, St. George, St. Lazaria and St. Paul islands in the Alaska Maritime National Wildlife Refuge in 2013. U. S. Fish and Wildlife Service Report AMNWR 2013/09. Homer, Alaska.
Weiss, E., Alaska Department of Fish and Game. Unpublished Data 2013. Anchorage, Alaska.