
Breast Cancer Surgical Management in Queensland Public … Cancer Surgical... · Breast Cancer...
43
Breast Cancer Surgical Management in Queensland Public and Private Hospitals Surgical practice indicators for quality cancer care 2004 - 2013
Transcript of Breast Cancer Surgical Management in Queensland Public … Cancer Surgical... · Breast Cancer...

Breast Cancer Surgical Management in Queensland Public and Private Hospitals
Surgical practice indicators for quality cancer care
2004 - 2013
Queensland Cancer Control Analysis Team
Acknowledgements
The Queensland Breast Cancer Sub-committee was established in 2011 as a Sub-Committee of The Queensland Cancer Control Safety and Quality Partnership (The Partnership) to consider and improve outcomes for women who have been treated with breast cancer across Queensland - an approach which has never before been adopted for breast cancer in Queensland. The authors acknowledge and appreciate the work of the Breast Cancer Sub-committee members (listed below) and the Queensland Cancer Control Analysis Team (QCCAT) who contribute to and participate in the activities of The Partnership.
Breast Cancer Sub-committee Members
Colin Furnival (Chair), Michelle Cronk, Ben Green, Tony Green, Margot Lehman, Sunil Lakhani, Marion Strong, Tracey Guan and Hazel Harden.
This report has been prepared by Nathan Dunn, Julie Moore, Shoni Philpot and the Queensland Cancer Control Analysis Team.
For more information: Queensland Cancer Control Analysis Team Queensland Health Tel: (+61) (07) 3176 4400 Email: [email protected] https://qccat.health.qld.gov.au
Breast Cancer Surgical Management in Queensland Public and Private Hospitals, 2004-2013. Suggested citation: Queensland Government. Breast Cancer Surgical Management in Queensland Public and Private Hospitals. Queensland Health, Brisbane, 2017 Copyright protects this publication. However, the Queensland Government has no objection to this material being reproduced with acknowledgement, except for commercial purposes. Permission to reproduce for commercial purposes should be sought from: The Manager Queensland Cancer Control Analysis Team Queensland Health Clinical Research Facility, Level 5, R Wing Princess Alexandra Hospital
ISBN: 978-1-921021-63-3
Published by Queensland Health March 2017 ©The State of Queensland, Queensland Health 2017
Breast Cancer Surgical Management in Queensland Public and Private Hospitals
Surgical practice indicators for quality cancer care
2004 - 2013
Table of Contents
Foreword.....................................................................................................................................................F
Why develop breast cancer surgical practice indicators for Queensland?.................................................1
The Partnership...........................................................................................................................................1
Where had the data come from?................................................................................................................1
Quality measures used................................................................................................................................2
How comparisons are made between patient, geographical and hospital groups.....................................2
Privacy and confidentiality..........................................................................................................................2
Leading the way – using the surgical indicators in clinical practice............................................................3
How is data collected in Queensland Oncology Online (QOOLTM)..............................................................3
What data has been used to formulate the indicators?.............................................................................4
What indicators are included?....................................................................................................................5
Key Findings................................................................................................................................................6
1.0 Incidence and Mortality........................................................................................................................7
1.1 Breast cancer national and international comparisons........................................................................8
1.2 Survival..................................................................................................................................................9
1.3 Survival by stage at diagnosis................................................................................................................9
2.0 Definitive surgery.................................................................................................................................10
2.1 Definitive surgery patient characteristics............................................................................................11
2.2 Residence summary.............................................................................................................................12
3.0 Hospital summary................................................................................................................................13
4.0 Indicator summary...............................................................................................................................14
4.1 Indicator summary over time...............................................................................................................15
4.2 Indicator patient characteristics...........................................................................................................16
5.0 Surgical Practice Indicators..................................................................................................................17
5.1 Definitve mastectomy rate...................................................................................................................17
5.2 Index mastectomy for T1 tumours.......................................................................................................18
5.3 Re-excision of lesion after index breast conservation surgery (BCS)....................................................19
5.4 Conversion of index breast conserving surgery (BCS) to mastectomy.................................................20
5.5 Sentinel lymph node biopsy (SLNB) on T1 tumours with index breast conservation surgery (BCS)....21
6.0 Timliness Indicators.............................................................................................................................22
6.1 Time from pathological diagnosis to first (index) surgery ≤ 45 days.....................................................22
6.2 Time from first (index) surgery to definitive surgery ≤ 21 days............................................................23
Appendix 1: AIHW hospital peer group definitions.................................................................................... 24
Appendix 2: Low volume hospitals performing breast cancer surgery.......................................................27
Method....................................................................................................................................................... 28
Glossary.......................................................................................................................................................29
References...................................................................................................................................................33
Foreword
As the Chair of the Breast Cancer Sub-committee of the Queensland Cancer Control Safety and Quality
Partnership (The Partnership), I am privileged to introduce the Breast Cancer Surgical Management in
Queensland Public and Private Hospitals report for the decade 2004-2013. This report is a
comprehensive review of the surgical treatment of invasive breast cancer in Queensland hospitals using
seven practice indicators:
1. Definitive (final) mastectomy rate for invasive breast cancer
2. Index (initial) mastectomy for T1 tumours
3. Re-excision of lesion after index breast conservation surgery (BCS)
4. Conversion of index BCS to mastectomy
5. Sentinel lymph node biopsy on T1 tumours treated with index BCS
6. Time from pathological diagnosis to first surgery ≤ 45 days
7. Time from first surgery to definitive surgery ≤ 21 days
These indicators have been developed through consultation with breast surgeons and other clinical
experts in breast cancer treatment and aim to inform surgeons and hospital administrators of the
variations in practice and process that exists among individual hospitals in Queensland. To provide more
contemporary data the indicators have been applied for the years 2009-2013.
Although no benchmarks have been suggested for these indicators, the variation in practice among
Queensland hospitals may raise questions about the extent to which surgical practice, in some hospitals,
reflects established clinical guidelines.
The Breast Cancer Sub-committee will continue to monitor patterns of breast cancer surgery in
Queensland, and we are working towards expanding the indicator set to include adjuvant treatment
such as radiotherapy and systemic therapy, with a clear focus on ensuring the best possible outcomes
for our breast cancer patients Queensland.
On behalf of the Breast Sub-committee I wish to acknowledge the contribution of the members of the
Queensland Cancer Control Analysis Team (QCCAT) in providing the information, analysis and statistics
presented in this report and to recognise the commitment of the many clinicians who have been
involved in the discussion and development of these breast surgical practice indicators.
Colin Furnival Chair, Breast Cancer Sub-committee Queensland Cancer Control Safety and Quality Partnership
F
Why develop breast cancer surgical practice indicators for Queensland?
In 2021, an estimated 4,080 Queensland women will be diagnosed with invasive breast cancer. Breast
cancer accounts for 28% of all reported cancers in females. However almost 80% of women who
develop invasive breast cancer will survive their disease die of other causes. Survival for women with
breast cancer has improved from 89% for years 2004-2008 to 91% in 2009-2013.
Surgery is a critical component of treatment for breast cancer. 91% of Queensland women who develop
invasive breast cancer have a surgical procedure as part of their initial treatment. The two types of
surgery carried out for breast cancer are breast conserving surgery (BCS) (55%) and mastectomy (45%).
The retrospective data used for these surgical practice indicators is useful for benchmarking, and for the
first time provide baseline breast cancer surgical rates for Queensland. The Sub-committee
acknowledges that factors such as patient’s preference and surgeon’s recommendation cannot be
accounted for in the analysis, neither are these factors routinely recorded in electronic data sources.
It is intended that the breast cancer surgical practice indicators will provide useful information to assist
Queensland hospitals and clinicians to promote areas where they are doing well and identify areas
which may benefit from improvement. The information in this report should be discussed with surgical
teams in the context of the services that their hospital delivers.
The Partnership
Developing the breast cancer surgical practice indicators is an initiative of The Breast Cancer Sub-
committee, a Sub-committee of The Queensland Cancer Control Safety and Quality Partnership (The
Partnership), a gazetted quality assurance committee under Part 6, Division 1 of the Hospital and Health
Boards Act 2011 in 2004. A key role of The Partnership is to provide cancer clinicians, administrators,
Hospital and Health Services (HHS) and Queensland public and private hospitals with cancer information
and tools to deliver the best patient care. The members of the Breast Cancer Sub-committee are Colin
Furnival (Chair), Michelle Cronk, Ben Green, Tony Green, Hazel Harden, Margot Lehman, Sunil Lakhani,
Marion Strong and the Queensland Cancer Control Analysis Team (QCCAT) who have worked together to
develop a suite of quality indicators for breast cancer surgery and to prepare this report.
Where has the data come from?
Since 2004, QCCAT has compiled and analysed a vast amount of information about cancer incidence,
mortality, survival and surgery in Qld.
The key to QCCAT’s program of work is the ability to match and link population-based cancer
information on an individual patient basis. This matched and linked data is housed in the Queensland
Oncology Repository (QOR), a resource managed by QCCAT. This centralised repository compiles and
collates data from a range of source systems including the Queensland Cancer Registry, hospital
admissions data, death registry data, treatment systems, public and private pathology records, hospital
1
clinical data systems and Queensland Oncology On-Line (QOOLTM). QOR contains approximately 40
million records between the years 1982 and 2013. Our matching and linking processes provide the
350,000+ matched and linked records of cancer patients between 2004 and 2013 which provide the data
for this Breast Cancer Surgical Management in Queensland Public and Private Hospitals report.
Quality measures used
Measures for breast cancer surgery management have been drawn from published literature and the
expert advice of the Breast Cancer Sub-committee. The report focuses on five surgical practice
indicators and two indicators reporting on the timeliness of breast cancer surgery performed in
Queensland public and private hospitals. The breast cancer indicators in this report have been adjusted
to remove the effect of differences in composition of the various populations.
The indicators have been adjusted by age, tumour size, year of surgery, comorbidities,
rurality/remoteness and overall stage. The displayed confidence intervals are intended to show the level
of precision of the adjusted rate estimate.
How comparisons are made between patient, geographical and hospital
groups
Each patient is unique and factors such as age, case-mix and hospital capability vary between different
hospitals and geographical regions. In order to compare hospitals as fairly as possible this report utilises
the Australian hospital peer groups classification developed by The Australian Institute of Health and
Welfare (AIHW). AIHW groups public and private hospitals that share similar characteristics, providing a
basis for meaningful comparisons. There are thirty peer groups, ten of which are relevant to this report.
Geographical areas are reported using the Australian Standard Geographical Classification (ASGC). Peer
group definitions and groupings used in this report are defined in Appendix 1.
Hospitals performing a yearly average of < 15 breast cancer surgeries between 2009 and 2013 were
grouped as low volume for this report. Hospitals grouped as low volume in this report are listed in
Appendix 2.
Privacy and confidentiality
Reports generated on behalf of The Partnership contain aggregate and de-identified data and maintain the confidentiality of the person receiving the health service and the individual provider.
2

Leading the way – using the surgical indicators in clinical practice When designing these surgical practice indicators the intention was to identify meaningful indicators that can be applied at a state wide level, an individual hospital level and by individual surgeons who are interested in measuring their own performance. To calculate and use these indicators to measure performance the relevant data must be collected. A useful data collection tool has been developed called Queensland Oncology On-Line (QOOLTM). QOOLTM is a web-based multisite system that captures and communicates important clinical information about Queensland cancer patients. QOOLTM is currently being used by most breast cancer Multi-Disciplinary Teams (MDT’s) in public hospitals and some surgeons in private practice. QOOLTM has the ability to collect quality data and to extract the information for feedback to surgeons, MDT’s or hospitals for approved research and clinical audits. Below is an example of how the surgical indicators are being used in clinical practice. Dr Chris Pyke is a breast cancer surgeon practising in the Mater Hospital in Brisbane. He is also a
member of the BreastSurgANZ Society, an association of breast cancer surgeons in Australia and New
Zealand. Individual members’ surgical performance and outcomes are continuously monitored through
assessment via the BreastSurgANZ Quality Audit. Dr Pyke is taking advantage of the data captured in
QOOLTM by appending additional information to breast cancer patient records and extracting his local
data required for the Quality Audit. The state wide cancer data pre-populated in QOOLTM allows breast
surgeons to produce quality practice indicators for their practice and surgical units.
How is data collected in Queensland Oncology Online (QOOLTM)?
QOOL collects data from over 62 data
sources
QOOL Clinicians & MDT’s
· Patient demographics· Public and private
pathology· Cancer diagnosis· MDT review and
presentations· Surgery received· Radiotherapy received· Chemotherapy received· Outcome
· Cancer stage· Patient decision· Surgical audit data sets (eg
SurgANZ)· Treatment plan
Pre-Populated data Clinical teams and surgeons add data
QOOL and Clinicians together provide a state wide view of
cancer in QLD
3
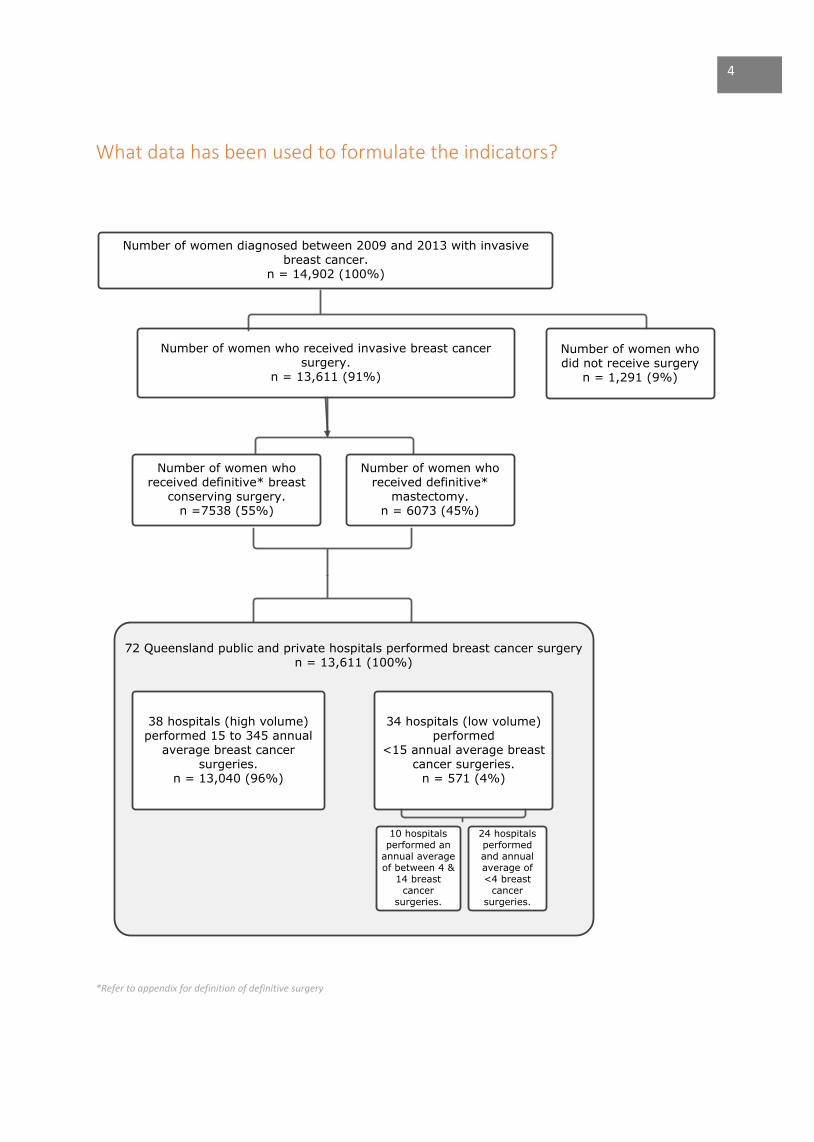
What data has been used to formulate the indicators?
Number of women diagnosed between 2009 and 2013 with invasive breast cancer.
n = 14,902 (100%)
Number of women who received invasive breast cancer surgery.
n = 13,611 (91%)
Number of women who received definitive*
mastectomy.n = 6073 (45%)
Number of women who received definitive* breast
conserving surgery.n =7538 (55%)
72 Queensland public and private hospitals performed breast cancer surgeryn = 13,611 (100%)
38 hospitals (high volume) performed 15 to 345 annual
average breast cancer surgeries.
n = 13,040 (96%)
34 hospitals (low volume)performed
<15 annual average breast cancer surgeries.
n = 571 (4%)
Number of women who did not receive surgery
n = 1,291 (9%)
10 hospitals performed an
annual average of between 4 &
14 breast cancer
surgeries.
24 hospitals performed and annual average of <4 breast
cancer surgeries.
*Refer to appendix for definition of definitive surgery
4
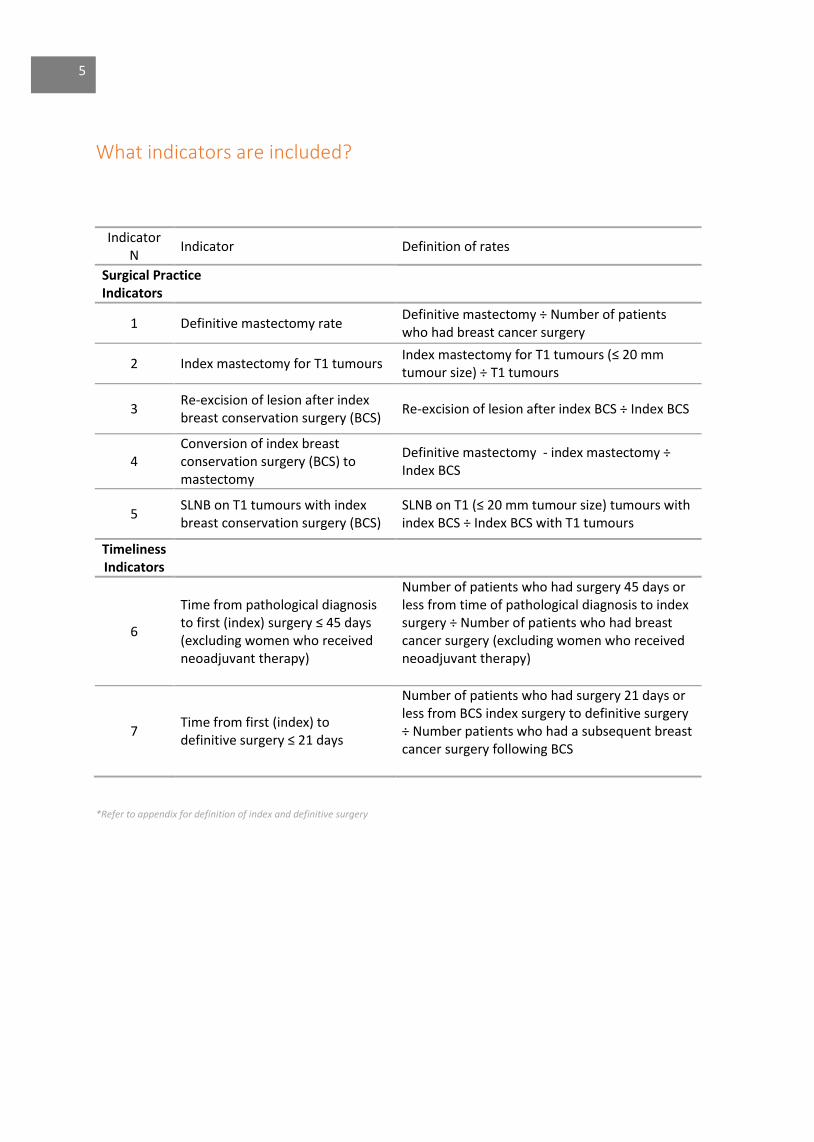
What indicators are included?
Indicator N
Indicator Definition of rates
Surgical Practice Indicators
1 Definitive mastectomy rate Definitive mastectomy ÷ Number of patients who had breast cancer surgery
2 Index mastectomy for T1 tumours Index mastectomy for T1 tumours (≤ 20 mm tumour size) ÷ T1 tumours
3 Re-excision of lesion after index breast conservation surgery (BCS)
Re-excision of lesion after index BCS ÷ Index BCS
4 Conversion of index breast conservation surgery (BCS) to mastectomy
Definitive mastectomy - index mastectomy ÷ Index BCS
5 SLNB on T1 tumours with index breast conservation surgery (BCS)
SLNB on T1 (≤ 20 mm tumour size) tumours with index BCS ÷ Index BCS with T1 tumours
Timeliness Indicators
6
Time from pathological diagnosis to first (index) surgery ≤ 45 days (excluding women who received neoadjuvant therapy)
Number of patients who had surgery 45 days or less from time of pathological diagnosis to index surgery ÷ Number of patients who had breast cancer surgery (excluding women who received neoadjuvant therapy)
7 Time from first (index) to definitive surgery ≤ 21 days
Number of patients who had surgery 21 days or less from BCS index surgery to definitive surgery ÷ Number patients who had a subsequent breast cancer surgery following BCS
*Refer to appendix for definition of index and definitive surgery
5
Key Findings
· Incidence of breast cancer in Queensland women continued to increase over the years 2004 to
2013. The age standardised rate of female breast cancer incidence in 2013 was 130 (per 100,000
females) compared to 115.7 (per 100,000 females) in 2004.
· During the decade analysed in this report survival for women with breast cancer has improved
from 89% for years 2004-2008 to 91% in 2009-2013. Improvements in survival are likely to be
due to more effective anti-cancer treatments together with the participation in population
based breast screening.
· The definitive BCS rate for Queensland women has decreased from 60% in 2004 to 55% in 2013.
· Breast cancer surgery was carried out in over 70 Queensland public and private hospitals who
performed between 1 and 345 definitive surgeries annually from 2009 to 2013.
· Across Queensland 34 public and private hospitals performed an annual average of < 15
definitive breast cancer surgeries. These have been grouped as low volume hospitals.
· There is significant variation in adjusted rates from the Queensland average for the 7 breast
cancer surgical practice indicators.
· Variation is most notable for index mastectomy for T1 tumours (6%-43%) across all hospitals
performing breast cancer surgery in Queensland.
· The Queensland average sentinel lymph node biopsy rate for the surgical management of early-
stage (T1) breast cancer across all hospitals is 84%.
· Time to receiving surgery within 45 days from histological diagnosis is substantially different
between public (81%) and private (94%) hospitals.
6

1.0 Incidence and Mortality
Figure 1.0a: Queensland female invasive breast cancer incidence ASR trends 2004 - 2013
ASR –Age standardised rate - Australian population in 2001 Source: Oncology Analysis System (OASys), Queensland Cancer Control Analysis Team
Figure 1.0b: Queensland female invasive breast cancer mortality ASR trends 2004 - 2013
ASR –Age standardised rate - Australian population in 2001 Source: Oncology Analysis System (OASys), Queensland Cancer Control Analysis Team
100
110
120
130
140
2004 2005 2006 2007 2008 2009 2010 2011 2012 2013
Au
st -
ASR
per
10
0,0
00
Year of Diagnosis
Incidence
Linear(Incidence)
0
10
20
30
2004 2005 2006 2007 2008 2009 2010 2011 2012 2013
Au
st -
ASR
per
10
0,0
00
Year of Diagnosis
Mortality
Linear(Mortality)
7
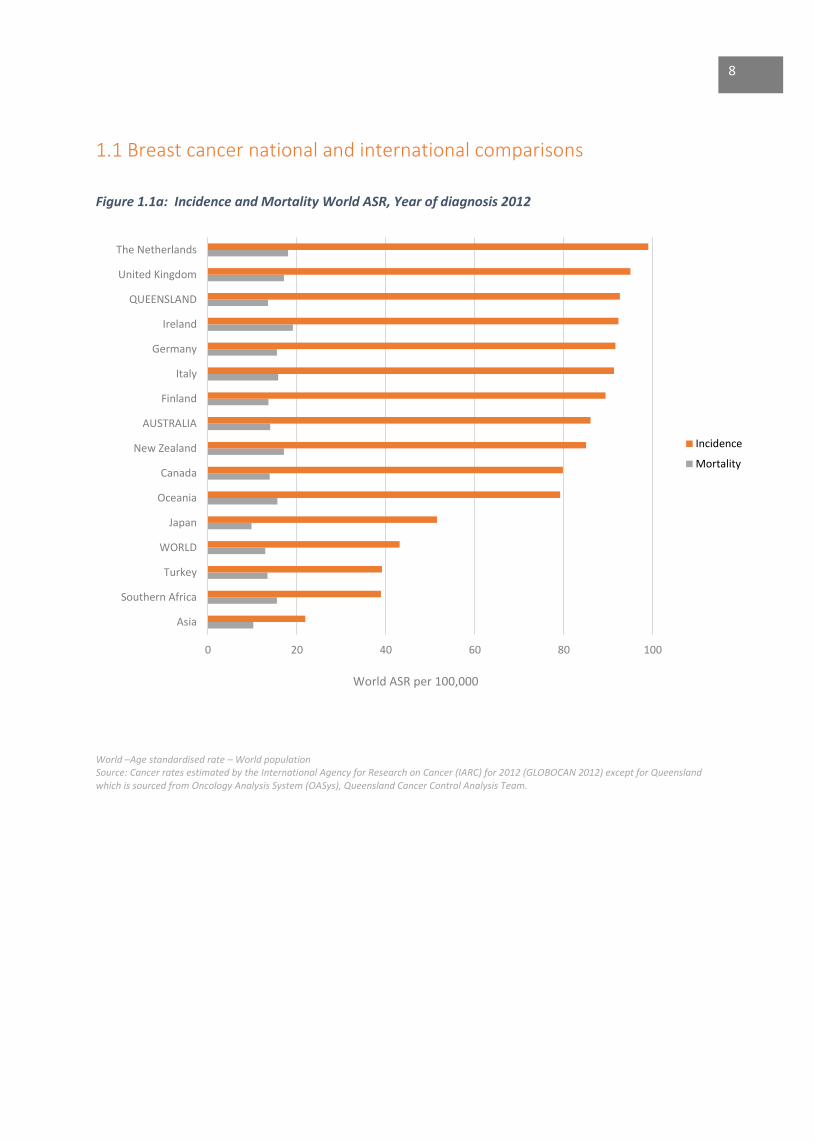
1.1 Breast cancer national and international comparisons
Figure 1.1a: Incidence and Mortality World ASR, Year of diagnosis 2012
World –Age standardised rate – World population Source: Cancer rates estimated by the International Agency for Research on Cancer (IARC) for 2012 (GLOBOCAN 2012) except for Queensland which is sourced from Oncology Analysis System (OASys), Queensland Cancer Control Analysis Team.
0 20 40 60 80 100
Asia
Southern Africa
Turkey
WORLD
Japan
Oceania
Canada
New Zealand
AUSTRALIA
Finland
Italy
Germany
Ireland
QUEENSLAND
United Kingdom
The Netherlands
World ASR per 100,000
Incidence
Mortality
8
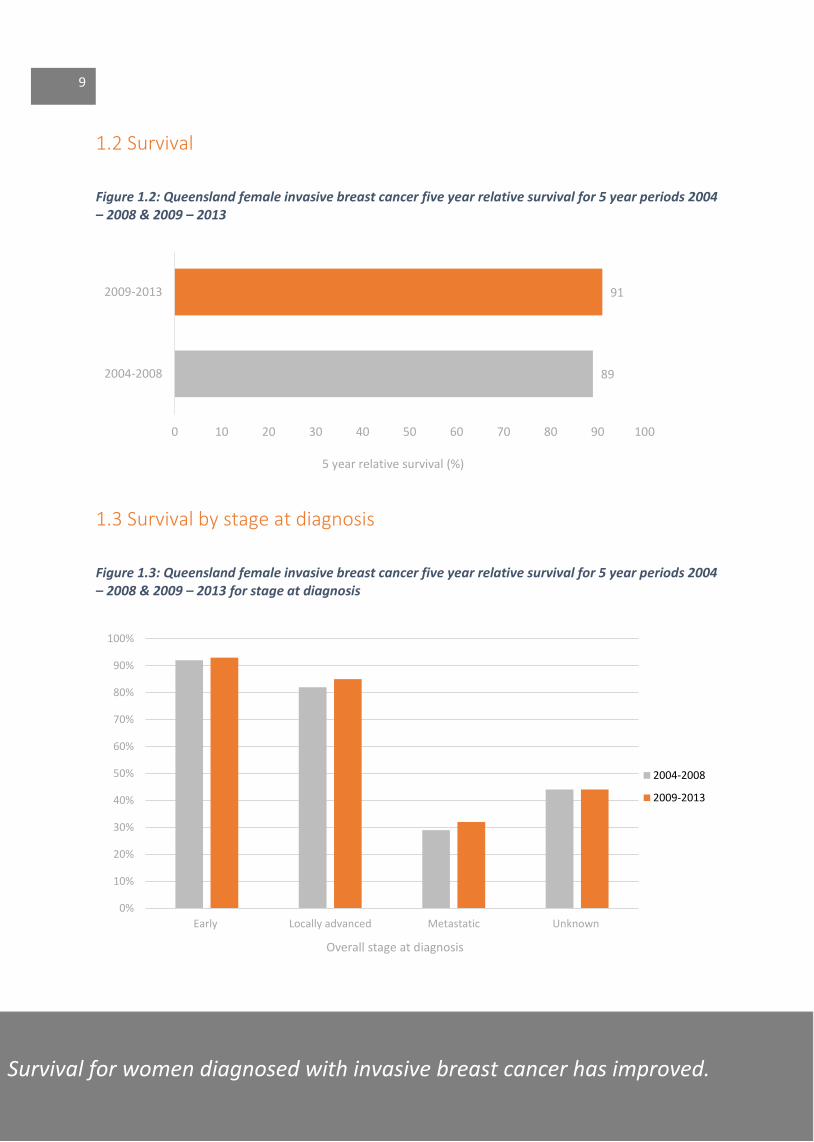
1.2 Survival
Figure 1.2: Queensland female invasive breast cancer five year relative survival for 5 year periods 2004 – 2008 & 2009 – 2013
1.3 Survival by stage at diagnosis
Figure 1.3: Queensland female invasive breast cancer five year relative survival for 5 year periods 2004 – 2008 & 2009 – 2013 for stage at diagnosis
89
91
0 10 20 30 40 50 60 70 80 90 100
2004-2008
2009-2013
5 year relative survival (%)
0%
10%
20%
30%
40%
50%
60%
70%
80%
90%
100%
Early Locally advanced Metastatic Unknown
Overall stage at diagnosis
2004-2008
2009-2013
Survival for women diagnosed with invasive breast cancer has improved.
9


2.0 Definitive surgery
Figure 2: Queensland female breast cancer definitive surgery change over time for BCS and Mastectomy 2004 – 2013
0%
20%
40%
60%
80%
100%
0
400
800
1,200
1,600
2,000
2004 2005 2006 2007 2008 2009 2010 2011 2012 2013
Nu
mb
er o
f b
reas
t ca
nce
r su
rger
ies
Year of diagnosis
BCS - Number
Mastectomy -Number
Linear (BCS %)
Linear (Mastectomy%)
10
The definitive breast conserving surgery rate for Queensland women has decreased.
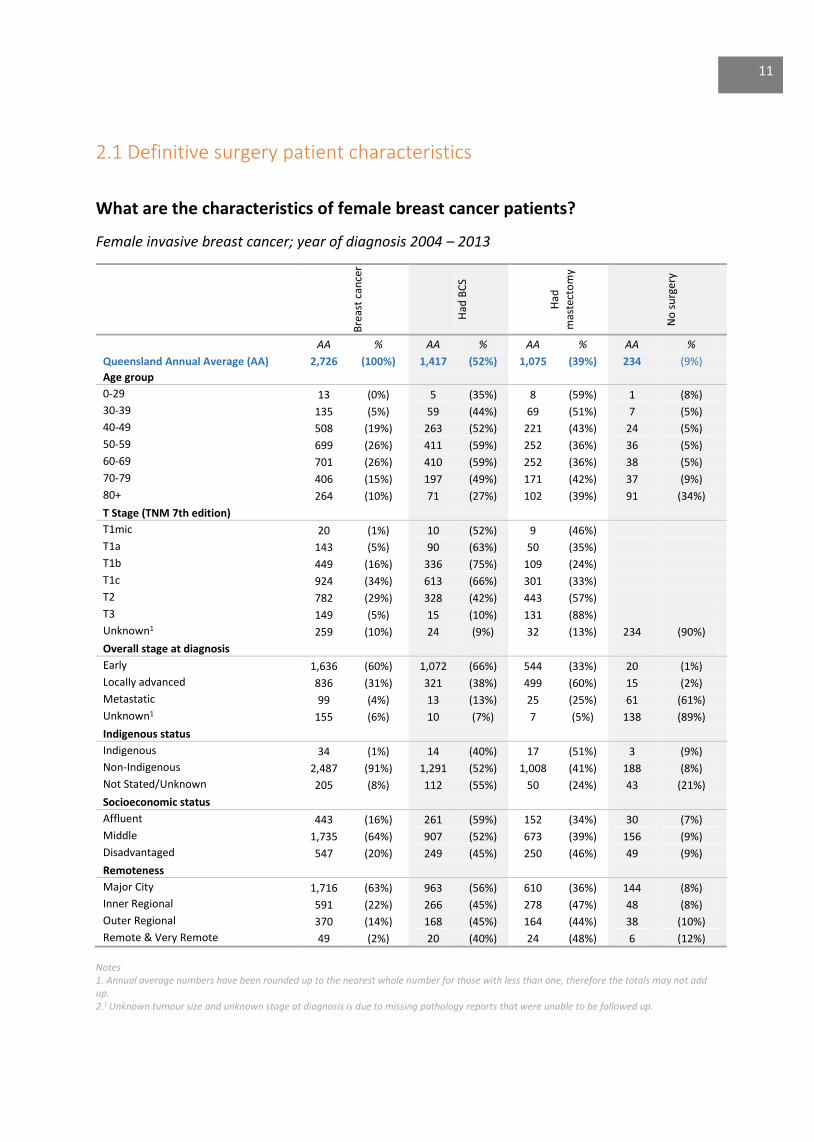
2.1 Definitive surgery patient characteristics
What are the characteristics of female breast cancer patients?
Female invasive breast cancer; year of diagnosis 2004 – 2013
Bre
ast
can
cer
Had
BC
S
Had
mas
tect
om
y
No
su
rge
ry
AA % AA % AA % AA %
Queensland Annual Average (AA) 2,726 (100%) 1,417 (52%) 1,075 (39%) 234 (9%)
Age group
0-29 13 (0%) 5 (35%) 8 (59%) 1 (8%)
30-39 135 (5%) 59 (44%) 69 (51%) 7 (5%)
40-49 508 (19%) 263 (52%) 221 (43%) 24 (5%)
50-59 699 (26%) 411 (59%) 252 (36%) 36 (5%)
60-69 701 (26%) 410 (59%) 252 (36%) 38 (5%)
70-79 406 (15%) 197 (49%) 171 (42%) 37 (9%)
80+ 264 (10%) 71 (27%) 102 (39%) 91 (34%)
T Stage (TNM 7th edition)
T1mic 20 (1%) 10 (52%) 9 (46%)
T1a 143 (5%) 90 (63%) 50 (35%)
T1b 449 (16%) 336 (75%) 109 (24%)
T1c 924 (34%) 613 (66%) 301 (33%)
T2 782 (29%) 328 (42%) 443 (57%)
T3 149 (5%) 15 (10%) 131 (88%)
Unknown1 259 (10%) 24 (9%) 32 (13%) 234 (90%)
Overall stage at diagnosis
Early 1,636 (60%) 1,072 (66%) 544 (33%) 20 (1%)
Locally advanced 836 (31%) 321 (38%) 499 (60%) 15 (2%)
Metastatic 99 (4%) 13 (13%) 25 (25%) 61 (61%)
Unknown1 155 (6%) 10 (7%) 7 (5%) 138 (89%)
Indigenous status
Indigenous 34 (1%) 14 (40%) 17 (51%) 3 (9%)
Non-Indigenous 2,487 (91%) 1,291 (52%) 1,008 (41%) 188 (8%)
Not Stated/Unknown 205 (8%) 112 (55%) 50 (24%) 43 (21%)
Socioeconomic status
Affluent 443 (16%) 261 (59%) 152 (34%) 30 (7%)
Middle 1,735 (64%) 907 (52%) 673 (39%) 156 (9%)
Disadvantaged 547 (20%) 249 (45%) 250 (46%) 49 (9%)
Remoteness
Major City 1,716 (63%) 963 (56%) 610 (36%) 144 (8%)
Inner Regional 591 (22%) 266 (45%) 278 (47%) 48 (8%)
Outer Regional 370 (14%) 168 (45%) 164 (44%) 38 (10%)
Remote & Very Remote 49 (2%) 20 (40%) 24 (48%) 6 (12%)
Notes 1. Annual average numbers have been rounded up to the nearest whole number for those with less than one, therefore the totals may not add up. 2.1 Unknown tumour size and unknown stage at diagnosis is due to missing pathology reports that were unable to be followed up.
11
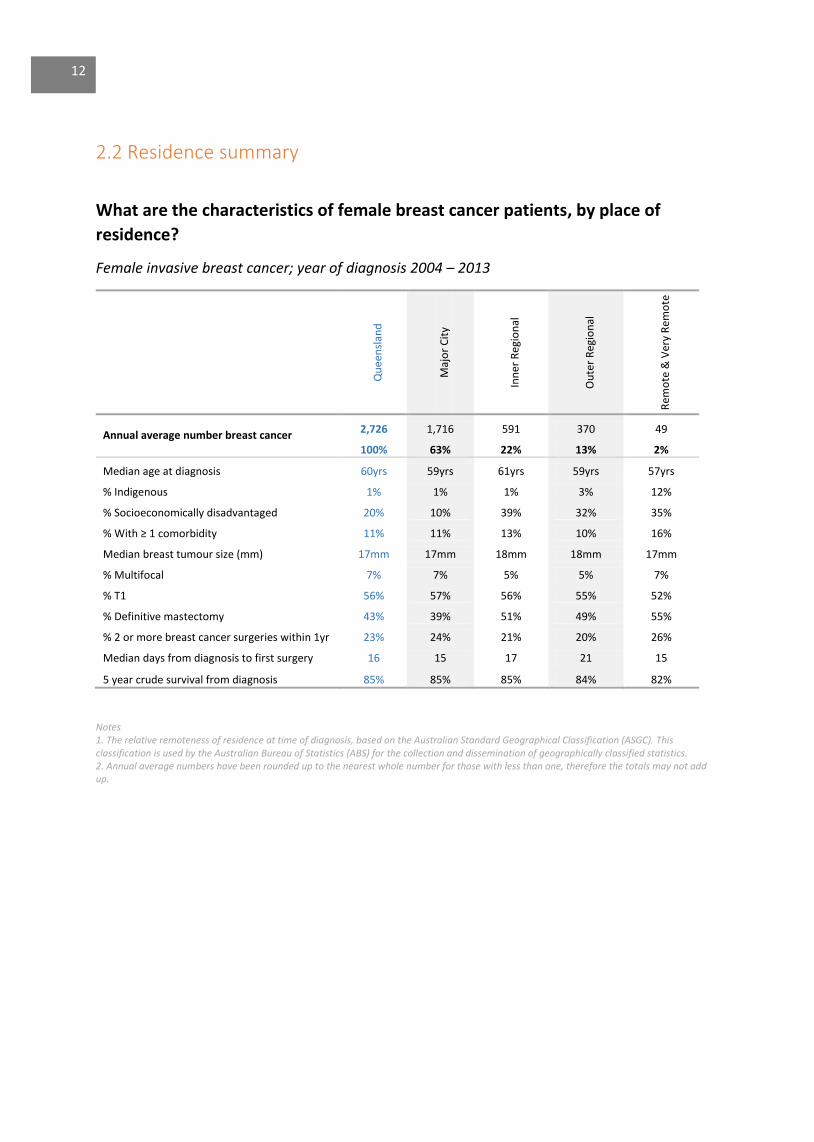
2.2 Residence summary
What are the characteristics of female breast cancer patients, by place of
residence?
Female invasive breast cancer; year of diagnosis 2004 – 2013
Qu
een
slan
d
Maj
or
Cit
y
Inn
er R
egio
nal
Ou
ter
Reg
ion
al
Rem
ote
& V
ery
Rem
ote
Annual average number breast cancer
2,726 1,716 591 370 49
100% 63% 22% 13% 2%
Median age at diagnosis 60yrs 59yrs 61yrs 59yrs 57yrs
% Indigenous 1% 1% 1% 3% 12%
% Socioeconomically disadvantaged 20% 10% 39% 32% 35%
% With ≥ 1 comorbidity 11% 11% 13% 10% 16%
Median breast tumour size (mm) 17mm 17mm 18mm 18mm 17mm
% Multifocal 7% 7% 5% 5% 7%
% T1 56% 57% 56% 55% 52%
% Definitive mastectomy 43% 39% 51% 49% 55%
% 2 or more breast cancer surgeries within 1yr 23% 24% 21% 20% 26%
Median days from diagnosis to first surgery 16 15 17 21 15
5 year crude survival from diagnosis 85% 85% 85% 84% 82%
Notes 1. The relative remoteness of residence at time of diagnosis, based on the Australian Standard Geographical Classification (ASGC). This classification is used by the Australian Bureau of Statistics (ABS) for the collection and dissemination of geographically classified statistics. 2. Annual average numbers have been rounded up to the nearest whole number for those with less than one, therefore the totals may not add up.
12

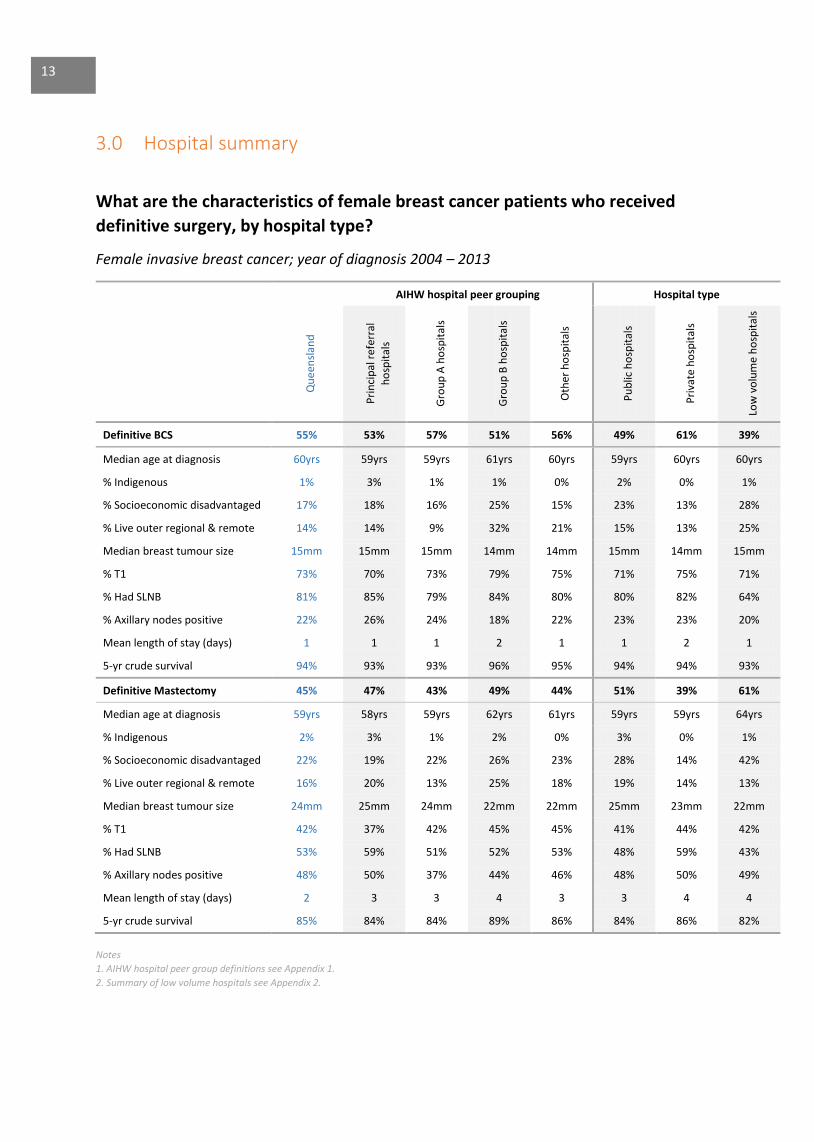
3.0 Hospital summary
What are the characteristics of female breast cancer patients who received
definitive surgery, by hospital type?
Female invasive breast cancer; year of diagnosis 2004 – 2013
AIHW hospital peer grouping Hospital type
Qu
een
slan
d
Pri
nci
pal
ref
erra
l
ho
spit
als
Gro
up
A h
osp
ital
s
Gro
up
B h
osp
ital
s
Oth
er h
osp
ital
s
Pu
blic
ho
spit
als
Pri
vate
ho
spit
als
Low
vo
lum
e h
osp
ital
s
Definitive BCS 55% 53% 57% 51% 56% 49% 61% 39%
Median age at diagnosis 60yrs 59yrs 59yrs 61yrs 60yrs 59yrs 60yrs 60yrs
% Indigenous 1% 3% 1% 1% 0% 2% 0% 1%
% Socioeconomic disadvantaged 17% 18% 16% 25% 15% 23% 13% 28%
% Live outer regional & remote 14% 14% 9% 32% 21% 15% 13% 25%
Median breast tumour size 15mm 15mm 15mm 14mm 14mm 15mm 14mm 15mm
% T1 73% 70% 73% 79% 75% 71% 75% 71%
% Had SLNB 81% 85% 79% 84% 80% 80% 82% 64%
% Axillary nodes positive 22% 26% 24% 18% 22% 23% 23% 20%
Mean length of stay (days) 1 1 1 2 1 1 2 1
5-yr crude survival 94% 93% 93% 96% 95% 94% 94% 93%
Definitive Mastectomy 45% 47% 43% 49% 44% 51% 39% 61%
Median age at diagnosis 59yrs 58yrs 59yrs 62yrs 61yrs 59yrs 59yrs 64yrs
% Indigenous 2% 3% 1% 2% 0% 3% 0% 1%
% Socioeconomic disadvantaged 22% 19% 22% 26% 23% 28% 14% 42%
% Live outer regional & remote 16% 20% 13% 25% 18% 19% 14% 13%
Median breast tumour size 24mm 25mm 24mm 22mm 22mm 25mm 23mm 22mm
% T1 42% 37% 42% 45% 45% 41% 44% 42%
% Had SLNB 53% 59% 51% 52% 53% 48% 59% 43%
% Axillary nodes positive 48% 50% 37% 44% 46% 48% 50% 49%
Mean length of stay (days) 2 3 3 4 3 3 4 4
5-yr crude survival 85% 84% 84% 89% 86% 84% 86% 82%
Notes
1. AIHW hospital peer group definitions see Appendix 1.
2. Summary of low volume hospitals see Appendix 2.
13

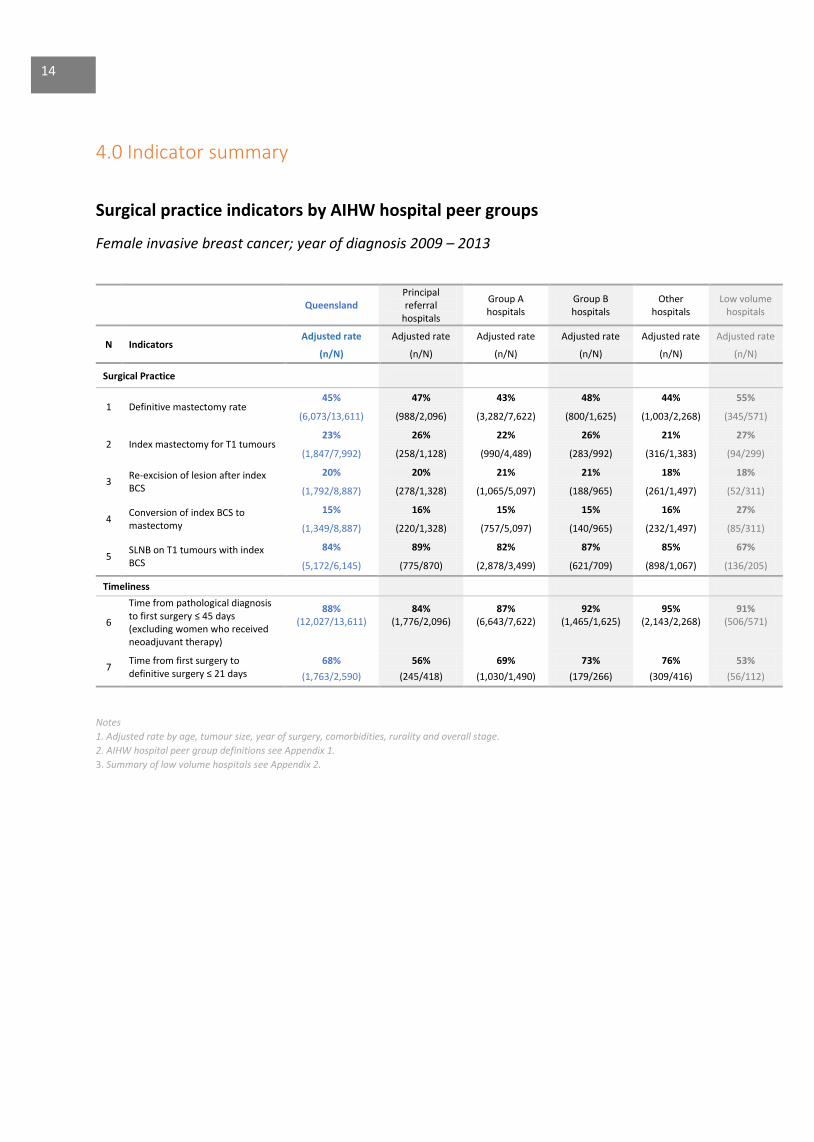
4.0 Indicator summary
Surgical practice indicators by AIHW hospital peer groups
Female invasive breast cancer; year of diagnosis 2009 – 2013
Queensland
Principal referral
hospitals
Group A hospitals
Group B hospitals
Other hospitals
Low volume hospitals
N Indicators Adjusted rate Adjusted rate Adjusted rate Adjusted rate Adjusted rate Adjusted rate
(n/N) (n/N) (n/N) (n/N) (n/N) (n/N)
Surgical Practice
1 Definitive mastectomy rate 45% 47% 43% 48% 44% 55%
(6,073/13,611) (988/2,096) (3,282/7,622) (800/1,625) (1,003/2,268) (345/571)
2 Index mastectomy for T1 tumours 23% 26% 22% 26% 21% 27%
(1,847/7,992) (258/1,128) (990/4,489) (283/992) (316/1,383) (94/299)
3 Re-excision of lesion after index BCS
20% 20% 21% 21% 18% 18%
(1,792/8,887) (278/1,328) (1,065/5,097) (188/965) (261/1,497) (52/311)
4 Conversion of index BCS to mastectomy
15% 16% 15% 15% 16% 27%
(1,349/8,887) (220/1,328) (757/5,097) (140/965) (232/1,497) (85/311)
5 SLNB on T1 tumours with index BCS
84% 89% 82% 87% 85% 67%
(5,172/6,145) (775/870) (2,878/3,499) (621/709) (898/1,067) (136/205)
Timeliness
6
Time from pathological diagnosis to first surgery ≤ 45 days (excluding women who received neoadjuvant therapy)
88% 84% 87% 92% 95% 91% (12,027/13,611) (1,776/2,096) (6,643/7,622) (1,465/1,625) (2,143/2,268) (506/571)
7 Time from first surgery to definitive surgery ≤ 21 days
68% 56% 69% 73% 76% 53%
(1,763/2,590) (245/418) (1,030/1,490) (179/266) (309/416) (56/112)
Notes
1. Adjusted rate by age, tumour size, year of surgery, comorbidities, rurality and overall stage.
2. AIHW hospital peer group definitions see Appendix 1.
3. Summary of low volume hospitals see Appendix 2.
14
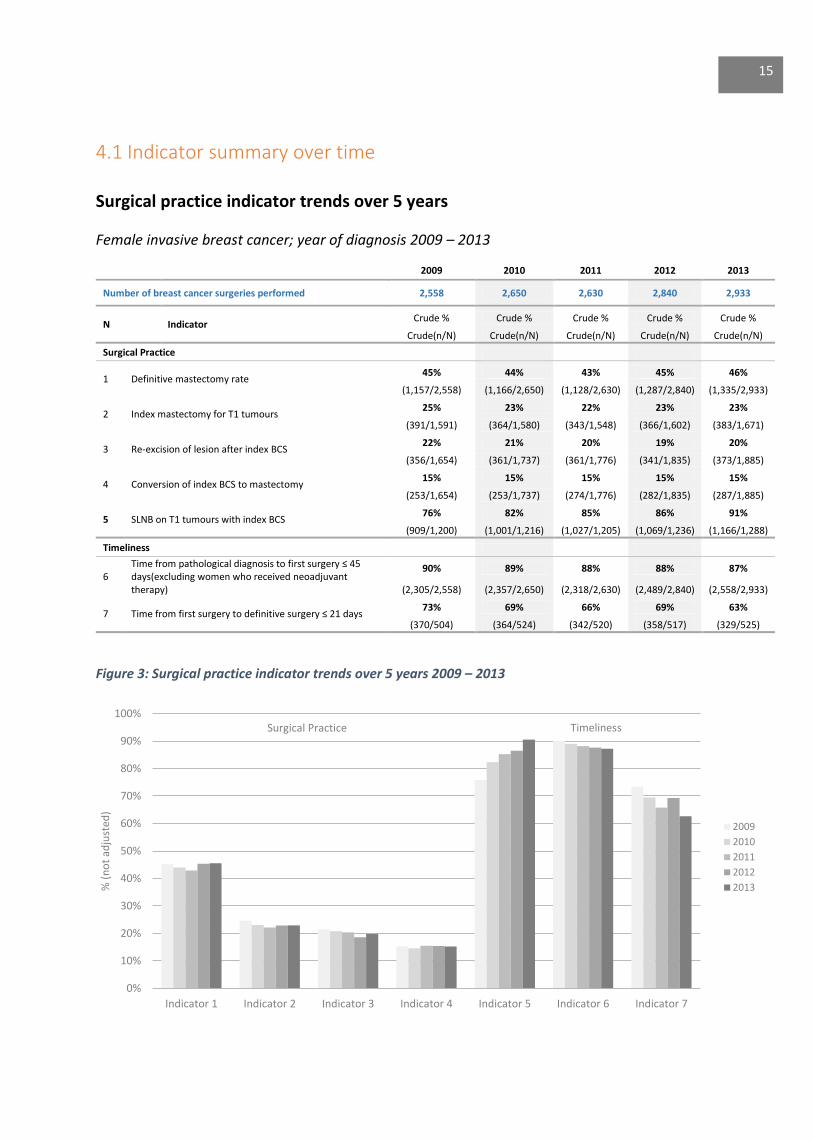
4.1 Indicator summary over time Surgical practice indicator trends over 5 years
Female invasive breast cancer; year of diagnosis 2009 – 2013
2009 2010 2011 2012 2013
Number of breast cancer surgeries performed 2,558 2,650 2,630 2,840 2,933
N Indicator Crude % Crude % Crude % Crude % Crude %
Crude(n/N) Crude(n/N) Crude(n/N) Crude(n/N) Crude(n/N)
Surgical Practice
1 Definitive mastectomy rate 45% 44% 43% 45% 46%
(1,157/2,558) (1,166/2,650) (1,128/2,630) (1,287/2,840) (1,335/2,933)
2 Index mastectomy for T1 tumours 25% 23% 22% 23% 23%
(391/1,591) (364/1,580) (343/1,548) (366/1,602) (383/1,671)
3 Re-excision of lesion after index BCS 22% 21% 20% 19% 20%
(356/1,654) (361/1,737) (361/1,776) (341/1,835) (373/1,885)
4 Conversion of index BCS to mastectomy 15% 15% 15% 15% 15%
(253/1,654) (253/1,737) (274/1,776) (282/1,835) (287/1,885)
5 SLNB on T1 tumours with index BCS 76% 82% 85% 86% 91%
(909/1,200) (1,001/1,216) (1,027/1,205) (1,069/1,236) (1,166/1,288)
Timeliness
6 Time from pathological diagnosis to first surgery ≤ 45 days(excluding women who received neoadjuvant therapy)
90% 89% 88% 88% 87%
(2,305/2,558) (2,357/2,650) (2,318/2,630) (2,489/2,840) (2,558/2,933)
7 Time from first surgery to definitive surgery ≤ 21 days 73% 69% 66% 69% 63%
(370/504) (364/524) (342/520) (358/517) (329/525)
Figure 3: Surgical practice indicator trends over 5 years 2009 – 2013
0%
10%
20%
30%
40%
50%
60%
70%
80%
90%
100%
Indicator 1 Indicator 2 Indicator 3 Indicator 4 Indicator 5 Indicator 6 Indicator 7
% (
no
t ad
just
ed)
2009
2010
2011
2012
2013
15
Surgical Practice Timeliness
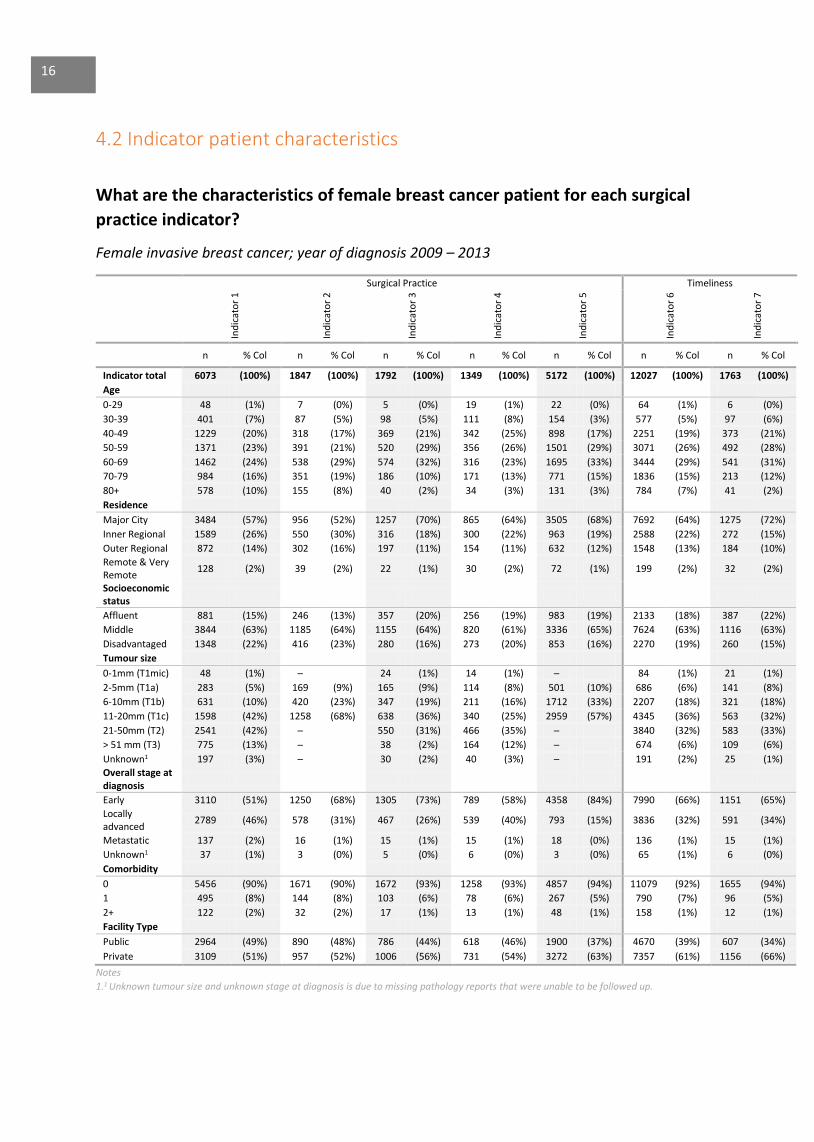
4.2 Indicator patient characteristics
What are the characteristics of female breast cancer patient for each surgical
practice indicator?
Female invasive breast cancer; year of diagnosis 2009 – 2013
Surgical Practice Timeliness
Ind
icat
or
1
Ind
icat
or
2
Ind
icat
or
3
Ind
icat
or
4
Ind
icat
or
5
Ind
icat
or
6
Ind
icat
or
7
n % Col n % Col n % Col n % Col n % Col n % Col n % Col
Indicator total 6073 (100%) 1847 (100%) 1792 (100%) 1349 (100%) 5172 (100%) 12027 (100%) 1763 (100%)
Age
0-29 48 (1%) 7 (0%) 5 (0%) 19 (1%) 22 (0%) 64 (1%) 6 (0%)
30-39 401 (7%) 87 (5%) 98 (5%) 111 (8%) 154 (3%) 577 (5%) 97 (6%)
40-49 1229 (20%) 318 (17%) 369 (21%) 342 (25%) 898 (17%) 2251 (19%) 373 (21%)
50-59 1371 (23%) 391 (21%) 520 (29%) 356 (26%) 1501 (29%) 3071 (26%) 492 (28%)
60-69 1462 (24%) 538 (29%) 574 (32%) 316 (23%) 1695 (33%) 3444 (29%) 541 (31%)
70-79 984 (16%) 351 (19%) 186 (10%) 171 (13%) 771 (15%) 1836 (15%) 213 (12%)
80+ 578 (10%) 155 (8%) 40 (2%) 34 (3%) 131 (3%) 784 (7%) 41 (2%)
Residence
Major City 3484 (57%) 956 (52%) 1257 (70%) 865 (64%) 3505 (68%) 7692 (64%) 1275 (72%)
Inner Regional 1589 (26%) 550 (30%) 316 (18%) 300 (22%) 963 (19%) 2588 (22%) 272 (15%)
Outer Regional 872 (14%) 302 (16%) 197 (11%) 154 (11%) 632 (12%) 1548 (13%) 184 (10%)
Remote & Very Remote
128 (2%) 39 (2%) 22 (1%) 30 (2%) 72 (1%) 199 (2%) 32 (2%)
Socioeconomic status
Affluent 881 (15%) 246 (13%) 357 (20%) 256 (19%) 983 (19%) 2133 (18%) 387 (22%)
Middle 3844 (63%) 1185 (64%) 1155 (64%) 820 (61%) 3336 (65%) 7624 (63%) 1116 (63%)
Disadvantaged 1348 (22%) 416 (23%) 280 (16%) 273 (20%) 853 (16%) 2270 (19%) 260 (15%)
Tumour size
0-1mm (T1mic) 48 (1%) ─ 24 (1%) 14 (1%) ─ 84 (1%) 21 (1%)
2-5mm (T1a) 283 (5%) 169 (9%) 165 (9%) 114 (8%) 501 (10%) 686 (6%) 141 (8%)
6-10mm (T1b) 631 (10%) 420 (23%) 347 (19%) 211 (16%) 1712 (33%) 2207 (18%) 321 (18%)
11-20mm (T1c) 1598 (42%) 1258 (68%) 638 (36%) 340 (25%) 2959 (57%) 4345 (36%) 563 (32%)
21-50mm (T2) 2541 (42%) ─ 550 (31%) 466 (35%) ─ 3840 (32%) 583 (33%)
> 51 mm (T3) 775 (13%) ─ 38 (2%) 164 (12%) ─ 674 (6%) 109 (6%)
Unknown1 197 (3%) ─ 30 (2%) 40 (3%) ─ 191 (2%) 25 (1%)
Overall stage at diagnosis
Early 3110 (51%) 1250 (68%) 1305 (73%) 789 (58%) 4358 (84%) 7990 (66%) 1151 (65%)
Locally advanced
2789 (46%) 578 (31%) 467 (26%) 539 (40%) 793 (15%) 3836 (32%) 591 (34%)
Metastatic 137 (2%) 16 (1%) 15 (1%) 15 (1%) 18 (0%) 136 (1%) 15 (1%)
Unknown1 37 (1%) 3 (0%) 5 (0%) 6 (0%) 3 (0%) 65 (1%) 6 (0%)
Comorbidity
0 5456 (90%) 1671 (90%) 1672 (93%) 1258 (93%) 4857 (94%) 11079 (92%) 1655 (94%)
1 495 (8%) 144 (8%) 103 (6%) 78 (6%) 267 (5%) 790 (7%) 96 (5%)
2+ 122 (2%) 32 (2%) 17 (1%) 13 (1%) 48 (1%) 158 (1%) 12 (1%)
Facility Type
Public 2964 (49%) 890 (48%) 786 (44%) 618 (46%) 1900 (37%) 4670 (39%) 607 (34%)
Private 3109 (51%) 957 (52%) 1006 (56%) 731 (54%) 3272 (63%) 7357 (61%) 1156 (66%)
Notes
1.1 Unknown tumour size and unknown stage at diagnosis is due to missing pathology reports that were unable to be followed up.
16
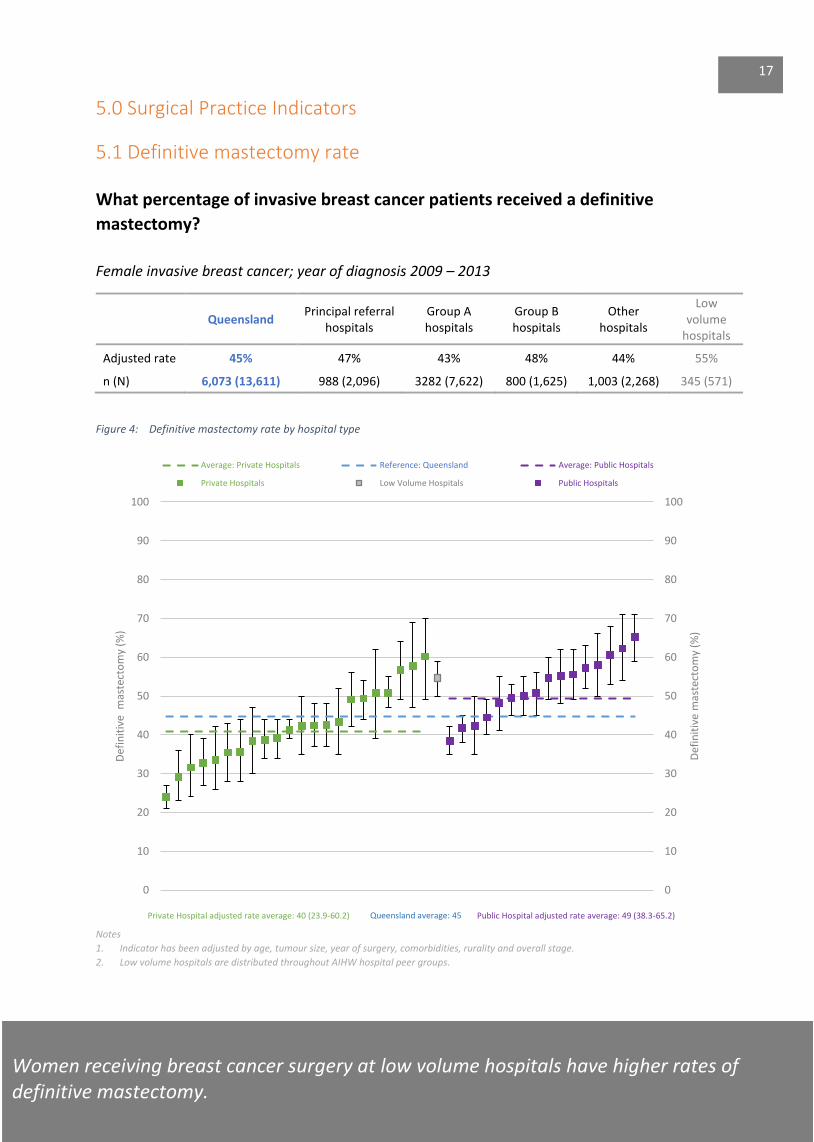
5.0 Surgical Practice Indicators
5.1 Definitive mastectomy rate
What percentage of invasive breast cancer patients received a definitive
mastectomy?
Female invasive breast cancer; year of diagnosis 2009 – 2013
Queensland Principal referral
hospitals Group A hospitals
Group B hospitals
Other hospitals
Low volume
hospitals
Adjusted rate 45% 47% 43% 48% 44% 55%
n (N) 6,073 (13,611) 988 (2,096) 3282 (7,622) 800 (1,625) 1,003 (2,268) 345 (571)
Figure 4: Definitive mastectomy rate by hospital type
Notes
1. Indicator has been adjusted by age, tumour size, year of surgery, comorbidities, rurality and overall stage.
2. Low volume hospitals are distributed throughout AIHW hospital peer groups.
0
10
20
30
40
50
60
70
80
90
100
0
10
20
30
40
50
60
70
80
90
100
Def
init
ive
mas
tect
om
y (%
)
Def
init
ive
mas
tect
om
y (%
)
Average: Private Hospitals Reference: Queensland Average: Public Hospitals
Private Hospitals Low Volume Hospitals Public Hospitals
Queensland average: 45
Women receiving breast cancer surgery at low volume hospitals have higher rates of definitive mastectomy.
17
Private Hospital adjusted rate average: 40 (23.9-60.2) Public Hospital adjusted rate average: 49 (38.3-65.2)
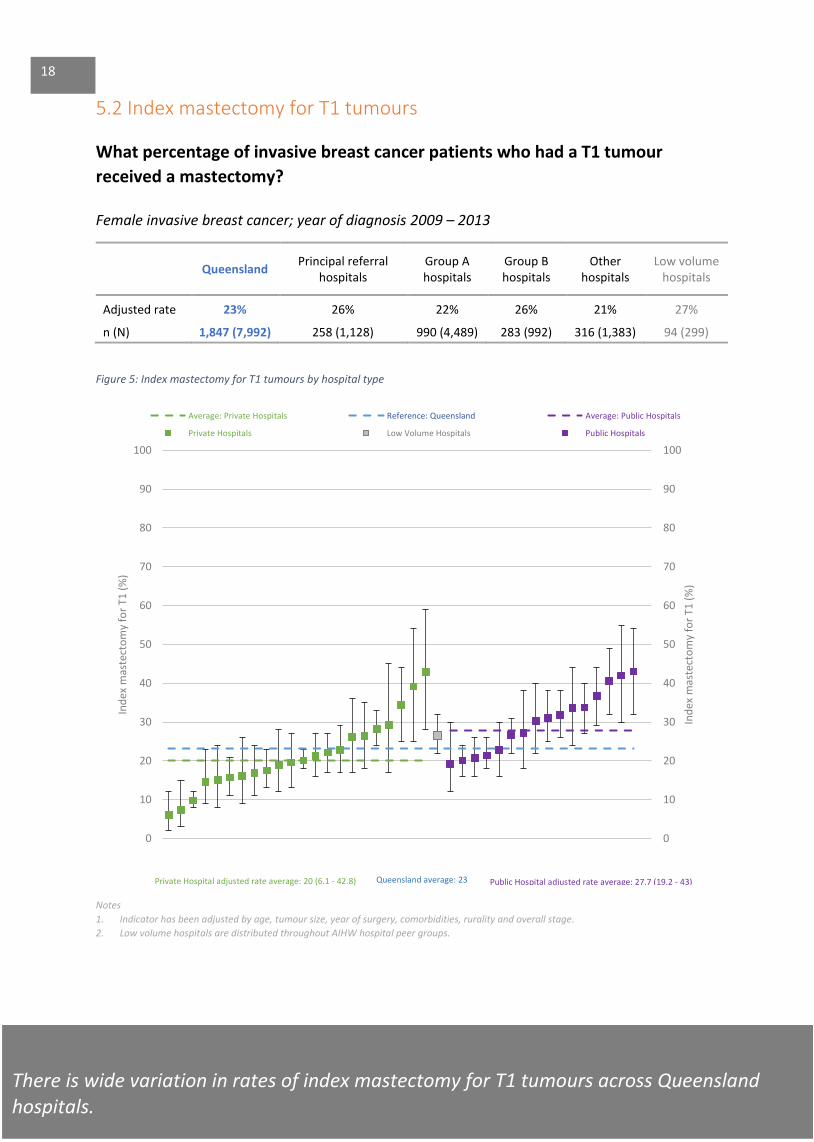
5.2 Index mastectomy for T1 tumours
What percentage of invasive breast cancer patients who had a T1 tumour
received a mastectomy?
Female invasive breast cancer; year of diagnosis 2009 – 2013
Queensland Principal referral
hospitals Group A hospitals
Group B hospitals
Other hospitals
Low volume hospitals
Adjusted rate 23% 26% 22% 26% 21% 27%
n (N) 1,847 (7,992) 258 (1,128) 990 (4,489) 283 (992) 316 (1,383) 94 (299)
Figure 5: Index mastectomy for T1 tumours by hospital type
Notes
1. Indicator has been adjusted by age, tumour size, year of surgery, comorbidities, rurality and overall stage.
2. Low volume hospitals are distributed throughout AIHW hospital peer groups.
0
10
20
30
40
50
60
70
80
90
100
0
10
20
30
40
50
60
70
80
90
100
Ind
ex m
aste
cto
my
for
T1 (
%)
Ind
ex m
aste
cto
my
for
T1 (
%)
Average: Private Hospitals Reference: Queensland Average: Public Hospitals
Private Hospitals Low Volume Hospitals Public Hospitals
Private Hospital adjusted rate average: 20 (6.1 - 42.8)
There is wide variation in rates of index mastectomy for T1 tumours across Queensland hospitals.
Queensland average: 23 Public Hospital adjusted rate average: 27.7 (19.2 - 43)
18
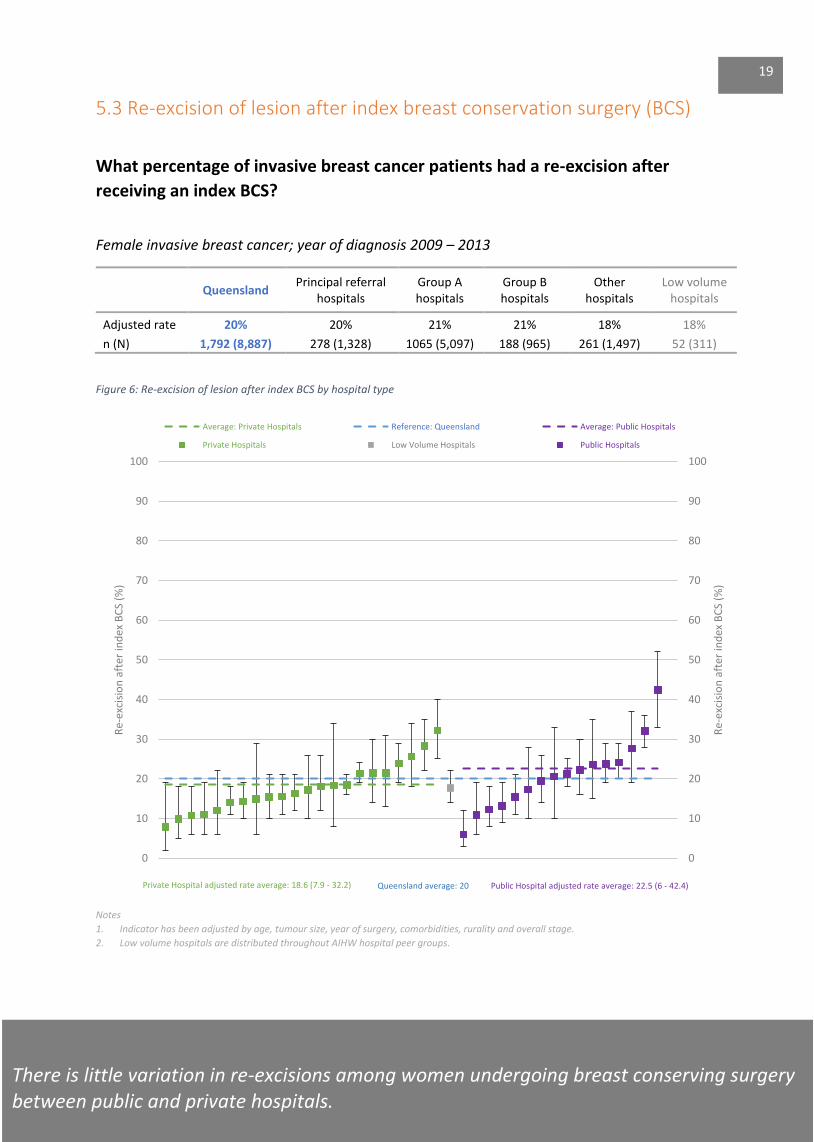
5.3 Re-excision of lesion after index breast conservation surgery (BCS)
What percentage of invasive breast cancer patients had a re-excision after
receiving an index BCS?
Female invasive breast cancer; year of diagnosis 2009 – 2013
Queensland Principal referral
hospitals Group A hospitals
Group B hospitals
Other hospitals
Low volume hospitals
Adjusted rate 20% 20% 21% 21% 18% 18%
n (N) 1,792 (8,887) 278 (1,328) 1065 (5,097) 188 (965) 261 (1,497) 52 (311)
Figure 6: Re-excision of lesion after index BCS by hospital type
Notes
1. Indicator has been adjusted by age, tumour size, year of surgery, comorbidities, rurality and overall stage.
2. Low volume hospitals are distributed throughout AIHW hospital peer groups.
0
10
20
30
40
50
60
70
80
90
100
0
10
20
30
40
50
60
70
80
90
100
Re-
exci
sio
n a
fter
ind
ex B
CS
(%)
Re-
exci
sio
n a
fter
ind
ex B
CS
(%)
Average: Private Hospitals Reference: Queensland Average: Public Hospitals
Private Hospitals Low Volume Hospitals Public Hospitals
Queensland average: 20
There is little variation in re-excisions among women undergoing breast conserving surgery between public and private hospitals.
Private Hospital adjusted rate average: 18.6 (7.9 - 32.2) Public Hospital adjusted rate average: 22.5 (6 - 42.4)
19
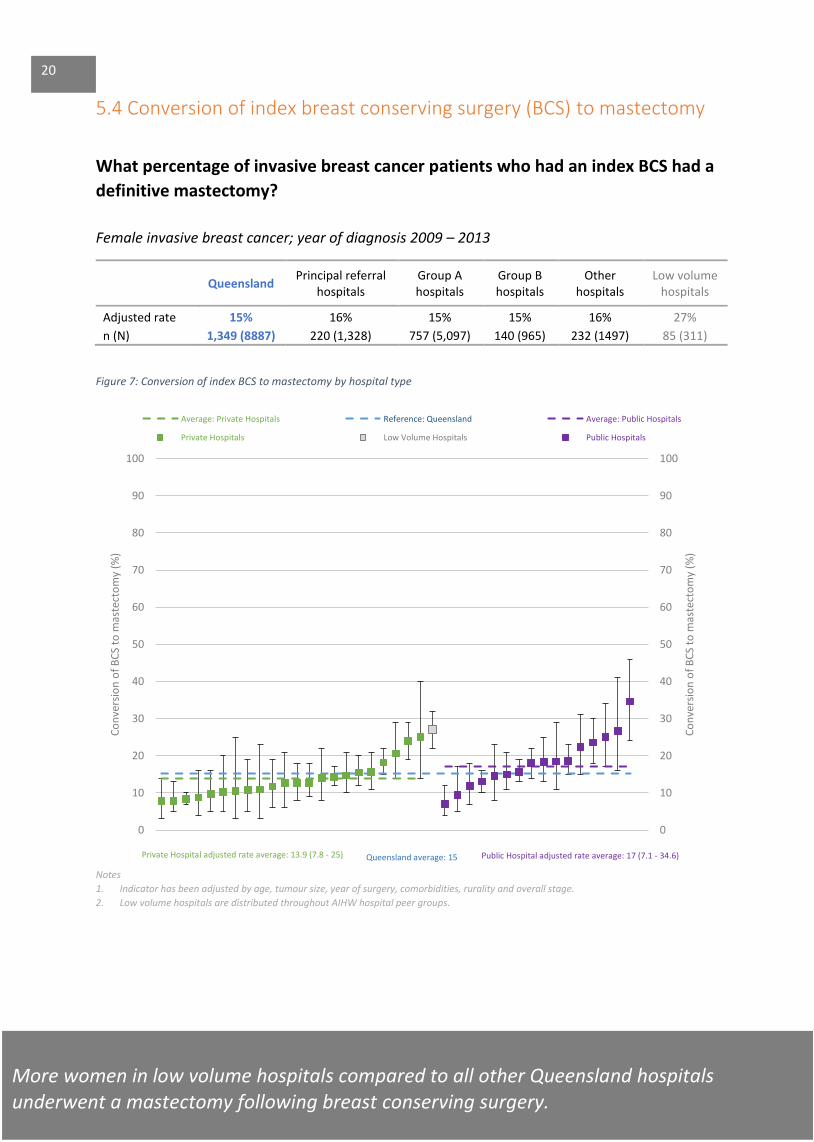
5.4 Conversion of index breast conserving surgery (BCS) to mastectomy
What percentage of invasive breast cancer patients who had an index BCS had a
definitive mastectomy?
Female invasive breast cancer; year of diagnosis 2009 – 2013
Queensland Principal referral
hospitals Group A hospitals
Group B hospitals
Other hospitals
Low volume hospitals
Adjusted rate 15% 16% 15% 15% 16% 27%
n (N) 1,349 (8887) 220 (1,328) 757 (5,097) 140 (965) 232 (1497) 85 (311)
Figure 7: Conversion of index BCS to mastectomy by hospital type
Notes
1. Indicator has been adjusted by age, tumour size, year of surgery, comorbidities, rurality and overall stage.
2. Low volume hospitals are distributed throughout AIHW hospital peer groups.
0
10
20
30
40
50
60
70
80
90
100
0
10
20
30
40
50
60
70
80
90
100
Co
nve
rsio
n o
f B
CS
to m
aste
cto
my
(%)
Co
nve
rsio
n o
f B
CS
to m
aste
cto
my
(%)
Average: Private Hospitals Reference: Queensland Average: Public Hospitals
Private Hospitals Low Volume Hospitals Public Hospitals
20
Private Hospital adjusted rate average: 13.9 (7.8 - 25) Queensland average: 15
More women in low volume hospitals compared to all other Queensland hospitals underwent a mastectomy following breast conserving surgery.
Public Hospital adjusted rate average: 17 (7.1 - 34.6)
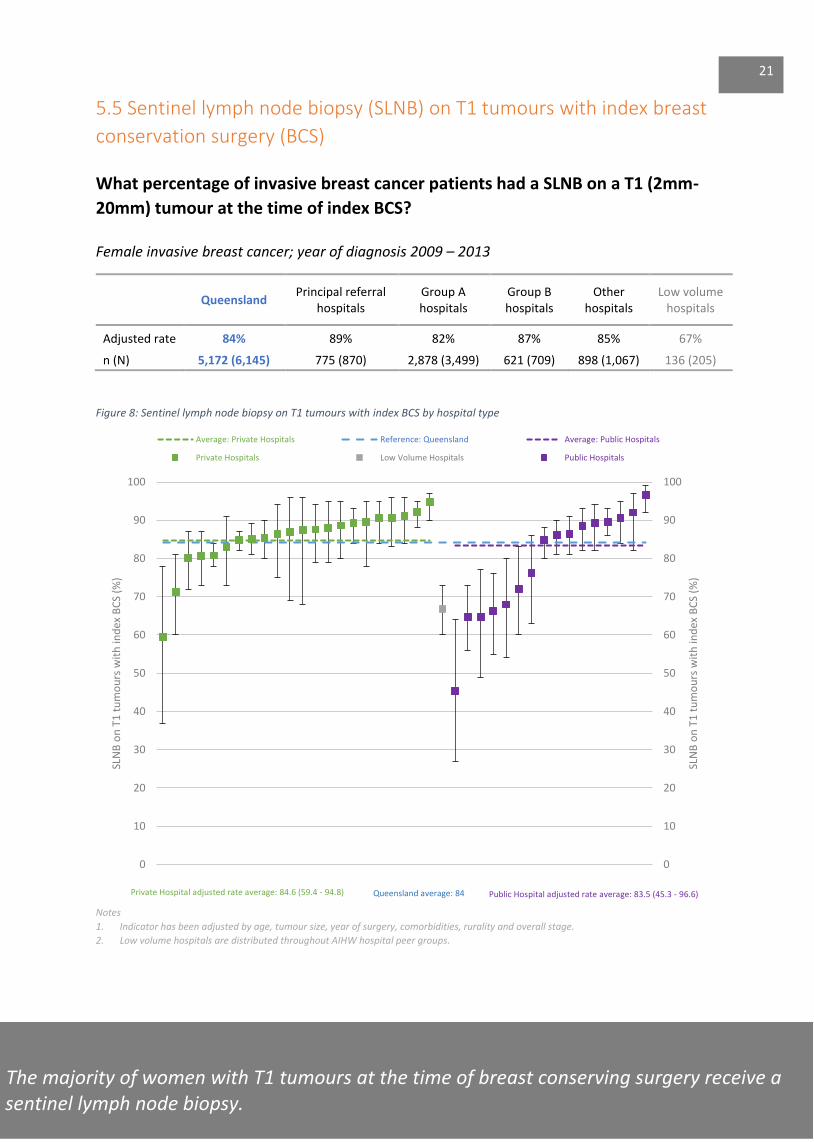
5.5 Sentinel lymph node biopsy (SLNB) on T1 tumours with index breast
conservation surgery (BCS)
What percentage of invasive breast cancer patients had a SLNB on a T1 (2mm-
20mm) tumour at the time of index BCS?
Female invasive breast cancer; year of diagnosis 2009 – 2013
Queensland Principal referral
hospitals Group A hospitals
Group B hospitals
Other hospitals
Low volume hospitals
Adjusted rate 84% 89% 82% 87% 85% 67%
n (N) 5,172 (6,145) 775 (870) 2,878 (3,499) 621 (709) 898 (1,067) 136 (205)
Figure 8: Sentinel lymph node biopsy on T1 tumours with index BCS by hospital type
Notes
1. Indicator has been adjusted by age, tumour size, year of surgery, comorbidities, rurality and overall stage.
2. Low volume hospitals are distributed throughout AIHW hospital peer groups.
0
10
20
30
40
50
60
70
80
90
100
0
10
20
30
40
50
60
70
80
90
100
SLN
B o
n T
1 t
um
ou
rs w
ith
ind
ex B
CS
(%)
SLN
B o
n T
1 t
um
ou
rs w
ith
ind
ex B
CS
(%)
Average: Private Hospitals Reference: Queensland Average: Public Hospitals
Private Hospitals Low Volume Hospitals Public Hospitals
Private Hospital adjusted rate average: 84.6 (59.4 - 94.8)
The majority of women with T1 tumours at the time of breast conserving surgery receive a se sentinel lymph node biopsy.
Queensland average: 84 Public Hospital adjusted rate average: 83.5 (45.3 - 96.6)
21

6.0 Timeliness Indicators
6.1 Time from pathological diagnosis to first (index) surgery ≤ 45 days
What percentage of invasive breast cancer patients had index surgery as first
treatment within 45 days from pathological diagnosis?
Female invasive breast cancer; year of diagnosis 2009 – 2013
Queensland Principal referral
hospitals Group A hospitals
Group B hospitals
Other hospitals
Low volume hospitals
Adjusted rate 88% 84% 87% 92% 95% 91%
n (N) 12,027 (13,611) 1,776 (2,096) 6,643 (7,622) 1,465 (1,625) 2,143 (2,268) 506 (571)
Figure 9: Time from pathological diagnosis to first index surgery ≤ 45 days by hospital type
Notes 1. Indicator has been adjusted by age, tumour size, year of surgery, comorbidities, rurality and overall stage.
2. Low volume hospitals are distributed throughout AIHW hospital peer groups.
3. Women undergoing neoadjuvant therapy have been excluded.
0
10
20
30
40
50
60
70
80
90
100
0
10
20
30
40
50
60
70
80
90
100
Tim
e fr
om
pat
ho
logi
cal d
iagn
osi
s to
fir
st (
ind
ex)
surg
ery
≤ 4
5 d
ays
(%)
Tim
e fr
om
pat
ho
logi
cal d
iagn
osi
s to
fir
st (
ind
ex)
surg
ery
≤ 4
5 d
ays
(%)
Average: Private Hospitals Reference: Queensland Average: Public Hospitals
Private Hospitals Low Volume Hospitals Public Hospitals
Hospitals are responsive to patients needs and most patients receive surgery within 45 days. However, more public than private patients waited longer for breast cancer surgery than private patients.
Private Hospital adjusted rate average: 80.3 (45.6 - 100) Queensland average: 88
22
Public Hospital adjusted rate average: 80.9 (47.3 - 91.3)
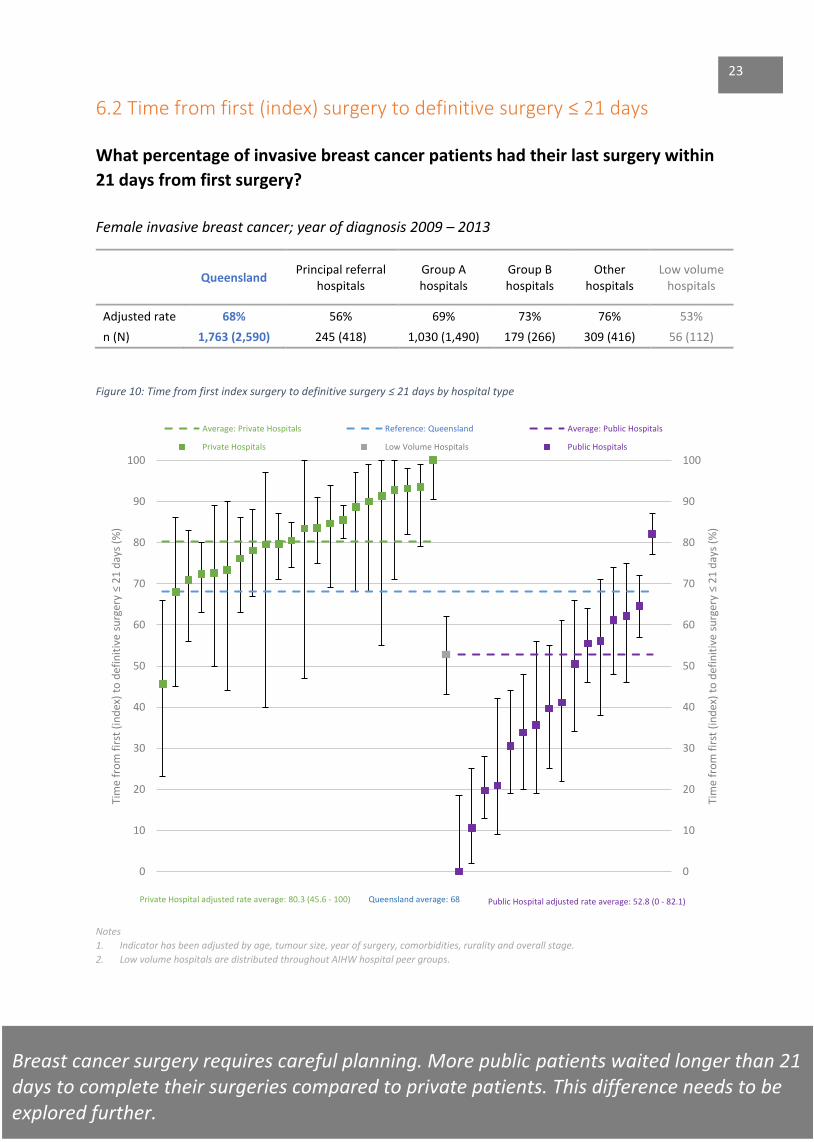
6.2 Time from first (index) surgery to definitive surgery ≤ 21 days
What percentage of invasive breast cancer patients had their last surgery within
21 days from first surgery?
Female invasive breast cancer; year of diagnosis 2009 – 2013
Queensland Principal referral
hospitals Group A hospitals
Group B hospitals
Other hospitals
Low volume hospitals
Adjusted rate 68% 56% 69% 73% 76% 53%
n (N) 1,763 (2,590) 245 (418) 1,030 (1,490) 179 (266) 309 (416) 56 (112)
Figure 10: Time from first index surgery to definitive surgery ≤ 21 days by hospital type
Notes 1. Indicator has been adjusted by age, tumour size, year of surgery, comorbidities, rurality and overall stage.
2. Low volume hospitals are distributed throughout AIHW hospital peer groups.
0
10
20
30
40
50
60
70
80
90
100
0
10
20
30
40
50
60
70
80
90
100
Tim
e fr
om
fir
st (
ind
ex)
to d
efin
itiv
e su
rger
y ≤
21
day
s (%
)
Tim
e fr
om
fir
st (
ind
ex)
to d
efin
itiv
e su
rger
y ≤
21
day
s (%
)
Average: Private Hospitals Reference: Queensland Average: Public Hospitals
Private Hospitals Low Volume Hospitals Public Hospitals
Breast cancer surgery requires careful planning. More public patients waited longer than 21 days to complete their surgeries compared to private patients. This difference needs to be explored further.
Queensland average: 68 Private Hospital adjusted rate average: 80.3 (45.6 - 100) Public Hospital adjusted rate average: 52.8 (0 - 82.1)
23

Appendix 1: AIHW hospital peer group definitions Principal referral hospitals
Principal referral hospitals are public acute hospitals that provide a very broad range of services, have a
range of highly specialised service units, and have very large patient volumes. The term ‘referral’
recognises that these hospitals have specialist facilities not typically found in smaller hospitals.
Public acute group A hospitals (Group A hospitals)
Public acute group A hospitals are public acute hospitals that provide a wide range of services typically
including a 24-hour emergency department, intensive care unit, coronary care unit and oncology unit,
but do not provide the breadth of services provided by Principal referral hospitals.
Private acute group A hospitals (Group A hospitals)
Private acute group A hospitals are private acute hospitals that have a 24-hour emergency department
and an intensive care unit, and provide a number of other specialised services such as coronary care,
special care nursery, cardiac surgery and neurosurgery.
Public acute group B hospitals (Group B hospitals)
Public acute group B hospitals are those public acute hospitals that do not have the service profile of the
Principal referral hospitals and Group A hospitals, but do have 24-hour emergency department; they
typically provide elective surgery and have specialised service units such as obstetric, paediatric and
psychiatric units.
Private acute group B hospitals (Group B hospitals)
Private acute group B hospitals are private acute hospitals that do not have a 24-hour emergency
department, but do have an intensive care unit and a number of other specialised services including
coronary care, special care nursery, cardiac surgery and neurosurgery.
Public acute group C hospitals (Other hospitals)
Public acute group C hospitals include those public acute hospitals that provide a more limited range of
services than Principal referral hospitals or Public acute group A and B hospitals, but do have an
obstetric unit, provide surgical services and/or some form of emergency facility (emergency department,
or accident and emergency service).
Private acute group C hospitals (Other hospitals)
Private acute group C hospitals are those private acute hospitals that do not provide emergency
department services or have an intensive care unit, but do provide specialised services in a range of
clinical specialities.
Public acute group D hospitals (Other hospitals)
Public acute group D hospitals are acute public hospitals that offer a smaller range of services relative to
other public acute hospitals, and provide 200 or more separations per year. They are mostly situated in
regional and remote areas.
Private acute group D hospitals (Other hospitals)
24
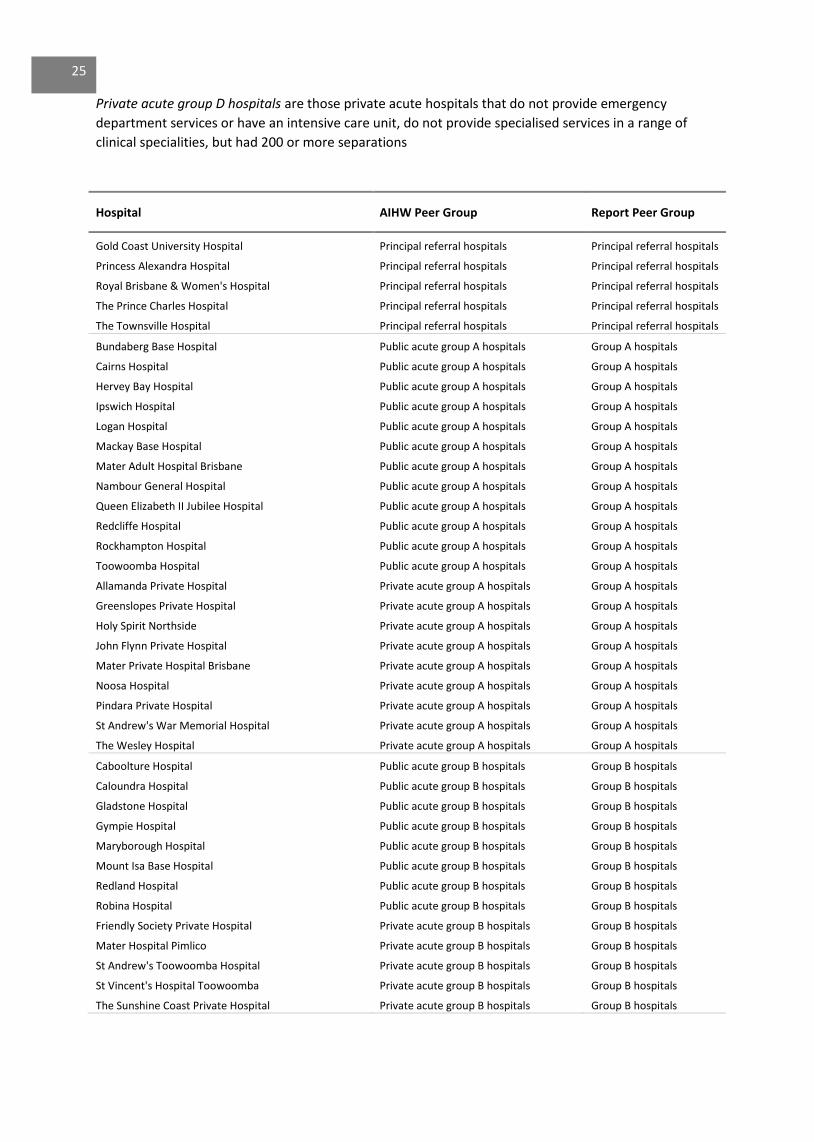
Private acute group D hospitals are those private acute hospitals that do not provide emergency
department services or have an intensive care unit, do not provide specialised services in a range of
clinical specialities, but had 200 or more separations
Hospital AIHW Peer Group Report Peer Group
Gold Coast University Hospital Principal referral hospitals Principal referral hospitals
Princess Alexandra Hospital Principal referral hospitals Principal referral hospitals
Royal Brisbane & Women's Hospital Principal referral hospitals Principal referral hospitals
The Prince Charles Hospital Principal referral hospitals Principal referral hospitals
The Townsville Hospital Principal referral hospitals Principal referral hospitals
Bundaberg Base Hospital Public acute group A hospitals Group A hospitals
Cairns Hospital Public acute group A hospitals Group A hospitals
Hervey Bay Hospital Public acute group A hospitals Group A hospitals
Ipswich Hospital Public acute group A hospitals Group A hospitals
Logan Hospital Public acute group A hospitals Group A hospitals
Mackay Base Hospital Public acute group A hospitals Group A hospitals
Mater Adult Hospital Brisbane Public acute group A hospitals Group A hospitals
Nambour General Hospital Public acute group A hospitals Group A hospitals
Queen Elizabeth II Jubilee Hospital Public acute group A hospitals Group A hospitals
Redcliffe Hospital Public acute group A hospitals Group A hospitals
Rockhampton Hospital Public acute group A hospitals Group A hospitals
Toowoomba Hospital Public acute group A hospitals Group A hospitals
Allamanda Private Hospital Private acute group A hospitals Group A hospitals
Greenslopes Private Hospital Private acute group A hospitals Group A hospitals
Holy Spirit Northside Private acute group A hospitals Group A hospitals
John Flynn Private Hospital Private acute group A hospitals Group A hospitals
Mater Private Hospital Brisbane Private acute group A hospitals Group A hospitals
Noosa Hospital Private acute group A hospitals Group A hospitals
Pindara Private Hospital Private acute group A hospitals Group A hospitals
St Andrew's War Memorial Hospital Private acute group A hospitals Group A hospitals
The Wesley Hospital Private acute group A hospitals Group A hospitals
Caboolture Hospital Public acute group B hospitals Group B hospitals
Caloundra Hospital Public acute group B hospitals Group B hospitals
Gladstone Hospital Public acute group B hospitals Group B hospitals
Gympie Hospital Public acute group B hospitals Group B hospitals
Maryborough Hospital Public acute group B hospitals Group B hospitals
Mount Isa Base Hospital Public acute group B hospitals Group B hospitals
Redland Hospital Public acute group B hospitals Group B hospitals
Robina Hospital Public acute group B hospitals Group B hospitals
Friendly Society Private Hospital Private acute group B hospitals Group B hospitals
Mater Hospital Pimlico Private acute group B hospitals Group B hospitals
St Andrew's Toowoomba Hospital Private acute group B hospitals Group B hospitals
St Vincent's Hospital Toowoomba Private acute group B hospitals Group B hospitals
The Sunshine Coast Private Hospital Private acute group B hospitals Group B hospitals
25
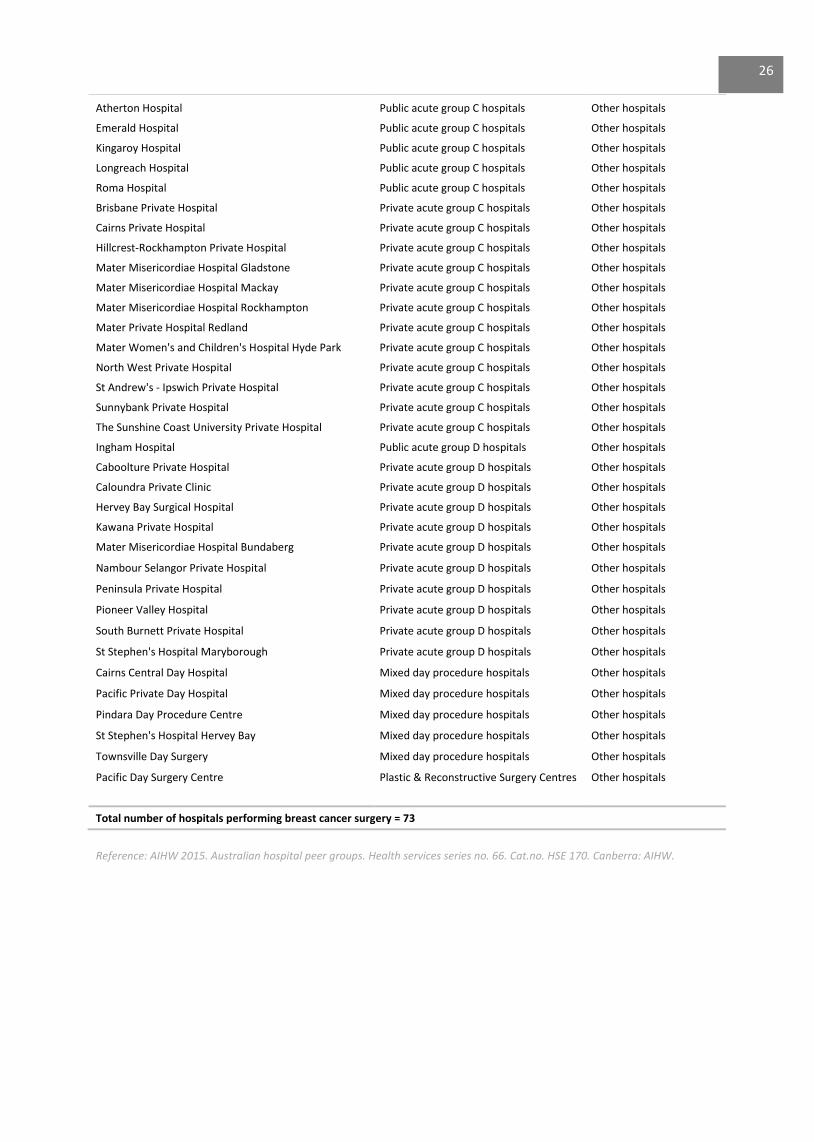
Atherton Hospital Public acute group C hospitals Other hospitals
Emerald Hospital Public acute group C hospitals Other hospitals
Kingaroy Hospital Public acute group C hospitals Other hospitals
Longreach Hospital Public acute group C hospitals Other hospitals
Roma Hospital Public acute group C hospitals Other hospitals
Brisbane Private Hospital Private acute group C hospitals Other hospitals
Cairns Private Hospital Private acute group C hospitals Other hospitals
Hillcrest-Rockhampton Private Hospital Private acute group C hospitals Other hospitals
Mater Misericordiae Hospital Gladstone Private acute group C hospitals Other hospitals
Mater Misericordiae Hospital Mackay Private acute group C hospitals Other hospitals
Mater Misericordiae Hospital Rockhampton Private acute group C hospitals Other hospitals
Mater Private Hospital Redland Private acute group C hospitals Other hospitals
Mater Women's and Children's Hospital Hyde Park Private acute group C hospitals Other hospitals
North West Private Hospital Private acute group C hospitals Other hospitals
St Andrew's - Ipswich Private Hospital Private acute group C hospitals Other hospitals
Sunnybank Private Hospital Private acute group C hospitals Other hospitals
The Sunshine Coast University Private Hospital Private acute group C hospitals Other hospitals
Ingham Hospital Public acute group D hospitals Other hospitals
Caboolture Private Hospital Private acute group D hospitals Other hospitals
Caloundra Private Clinic Private acute group D hospitals Other hospitals
Hervey Bay Surgical Hospital Private acute group D hospitals Other hospitals
Kawana Private Hospital Private acute group D hospitals Other hospitals
Mater Misericordiae Hospital Bundaberg Private acute group D hospitals Other hospitals
Nambour Selangor Private Hospital Private acute group D hospitals Other hospitals
Peninsula Private Hospital Private acute group D hospitals Other hospitals
Pioneer Valley Hospital Private acute group D hospitals Other hospitals
South Burnett Private Hospital Private acute group D hospitals Other hospitals
St Stephen's Hospital Maryborough Private acute group D hospitals Other hospitals
Cairns Central Day Hospital Mixed day procedure hospitals Other hospitals
Pacific Private Day Hospital Mixed day procedure hospitals Other hospitals
Pindara Day Procedure Centre Mixed day procedure hospitals Other hospitals
St Stephen's Hospital Hervey Bay Mixed day procedure hospitals Other hospitals
Townsville Day Surgery Mixed day procedure hospitals Other hospitals
Pacific Day Surgery Centre Plastic & Reconstructive Surgery Centres Other hospitals
Total number of hospitals performing breast cancer surgery = 73
Reference: AIHW 2015. Australian hospital peer groups. Health services series no. 66. Cat.no. HSE 170. Canberra: AIHW.
26

Appendix 2: Low volume hospitals performing breast cancer surgery
Figure 11: Distribution of low volume hospitals 2009 – 2013
Notes 1. Annual average is rounded up to nearest whole number.
0
2
4
6
8
10
12
14
Bre
ast
can
cer
def
init
ive
surg
erie
s p
er y
ear
Hospitals (N = 34)
< 4 procedures (N = 23) 4 – 14 procedures (N = 11)
((procedures
27
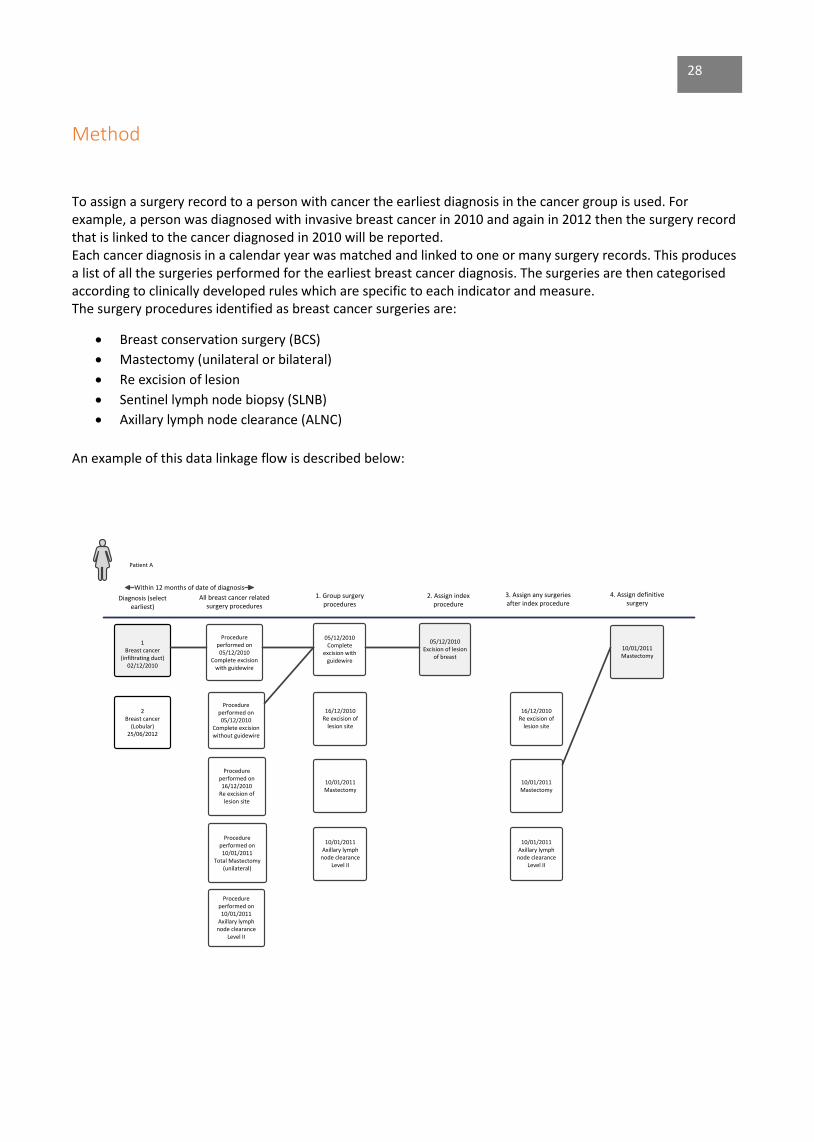
Method
To assign a surgery record to a person with cancer the earliest diagnosis in the cancer group is used. For example, a person was diagnosed with invasive breast cancer in 2010 and again in 2012 then the surgery record that is linked to the cancer diagnosed in 2010 will be reported. Each cancer diagnosis in a calendar year was matched and linked to one or many surgery records. This produces a list of all the surgeries performed for the earliest breast cancer diagnosis. The surgeries are then categorised according to clinically developed rules which are specific to each indicator and measure. The surgery procedures identified as breast cancer surgeries are:
· Breast conservation surgery (BCS)
· Mastectomy (unilateral or bilateral)
· Re excision of lesion
· Sentinel lymph node biopsy (SLNB)
· Axillary lymph node clearance (ALNC)
An example of this data linkage flow is described below:
Within 12 months of date of diagnosis
1Breast cancer
(infiltrating duct)02/12/2010
Procedure performed on05/12/2010
Complete excision with guidewire
Procedure performed on 05/12/2010
Complete excision without guidewire
Procedure performed on 16/12/2010
Re excision of lesion site
Procedure performed on 10/01/2011
Total Mastectomy (unilateral)
05/12/2010Complete
excision with guidewire
16/12/2010Re excision of
lesion site
10/01/2011Mastectomy
05/12/2010Excision of lesion
of breast
10/01/2011Mastectomy
16/12/2010Re excision of
lesion site
10/01/2011Mastectomy
Diagnosis (select earliest)
All breast cancer related surgery procedures
1. Group surgery procedures
2. Assign index procedure
3. Assign any surgeries after index procedure
4. Assign definitive surgery
Patient A
2Breast cancer
(Lobular)25/06/2012
10/01/2011Axillary lymph
node clearance Level II
10/01/2011Axillary lymph
node clearance Level II
Procedure performed on 10/01/2011
Axillary lymph node clearance
Level II
28
Glossary
Adjusted rates
The indicators have been adjusted to remove the effect of differences in composition of the various populations.
The indicators have been adjusted by age, tumour size, year of surgery, comorbidities, rurality and overall stage.
Year of surgery has been included as a covariate in the analysis to account for any changes in clinical practice
during the time period (2009-2013). For example recommendations to perform SLNB on T1 tumours being
introduced in 2008.
Age standardised rates
The number of new cases or deaths per 100,000 that would have occurred in a given population if the age
distribution of that population was the same as that of the Australian population in 2001 and if the age-specific
rates observed in the population of interest had prevailed.
Breast cancer tumour size
Breast tumour size in millimetres classified according to ‘TNM Classification of Malignant Tumours’ 7th edition,
UICC International Union Against Cancer.
Breast conservation surgery (BCS)
Includes Queensland female residents of all ages diagnosed with invasive breast cancer in the surgical cohort
time period who underwent one of the following procedures: excision of lesion of breast and/or re-excision of
lesion.
Cohort
Breast cancer cohort
Queensland female residents who were diagnosed with breast cancer between 1 January 2004 and 31
December 2013.
Breast cancer surgery cohort
Anyone in the breast cancer cohort who had any of the identified cancer related procedures one month before
or 12 months after their diagnosis (outlined on page 27).
Comorbidity
A clinical condition that has the potential to significantly affect a cancer patient’s prognosis.
Comorbidity is derived from hospital admissions data following the Quan algorithm1 for classifying ICD-10 coded
conditions, modified to exclude metastasis, which is represented by a separate and distinct metastasis
dimension.
Comorbidity is limited to conditions coded in any admission episode between 12 months before and 12 months
after the date of cancer diagnosis.
For any given cancer diagnosis, comorbidity is restricted to conditions other than the primary cancer. E.g. A
rectum cancer can be a comorbidity to a colon cancer diagnosis and vice versa, if they are diagnosed within 12
months of each other.
29
Benign tumours are not considered comorbidities.
Co-morbidity list:
AIDS Acute myocardial Cancer
Cerebrovascular disease Congestive heart failure Chronic obstructive pulmonary disease
Dementia Diabetes Diabetes + complications
Hemiplegia or Paraplegia Mild liver disease Moderate/severe liver disease
Peptic ulcer Peripheral vascular disease Renal disease
Rheumatoid disease
Confidence interval
The 95% confidence intervals for the adjusted rates are displayed on the graph as bars attached to the rate for
each hospital. Where the bars do not cross the line showing the state average for that indicator, it means the
result for this hospital is statistically significantly different from the state average.
Crude rate (not adjusted)
The observed rate within the population/facility. Does not take into account differences in the demographics of
the populations being compared (eg. age, gender differences).
Definitive surgery
Mastectomy within 12 months of the first procedure. If mastectomy was not recorded then the last record of
either excision of lesion of breast or re-excision of lesion site within 12 months of the first procedure was
selected.
Breast cancer procedure hierarchy
1. Mastectomy
2. Excision of lesion of breast
Hospital and Health Service (HHS) of residence
Hospital and Health Service of residence is a geographic area defined by a collection of Statistical Areas Level 2
(SA2s) where the patient resides at time of diagnosis. Queensland unknown residence includes addresses
reported as overseas, unknown, or not fixed.
Hospital and Health Service (HHS) of surgery
Hospital and Health Service of surgery is a geographic area defined by a collection of Statistical Areas Level 2
(SA2s) where the surgery is performed, the term Hospital and Health Service is synonymous with a group of
Queensland Health facilities and staff responsible for providing and delivering health resources and services to
an area.
Index surgery
The first breast cancer surgery procedure performed closest to diagnosis date within 12 months of diagnosis.
30
Low volume hospital
The Surgical Services module in Clinical Services Capability Framework for Public and Licenced Private Health
Facilities v3.2 recommended 20 cases as an adequate number of new breast cancer patients having surgical
resections per year by service/unit based on published literature and experienced clinical opinion.
Hospitals performing a yearly average of < 15 breast cancer surgeries between 2009 and 2013 were grouped as
low volume. To compensate for variations in annual number of breast cancer surgeries those hospitals
performing between 15 and 20 annual average per year were not grouped into low volume for this report.
Invasive breast cancer
Growth of tumour is characteristically invasive and infiltrative, extending beyond the tissue of origin into
adjacent organs.
Mastectomy
Includes Queensland female residents of all ages diagnosed with invasive breast cancer in the surgical cohort
time period who underwent one of the following procedures: total mastectomy (unilateral), total mastectomy
(bilateral), subcutaneous mastectomy (unilateral), subcutaneous mastectomy (bilateral).
Median age (yrs)
The age that divides a population into two halves: one older than the median, the other younger than the
median.
Median tumour size at diagnosis (millimetres)
The tumour size that divides a population into two halves: one larger than the median, the other smaller than
the median.
Micro-invasion (T1mi)
Tumour size is ≤ 1 mm classified according to ‘TNM Classification of Malignant Tumours’ 7th edition, UICC
International Union Against Cancer.
Neoadjuvant treatment
In select cases, treatment with chemotherapy, targeted therapy or hormone therapy may be given before breast surgery. Women who had chemotherapy between the date of breast cancer diagnosis and date of breast cancer surgery were identified as receiving neoadjuvant treatment. Number of surgeries
Includes Queensland female residents of all ages diagnosed with invasive breast cancer in the surgical cohort
time period who underwent one of the surgeries.
Overall stage at diagnosis
Cancer staging is the process of determining how much cancer is in the body and where it is located. Using
tumour size (mm), number of positive nodes and distant metastatic sites an overall stage has been defined as:
Early – no nodes positive at diagnosis
Locally advanced - any nodes positive at diagnosis
Metastatic – distant metastatic site present (30 days before date of diagnosis and up to 90 days after date of
diagnosis)
31
Private Hospital
All other hospitals that are not Queensland Health hospitals.
Public Hospital
Queensland Health hospitals.
Relative Survival
Relative survival is a measure of the survival of a group of persons with a condition, such as cancer, relative to a comparable group from the general population without the condition.
Remoteness
The relative remoteness of residence at time of diagnosis, based on the Australian Standard Geographical
Classification (ASGC). In this report, remoteness is classified into four groups: Major City, Inner Regional, Outer
Regional, and Remote & Very Remote.
Rurality
Areas within Queensland have been designated as Urban or Rural based on the ARIA index. Areas falling within
the Major Cities grouping are classified as Urban. This includes the greater Brisbane area, Ipswich, Gold Coast,
the Sunshine Coast and Townsville. The remainder of Queensland is classified as Rural.
Time from histological diagnosis to first (index) surgery ≤ 45 days
% of patients who’s earliest histological confirmed diagnosis to first index breast cancer surgery ≤ 45 days.
Time from index surgery to definitive surgery surgery ≤ 21 days
% of patients who’s first index breast cancer surgery to definitive surgery ≤ 21 days.
32
References
1. AIHW 2015. Australian hospital peer groups. Health services series no. 66. Cat.no. HSE 170. Canberra: AIHW.
2. Canadian Institute of Health Information (CIHI). Breast Cancer Surgery in Canada, 2007-2008 to 2009-2010 (Ottawa, Ont: CIHI, 2012). 3. GLOBOCAN 2012, IARC -5.12.2016. (The most recent GLOBOCAN estimates are for 2012, and are based on cancer incidence and mortality rates from about 3 to 5 years earlier)
4. McCahill LE, Privette A, James T, Sheehey-Jones J, Ratliff J, Majercik D, Krag DN, Stanley M & Harlow S. Quality measures for breast cancer surgery: initial validation of feasibility and assessment of variation among surgeons. Arch Surg. 2009 May; 144(5):455-62.
5. Morris T, Wetzig N, Sinclair S, Kollias J, Zorbas H. Evaluation of implementation of sentinel node biopsy in
Australia. ANZ Journal of Surgery, 2012 Jul/Aug; 82(7-8): 541-7.
6. Oncology Analysis System (OASys), Queensland Cancer Control Analysis Team. 7. Queensland Health 2014. Queensland Cancer Quality Index: Indicators of safe, quality cancer care. Cancer Surgery in public and private hospitals 2001 -2010.
8. Queensland Health 2012. Breast Cancer in Queensland An Overview 2012.
9. Queensland Health 2013. Cancer Surgery in Queensland: Infocus – access and flows 2013. Chapter 1 Breast Cancer.
10. Scottish Government and Healthcare Improvement Scotland. Breast Cancer, Clinical Quality Performance Indicators. March 2012.
33
https://www.ncbi.nlm.nih.gov/pubmed/?term=Privette%20A%5BAuthor%5D&cauthor=true&cauthor_uid=19451489

FOR MORE INFORMATION
Queensland Cancer Control Analysis Team Queensland Health Tel: (+61) (07) 3176 4400 Email: [email protected] https://qccat.health.qld.gov.au
Although care has been taken to ensure the accuracy, completeness and reliability of the information provided
these data are released for purposes of quality assurance and are to be used with appropriate caution. Be
aware that data can be altered subsequent to original distribution and that the information is therefore subject
to change without notice. Data can also quickly become out-of-date. It is recommended that careful attention be
paid to the contents of any data and if required QCCAT can be contacted with any questions regarding its use. If
you find any errors or omissions, please report them to [email protected]


![Surgical Treatment of Ovarian Cancer - IntechOpen · Thus, ovarian cancer is a challenging and complex malignancy.[4] Surgical management of ovarian cancer remains as the cornerstone](https://static.fdocuments.in/doc/165x107/5f02570e7e708231d403c953/surgical-treatment-of-ovarian-cancer-intechopen-thus-ovarian-cancer-is-a-challenging.jpg)


