Breakthrough Technology: Best Value Performance Information Procurement System (PIPS) Delivery April...
46
Breakthrough Technology: Best Value Breakthrough Technology: Best Value Performance Information Procurement Performance Information Procurement System (PIPS) Delivery System (PIPS) Delivery April 2008 P erformance erformance B ased ased S tudies tudies R R esearch esearch G roup roup www.pbsrg.com PBSRG GLOBAL Dean Kashiwagi, Professor, PhD, PE Dean Kashiwagi, Professor, PhD, PE Director Director
-
Upload
annis-dixon -
Category
Documents
-
view
218 -
download
1
Transcript of Breakthrough Technology: Best Value Performance Information Procurement System (PIPS) Delivery April...

Breakthrough Technology: Best Value Breakthrough Technology: Best Value Performance Information Performance Information
Procurement System (PIPS) DeliveryProcurement System (PIPS) Delivery
April 2008
PPerformance erformance BBased ased SStudies tudies RResearch esearch GGrouproup
www.pbsrg.com
PBSRGGLOBAL
Dean Kashiwagi, Professor, PhD, PEDean Kashiwagi, Professor, PhD, PEDirectorDirector
Efficiency: more economical, better value, higher performance
• Minimize management/administration of contract by as much as 90%
• Increase performance to 98% (on time, on budget with no contractor/vendor generated cost change orders, meet quality expectations)
• Pay no more, but contractors/vendors increase profits by 5%
• Minimize contract administration, decision making, and surprises

– Conducting research since 1994 Conducting research since 1994 – 146 Publications146 Publications– 441 Presentations, 6,200 Attendees441 Presentations, 6,200 Attendees– 530 Procurements530 Procurements– $683 Construction services$683 Construction services– $451Non-construction services$451Non-construction services– 50 Different clients (public & private)50 Different clients (public & private)– 98% Customer satisfaction98% Customer satisfaction– Decreased management functions by 90%Decreased management functions by 90%– Increase vendor profit by 5%Increase vendor profit by 5%
Worldwide as a leader in Best-Value Worldwide as a leader in Best-Value Procurement /Construction Procurement /Construction Performance Research and Performance Research and DocumentationDocumentation
2006/2008
2008/2009 Award to Africa
Best Value PIPStransformation
International Council for Research and Innovations in Building and Construction
Corenet Global2005 Innovationof the Year Award

Current Research Clients• General Dynamics• United Airlines• Entergy, Southern US• Schering Plough• Neogard• TREMCO• Heijmans, Netherlands• Ministry of Transportation,
Netherlands• University of Minnesota• Arizona State University• New Mexico State
University • States of Washington,
Missouri, Arizona (Parks and Recreation)
• US Army Medical Command• USAF Logistics Command• US Corps of Engineers• City of Peoria, AZ• City of Miami Beach, FL• City of Sitka, Alaska• NY/NJ Port Authority• Denver Hospital• Georgia Tech University, Florida
International University, Central Connecticut University, Glasgow Caledonian University, Salford University (Research)

Logic Models
• Use logic instead of experience
• Price based system vs. best value
• Minimize the flow of information between parties
• Blind vs. the visionary contractor/vendor
• Minimize risk that they do not control
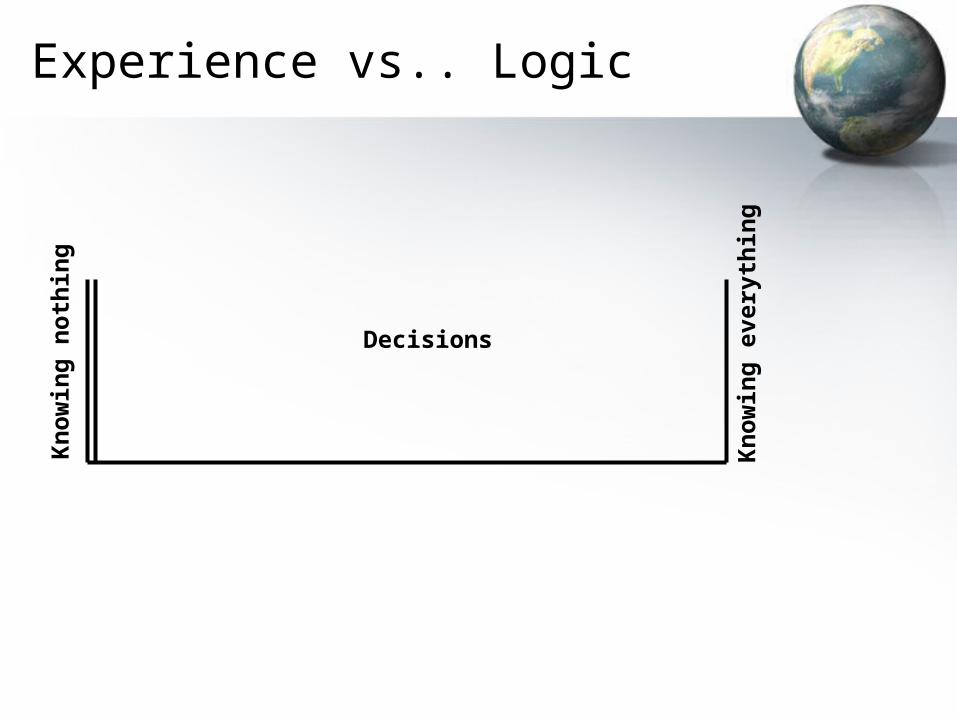
Experience vs.. LogicK
now
ing
noth
ing
Kn
ow
ing
every
thin
g
Decisions

How to use logic instead of experience
• Admit that you don’t know
• Ask
• Ask those who come, how they know they know
• Ask them to go from beginning to the end of the project
• Ask them to minimize the risk they do not control
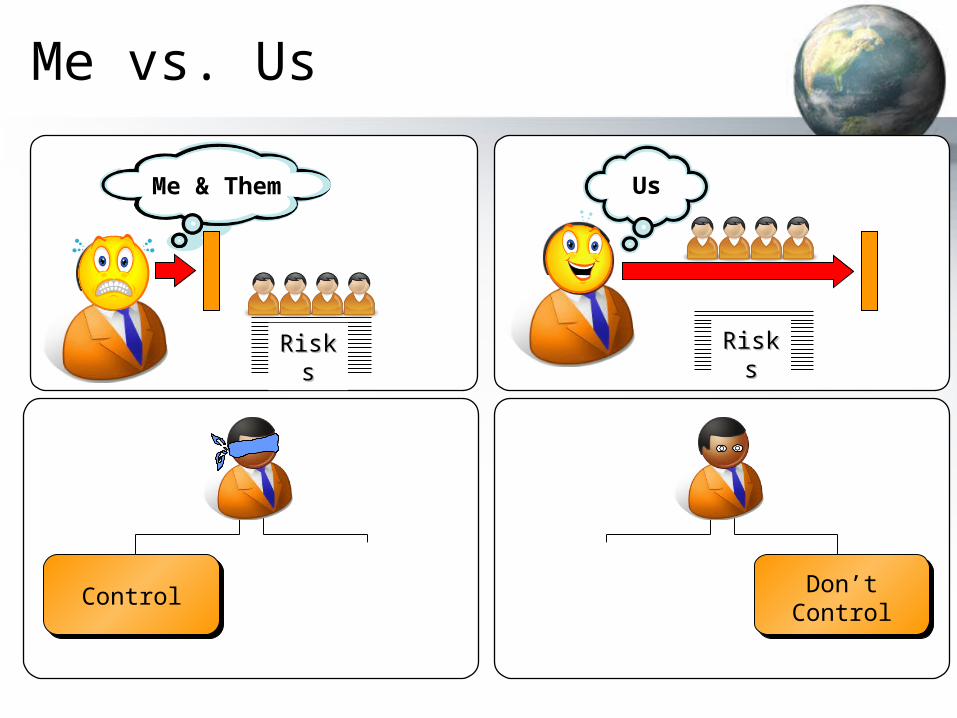
Me vs. Us
Us
RiskRiskss
RiskRiskss
Control Don’t Control
Control Don’t Control
Me & Them
Logic Models
• Use logic instead of experience
• Price based system vs. best value
• Minimize the flow of information between parties
• Blind vs. the visionary contractor/vendor
• Minimize risk that they do not control

Result of Using Logic
• Forces vendors to know what they are going to do before they do it
• Transfers risk and control
• Forces vendors to manage, document, and ensure that they are providing best value
• Makes the vendor accountable
• Makes the client’s personnel accountable
• Accountability brings efficiency and value
Logic and accountability stops “foolish
actions”
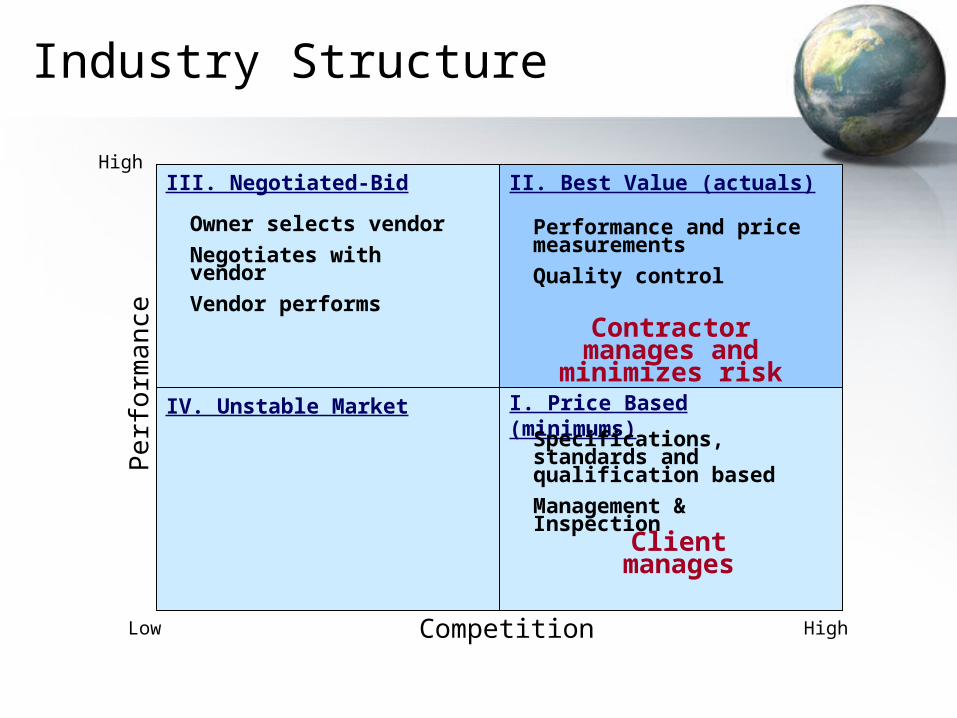
Industry Structure
High
I. Price Based (minimums)
II. Best Value (actuals)
IV. Unstable Market
III. Negotiated-Bid
Specifications, standards and qualification based
Management & Inspection
Performance and price measurements
Quality control
Competition
Pe
rfo
rman
ce
Low
High
Owner selects vendor
Negotiates with vendor
Vendor performs
Contractor manages and minimizes risk
Client manages
High
Low
Perf
orm
an
ce
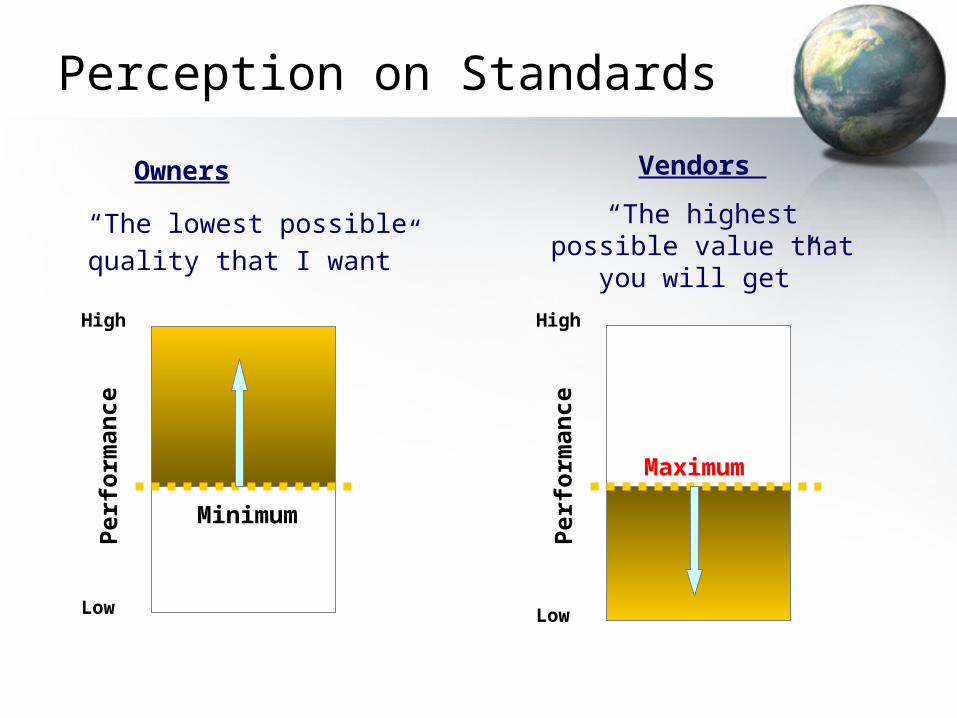
Owners
“The lowest possible quality
that I want”
High
Low
Perf
orm
an
ce
Vendors
“The highest possible value that you will get”
Minimum
Maximum
Perception on Standards
Perf
orm
an
ce
High
Low
Ris
k
High
Low
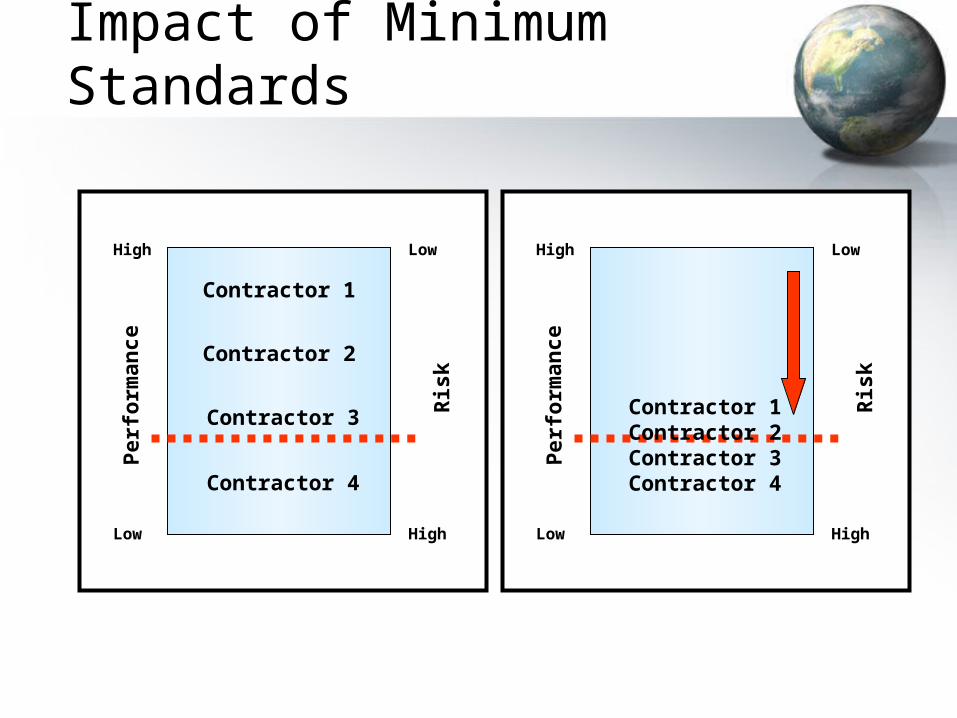
Impact of Minimum Standards
Contractor 1Contractor 2Contractor 3Contractor 4
Contractor 1
Contractor 2
Contractor 3
Contractor 4
Perf
orm
an
ce
High
Low
Ris
k
High
Low
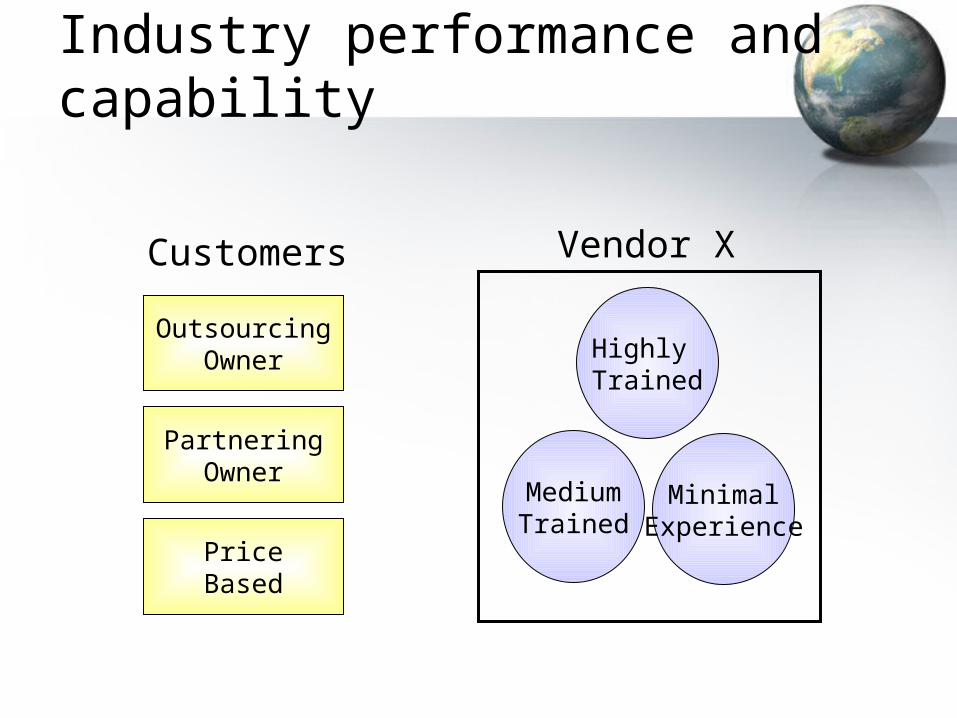
Industry performance and capability
Highly Trained
MediumTrained
Vendor XCustomers
OutsourcingOwner
PartneringOwner
PriceBased
MinimalExperience
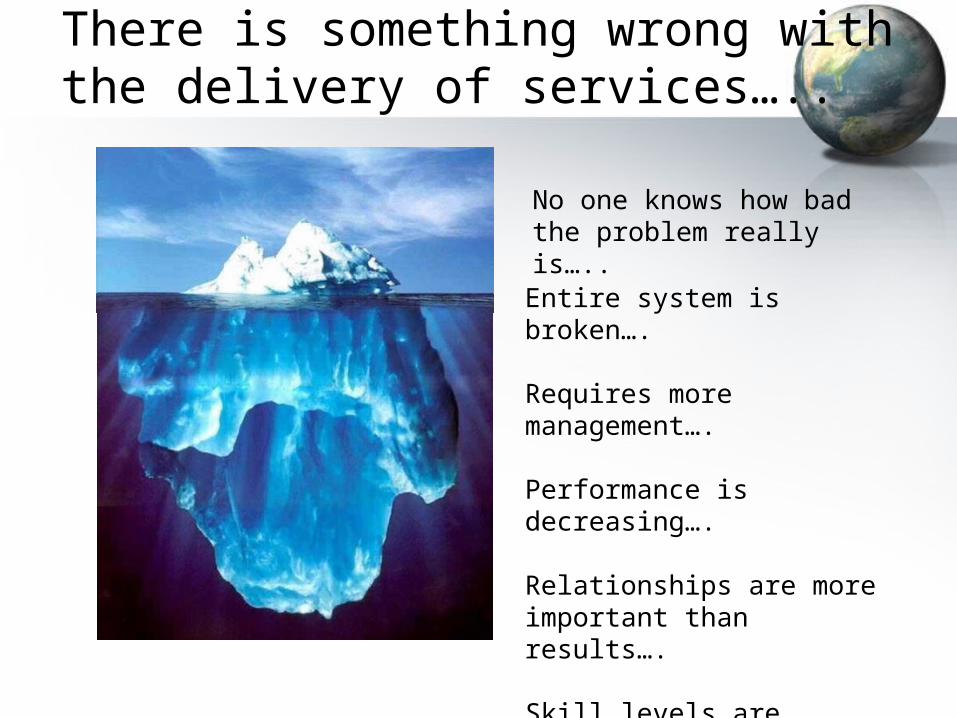
There is something wrong with the delivery of services…..
No one knows how bad the problem really is…..
Entire system is broken….
Requires more management….
Performance is decreasing….
Relationships are more important than results….
Skill levels are decreasing….

Management
….it becomes less important to be skilled, accountable, and able to minimize risk
As management, control, and direction become more important…..
Skill 1 Skill 2 Skill 3 Skill 4
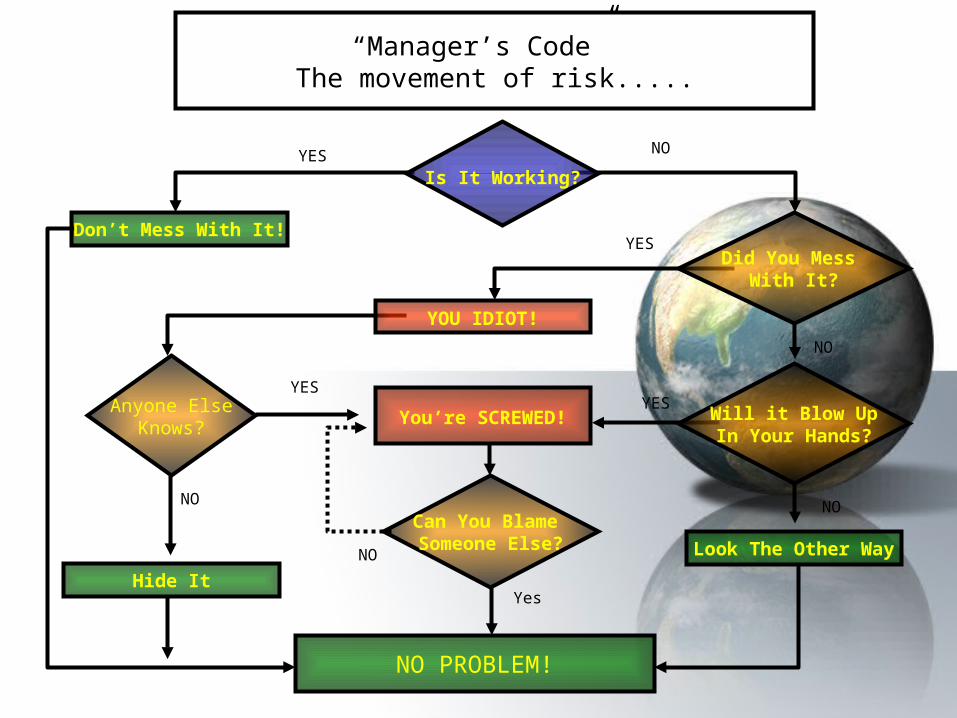
“Manager’s Code” The movement of risk.....
Don’t Mess With It!
YES NO
YES
YOU IDIOT!
NO
Will it Blow UpIn Your Hands?
NO
Look The Other Way
Anyone ElseKnows? You’re SCREWED!
YESYES
NO
Hide It
Can You Blame Someone Else?
NO
NO PROBLEM!
Yes
Is It Working?
Did You Mess With It?

Initial conditions
Final conditions
Procurement of services
Time
Laws Laws
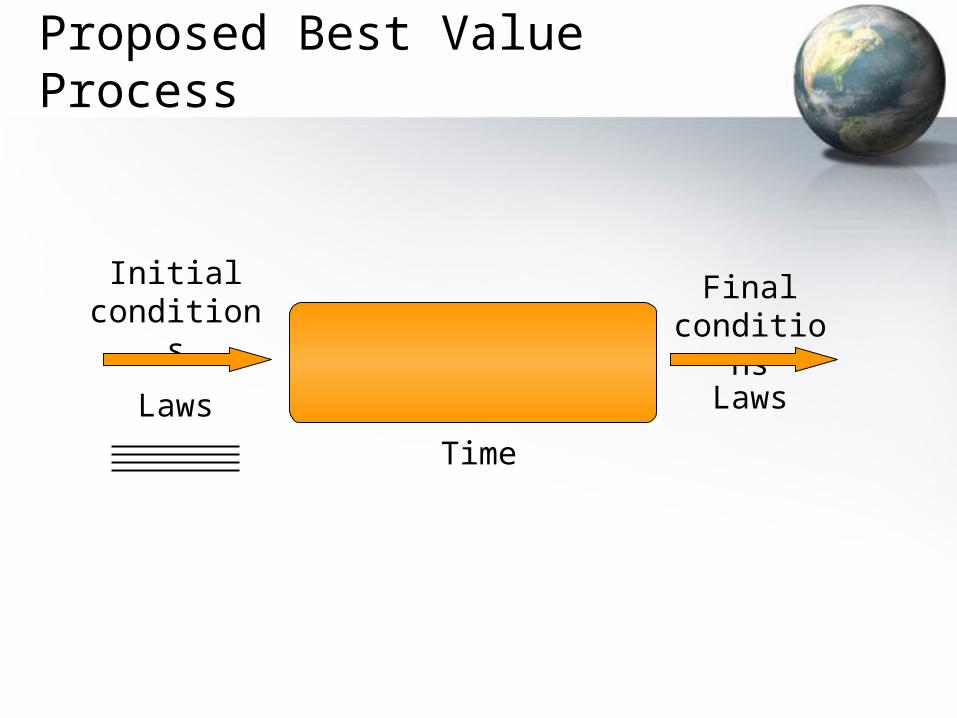
Initial conditions
Final conditions
Proposed Best Value Process
Time
Laws Laws

How to use logic instead of experience
• Admit that you don’t know
• Ask
• Ask those who come, how they know they know
• Ask them to go from beginning to the end of the project
• Ask them to minimize the risk they do not control

Best Value SystemPerformance Information Procurement System (PIPS)
PHASE 3:
MANAGEMENT BY RISK
MINIMIZATION
PHASE 1:
SELECTION
PHASE 2:
PRE-PLANNING
QUALITY CONTROL
Best Value also known as “sealed competitive bid” in State of Texas
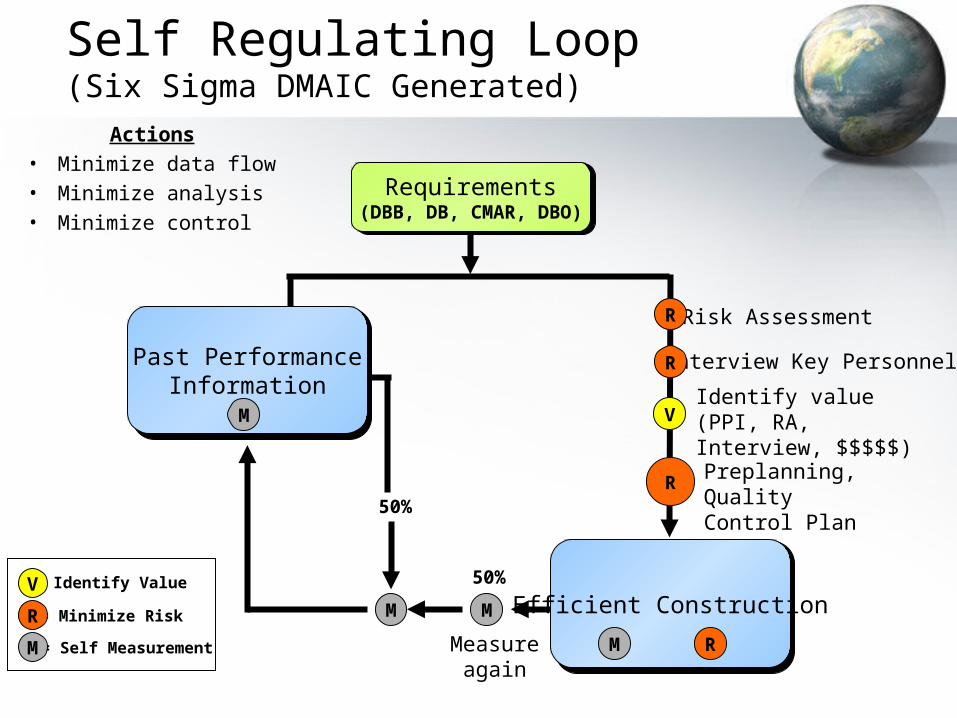
Self Regulating Loop(Six Sigma DMAIC Generated)
Actions• Minimize data
flow• Minimize analysis• Minimize control
Risk Assessment
Preplanning, Quality Control Plan
Measure again
50%
Identify value (PPI, RA, Interview, $$$$$)V
50%
Interview Key PersonnelPast PerformanceInformation
M
Requirements(DBB, DB, CMAR, DBO)
Efficient Construction
M R
MM
R
R
R
= Minimize Risk
= Self Measurement
= Identify Value
M
R
V
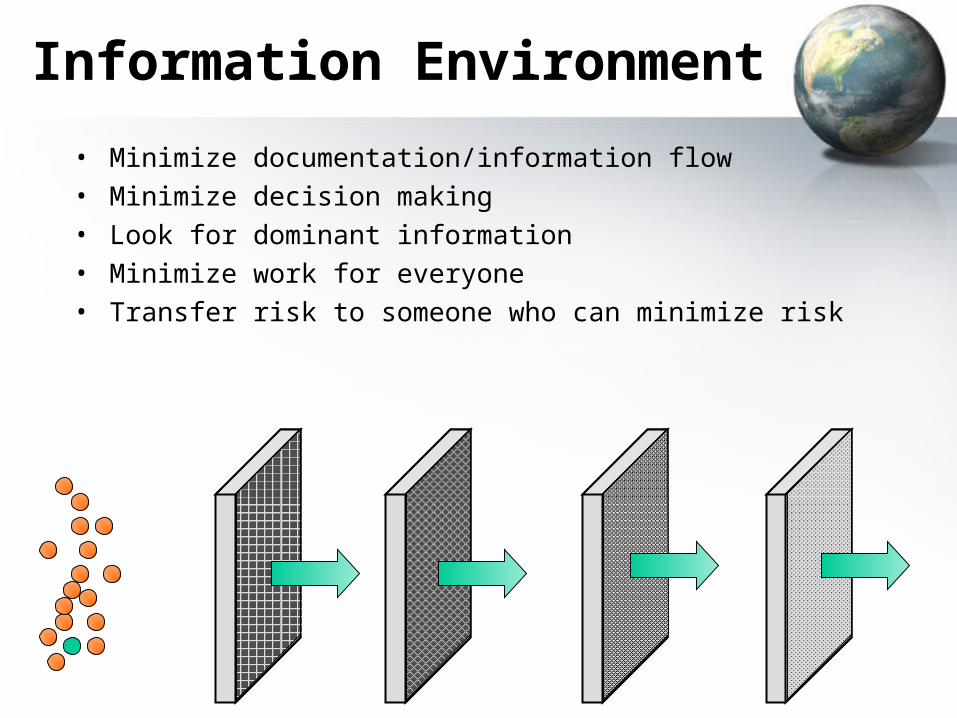
Information Environment
• Minimize documentation/information flow• Minimize decision making• Look for dominant information• Minimize work for everyone• Transfer risk to someone who can minimize risk

A lot of folks can't understand how we came To have an oil shortage here in our country.
~~~ Well, there's a very simple answer.
~~~ Nobody bothered to check the oil.
~~~ We just didn't know we were getting low.
Dominant Informationminimizes surprises
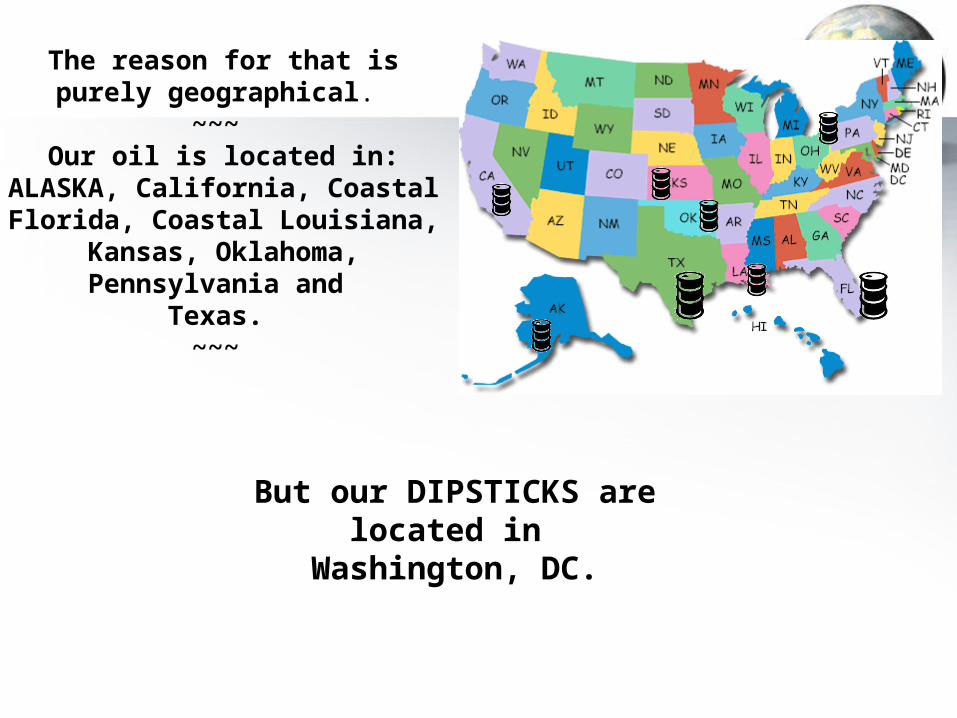
The reason for that is purely geographical.
~~~ Our oil is located in:
ALASKA, California, Coastal Florida, Coastal Louisiana,
Kansas, Oklahoma, Pennsylvania and
Texas. ~~~
But our DIPSTICKS are located in
Washington, DC.
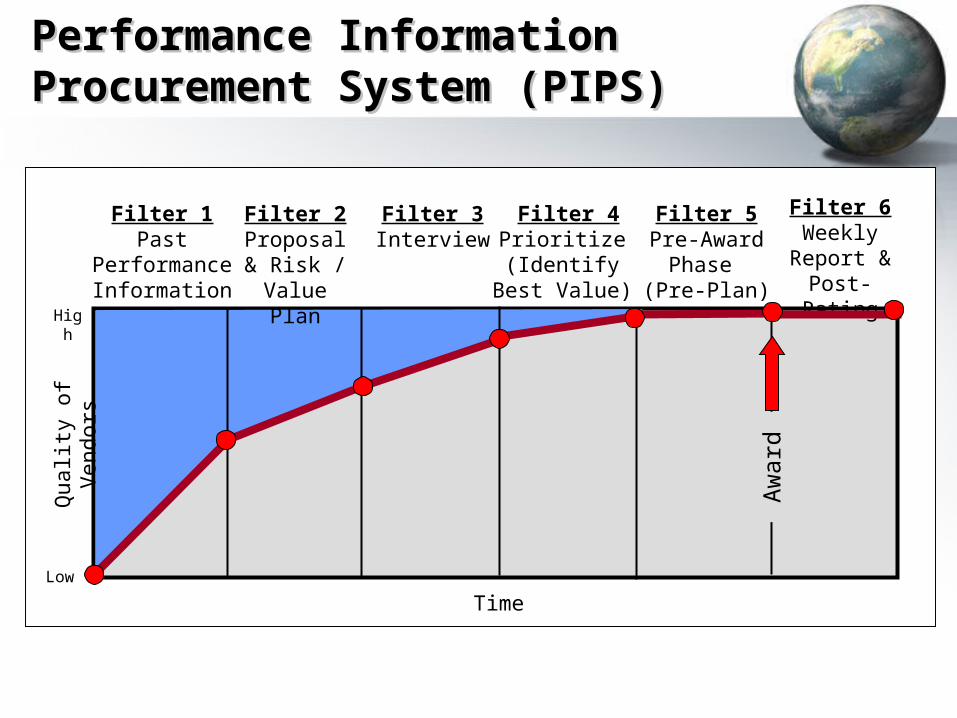
Filter 1Past
PerformanceInformation
Filter 2Proposal & Risk / Value
Plan
Filter 4Prioritize (Identify
Best Value)
Filter 5Pre-Award
Phase (Pre-Plan)
Filter 6Weekly
Report &Post-
Rating
Time
Qualit
y o
f V
endors
Filter 3Interview
Aw
ard
High
Low
Performance Information Performance Information Procurement System (PIPS)Procurement System (PIPS)

Me vs. Us
Us
RiskRiskss
RiskRiskss
Control Don’t Control
Control Don’t Control
Me & Them

Unforeseen Risks
PERFORMANCE SUMMARY• Vendor Performance• Client Performance• Individual Performance• Project Performance
QUALITY ASSURANCE• Checklist of Risks• Sign and Date
QUALITY CONTROL• Risk• Risk Minimization• Schedule
WEEKLY REPORT• Risk• Unforeseen Risks
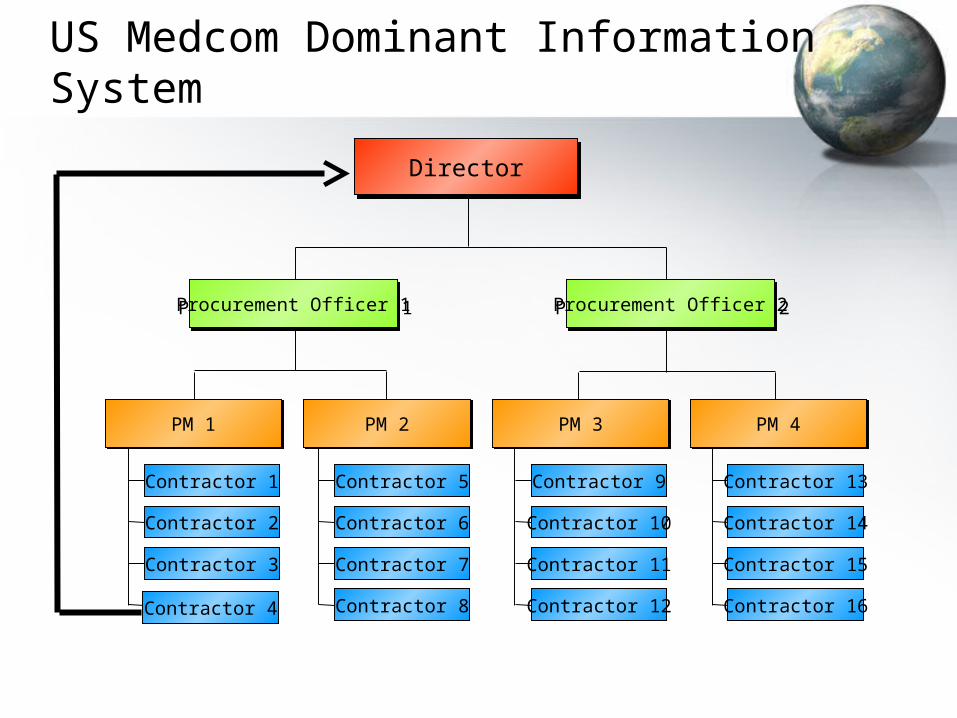
PM 1 PM 2 PM 3 PM 4
Procurement Officer 1 Procurement Officer 2
Director
Contractor 1
Contractor 2
Contractor 3
Contractor 4
Contractor 5
Contractor 6
Contractor 7
Contractor 8
Contractor 9
Contractor 10
Contractor 11
Contractor 12
Contractor 13
Contractor 14
Contractor 15
Contractor 16
US Medcom Dominant Information System
Procurement Officer 1 Procurement Officer 2
PM 1 PM 2 PM 3 PM 4
Director

Division Overview

Contractors
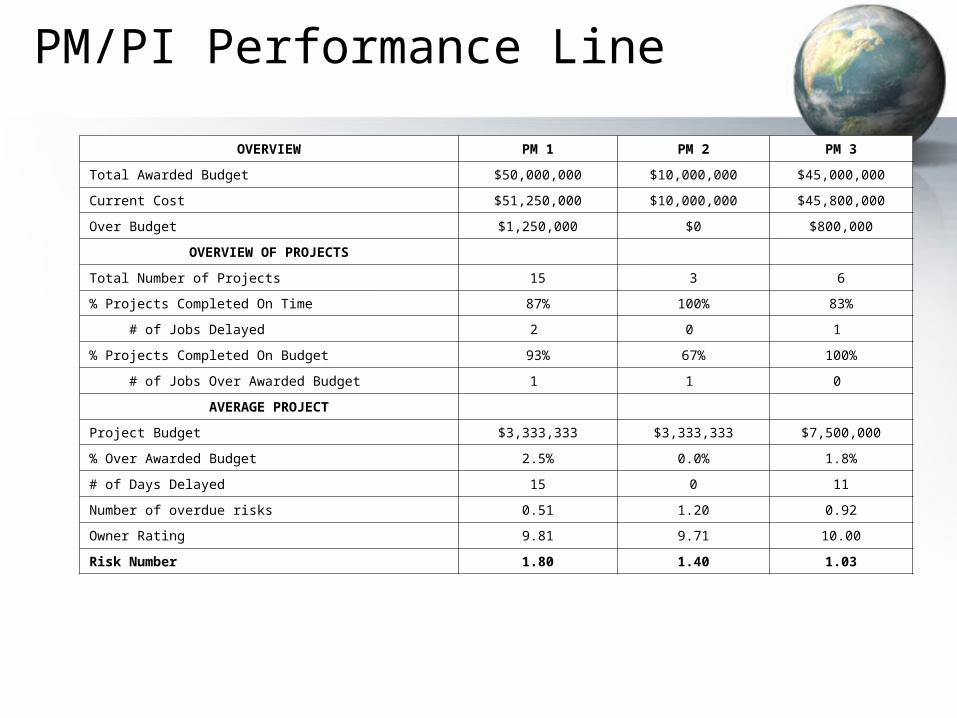
PM/PI Performance Line
OVERVIEW PM 1 PM 2 PM 3
Total Awarded Budget $50,000,000 $10,000,000 $45,000,000
Current Cost $51,250,000 $10,000,000 $45,800,000
Over Budget $1,250,000 $0 $800,000
OVERVIEW OF PROJECTS
Total Number of Projects 15 3 6
% Projects Completed On Time 87% 100% 83%
# of Jobs Delayed 2 0 1
% Projects Completed On Budget 93% 67% 100%
# of Jobs Over Awarded Budget 1 1 0
AVERAGE PROJECT
Project Budget $3,333,333 $3,333,333 $7,500,000
% Over Awarded Budget 2.5% 0.0% 1.8%
# of Days Delayed 15 0 11
Number of overdue risks 0.51 1.20 0.92
Owner Rating 9.81 9.71 10.00
Risk Number 1.80 1.40 1.03

UMN Pilot Program Analysis• Number of Best-Value Procurements: 45 (GC, Mech, Elec, Roof)
• Allocated Funds: $10.8M
• Awarded Cost: $10.0M (-7.4%)
• Average Number of Proposals: 3
• Projects Where Best-Value was also Lowest Cost: 49%
• Completed Projects: 18– Cost Increases: 5.4% (Client) / 0.4% (Unforeseen)– Schedule Increases: 49.6% (Client) / 0.8% (Unforeseen)– 16 projects had no contractor cost increases
• UMN Project Manager’s management decrease: 90%
• Average customer satisfaction: 100%
• Average contractor close out rating: 9.4
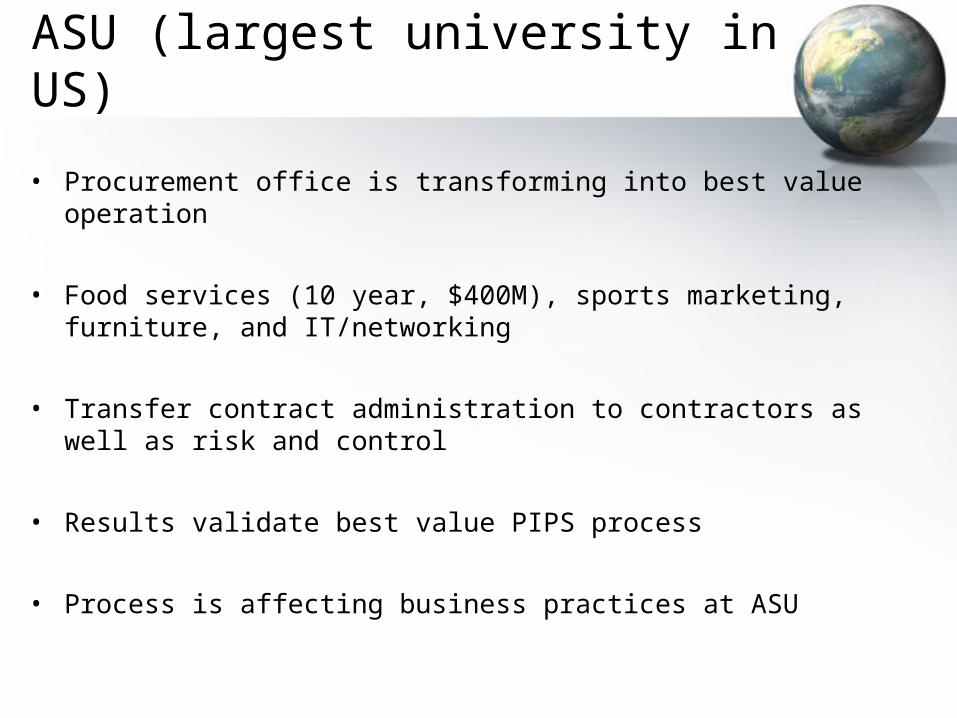
ASU (largest university in US)
• Procurement office is transforming into best value operation
• Food services (10 year, $400M), sports marketing, furniture, and IT/networking
• Transfer contract administration to contractors as well as risk and control
• Results validate best value PIPS process
• Process is affecting business practices at ASU

Commissions $30,254,170 $60,137,588 $64,000,000
Capital Investment $14,750,000 $20,525,000 $12,340,000
Equipment Replacement Reserve $ 7,213,342 $ 4,100,001 $ 8,171,811
Total $52,217,512 $84,762,589 $84,511,811
Raw Financial Analysis
Financial Criteria
Incumbent
A
Awarded vendor
B C
Total financial distance between incumbent and awarded vendor:$ 32,545,077 (66%)

Entergy Test Results
• $100K investment ($75K education/$25K license)• 7 projects, 3 completed• 83% low price• First two projects: $8M budget, regular bidders bid $6.7M on
two projects• BV contractor attracted by system bids $3.2M (saves Entergy
$3.7M, on time on budget, and met Entergy expectations.• Cushman & Wakefield PMs transferred off of both projects
(leaving no PM support on both projects)• Non-performer allowed to participate, performs well• Used on traditional delivery another project, does not perform
• Conclusions: best value saved funding, minimized need for PM, and assisted non-performing contractor to perform

Alpha Roofing ManufacturerNeogard and BASF
• 98% customer satisfaction
• 98% roofs not leaking
• Service period
• Customer satisfaction rating
• Every other year, physical inspection of roofs
• Every year, call every customer of roof larger than 5,000 SF

Alpha Contractor PLines

Performing Systems
• Location: Torrington, WY
• Roof installation: 1983 5 year spec
• Hailstorms: 1984, 1999
• Hail tested: 1995,2002
• Recoated: 2003: 3 inch steel ball from 17.75 feet
• Green, sustainable, lightweight, retrofit over existing

Dallas Independent School District
“Circle of Life”
Meaningless technical data &
Price based award
Poor quality products
Bad applicationsBuy Best Value
4343
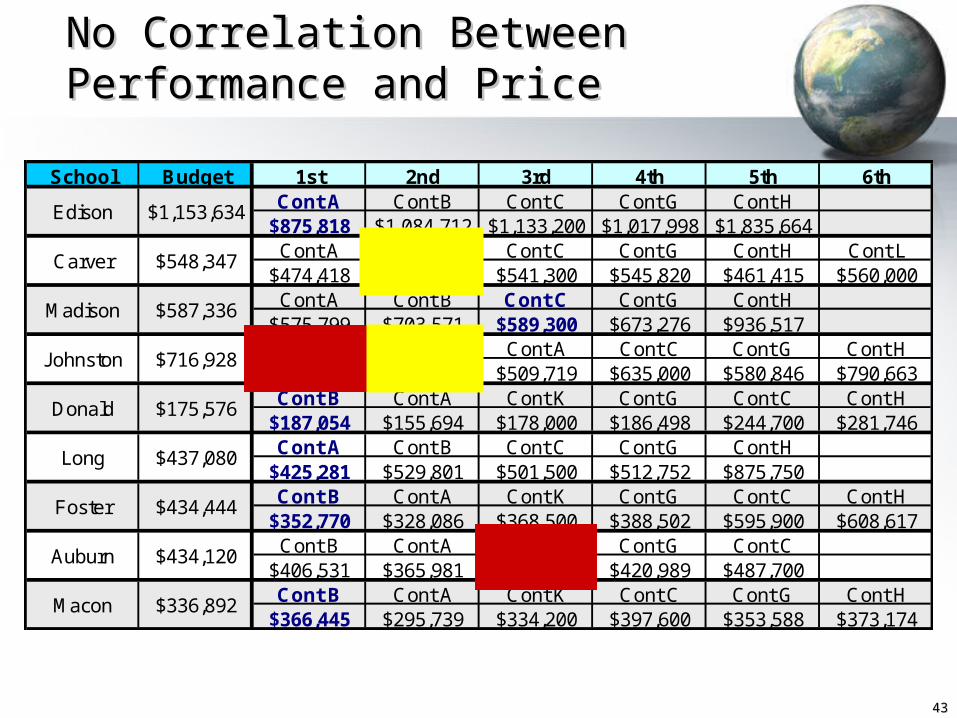
No Correlation Between Performance No Correlation Between Performance and Priceand Price
School Budget 1st 2nd 3rd 4th 5th 6thCont A Cont B Cont C Cont G Cont H
$875,818 $1,084,712 $1,133,200 $1,017,998 $1,835,664Cont A Cont B Cont C Cont G Cont H Cont L
$474,418 $428,540 $541,300 $545,820 $461,415 $560,000Cont A Cont B Cont C Cont G Cont H
$575,799 $703,571 $589,300 $673,276 $936,517Cont K Cont B Cont A Cont C Cont G Cont H
$447,000 $654,378 $509,719 $635,000 $580,846 $790,663Cont B Cont A Cont K Cont G Cont C Cont H
$187,054 $155,694 $178,000 $186,498 $244,700 $281,746Cont A Cont B Cont C Cont G Cont H
$425,281 $529,801 $501,500 $512,752 $875,750Cont B Cont A Cont K Cont G Cont C Cont H
$352,770 $328,086 $368,500 $388,502 $595,900 $608,617Cont B Cont A Cont K Cont G Cont C
$406,531 $365,981 $533,000 $420,989 $487,700Cont B Cont A Cont K Cont C Cont G Cont H
$366,445 $295,739 $334,200 $397,600 $353,588 $373,174
$716,928
$175,576
$437,080
$434,444
Auburn
Macon $336,892
$434,120
Johnston
Donald
Long
Foster
Edison
Carver
$1,153,634
Madison
$548,347
$587,336
Best Value PIPS Technology
• Contracts with vendors who minimize the risk they do not control
• Transfers risk and control
• Makes everyone accountable
• Creates a transparent system
• Uses dominant information
• Improves the way clients do business
• Procurement office becomes the agent of change, value, outsourcing, and accountability
Payoff
• 98% performance
• Minimize 90% of contract writing and administration
• Maximize vendor profit by 5%
• Pay same or less
• Increased value

Comments / QuestionsComments / Questions
Next Session: ASU Transformation