BREAKING THE ICE - concrete.org · BREAKING THE ICE CONTROLLING SCC IN HOT WEATHER ACI Salt Lake...
32
BREAKING THE ICE CONTROLLING SCC IN HOT WEATHER ACI Salt Lake City March 2018 – EllisDon Construction Sciences Stacia Van Zetten & Lloyd Keller WHEN YOU HAVE TO COOL IT
Transcript of BREAKING THE ICE - concrete.org · BREAKING THE ICE CONTROLLING SCC IN HOT WEATHER ACI Salt Lake...

BREAKING THE ICECONTROLLING SCC IN HOT WEATHERACI Salt Lake City March 2018 – EllisDon Construction Sciences
Stacia Van Zetten & Lloyd Keller
WHEN YOU HAVE TO COOL IT

CONSTRUCTIONSCIENCES
WHY COOL CONCRETE?

CONSTRUCTIONSCIENCES
ACI 301-16 “Specifications for Structural Concrete” and ACI
305.1-14 “Specification for Hot Weather Concreting” limit the
maximum concrete temperature to 95 °F (35 ºC) at the time
of discharge.
TO CONTROL THE EXOTHERM AND TEMPERATURE DIFFERENTIALS.

CONSTRUCTIONSCIENCES
ATRIO Tower Bogota, Colombia

CONSTRUCTIONSCIENCES
OPTIONS FOR COOLING CONCRETE

CONSTRUCTIONSCIENCES
1. Ice

CONSTRUCTIONSCIENCES
1. Ice
2. Liquid Nitrogen

CONSTRUCTIONSCIENCES
1. Ice
2. Liquid Nitrogen
3. Cooling Materials

CONSTRUCTIONSCIENCES

CONSTRUCTIONSCIENCES

CONSTRUCTIONSCIENCES
CHALLENGES WITH ICE

CONSTRUCTIONSCIENCES
1. Ice Shape/Geometry
Cube Flake
Sheet Tube

CONSTRUCTIONSCIENCES

CONSTRUCTIONSCIENCES
50
60
70
80
4:00 6:00 8:00 10:00 12:00 14:00
Slu
mp
(cm
)
Time
Slump at plant and slump at site with flake ice
Slump at Plant
Slump at Site
Linear (Slump at Plant)
Linear (Slump at Site)

CONSTRUCTIONSCIENCES
y = 9.9008x + 63.073
y = 8.4647x + 69.097
50
60
70
80
4:00 6:00 8:00 10:00 12:00
Slu
mp
(cm
)
Time
Slump at plant and slump at site with sheet ice
Slump at Plant
Slump at Site
Linear (Slump at Plant)
Linear (Slump at Site)
cube

CONSTRUCTIONSCIENCES
1. Ice Shape/Geometry
2. Ice Addition Methods


CONSTRUCTIONSCIENCES
1. Ice Shape/Geometry
2. Addition Methods

CONSTRUCTIONSCIENCES
CONSTRUCTIONSCIENCES
1. Ice Shape/Geometry
2. Addition Methods
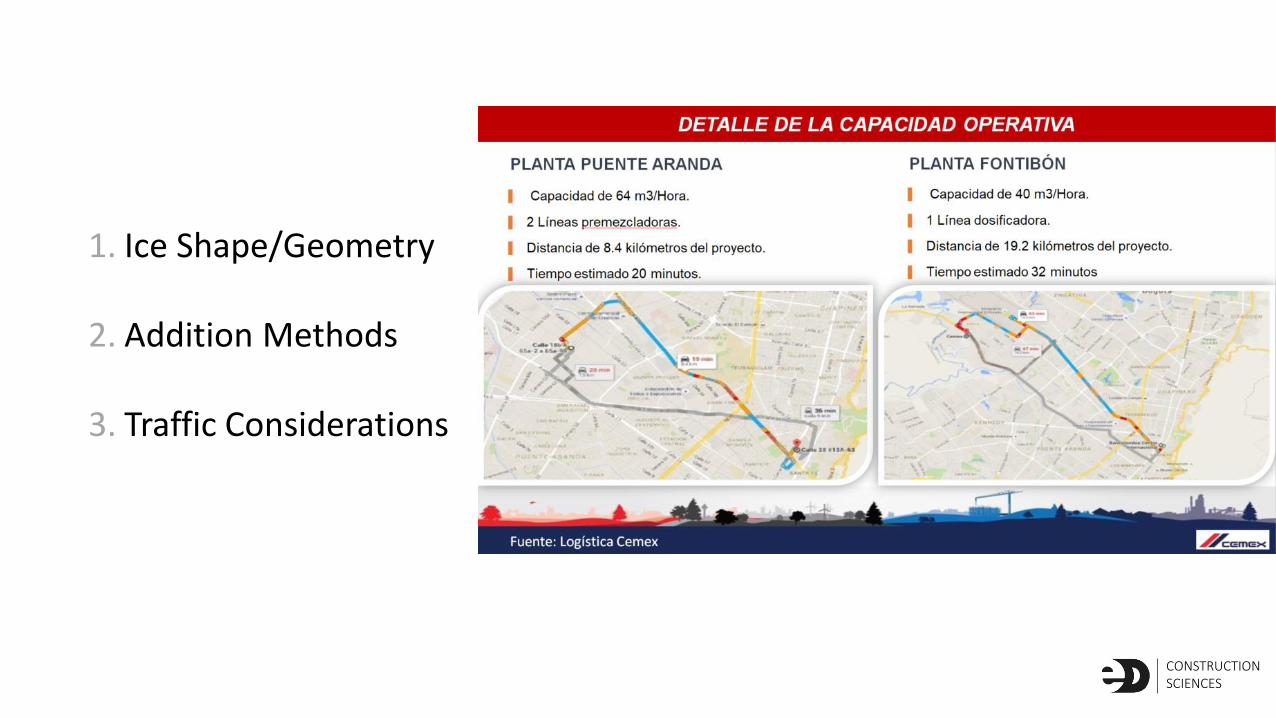
3. Traffic Considerations

ASIGNACIÓN DE FLOTA DE CONCRETOCAPACIDADES DE PRODUCCIÒN
Plantas
Estudio de Tiempos por horas y por días desde las plantas al proyecto
_Tiempo Transito [Min] Hora
Dia 0 1 2 3 4 5 6 7 8 9 10 11 12 13 14 15 16 17 18 19 20 21 22 23 Total general
Domingo 34,4 34,4 34,4 34,4 33,3 33,3 39,5 44,8 44,8 44,8 56,6 56,6 56,6 60,5 53,2 53,2 46,5 47,9 51,8 45,3
CO-PLANTA FONTIBÒN 36,4 36,4 36,4 36,4 33,6 33,6 42,0 49,0 49,0 49,0 56,0 56,0 56,0 63,0 56,0 56,0 49,0 56,0 56,0 47,7
CO-PLANTA PUENTE ARANDA 22,4 22,4 22,4 22,4 22,4 22,4 25,2 28,0 28,0 28,0 36,4 36,4 36,4 39,2 28,0 28,0 25,2 25,2 28,0 27,7
CO-PLANTA PUENTE ARANDA L2 22,4 22,4 22,4 22,4 22,4 22,4 25,2 28,0 28,0 28,0 36,4 36,4 36,4 39,2 28,0 28,0 25,2 25,2 28,0 27,7
CO-PLANTA SIBERIA 42,0 42,0 42,0 42,0 39,2 39,2 49,0 56,0 56,0 56,0 77,0 77,0 77,0 77,0 70,0 70,0 70,0 70,0 77,0 59,4
CO-PLANTA SUR (DTE) 49,0 49,0 49,0 49,0 49,0 49,0 56,0 63,0 63,0 63,0 77,0 77,0 77,0 84,0 84,0 84,0 63,0 63,0 70,0 64,1
Viernes 54,3 54,3 55,7 54,3 52,9 52,9 44,8 42,3 40,9 50,3
CO-PLANTA FONTIBÒN 63,0 63,0 63,0 63,0 63,0 63,0 49,0 49,0 42,0 57,6
CO-PLANTA PUENTE ARANDA 30,8 30,8 30,8 30,8 30,8 30,8 28,0 25,2 25,2 29,2
CO-PLANTA PUENTE ARANDA L2 30,8 30,8 30,8 30,8 30,8 30,8 28,0 25,2 25,2 29,2
CO-PLANTA SIBERIA 77,0 77,0 84,0 84,0 77,0 77,0 63,0 56,0 56,0 72,3
CO-PLANTA SUR (DTE) 70,0 70,0 70,0 63,0 63,0 63,0 56,0 56,0 56,0 63,0
Sábado 34,4 34,4 34,4 34,4 34,4 34,4 43,7 50,7 53,2 53,2 54,6 58,5 58,5 57,4 55,7 55,7 50,1 49,0 51,5 51,5 47,6 46,2 46,2 34,4 46,9
CO-PLANTA FONTIBÒN 36,4 36,4 36,4 36,4 36,4 36,4 49,0 56,0 56,0 56,0 56,0 63,0 63,0 70,0 63,0 63,0 56,0 56,0 56,0 56,0 56,0 49,0 49,0 36,4 51,2
CO-PLANTA PUENTE ARANDA 22,4 22,4 22,4 22,4 22,4 22,4 25,2 25,2 28,0 28,0 28,0 30,8 30,8 28,0 30,8 30,8 30,8 28,0 30,8 30,8 28,0 28,0 28,0 22,4 27,0
CO-PLANTA PUENTE ARANDA L2 22,4 22,4 22,4 22,4 22,4 22,4 25,2 25,2 28,0 28,0 28,0 30,8 30,8 28,0 30,8 30,8 30,8 28,0 30,8 30,8 28,0 28,0 28,0 22,4 27,0
CO-PLANTA SIBERIA 42,0 42,0 42,0 42,0 42,0 42,0 56,0 70,0 77,0 77,0 84,0 84,0 84,0 84,0 84,0 84,0 70,0 70,0 70,0 70,0 63,0 63,0 63,0 42,0 64,5
CO-PLANTA SUR (DTE) 49,0 49,0 49,0 49,0 49,0 49,0 63,0 77,0 77,0 77,0 77,0 84,0 84,0 77,0 70,0 70,0 63,0 63,0 70,0 70,0 63,0 63,0 63,0 49,0 64,8
Total general 34,4 34,4 34,4 34,4 33,9 33,9 41,6 47,7 49,0 49,0 55,6 57,5 57,5 58,9 54,5 54,4 50,3 50,9 52,5 52,2 50,3 45,5 44,2 37,7 46,9
Se realizo un estudio de la velocidad promedio por hora y por día para determinar los tiempos de ciclo desde cada una de las plantas hacia el proyecto, sehallaron tiempos de transito máximos desde Planta Sur al proyecto de 84 minutos en las horas pico.
Light Traffic Heavy Traffic

CONSTRUCTIONSCIENCES
0
5
10
15
20
25
30
50
60
70
80
90
100
110
120
3:00:00 5:00:00 7:00:00 9:00:00 11:00:00 13:00:00 15:00:00 17:00:00
Tem
pe
ratu
re (
°C)
Ice
(K
g)
Time
Ice Consumption
18/05/2017
8/06/2017
19/07/2017
23/08/2017
T Min (°C)
T Max (°C)

CONSTRUCTIONSCIENCES
1. Ice Shape/Geometry
2. Addition Methods
3. Traffic Considerations
4. Material Variations


CONSTRUCTIONSCIENCES
METHODS AND MEASUREMENTS TO CONTROL PROPERTIES

CONSTRUCTIONSCIENCES
Plastic Properties
1. Time between batching and placing (Max 2.5 hours with Hydration
Stabilizer)
2. Slump Flow (ASTM C1611) 60 – 70 cm
3. T50 (ASTM C1611) 2 – 5 seconds
4. VSI (ASTM C1611) 0 – 1
5. Temperature at placing (Maximum 22 deg C)
6. Air Content (Maximum 4%)

Slump at Plant Slump at Site

CONSTRUCTIONSCIENCES
SUMMARY

CONSTRUCTIONSCIENCES
WHAT WE LEARNED
• The shape of the ice can affect the consistency of the fresh concrete
• Control the way you add the ice
• Cool your materials by chilling water or shading aggregate
• Maximize stockpile size and moisture uniformity
• Pre planning early pours to avoid traffic and ambient temperature increase
• Monitor the fresh properties

Questions?CONSTRUCTIONSCIENCES