BRD Rural Pulse ssue , arch pril 21 - National Bank for ...€¦ · BRD Rural Pulse ssue , arch...
4
Department of Economic Analysis and Research 1 Rural Pulse Issue - VIII, March - April 2015 NABARD Borrowing paern of farmers Extent of Indebtedness Providing farmers access to instuonal credit has been the main rural policy goal as usury has been the major issue leading to serious and perpetual indebtedness of farmers. Due to input-intensive Green Revoluon which monezed the rural economy and increase in consumpon, the credit needs of farmers increased manifold. This situaon necessitated mul-agency approach to meet the challenge of meeng the credit needs through formal agencies. As per the latest survey results, in 2012, about 51.9 per cent of the agricultural house holds (HH) were indebted from one agency or the other. That is, about 48 per cent of the agricultural HH could not borrow. Compared to this, in 2002, the proporon of HH who availed credit was 48.6 per cent. Thus, there was a disappoinngly narrow decrease in the proporon of HH who could not obtain any loan during a period (between the years 2002 and 2012) which has seen maximum policy and instuonal intervenons such as doubling the credit programme, loan waivers, Banking Correspondents and Banking Facilitators, Financial Literacy and Inclusion drive, recapitalisaon of cooperaves and Regional Rural Banks and so on. One more trend in the data, again disquieng, is that increment in the proporon of borrowing HH increased as one moves from ny and small holdings to large holdings (Figure 1). K J S Satyasai* Introducon Recent round (70th) surveys by Naonal Sample Survey Office (NSSO) on Situaon of Agricultural Households in India and Debt and Investment in India have reported the situaon of agricultural households in the country. The decennial surveys have many things to report of which we present here an idea about how farmers borrow, produce and earn. Besides presenng the results comparave esmates from 59th round surveys (2002-03) of NSS were also discussed to get an idea of changes taken place over the decade. One may, however, note that esmates from these two rounds may not be strictly comparable due to certain changes in definions. Sources of credit Successive All India Debt Investment Surveys showed that the proporon of instuonal agencies in the total cash debts of culvators has increased over me thus reflecng the success of rural credit instuonalisaon policy. However, the 2002 survey results showed that the share of instuonal agencies in cash outstanding of culvators has declined to 61.1 per cent from a peak level of 66.3 in 1991. The share, though increased to 64 per cent in 2012, is sll less than the highest ever reached. Data on share of different sources of credit in outstanding cash dues across different farm size classes (Table 1) reveal four trends: (i) the share of cooperaves in outstanding credit declined between the year 2002 and 2012 for all farm *Deputy General Manager, Department of Economic Analysis and Research, NABARD, Mumbai, [email protected] How Indian farmers borrow, produce and earn? Evidence from recent NSSO surveys Table 1. Distribuon of outstanding loans by source of loan taken for different size classes of land possessed Credit Agency < 0.01 0.01 - 0.4 0.41 - 1 1.01 –2 2.01 –4 4.01 –10 10 + All sizes 2002 2012 2002 2012 2002 2012 2002 2012 2002 2012 2002 2012 2002 2012 2002 2012 Instuonal 22.6 14.9 43.3 46.9 52.8 53.2 57.6 64.8 65.1 67.5 68.8 71.5 67.6 78.9 57.7 59.8 government 1.9 0.4 4.0 1.3 3.8 1.7 1.7 2.6 1.5 1.9 1.3 3.8 1.7 1.1 2.5 2.1 coop society 5.3 1.6 14.5 14.6 17.0 13.9 20.5 14.7 22.6 15.6 23 17.5 23.2 14.3 19.6 14.8 bank 15.4 12.9 24.8 31.0 32 37.6 35.4 47.5 41 50 44.5 50.2 42.7 63.5 35.6 42.9 Non-instuonal 77.4 85.0 56.7 53.0 47.2 46.8 42.3 35.1 35.0 32.5 31.1 28.5 32.4 21.0 42.4 40.2 landlord 47.3 0.6 31.8 0.8 30.8 0.8 25.9 0.7 23.4 1.4 16.7 0.4 17.2 0 25.7 0.8 shopkeeper/ trader 23.1 1.4 14.9 2.5 9.1 6.6 8.8 1.5 5.1 1.2 5.6 1.4 4.0 0.5 8.5 2.9 relaves/ friends 1.0 17.5 1.4 14.2 0.7 10.6 0.8 7.6 0.4 5.8 1.5 6.5 0 3.8 0.9 9.1 others 2.0 1.8 3.7 3.1 2.0 1.4 2.6 2.0 1.4 0.3 1.2 1.5 0.6 0.6 2.1 1.6 All 100 100 100 100 100 100 100 100 100 100 100 100 100 100 100 100 Source: NSSO, Situation Assessment Survey, 2003 and 2014.
Transcript of BRD Rural Pulse ssue , arch pril 21 - National Bank for ...€¦ · BRD Rural Pulse ssue , arch...

Department of Economic Analysis and Research 1
Rural Pulse Issue - VIII, March - April 2015NABARD
Borrowing pattern of farmersExtent of IndebtednessProviding farmers access to institutional credit has been the main rural policy goal as usury has been the major issue leading to serious and perpetual indebtedness of farmers. Due to input-intensive Green Revolution which monetized the rural economy and increase in consumption, the credit needs of farmers increased manifold. This situation necessitated multi-agency approach to meet the challenge of meeting the credit needs through formal agencies. As per the latest survey results, in 2012, about 51.9 per cent of the agricultural house holds (HH) were indebted from one agency or the other. That is, about 48 per cent of the agricultural HH could not borrow. Compared to this, in 2002, the proportion of HH who availed credit was 48.6 per cent. Thus, there was a disappointingly narrow decrease in the proportion of HH who could not obtain any loan during a period (between the years 2002 and 2012) which has seen maximum policy and institutional interventions such as doubling the credit programme, loan waivers, Banking Correspondents and Banking Facilitators, Financial Literacy and Inclusion drive, recapitalisation of cooperatives and Regional Rural Banks and so on. One more trend in the data, again disquieting, is that increment in the proportion of borrowing HH increased as one moves from tiny and small holdings to large holdings (Figure 1).
K J S Satyasai*
IntroductionRecent round (70th) surveys by National Sample Survey Office (NSSO) on Situation of Agricultural Households in India and Debt and Investment in India have reported the situation of agricultural households in the country. The decennial surveys have many things to report of which we present here an idea about how farmers borrow, produce and earn. Besides presenting the results comparative estimates from 59th round surveys (2002-03) of NSS were also discussed to get an idea of changes taken place over the decade. One may, however, note that estimates from these two rounds may not be strictly comparable due to certain changes in definitions.
Sources of creditSuccessive All India Debt Investment Surveys showed that the proportion of institutional agencies in the total cash debts of cultivators has increased over time thus reflecting the success of rural credit institutionalisation policy. However, the 2002 survey results showed that the share of institutional agencies in cash outstanding of cultivators has declined to 61.1 per cent from a peak level of 66.3 in 1991. The share, though increased to 64 per cent in 2012, is still less than the highest ever reached.
Data on share of different sources of credit in outstanding cash dues across different farm size classes (Table 1) reveal four trends: (i) the share of cooperatives in outstanding credit declined between the year 2002 and 2012 for all farm
*Deputy General Manager, Department of Economic Analysis and Research, NABARD, Mumbai, [email protected]
How Indian farmers borrow, produce and earn?Evidence from recent NSSO surveys
Table 1. Distribution of outstanding loans by source of loan taken for different size classes of land possessed Credit Agency < 0.01 0.01 - 0.4 0.41 - 1 1.01 –2 2.01 –4 4.01 –10 10 + All sizes
2002 2012 2002 2012 2002 2012 2002 2012 2002 2012 2002 2012 2002 2012 2002 2012Institutional 22.6 14.9 43.3 46.9 52.8 53.2 57.6 64.8 65.1 67.5 68.8 71.5 67.6 78.9 57.7 59.8government 1.9 0.4 4.0 1.3 3.8 1.7 1.7 2.6 1.5 1.9 1.3 3.8 1.7 1.1 2.5 2.1coop society 5.3 1.6 14.5 14.6 17.0 13.9 20.5 14.7 22.6 15.6 23 17.5 23.2 14.3 19.6 14.8
bank 15.4 12.9 24.8 31.0 32 37.6 35.4 47.5 41 50 44.5 50.2 42.7 63.5 35.6 42.9
Non-institutional 77.4 85.0 56.7 53.0 47.2 46.8 42.3 35.1 35.0 32.5 31.1 28.5 32.4 21.0 42.4 40.2landlord 47.3 0.6 31.8 0.8 30.8 0.8 25.9 0.7 23.4 1.4 16.7 0.4 17.2 0 25.7 0.8shopkeeper/ trader 23.1 1.4 14.9 2.5 9.1 6.6 8.8 1.5 5.1 1.2 5.6 1.4 4.0 0.5 8.5 2.9relatives/ friends 1.0 17.5 1.4 14.2 0.7 10.6 0.8 7.6 0.4 5.8 1.5 6.5 0 3.8 0.9 9.1others 2.0 1.8 3.7 3.1 2.0 1.4 2.6 2.0 1.4 0.3 1.2 1.5 0.6 0.6 2.1 1.6All 100 100 100 100 100 100 100 100 100 100 100 100 100 100 100 100Source: NSSO, Situation Assessment Survey, 2003 and 2014.

2Department of Economic Analysis and Research
Rural Pulse Issue - VIII, March - April 2015NABARD
for meeting household expenses of which share of loans for medical purposes doubled and for education trebled. The share of other expenses has increased significantly over the decade. This has implications for the households and the financing agencies. Since formal agencies cannot fund household expenses, farmers have to take recourse to informal agencies. Formal agencies hardly have products for meeting household expenses except a few items such as higher education and housing. This trend may explain why the share of non-institutional agencies has not come down between 2002 and 2012.
Terms of loans – interest and duration (rural)Table 3 gives distribution of loans outstanding according to interest rates. There is a general decline in interest rates with a decline of average rate from 18.91 per cent in 2002 to 17.00 per cent in 2012. The decline is higher in case of institutional loans by 264 basis points from 14.31 per cent in 2002. Interest rate on non-institutional loans declined but by 114 basis points from 26.34 per cent in 2002.
Loans have been taken for different purposes such as meeting capital and current expenses for farm as well as non-farm business, household expenses on education, medical treatment, consumption, weddings, housing and other items. Distribution of loan outstanding according to purpose for the years 2002 and 2012, given in Figure 2, reveals that the share of loans taken for farm business has come down while non-farm business has accounted for a higher share in 2012 compared to 2002. Increasingly loans are taken
Table 2. Estimated number of total and indebted farmer households in each size class of land possessed
Farm Size class
Average Loan Amount outstanding (Rs.)
Annual compound growth rate (%) - nominal
2002 2012 2012 real< 0.01 6121 31100 8860 17.7
0.01 - 0.4 6545 23900 6809 13.80.41 - 1 8623 35400 10085 15.21.01 –2 13762 54800 15613 14.82.01 –4 23456 94900 27037 15.04.01 –10 42532 182700 52051 15.710 + 76232 290300 82707 14.3All sizes 12585 47000 13390 14.1Source: NSSO, Situation Assessment Survey, 2003 and 2014.
sizes (by about 5 percentage points at the aggregate level) except for tiny holdings of less than 0.4 ha and the share of commercial banks increased (almost 7 percentage points overall); (ii) the share of landlords/employer which has been a major source in 2002 especially for marginal and tiny holders declined in its importance to negligible level in 2012; (iii) the relative importance of agricultural and professional moneylenders increased (from 5.2 to 25.8 % at the aggregate level); and, (iv) the importance of shopkeepers and traders as financiers to small, marginal and tiny holders has declined and the relatives and friends replaced them to a large extent.
Loan Amount and PurposeThe average loan outstanding is Rs.47000 ranging from Rs.31100 for land less farmers and 290300 for farmers having 10 ha or above. The average loan outstanding has increased by 3 ½ times from Rs.12585 in 2002 (Table 2). Loan outstanding improved marginally in real terms when we deflated with GDP deflator. These results are disappointing considering several initiatives taken up for credit intensification during the interregnum period.
Table 3. Distribution of loans outstanding according to interest rateInterest rate class
% distribution of outstanding debt
institutional non-inst. all2002 2012 2002 2012 2002 2012
nil 1 0.8 18 18.3 8 8.5<6 2 7.1 2 2.3 2 5 6-10 4 26 1 0.4 3 14.7 10-12 9 12.9 1 0.7 5 7.5 12-15 48 42.6 1 4.1 28 25.715-20 34 7.3 3 5.6 21 6.620-25 1 2.1 33 33.9 15 16.125-30 0 0.1 0 0.6 0 0.3>30 0 1 40 34.1 17 15.6Total 100 100 100 100 100 100average rate of interest
14.31 11.67 26.34 25.20 18.91 17.00
Source: NSSO, Situation Assessment Survey, 2003 and 2014.
Average duration of the loans outstanding is 2.16 years in 2012 which indicates lowering of the loan tenure compared to earlier time periods (Table 4). Most loans are of less than a year duration accounting for 45 per cent of the total in 2012. This proportion is higher compared to 36 to 37 per cent share in earlier periods.
Table 4. Distribution of loans outstanding according to durationDuration in years Distribution of loans outstanding (%)
1971 1981 1991 2002 2012< 1 37 36 37 36 45 1-2 23 20 23 23 20 2-3 17 12 14 15 14 3-4 9 7 8 8 6 4-5 4 4 5 6 5 5-10 10 18 9 9 8 0&above 1 2 3 4 2All 101 100 100 100 100Average duration 2.30 2.83 2.46 2.60 2.16Source: NSSO, All India Debt Investment Survey, 2003 and 2014.
Department of Economic Analysis and Research 3
Rural Pulse Issue - VIII, March - April 2015NABARD
Income of Agricultural HouseholdsAn average agricultural household earned Rs.77112 per annum from all his activities during 2012-13 (Table 5). However, due to high consumption expenditure his net surplus is very meagre at Rs.2,436. Compared to the year 2002-03, income and consumption grew at 11.8 and 8.4 per cent, respectively. Due to the higher growth of income over consumption during the decade the HH could offset the deficit of income over expenditure during 2002-03. Small and tiny land holders and the landless have very high propensity to consume upwards of about 0.90 and hence, they had deficit of income over expenditure. Income of highest farm size class as a multiple to that of the lowest is 9 in 2012-13 compared to 7 in 2002-03. That is income inequalities have widened between the two years.
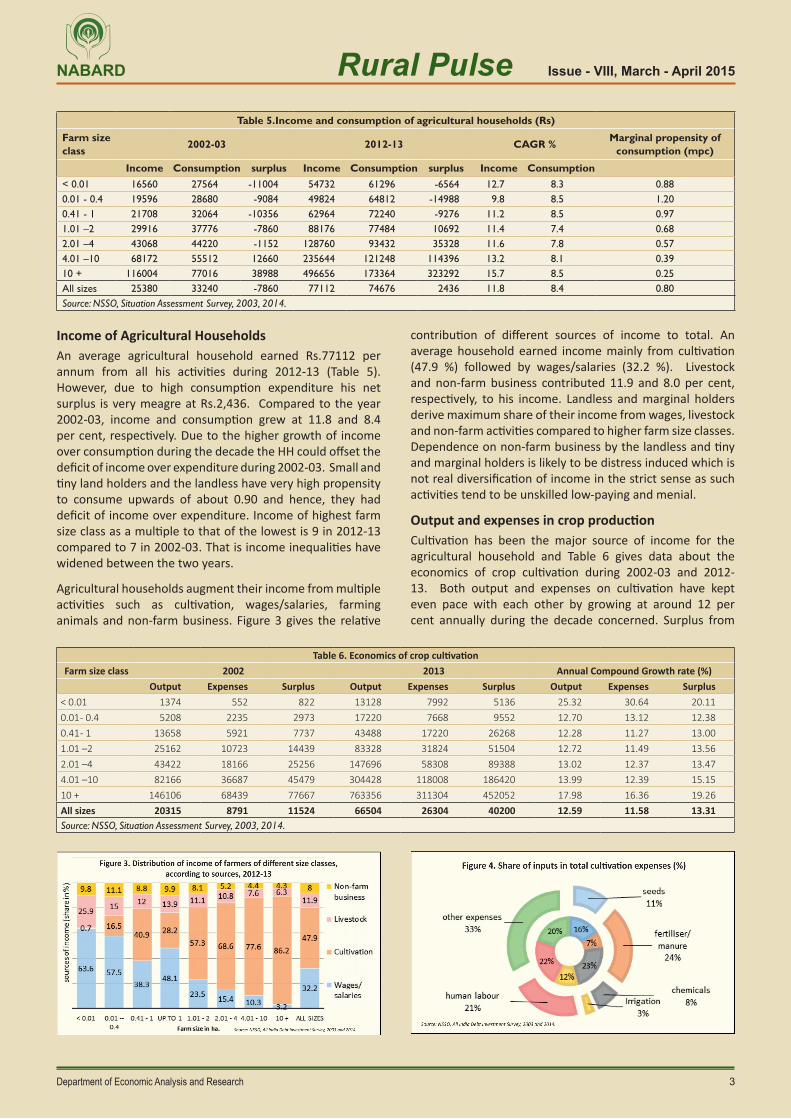
Agricultural households augment their income from multiple activities such as cultivation, wages/salaries, farming animals and non-farm business. Figure 3 gives the relative
contribution of different sources of income to total. An average household earned income mainly from cultivation (47.9 %) followed by wages/salaries (32.2 %). Livestock and non-farm business contributed 11.9 and 8.0 per cent, respectively, to his income. Landless and marginal holders derive maximum share of their income from wages, livestock and non-farm activities compared to higher farm size classes. Dependence on non-farm business by the landless and tiny and marginal holders is likely to be distress induced which is not real diversification of income in the strict sense as such activities tend to be unskilled low-paying and menial.
Output and expenses in crop productionCultivation has been the major source of income for the agricultural household and Table 6 gives data about the economics of crop cultivation during 2002-03 and 2012-13. Both output and expenses on cultivation have kept even pace with each other by growing at around 12 per cent annually during the decade concerned. Surplus from
Table 5.Income and consumption of agricultural households (Rs)
Farm size class 2002-03 2012-13 CAGR % Marginal propensity of
consumption (mpc)
Income Consumption surplus Income Consumption surplus Income Consumption< 0.01 16560 27564 -11004 54732 61296 -6564 12.7 8.3 0.880.01 - 0.4 19596 28680 -9084 49824 64812 -14988 9.8 8.5 1.200.41 - 1 21708 32064 -10356 62964 72240 -9276 11.2 8.5 0.971.01 –2 29916 37776 -7860 88176 77484 10692 11.4 7.4 0.682.01 –4 43068 44220 -1152 128760 93432 35328 11.6 7.8 0.574.01 –10 68172 55512 12660 235644 121248 114396 13.2 8.1 0.3910 + 116004 77016 38988 496656 173364 323292 15.7 8.5 0.25All sizes 25380 33240 -7860 77112 74676 2436 11.8 8.4 0.80Source: NSSO, Situation Assessment Survey, 2003, 2014.
Table 6. Economics of crop cultivationFarm size class 2002 2013 Annual Compound Growth rate (%)
Output Expenses Surplus Output Expenses Surplus Output Expenses Surplus< 0.01 1374 552 822 13128 7992 5136 25.32 30.64 20.110.01 - 0.4 5208 2235 2973 17220 7668 9552 12.70 13.12 12.380.41 - 1 13658 5921 7737 43488 17220 26268 12.28 11.27 13.001.01 –2 25162 10723 14439 83328 31824 51504 12.72 11.49 13.562.01 –4 43422 18166 25256 147696 58308 89388 13.02 12.37 13.474.01 –10 82166 36687 45479 304428 118008 186420 13.99 12.39 15.1510 + 146106 68439 77667 763356 311304 452052 17.98 16.36 19.26All sizes 20315 8791 11524 66504 26304 40200 12.59 11.58 13.31Source: NSSO, Situation Assessment Survey, 2003, 2014.
4Department of Economic Analysis and Research
Rural Pulse Issue - VIII, March - April 2015NABARD
Publisher :- Shri M. V. Ashok, CGM. Department of Economic Analysis and Research (DEAR), NABARD, Mumbai.
Disclaimer: “Rural Pulse” is the publication of the Bank. The opinions expressed in the publication, are that of the Research Team and not necessarily reflect those of the Bank or its subsidiaries. The contents can be reproduced with proper acknowledgement. The write-up is based on information & data procured from various sources and no responsibility is accepted for the accuracy of facts and figures. The Bank or the Research Team assumes no liability, if any, person or entity relies on views, opinions or facts & figures finding place in the document.
email ID : [email protected] www. nabard.org.
cultivation improved during the decade, though in nominal terms. In real terms, considering the growth of GDP deflator between these two years, however, the economics did not seem to have improved.
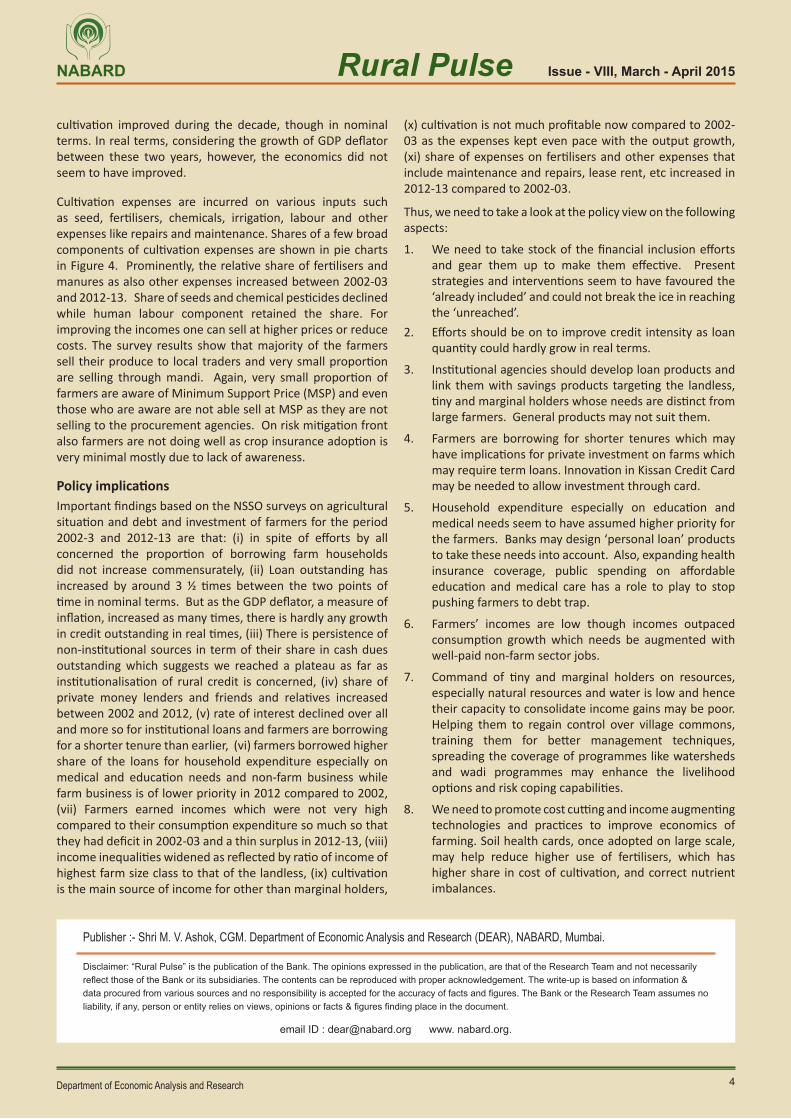
Cultivation expenses are incurred on various inputs such as seed, fertilisers, chemicals, irrigation, labour and other expenses like repairs and maintenance. Shares of a few broad components of cultivation expenses are shown in pie charts in Figure 4. Prominently, the relative share of fertilisers and manures as also other expenses increased between 2002-03 and 2012-13. Share of seeds and chemical pesticides declined while human labour component retained the share. For improving the incomes one can sell at higher prices or reduce costs. The survey results show that majority of the farmers sell their produce to local traders and very small proportion are selling through mandi. Again, very small proportion of farmers are aware of Minimum Support Price (MSP) and even those who are aware are not able sell at MSP as they are not selling to the procurement agencies. On risk mitigation front also farmers are not doing well as crop insurance adoption is very minimal mostly due to lack of awareness.
Policy implicationsImportant findings based on the NSSO surveys on agricultural situation and debt and investment of farmers for the period 2002-3 and 2012-13 are that: (i) in spite of efforts by all concerned the proportion of borrowing farm households did not increase commensurately, (ii) Loan outstanding has increased by around 3 ½ times between the two points of time in nominal terms. But as the GDP deflator, a measure of inflation, increased as many times, there is hardly any growth in credit outstanding in real times, (iii) There is persistence of non-institutional sources in term of their share in cash dues outstanding which suggests we reached a plateau as far as institutionalisation of rural credit is concerned, (iv) share of private money lenders and friends and relatives increased between 2002 and 2012, (v) rate of interest declined over all and more so for institutional loans and farmers are borrowing for a shorter tenure than earlier, (vi) farmers borrowed higher share of the loans for household expenditure especially on medical and education needs and non-farm business while farm business is of lower priority in 2012 compared to 2002, (vii) Farmers earned incomes which were not very high compared to their consumption expenditure so much so that they had deficit in 2002-03 and a thin surplus in 2012-13, (viii) income inequalities widened as reflected by ratio of income of highest farm size class to that of the landless, (ix) cultivation is the main source of income for other than marginal holders,
(x) cultivation is not much profitable now compared to 2002-03 as the expenses kept even pace with the output growth, (xi) share of expenses on fertilisers and other expenses that include maintenance and repairs, lease rent, etc increased in 2012-13 compared to 2002-03.
Thus, we need to take a look at the policy view on the following aspects:
1. We need to take stock of the financial inclusion efforts and gear them up to make them effective. Present strategies and interventions seem to have favoured the ‘already included’ and could not break the ice in reaching the ‘unreached’.
2. Efforts should be on to improve credit intensity as loan quantity could hardly grow in real terms.
3. Institutional agencies should develop loan products and link them with savings products targeting the landless, tiny and marginal holders whose needs are distinct from large farmers. General products may not suit them.
4. Farmers are borrowing for shorter tenures which may have implications for private investment on farms which may require term loans. Innovation in Kissan Credit Card may be needed to allow investment through card.
5. Household expenditure especially on education and medical needs seem to have assumed higher priority for the farmers. Banks may design ‘personal loan’ products to take these needs into account. Also, expanding health insurance coverage, public spending on affordable education and medical care has a role to play to stop pushing farmers to debt trap.
6. Farmers’ incomes are low though incomes outpaced consumption growth which needs be augmented with well-paid non-farm sector jobs.
7. Command of tiny and marginal holders on resources, especially natural resources and water is low and hence their capacity to consolidate income gains may be poor. Helping them to regain control over village commons, training them for better management techniques, spreading the coverage of programmes like watersheds and wadi programmes may enhance the livelihood options and risk coping capabilities.
8. We need to promote cost cutting and income augmenting technologies and practices to improve economics of farming. Soil health cards, once adopted on large scale, may help reduce higher use of fertilisers, which has higher share in cost of cultivation, and correct nutrient imbalances.