BRCA-Monet: a breast cancer specific drug treatment mode-of-action network for treatment
15
RESEARCH Open Access BRCA-Monet: a breast cancer specific drug treatment mode-of-action network for treatment effective prediction using large scale microarray database Chifeng Ma 1 , Hung-I Harry Chen 2 , Mario Flores 1 , Yufei Huang 1,3* , Yidong Chen 2,3* From The International Conference on Intelligent Biology and Medicine (ICIBM 2013) Nashville, TN, USA. 11-13 August 2013 Abstract Background: Connectivity map (cMap) is a recent developed dataset and algorithm for uncovering and understanding the treatment effect of small molecules on different cancer cell lines. It is widely used but there are still remaining challenges for accurate predictions. Method: Here, we propose BRCA-MoNet, a network of drug mode of action (MoA) specific to breast cancer, which is constructed based on the cMap dataset. A drug signature selection algorithm fitting the characteristic of cMap data, a quality control scheme as well as a novel query algorithm based on BRCA-MoNet are developed for more effective prediction of drug effects. Result: BRCA-MoNet was applied to three independent data sets obtained from the GEO database: Estrodial treated MCF7 cell line, BMS-754807 treated MCF7 cell line, and a breast cancer patient microarray dataset. In the first case, BRCA-MoNet could identify drug MoAs likely to share same and reverse treatment effect. In the second case, the result demonstrated the potential of BRCA-MoNet to reposition drugs and predict treatment effects for drugs not in cMap data. In the third case, a possible procedure of personalized drug selection is showcased. Conclusions: The results clearly demonstrated that the proposed BRCA-MoNet approach can provide increased prediction power to cMap and thus will be useful for identification of new therapeutic candidates. Website: The web based application is developed and can be access through the following link http:// compgenomics.utsa.edu/BRCAMoNet/ Background The ultimate goal of personalized medicine is to design treatments that optimize the therapeutic benefits and minimize the potential risk of toxicity for individual patient. Current pharmacogenomics research is striving to guide compound development and drug selection for such purpose. This growing need for personalized treatment has pushed the development of high-through technologies such as microarray and high throughput sequencing to the research forefront, where compound selection methods based on DNA or mRNA profiling have been developed to achieve highest benefit from therapeutic intervention but at the same time lowest risk of side effects [1-6]. In the meantime, these high-throughput profiling technologies could be applied to elucidate the mechanism of compound treatment in inducing or inhibiting gene expression regu- lation at different levels. In this study, the focus is on using gene expression profiling for drug screen and effec- tive treatment prediction. * Correspondence: [email protected]; [email protected] 1 Department of Electrical and Computer Engineering, the University of Texas at San Antonio, One UTSA Circle, San Antonio, Texas, USA 2 Greehey Children Cancer Research Institute, the University of Texas Health Science Center at San Antonio, San Antonio, Texas, USA Full list of author information is available at the end of the article Ma et al. BMC Systems Biology 2013, 7(Suppl 5):S5 http://www.biomedcentral.com/1752-0509/7/S5/S5 © 2013 Ma et al.; licensee BioMed Central Ltd. This is an Open Access article distributed under the terms of the Creative Commons Attribution License (http://creativecommons.org/licenses/by/2.0), which permits unrestricted use, distribution, and reproduction in any medium, provided the original work is properly cited. The Creative Commons Public Domain Dedication waiver (http:// creativecommons.org/publicdomain/zero/1.0/) applies to the data made available in this article, unless otherwise stated.
Transcript of BRCA-Monet: a breast cancer specific drug treatment mode-of-action network for treatment
RESEARCH Open Access
BRCA-Monet: a breast cancer specific drugtreatment mode-of-action network for treatmenteffective prediction using large scale microarraydatabaseChifeng Ma1, Hung-I Harry Chen2, Mario Flores1, Yufei Huang1,3*, Yidong Chen2,3*
From The International Conference on Intelligent Biology and Medicine (ICIBM 2013)Nashville, TN, USA. 11-13 August 2013
Abstract
Background: Connectivity map (cMap) is a recent developed dataset and algorithm for uncovering andunderstanding the treatment effect of small molecules on different cancer cell lines. It is widely used but there arestill remaining challenges for accurate predictions.
Method: Here, we propose BRCA-MoNet, a network of drug mode of action (MoA) specific to breast cancer, whichis constructed based on the cMap dataset. A drug signature selection algorithm fitting the characteristic of cMapdata, a quality control scheme as well as a novel query algorithm based on BRCA-MoNet are developed for moreeffective prediction of drug effects.
Result: BRCA-MoNet was applied to three independent data sets obtained from the GEO database: Estrodialtreated MCF7 cell line, BMS-754807 treated MCF7 cell line, and a breast cancer patient microarray dataset. In thefirst case, BRCA-MoNet could identify drug MoAs likely to share same and reverse treatment effect. In the secondcase, the result demonstrated the potential of BRCA-MoNet to reposition drugs and predict treatment effects fordrugs not in cMap data. In the third case, a possible procedure of personalized drug selection is showcased.
Conclusions: The results clearly demonstrated that the proposed BRCA-MoNet approach can provide increasedprediction power to cMap and thus will be useful for identification of new therapeutic candidates.Website: The web based application is developed and can be access through the following link http://compgenomics.utsa.edu/BRCAMoNet/
BackgroundThe ultimate goal of personalized medicine is to designtreatments that optimize the therapeutic benefits andminimize the potential risk of toxicity for individualpatient. Current pharmacogenomics research is striving toguide compound development and drug selection for suchpurpose. This growing need for personalized treatment
has pushed the development of high-through technologiessuch as microarray and high throughput sequencing to theresearch forefront, where compound selection methodsbased on DNA or mRNA profiling have been developed toachieve highest benefit from therapeutic intervention butat the same time lowest risk of side effects [1-6]. In themeantime, these high-throughput profiling technologiescould be applied to elucidate the mechanism of compoundtreatment in inducing or inhibiting gene expression regu-lation at different levels. In this study, the focus is onusing gene expression profiling for drug screen and effec-tive treatment prediction.
* Correspondence: [email protected]; [email protected] of Electrical and Computer Engineering, the University of Texasat San Antonio, One UTSA Circle, San Antonio, Texas, USA2Greehey Children Cancer Research Institute, the University of Texas HealthScience Center at San Antonio, San Antonio, Texas, USAFull list of author information is available at the end of the article
Ma et al. BMC Systems Biology 2013, 7(Suppl 5):S5http://www.biomedcentral.com/1752-0509/7/S5/S5
© 2013 Ma et al.; licensee BioMed Central Ltd. This is an Open Access article distributed under the terms of the Creative CommonsAttribution License (http://creativecommons.org/licenses/by/2.0), which permits unrestricted use, distribution, and reproduction inany medium, provided the original work is properly cited. The Creative Commons Public Domain Dedication waiver (http://creativecommons.org/publicdomain/zero/1.0/) applies to the data made available in this article, unless otherwise stated.
Besides genome-wide association studies, the currentgene expression based approaches are mainly based on the“signature gene set” concept, which has been perfectedduring the past 14 years of relentless efforts in gene expres-sion profiles of cancer, cardiovascular disease, diabetes andother disease researches. [7-10]. The key differences of this“signature gene set” approach from traditional linkage-based genetics study lie in two aspects. First, the “signaturegene set” approach can identify genomic variation, being itin SNP, DNA copy number alteration, or miss-regulationof gene expression. Second, it can predict the relevant bio-logical pathways, protein-protein interaction networks, andgene ontology functional groups, thus identifying noveltherapeutic targets/biomarkers for drug discovery, with thehope that their variations from patient to patient couldexplain large portion of dosage variation, resistance andefficacy of the drug [11]. As such, one could also hypothe-size that the activities (the relative abundance and interac-tions) of these signature genes could be part of drugtargets, or mode-of-action (MoA), as these genes can beused to explain tumor types and differences in chemother-apeutic response of patients. In other words, activities ofsignature genes could be used to predict the drug sensitiv-ity. In addition, one may extend this hypothesis furthersuch that this prediction of pharmacological levels in celltype could be extrapolated to other cell types. Applicationsof these hypotheses have been developed in many studies[12,13]. One of the most notable work is the connectivitymap (cMap) project [12], where 4 human cell lines(MCF7/ssMCF7, HL60, PC3, and SKMEL5) were treatedby 1,309 chemical compounds at different dosages, andtheir expression profiles were generated. A prediction algo-rithm based on gene set enrichment analysis (GSEA) [14]was also developed to rank compounds based on input sig-nature genes obtained from tumor comparison. This pro-ject has been widely adapted and developed in the drugdiscovery area. Several treatment candidates have been dis-covered for cancer cell lines in the cMap project by directlyapplying the cMap approach [15-17]. With the idea ofsearching for ‘inverse signature’ to the phonotype of inter-est, this approach has been extended to predict treatmentpotentials of compounds not included in the cMap project[18-22]. In addition to the original cMap approach, multi-ple other methods have been developed based on cMapdata for new drug repositioning approaches [23-28] orimproving the performance of exist cMap [29-31].Although cMap has been widely applied, problems
remain to be resolved for reliable prediction. First, cMapdoes not differentiate cell lines in its prediction. Oftentimes, the top ranked drugs were from cell lines differentfrom the query cell line. However, our investigation (seeResult) suggested that the drug effect is cell line dependentand the higher ranks of the drugs from other cell lineswould be more of cell line effects as opposed to drug
effects. As a result, considering drug samples from othercell lines introduces only noise to drug prediction. Second,the quality of the data samples in cMap is inconsistent.Some samples from the same drug treatment can behaveconsiderably different from the rest. These samples willinevitably present erroneous predictions. Third, the querysignature gene set in cMap is chosen to include the topup- and down- regulated genes. However, size of the geneset is determined quite ad hoc. As a result, one might missthe important signature genes by choosing a smaller geneset, or on the contrary, bring in unrelated genes thatwould only serve to degrade the prediction. As an exam-ple, we used the expression data for estradiol (E2) treatedMCF7 cell line [32] as a query to cMap and genes corre-sponding to the highest 100 and lowest 100 fold changeswere used as the query gene set. Naturally, we wouldexpect that E2 ranked high in the predicted list of drugs.However, E2 was only ranked 828 among over 1,200drugs. The reason for this low ranking is because theresult is a summary of the rankings of all cell lines of E2samples, which are mixed (ssMCF7: rank 12, HL60: rank31, MCF7: rank 3091, PC3: rank 3508; details in Addi-tional file 1; see also BRCA-MoNet Application Case 1).However, even if we focused on E2 for MCF7 cell line, itsranking is still low (3091). Close look at the detailedresults revealed that, the ranking E2 treated MCF7 cellline was a summary of the results from 19 individual E2treated MCF7 cell line and their enrichment scores didnot agree with each other (Table 1), Among the 19 sam-ples, only a few have high enrichment scores. It is verylikely that the rest of samples do not have high quality andthus fail to catch the real E2 treatment effect. Anotherpotential cause for this poor result is the ineffective choiceof the signature genes. However, as a user, we do not havea better way to choose an effective gene set to achievebetter prediction. These results underscore the need forquality control and systematic selections of signature genes.To address the above challenges, we proposed BRCA-MoNet in this paper. BRCA-MoNet is advantageous in
Table 1 Detailed prediction result in MCF7 cell line for anE2 treated query sample by the cMap project.
Rank batch Cmap name dose cell score up down
6 513 estradiol 10 nM MCF7 .901 .397 -.307
18 725 estradiol 100 nM MCF7 .800 .244 -.381
39 506 estradiol 100 nM MCF7 .742 .267 -.314
48 725 estradiol 10 nM MCF7 .717 .338 -.223
119 757 estradiol 100 nM MCF7 .629 .367 -.125
489 1010 estradiol 10 nM MCF7 .432 .179 -.159
731 656 estradiol 10 nM MCF7 0 .454 .187
738 767 estradiol 10 nM MCF7 0 .447 .217
741 506 estradiol 10 nM MCF7 0 .445 .195
745 765 estradiol 10 nM MCF7 0 .441 .144
Ma et al. BMC Systems Biology 2013, 7(Suppl 5):S5http://www.biomedcentral.com/1752-0509/7/S5/S5
Page 2 of 15
three aspects compared with cMap. First, it focuses onlyon breast cancer cell line. Although doing so ignores othercell line data in the cMap data, it nevertheless removes thecell-line dependent interference from the true drug effect.Second, a quality control procedure as well as new drugsignature gene set selection algorithm are developed toremove the possible noise in cMap data and characterizedrug’s treatment effect in a more systematic manner.Third, we define a Mode of Action (MoA) as a group ofcompounds that share the similar differential gene expres-sion signature. Since the drug expression signature is indi-cative of the degree of its sensitivity to a cell, a MoA druggroup should possess similar therapeutic effect. The con-struction of MoA introduces extra prediction power. Thisis because drugs with similar treatment effect might beranked low due to high noise in data if we treat predictionof each drug independently. In contrast, this high noisesample could be ranked high because the query agreeswith its MoA. The MoA is also different from other exist-ing defined compound groups such as those by their ana-tomical therapeutic compound (ATC) classification sinceMoA is defined by differential gene expression after treat-ment, even though some overlapping between variouscompound classifications might be expected. The relation-ship of different MoAs in terms of their therapeutic effectcan be modeled and visualized by a BRCA-MoNet. BRCA-MoNet presents a global view of drug effects at a genomiclevel. This network augments and improves the currentunderstanding of compound MoA defined mainly from aphysiology perspective, and underscores the relationshipof different compounds. From a computational perspec-tive, the MoAs and the quantified relationship betweendrugs in BRCA-MoNet provide a system-level model cru-cial for optimal drug screening: a new compound can beeasily assigned to a MoA in the BRCA-MoNet such thatcompound’s therapeutic effectiveness can be extrapolatedor inferred accordingly.
ResultAnalysis results showed drug treatment effect is cell linedependentIn the cMap data, each drug treatment profile includesseveral treated samples from different cell lines. Whetherthe effects of the same drug treatments differ for differentcell lines need to be investigated before a drug MoA net-work can be constructed. To this end, samples of cMapdata were first grouped based on compounds and thecompounds with more than 30 samples were retained.Note that since the data have already been normalized andfold changed over the control sample in the same cell line,the cell line dependent bias should be eliminated; any dif-ferences in expression levels within the samples of thesame compound are manifestation of differences inchemo-effectiveness due to differences in cell line, drug
concentrations, or a combination of both. Hierarchicalclustering was performed to the samples in each com-pound group to reveal potential differences in expressionpatterns within the same compound. Correlating theclustering results with cell line types and concentrations(Figure 1A) revealed that chemo-effectiveness dependsmainly on cell lines and is independent of concentrationwhen it is effective. This finding is significant because itsuggested that network construction and drug predictionsshould be performed by considering cell lines separately.Knowing the effect of one drug for treating breast cancerdoes not provide information on its effectiveness in lungcancer; including samples from cells other than breastcancer cells introduce only noise to drug treatment net-work construction. As a result, removing samples fromother cells mitigates the interference and consequentlyimproves the accuracy and robustness of the predictionresult. Since MCF7 breast cancer cell line cohort containsthe largest number of samples (2911 compared with HL601229 and PC3 1741), and it contains more drug replicatesamples than other cell lines, we focused in this work ondeveloping a breast cancer specific MoA network.
Drug signature gene set selectionThe goal of signature gene set selection is to identify a setof genes that have significant differential expression afterthe drug treatment. However, the use of the conventionaldifferential analysis methods such as t-test is hampered bythe lack of the biological replicates in the cMap data set.This limitation becomes even severer after the quality con-trol. For the MCF7 cell line, among all 1251 drugs in cMap,only 32 drugs have more than 5 samples and 1055 drugshave ≤ 2 samples. With such small sample size, any statisti-cally based differential analysis becomes infeasible. To thisend, we proposed two criteria based on which the signaturegene set of drug was selected: first, the signature genesshould have high fold-change expression, and second, thefold change levels of the signature genes should be consis-tently high among the replicate samples. Based on thesetwo criteria, new signature gene set selection algorithm tai-lored for small samples were developed (see METHOD fordetails). For MCF7 cell line, among 1251 drugs, signaturegene sets of different size were identified for 1108 drugs.No gene sets were produced for the rest 118 drugs becauseno genes in their samples were consistently differentialexpressed. There are also 25 drugs which have only 1 sam-ple in MCF7 cell line. As the result, these 118 MCF7 cellline inconsistent drugs as well as the 25 single-sampledrugs were removed. Figure 1.C shows the identified signa-ture gene sets for three drugs: Estradiol, estrol and raloxi-fene. Estradiol (E2) and Estrol are two forms of estrogen,which plays an important role in human breast cancer. Itis therefore nature to see that the signature gene sets ofthese two drugs share many genes that also have similar
Ma et al. BMC Systems Biology 2013, 7(Suppl 5):S5http://www.biomedcentral.com/1752-0509/7/S5/S5
Page 3 of 15
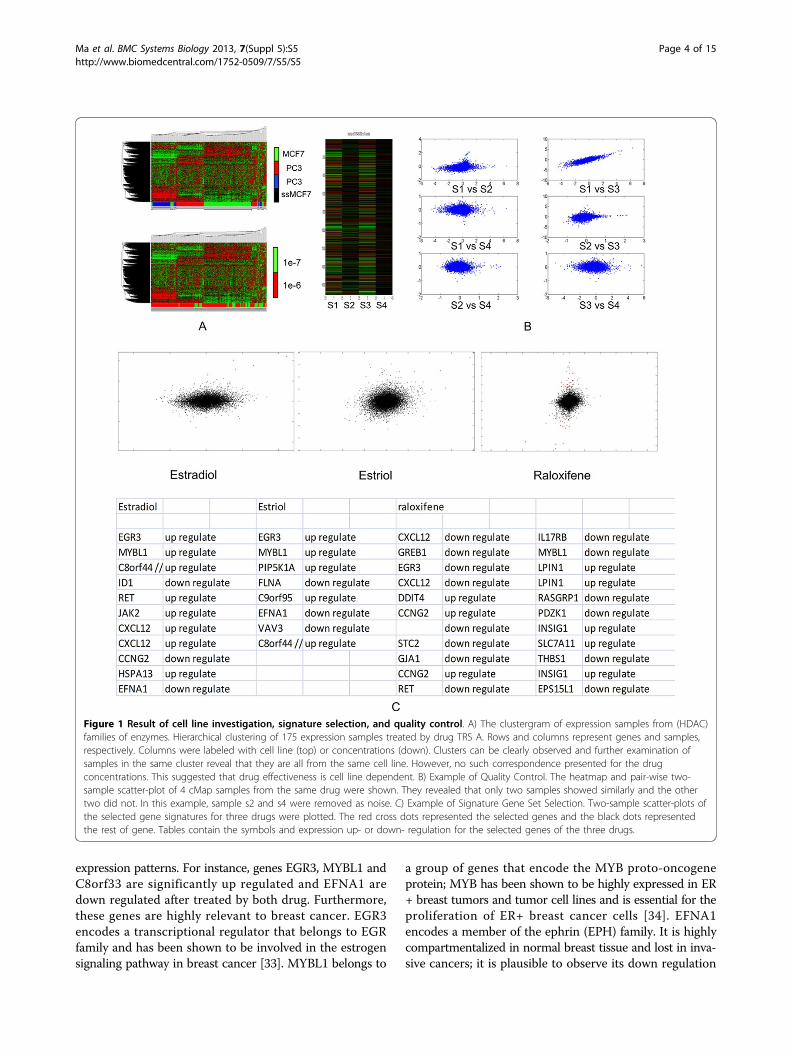
expression patterns. For instance, genes EGR3, MYBL1 andC8orf33 are significantly up regulated and EFNA1 aredown regulated after treated by both drug. Furthermore,these genes are highly relevant to breast cancer. EGR3encodes a transcriptional regulator that belongs to EGRfamily and has been shown to be involved in the estrogensignaling pathway in breast cancer [33]. MYBL1 belongs to
a group of genes that encode the MYB proto-oncogeneprotein; MYB has been shown to be highly expressed in ER+ breast tumors and tumor cell lines and is essential for theproliferation of ER+ breast cancer cells [34]. EFNA1encodes a member of the ephrin (EPH) family. It is highlycompartmentalized in normal breast tissue and lost in inva-sive cancers; it is plausible to observe its down regulation
Figure 1 Result of cell line investigation, signature selection, and quality control. A) The clustergram of expression samples from (HDAC)families of enzymes. Hierarchical clustering of 175 expression samples treated by drug TRS A. Rows and columns represent genes and samples,respectively. Columns were labeled with cell line (top) or concentrations (down). Clusters can be clearly observed and further examination ofsamples in the same cluster reveal that they are all from the same cell line. However, no such correspondence presented for the drugconcentrations. This suggested that drug effectiveness is cell line dependent. B) Example of Quality Control. The heatmap and pair-wise two-sample scatter-plot of 4 cMap samples from the same drug were shown. They revealed that only two samples showed similarly and the othertwo did not. In this example, sample s2 and s4 were removed as noise. C) Example of Signature Gene Set Selection. Two-sample scatter-plots ofthe selected gene signatures for three drugs were plotted. The red cross dots represented the selected genes and the black dots representedthe rest of gene. Tables contain the symbols and expression up- or down- regulation for the selected genes of the three drugs.
Ma et al. BMC Systems Biology 2013, 7(Suppl 5):S5http://www.biomedcentral.com/1752-0509/7/S5/S5
Page 4 of 15
after the E2 treatment. For the third drug, raloxifene, it is aknown estrogen receptor modulator aiming at inducingthe estrogen level. Our resulted signature includes bothEGR3 and MYBL1 genes being down regulated. This simi-larity between the identified Estrol and Estradiol signaturegene sets suggest that they may share similar MoA. Incontrast, the reverse correlation between the raloxifeneand E2 gene signatures suggest that their MoA may beopposite to each other. Later analysis indeed showed thatE2 and Estrol as well as other 15 drugs are detected to bewithin the same MoA while roloxifene was predicted topranked in the reverse prediction list with an independentE2 treatment sample (Details in BRCA-MoNet ApplicationCase 1). These results demonstrated that the signaturegene sets selected by our proposed algorithm are biologi-cally meaningful.
Quality controlQuality control is applied on the drugs of cMap MCF7 cellline drugs with more than 3 samples. The goal of qualitycontrol is to remove the samples that are not consistentlyexpressed with the others. Our investigation of the cMapdata revealed that, there was a considerable amount of out-lier samples, whose expression patterns differ significantlyfrom the rest in the same drug (Figure 1B). Including theseoutliers would introduce only noise in defining the MoAand it is therefore important to remove the outlier sam-ples. Note that signature gene set selection could alsoserve the purpose of quality control since some drugscould end selected no gene set. For MCF7 cell line, as the
result of both gene signature selection and quality control,1564 samples from 747 drugs are identified and removedand 1347 samples from 504 drugs are passed to BRAC-MoNet construction. These samples can be considered tocorrectly capture the treatment effect on the MCF7 cellline and were therefore used for subsequent investigation.
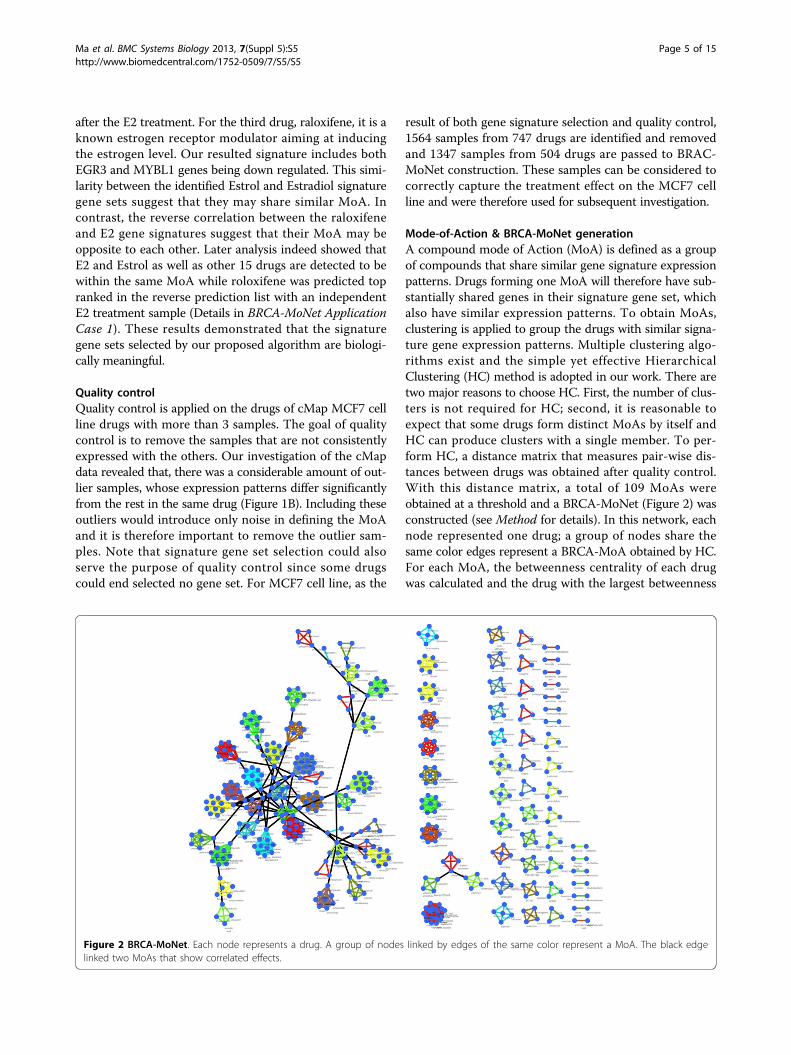
Mode-of-Action & BRCA-MoNet generationA compound mode of Action (MoA) is defined as a groupof compounds that share similar gene signature expressionpatterns. Drugs forming one MoA will therefore have sub-stantially shared genes in their signature gene set, whichalso have similar expression patterns. To obtain MoAs,clustering is applied to group the drugs with similar signa-ture gene expression patterns. Multiple clustering algo-rithms exist and the simple yet effective HierarchicalClustering (HC) method is adopted in our work. There aretwo major reasons to choose HC. First, the number of clus-ters is not required for HC; second, it is reasonable toexpect that some drugs form distinct MoAs by itself andHC can produce clusters with a single member. To per-form HC, a distance matrix that measures pair-wise dis-tances between drugs was obtained after quality control.With this distance matrix, a total of 109 MoAs wereobtained at a threshold and a BRCA-MoNet (Figure 2) wasconstructed (see Method for details). In this network, eachnode represented one drug; a group of nodes share thesame color edges represent a BRCA-MoA obtained by HC.For each MoA, the betweenness centrality of each drugwas calculated and the drug with the largest betweenness
Figure 2 BRCA-MoNet. Each node represents a drug. A group of nodes linked by edges of the same color represent a MoA. The black edgelinked two MoAs that show correlated effects.
Ma et al. BMC Systems Biology 2013, 7(Suppl 5):S5http://www.biomedcentral.com/1752-0509/7/S5/S5
Page 5 of 15
centrality was set to be the center of the MoA. Two MoAswere linked with a black edge if the distance between themwas smaller than the threshold and this link indicated thesecondary level relationship between two MoAs.
BRCA-MoNet applicationAfter the BRCA-MoNet being constructed, its predictionpower was tested. Three questions were investigated. First,can BRCA-MoNet predict correct drug MoA? Second, towhat extent can BRCA-MoNet predict the drug MoA ofan unknown or new drug? Third, to what extend canBRCA-MoNet recommend drugs for patients? To answerthese questions, independent microarray expression data-sets were downloaded from Gene Expression Omnibus(GEO) for the investigation. In order to avoid possibleplatform and experimental bias, the following criteria werefollowed when we select the data sets. First, the data mustbe compound treated on the MCF7 cell line and containone or multiple control samples; this was consistent withthe condition of the cMap data. Second, we only choosethose datasets that were treated with drugs existed in thecMap project or of known treatment effect in breast can-cer. Third, to avoid possible across platform complication,the data must be generated from the same platform as thecMap data, or GPL96 (Affymetrix Human GenomeU133A Array). With the above considerations, the follow-ing three case studies were carried out.
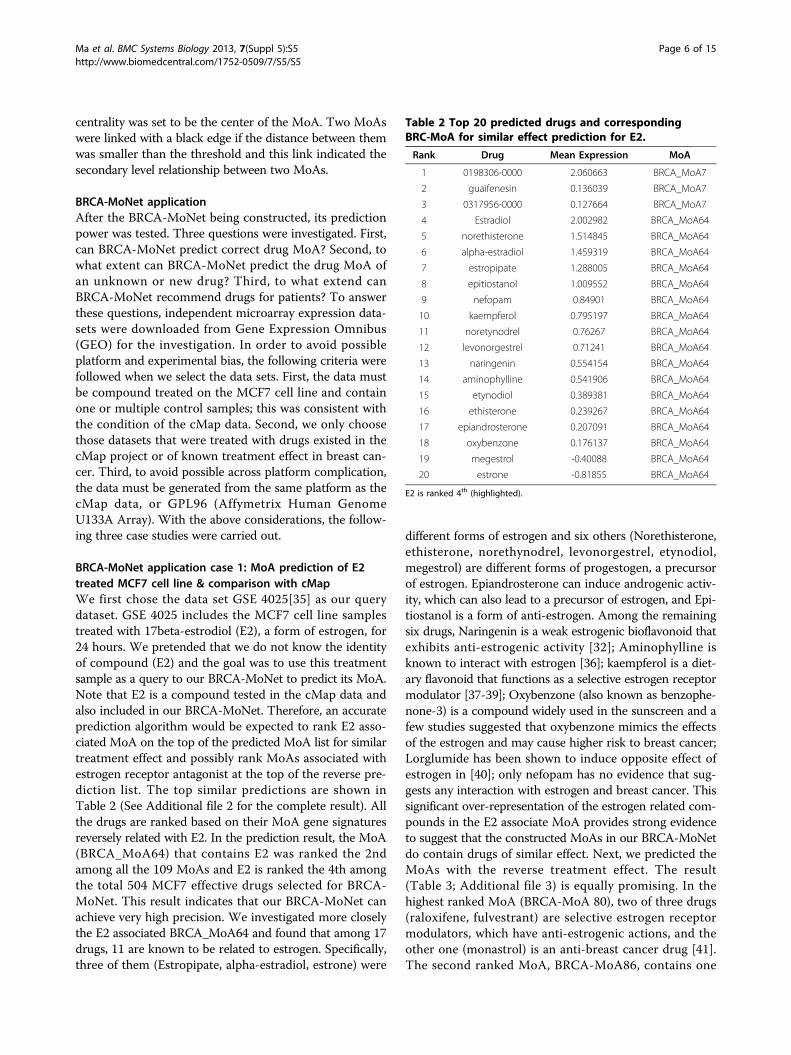
BRCA-MoNet application case 1: MoA prediction of E2treated MCF7 cell line & comparison with cMapWe first chose the data set GSE 4025[35] as our querydataset. GSE 4025 includes the MCF7 cell line samplestreated with 17beta-estrodiol (E2), a form of estrogen, for24 hours. We pretended that we do not know the identityof compound (E2) and the goal was to use this treatmentsample as a query to our BRCA-MoNet to predict its MoA.Note that E2 is a compound tested in the cMap data andalso included in our BRCA-MoNet. Therefore, an accurateprediction algorithm would be expected to rank E2 asso-ciated MoA on the top of the predicted MoA list for similartreatment effect and possibly rank MoAs associated withestrogen receptor antagonist at the top of the reverse pre-diction list. The top similar predictions are shown inTable 2 (See Additional file 2 for the complete result). Allthe drugs are ranked based on their MoA gene signaturesreversely related with E2. In the prediction result, the MoA(BRCA_MoA64) that contains E2 was ranked the 2ndamong all the 109 MoAs and E2 is ranked the 4th amongthe total 504 MCF7 effective drugs selected for BRCA-MoNet. This result indicates that our BRCA-MoNet canachieve very high precision. We investigated more closelythe E2 associated BRCA_MoA64 and found that among 17drugs, 11 are known to be related to estrogen. Specifically,three of them (Estropipate, alpha-estradiol, estrone) were
different forms of estrogen and six others (Norethisterone,ethisterone, norethynodrel, levonorgestrel, etynodiol,megestrol) are different forms of progestogen, a precursorof estrogen. Epiandrosterone can induce androgenic activ-ity, which can also lead to a precursor of estrogen, and Epi-tiostanol is a form of anti-estrogen. Among the remainingsix drugs, Naringenin is a weak estrogenic bioflavonoid thatexhibits anti-estrogenic activity [32]; Aminophylline isknown to interact with estrogen [36]; kaempferol is a diet-ary flavonoid that functions as a selective estrogen receptormodulator [37-39]; Oxybenzone (also known as benzophe-none-3) is a compound widely used in the sunscreen and afew studies suggested that oxybenzone mimics the effectsof the estrogen and may cause higher risk to breast cancer;Lorglumide has been shown to induce opposite effect ofestrogen in [40]; only nefopam has no evidence that sug-gests any interaction with estrogen and breast cancer. Thissignificant over-representation of the estrogen related com-pounds in the E2 associate MoA provides strong evidenceto suggest that the constructed MoAs in our BRCA-MoNetdo contain drugs of similar effect. Next, we predicted theMoAs with the reverse treatment effect. The result(Table 3; Additional file 3) is equally promising. In thehighest ranked MoA (BRCA-MoA 80), two of three drugs(raloxifene, fulvestrant) are selective estrogen receptormodulators, which have anti-estrogenic actions, and theother one (monastrol) is an anti-breast cancer drug [41].The second ranked MoA, BRCA-MoA86, contains one
Table 2 Top 20 predicted drugs and correspondingBRC-MoA for similar effect prediction for E2.
Rank Drug Mean Expression MoA
1 0198306-0000 2.060663 BRCA_MoA7
2 guaifenesin 0.136039 BRCA_MoA7
3 0317956-0000 0.127664 BRCA_MoA7
4 Estradiol 2.002982 BRCA_MoA64
5 norethisterone 1.514845 BRCA_MoA64
6 alpha-estradiol 1.459319 BRCA_MoA64
7 estropipate 1.288005 BRCA_MoA64
8 epitiostanol 1.009552 BRCA_MoA64
9 nefopam 0.84901 BRCA_MoA64
10 kaempferol 0.795197 BRCA_MoA64
11 noretynodrel 0.76267 BRCA_MoA64
12 levonorgestrel 0.71241 BRCA_MoA64
13 naringenin 0.554154 BRCA_MoA64
14 aminophylline 0.541906 BRCA_MoA64
15 etynodiol 0.389381 BRCA_MoA64
16 ethisterone 0.239267 BRCA_MoA64
17 epiandrosterone 0.207091 BRCA_MoA64
18 oxybenzone 0.176137 BRCA_MoA64
19 megestrol -0.40088 BRCA_MoA64
20 estrone -0.81855 BRCA_MoA64
E2 is ranked 4th (highlighted).
Ma et al. BMC Systems Biology 2013, 7(Suppl 5):S5http://www.biomedcentral.com/1752-0509/7/S5/S5
Page 6 of 15
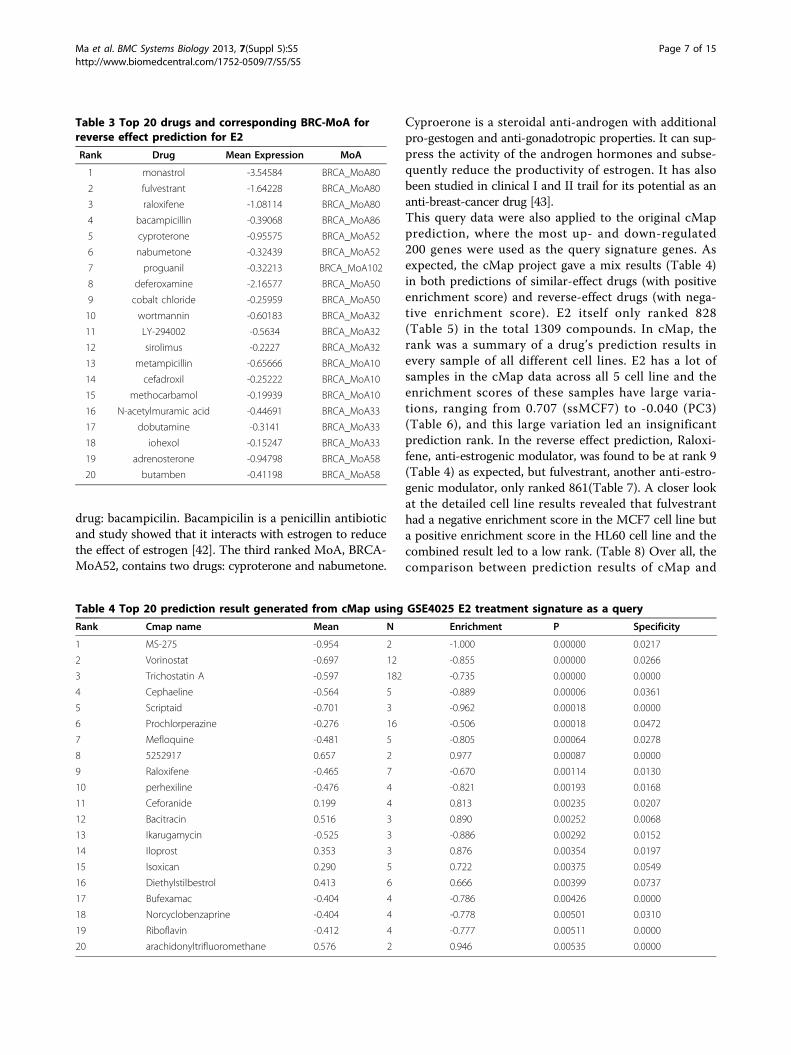
drug: bacampicilin. Bacampicilin is a penicillin antibioticand study showed that it interacts with estrogen to reducethe effect of estrogen [42]. The third ranked MoA, BRCA-MoA52, contains two drugs: cyproterone and nabumetone.
Cyproerone is a steroidal anti-androgen with additionalpro-gestogen and anti-gonadotropic properties. It can sup-press the activity of the androgen hormones and subse-quently reduce the productivity of estrogen. It has alsobeen studied in clinical I and II trail for its potential as ananti-breast-cancer drug [43].This query data were also applied to the original cMapprediction, where the most up- and down-regulated200 genes were used as the query signature genes. Asexpected, the cMap project gave a mix results (Table 4)in both predictions of similar-effect drugs (with positiveenrichment score) and reverse-effect drugs (with nega-tive enrichment score). E2 itself only ranked 828(Table 5) in the total 1309 compounds. In cMap, therank was a summary of a drug’s prediction results inevery sample of all different cell lines. E2 has a lot ofsamples in the cMap data across all 5 cell line and theenrichment scores of these samples have large varia-tions, ranging from 0.707 (ssMCF7) to -0.040 (PC3)(Table 6), and this large variation led an insignificantprediction rank. In the reverse effect prediction, Raloxi-fene, anti-estrogenic modulator, was found to be at rank 9(Table 4) as expected, but fulvestrant, another anti-estro-genic modulator, only ranked 861(Table 7). A closer lookat the detailed cell line results revealed that fulvestranthad a negative enrichment score in the MCF7 cell line buta positive enrichment score in the HL60 cell line and thecombined result led to a low rank. (Table 8) Over all, thecomparison between prediction results of cMap and
Table 3 Top 20 drugs and corresponding BRC-MoA forreverse effect prediction for E2
Rank Drug Mean Expression MoA
1 monastrol -3.54584 BRCA_MoA80
2 fulvestrant -1.64228 BRCA_MoA80
3 raloxifene -1.08114 BRCA_MoA80
4 bacampicillin -0.39068 BRCA_MoA86
5 cyproterone -0.95575 BRCA_MoA52
6 nabumetone -0.32439 BRCA_MoA52
7 proguanil -0.32213 BRCA_MoA102
8 deferoxamine -2.16577 BRCA_MoA50
9 cobalt chloride -0.25959 BRCA_MoA50
10 wortmannin -0.60183 BRCA_MoA32
11 LY-294002 -0.5634 BRCA_MoA32
12 sirolimus -0.2227 BRCA_MoA32
13 metampicillin -0.65666 BRCA_MoA10
14 cefadroxil -0.25222 BRCA_MoA10
15 methocarbamol -0.19939 BRCA_MoA10
16 N-acetylmuramic acid -0.44691 BRCA_MoA33
17 dobutamine -0.3141 BRCA_MoA33
18 iohexol -0.15247 BRCA_MoA33
19 adrenosterone -0.94798 BRCA_MoA58
20 butamben -0.41198 BRCA_MoA58
Table 4 Top 20 prediction result generated from cMap using GSE4025 E2 treatment signature as a query
Rank Cmap name Mean N Enrichment P Specificity
1 MS-275 -0.954 2 -1.000 0.00000 0.0217
2 Vorinostat -0.697 12 -0.855 0.00000 0.0266
3 Trichostatin A -0.597 182 -0.735 0.00000 0.0000
4 Cephaeline -0.564 5 -0.889 0.00006 0.0361
5 Scriptaid -0.701 3 -0.962 0.00018 0.0000
6 Prochlorperazine -0.276 16 -0.506 0.00018 0.0472
7 Mefloquine -0.481 5 -0.805 0.00064 0.0278
8 5252917 0.657 2 0.977 0.00087 0.0000
9 Raloxifene -0.465 7 -0.670 0.00114 0.0130
10 perhexiline -0.476 4 -0.821 0.00193 0.0168
11 Ceforanide 0.199 4 0.813 0.00235 0.0207
12 Bacitracin 0.516 3 0.890 0.00252 0.0068
13 Ikarugamycin -0.525 3 -0.886 0.00292 0.0152
14 Iloprost 0.353 3 0.876 0.00354 0.0197
15 Isoxican 0.290 5 0.722 0.00375 0.0549
16 Diethylstilbestrol 0.413 6 0.666 0.00399 0.0737
17 Bufexamac -0.404 4 -0.786 0.00426 0.0000
18 Norcyclobenzaprine -0.404 4 -0.778 0.00501 0.0310
19 Riboflavin -0.412 4 -0.777 0.00511 0.0000
20 arachidonyltrifluoromethane 0.576 2 0.946 0.00535 0.0000
Ma et al. BMC Systems Biology 2013, 7(Suppl 5):S5http://www.biomedcentral.com/1752-0509/7/S5/S5
Page 7 of 15

BRCA-MoNet shows that BRCA-MoNet adds consider-able prediction power to the existent cMap data andgreatly improves the prediction accuracy on both similarand reverse prediction.
BRCA-MoNet Application Case 2: Prediction of BMS-754807 Treated MCF7 Cell LineOne additional dataset treated with drug BMS-754807 wastested against our BRCA-MoNet. This dataset (GSE33366)came from breast xenograft MCF7 bearing mice treatedwith BMS-754807. MBS-784807 is a dual IGF-1R/InsRinhibitor that can synergize hormonal agents and has beenshown to be a potential breast cancer drug [44-47]. Studyshowed that there is an elevated IGF-IR activity specific intriple negative breast cancer and because of that, BMS-784807 could be a possible treatment for triple negativebreast cancer [48]. It has been investigated in severalPhase I and Phase II Clinical Trials as an anti-cancer drug[49-52]. This dataset was tested against our BRCA-MoNetfor similar treatment effect predictions. The top rankedMoA was MoA 37 (Table 9 and Additional file 4 for com-plete prediction). Interestingly, this MoA contains valproicacid, which is ranked number 1 among all the 504 BRCA-MoNet drugs. Valproic acid belongs to a general class ofdrugs called anticonvulsants and was originally used as anon-opioid pain reliever. It has also been used to preventmigraine headaches [53]. Recently, valproic acid has beenshown to have great potential as an epigenetic drug foranti-cancer activity through inhibiting cancer cell prolif-eration in various types of cancer [54-56]. This predictionresult shows that both drugs with great anti-cancer poten-tial are actually detected to have similar MoA by BRCA-MoNet. This conclusion strongly supports the fact thatBRCA-MoNet can uncover new drug’s anti-cancer MoAby assigning it to a known MoA.
BRCA-MoNet application case 3: prediction of drugs forUNC breast cancer patientsPrediction power of BRCA-MoNet on the real breast can-cer patients was investigated. To this end, dataset GSE2740
[57] was downloaded from GEO. This dataset includessamples from 4 platforms (GPL885, GPL887, GPL1390,and GPL1708) and various breast cancer subtypes.To avoid possible bias due to platforms and breast cancersubtypes, only patient samples of Lumina A (LumA) sub-type and from the platform with the largest sample size(GPL1390) were chosen. A total of 97 breast cancerpatients’ microarray data samples were tested against ourBRCA-MoNet using the reverse prediction. The rankingresult is shown in Figure 3-A (detailed in additional file 5).Particular, several BRCA-MoAs were consistently ranked atthe top, where BRCA-MoA24 ranked the first in 30.21% ofthe all the patients and ranked above top 20 in 61.46% ofall the patients among all 109 BRCA-MoAs. BRCA-MoA24includes five drugs: spironolactone, rifabutin, vorinostat, tri-chostatin A and CP-690334-01. Among these five drugs,spironolactone is a synthetic, steroidal anti-mineralocorti-coid agent with anti-androgen, weak pro-gestogen proper-ties, and indirect estrogen effects. It has been used toreduce the elevated or unwanted androgen activity in thebody [58]. (Androgen, as mentioned before, is the precursorof all estrogens.) So, spironolactone can be potentially usedto induce anti-estrogenic activity against breast cancer.Rifabutin is a semisynthetic ansamycin and primarily usedin the treatment of tuberculosis. Interestingly, ansamycinhas been found to be a HSP90 inhibitor and many of itssynthetic compounds are on trials as anti-breast cancerdrug. [59-61] Vorinostat is a member of a histone deacety-lases (HADC) with a broad spectrum of epigenetic activ-ities; it has been approved by the FDA to treat cutaneousT-cell lymphoma in 2006. Since it has been also shown tohave effect on treating breast cancer [62-68], it has under-gone multiple Phase I and II clinical trials as an anti breastcancer drug [69-73]. Trichostatin A (TSA) is an organiccompound that serves as an antifungal antibiotic and selec-tively inhibits class I and II mammalian HADC families ofenzymes [74]. It has gained extremely high attention in
Table 5 cMap overall prediction result for E2
rank Cmap name mean N Enrichment P Specificity
828 Estradiol 0.209 37 0.367 Null Null
Table 6 cMap detail prediction result for E2
Rank Name and cellline
Mean N Enrichment P Specificity
12 Estradiol-ssMCF7 0.700 2 0.989 0.00016 0.0000
31 Estradiol-HL60 0.303 8 0.590 0.00335 0.1585
3091 Estradiol-MCF7 0.222 19 0.485 Null Null
3580 Estradiol-PC3 -0.040 8 0.223 Null Null
Table 7 cMap overall prediction result for fulvestrant
Rank Cmapname
Mean N Enrichment P specificity
861 fulvestrant -0.295 40 -0.352 Null Null
Table 8 cMap detail prediction result for fulvestrant
Rank Name andcell line
Mean N Enrichment P specificity
5 Fulvestrant-MCF7
-0.595 21 -0.714 0.00000 0.0146
180 Fulvestrant-HL60
0.178 6 0.442 0.13728 0.2086
2466 Fulvestrant-ssMCF7
0.000 1 -0.594 Null Null
3274 Fulvestrant-PC3 -0.032 12 0.413 Null Null
Ma et al. BMC Systems Biology 2013, 7(Suppl 5):S5http://www.biomedcentral.com/1752-0509/7/S5/S5
Page 8 of 15
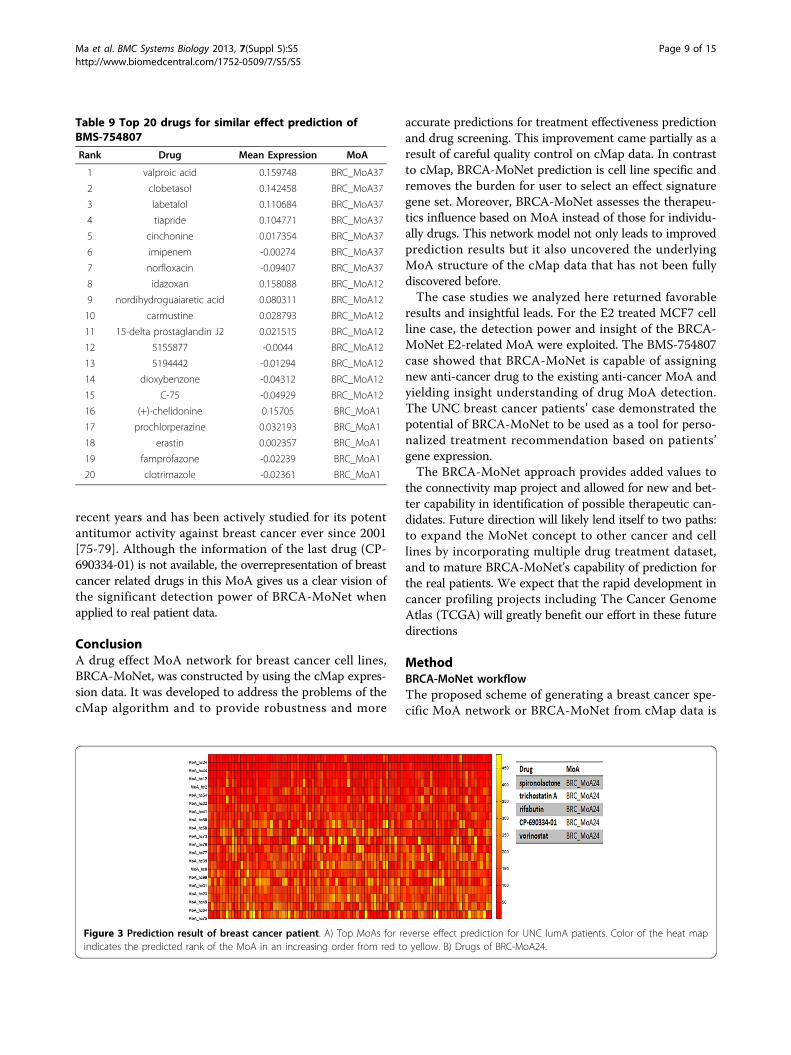
recent years and has been actively studied for its potentantitumor activity against breast cancer ever since 2001[75-79]. Although the information of the last drug (CP-690334-01) is not available, the overrepresentation of breastcancer related drugs in this MoA gives us a clear vision ofthe significant detection power of BRCA-MoNet whenapplied to real patient data.
ConclusionA drug effect MoA network for breast cancer cell lines,BRCA-MoNet, was constructed by using the cMap expres-sion data. It was developed to address the problems of thecMap algorithm and to provide robustness and more
accurate predictions for treatment effectiveness predictionand drug screening. This improvement came partially as aresult of careful quality control on cMap data. In contrastto cMap, BRCA-MoNet prediction is cell line specific andremoves the burden for user to select an effect signaturegene set. Moreover, BRCA-MoNet assesses the therapeu-tics influence based on MoA instead of those for individu-ally drugs. This network model not only leads to improvedprediction results but it also uncovered the underlyingMoA structure of the cMap data that has not been fullydiscovered before.The case studies we analyzed here returned favorable
results and insightful leads. For the E2 treated MCF7 cellline case, the detection power and insight of the BRCA-MoNet E2-related MoA were exploited. The BMS-754807case showed that BRCA-MoNet is capable of assigningnew anti-cancer drug to the existing anti-cancer MoA andyielding insight understanding of drug MoA detection.The UNC breast cancer patients’ case demonstrated thepotential of BRCA-MoNet to be used as a tool for perso-nalized treatment recommendation based on patients’gene expression.The BRCA-MoNet approach provides added values to
the connectivity map project and allowed for new and bet-ter capability in identification of possible therapeutic can-didates. Future direction will likely lend itself to two paths:to expand the MoNet concept to other cancer and celllines by incorporating multiple drug treatment dataset,and to mature BRCA-MoNet’s capability of prediction forthe real patients. We expect that the rapid development incancer profiling projects including The Cancer GenomeAtlas (TCGA) will greatly benefit our effort in these futuredirections
MethodBRCA-MoNet workflowThe proposed scheme of generating a breast cancer spe-cific MoA network or BRCA-MoNet from cMap data is
Table 9 Top 20 drugs for similar effect prediction ofBMS-754807
Rank Drug Mean Expression MoA
1 valproic acid 0.159748 BRC_MoA37
2 clobetasol 0.142458 BRC_MoA37
3 labetalol 0.110684 BRC_MoA37
4 tiapride 0.104771 BRC_MoA37
5 cinchonine 0.017354 BRC_MoA37
6 imipenem -0.00274 BRC_MoA37
7 norfloxacin -0.09407 BRC_MoA37
8 idazoxan 0.158088 BRC_MoA12
9 nordihydroguaiaretic acid 0.080311 BRC_MoA12
10 carmustine 0.028793 BRC_MoA12
11 15-delta prostaglandin J2 0.021515 BRC_MoA12
12 5155877 -0.0044 BRC_MoA12
13 5194442 -0.01294 BRC_MoA12
14 dioxybenzone -0.04312 BRC_MoA12
15 C-75 -0.04929 BRC_MoA12
16 (+)-chelidonine 0.15705 BRC_MoA1
17 prochlorperazine 0.032193 BRC_MoA1
18 erastin 0.002357 BRC_MoA1
19 famprofazone -0.02239 BRC_MoA1
20 clotrimazole -0.02361 BRC_MoA1
Figure 3 Prediction result of breast cancer patient. A) Top MoAs for reverse effect prediction for UNC lumA patients. Color of the heat mapindicates the predicted rank of the MoA in an increasing order from red to yellow. B) Drugs of BRC-MoA24.
Ma et al. BMC Systems Biology 2013, 7(Suppl 5):S5http://www.biomedcentral.com/1752-0509/7/S5/S5
Page 9 of 15
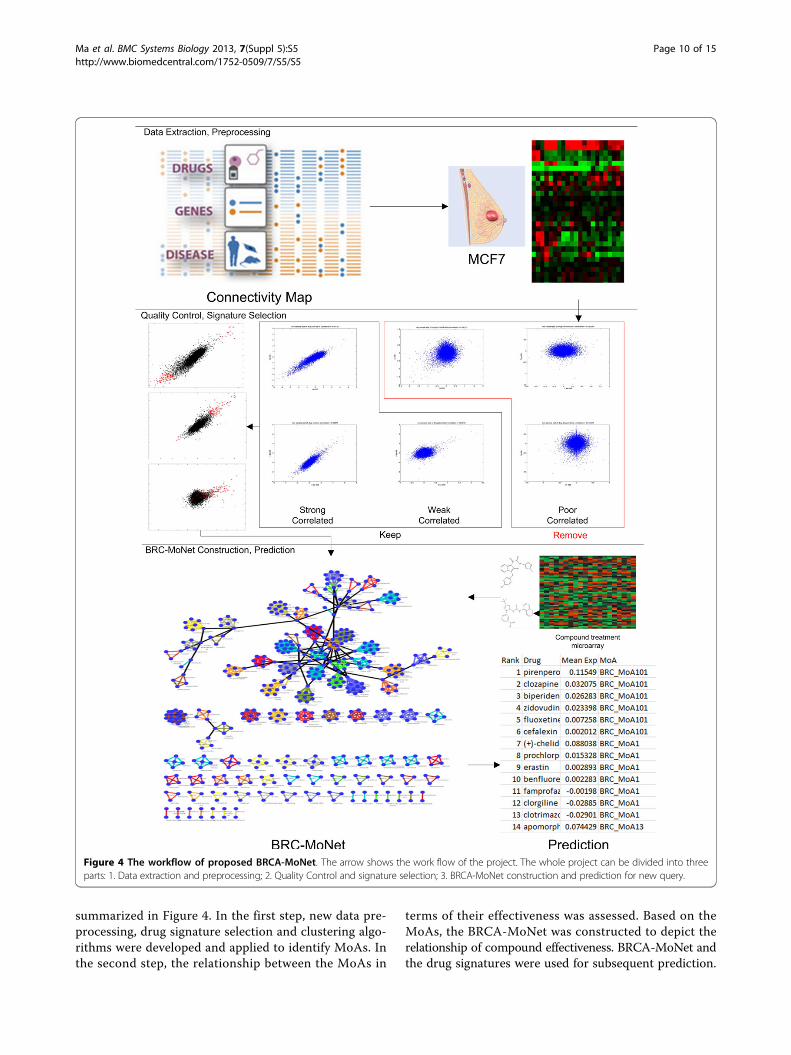
summarized in Figure 4. In the first step, new data pre-processing, drug signature selection and clustering algo-rithms were developed and applied to identify MoAs. Inthe second step, the relationship between the MoAs in
terms of their effectiveness was assessed. Based on theMoAs, the BRCA-MoNet was constructed to depict therelationship of compound effectiveness. BRCA-MoNet andthe drug signatures were used for subsequent prediction.
Figure 4 The workflow of proposed BRCA-MoNet. The arrow shows the work flow of the project. The whole project can be divided into threeparts: 1. Data extraction and preprocessing; 2. Quality Control and signature selection; 3. BRCA-MoNet construction and prediction for new query.
Ma et al. BMC Systems Biology 2013, 7(Suppl 5):S5http://www.biomedcentral.com/1752-0509/7/S5/S5
Page 10 of 15

Two types of prediction can be carried out with BRCA-MoNet including similar prediction and reverse prediction.For the purpose of find the drug effectiveness on a tumorsample, the expression profile of an individual tumor sam-ple is used as a query, where reverse prediction is adoptedand the query will be inverse correlated against the MoAsto predict treatment effects. The prediction result includesa list of MoAs ranked in an increasing order of their nega-tive correlation to the tumor profile. Since effective com-pounds are expected to have an adverse effect to tumor,MoAs with the negative correlations with the tumor profilewill likely be candidates of choice for treating this indivi-dual tumor. For the purpose of finding a new compound’streatment effect, a query expression profile from treatedsample of a new compound would be used instead as aninput to BRCA-MoNet and both similar and reverse pre-diction results will be of interest as they are the com-pounds of respective similar and adverse effectiveness inexpression. The BRCA-MoNet can be updated when newcompound-treated expression profiles are available. Onecan take the advantage of existing BRCA-MoNet andupdate it by simply introducing a new MoA and their rela-tionship to other groups. The algorithms are discussed indetails in Methods.
Data preparationGene expression profiles of compound treatments weredownloaded from Broad Institute’s Connectivity Map website (http://hRp://www.broadinsUtute.org/cmap/). TwoAffymetrix arrays were utilized in this study (excluding184 arrays from early-access version of HT-HG-U133A):HG-U133A (total of 807 arrays) and HT-HG-U133A(6029 arrays), representing 1,267 compound treatments atdifferent dosages. In addition, data includes 5 cell lines:HL60, PC3, SKMEL5 and MCF7/ssMCF7. Each treatedsample is accompanied by multiple control/vehicle sam-ples. As for the normalization, the Perfect-Match(PM)probe level intensities, obtained from one Affymetrix arraytype (including treated and untreated hybridization), wasfirst performed background adjustment together by usingRobust Multi-array Average (RMA) procedure. after RMAbackground adjustment for both array types, quantile nor-malization was performed to all untreated samples; treatedsamples were then partitioned according to the array type,vehicle cell-line, and compound; for each group (samearray type, cell-line and compound; rank-invariant nor-malization was performed against their correspondinguntreated samples (base line of the normalization was themedian of untreated vehicles) at probe-level to correctpossible nonlinear abnormality. After normalization, thetreated samples expression values were calculated by med-ian polish procedure. At last, all samples (treated anduntreated, and both array types) were reassembled intomatrix according to Affymetrix probe set IDs.
Signature gene set selection and distance assessmentThe goal of signature gene set selection is to select thegenes that are expressed differentially. Since most of thedrugs in cMap contains only two samples, the conven-tional differentially analysis algorithms such as t-test can-not be applied. We proposed the following test statistic tomeasure if a gene, say i, is consistently differentiallyexpressed in a pair of samples
Ri =xiσx
∗ yiσy
−∣∣∣∣xiσx
− yiσy
∣∣∣∣
Where xi and yi is the expression of gene i in sample ×and sample y, respectively, and σx and σy are the corre-sponding sample standard deviation. This statistic valuesgenes which are most differentially expressed in both sam-ples, while taking the sample variation into the considera-tion. The empirical distribution of this statistic R under thenull hypothesis that the gene is not differentially expressedcan be obtained by random sampling from replicates of thecMap data. Based on the distribution, p-values can be com-puted for every gene. A signature gene set of any paireddrug samples are determined to contain gene with p-value< 0.1%. The algorithm is summarized in Figure 5. Fordrugs having a larger sample sized than 2, the procedure ofdetermining signature gene set are fairly the same. Eachpair of sample would be used to determine a gene set andthen a common subset of all determined gene sets will bethe final signature set. Based on the above selected signa-ture gene sets, the distance Dab between any two drugtreatment samples a and b is defined as
Dab = Dmax − 12
∗ (1n
∑
in
g(a−b)i
var(b)+
1m
∑
jm
g(b−a)j
var(a))
where Dmax is the maximum distance among all pairwisedrug treatment samples’, g(a−b)i is the ith gene expressionlevel of sample a signature gene set in sample b,n and mare the size of the signature gene sets (the total numbersof genes) for sample a and b, respectfully, and var(a), andvar(b) are the sample variance of a and b, respectfully.
Quality controlQuality control is done in two rounds of processing. Inthe first round, which is part of the gene selection, somedrugs came by with no signature gene sets; this is a resultthat no genes were consistently differentially expressed insamples from this drug. The samples from those drugswere removed. Although some drugs were determinedwith a signature gene set, one or more of the outlier sam-ples may not agree with the rest. To address this pro-blem, a second round of further quality control processwas also performed on the cMap samples. In order toremove these inconsistent samples, a new scheme wasproposed in Figure 6.
Ma et al. BMC Systems Biology 2013, 7(Suppl 5):S5http://www.biomedcentral.com/1752-0509/7/S5/S5
Page 11 of 15

MoA and MoNet generationAccording to the definition of MoA, two compounds arein the same MoA if they share the same genomic signa-ture. This is equivalent to say that the samples from thesetwo compounds are highly correlated. In contrast, thesamples from different MoAs should have a correlationdistributed according to the distribution of the populationcorrelation. To determine if two drugs i and j belong to aMoA, a hypothesis testing formulation is developed withthe null hypothesis defined by
H0 : Dij∼ pb(D)
where Dij is the Distance assessment between sample iand j, and pb(D) is the the distribution of the populationdistance. pb(ρ) is estimated empirically based on the pair-wise distances between all sample pairs of the same cellline. Then, a p value of 0.01 is chosen as the significancelevel and the corresponding distance is determined as thethreshold. Hierarchical clustering is performed on all thesamples distances; then clusters are determined by cutting
the linkage at the threshold and the resulted clusters weredefined as the MoAs. Notice that since each MoA wasgenerated totally based on the threshold obtained fromthe background distribution, some MoAs may containlarge number of samples while other MoAs only containfew samples from one or two drugs; this is natural andreasonable because some compounds just do not share thetreatment effectiveness with others.Once the MoAs were identified, it was then desirable
to reveal the relationship of the MoAs in terms of theirtherapeutic effects. Instead of investigating individualcompound in an isolated fashion, MoNet will enableresearch to explore a set of compounds (MoAs) thatshare the same MoA-Signature genes (potential targets),as well as their correlated MoAs.
Drug Effectiveness PredictionUsing the MoNet and the MoA, one can 1) predict drugeffectiveness of a new compound (Similar Prediction)and/or 2) screen compounds to predict the therapeutic
Figure 5 Pseudo code of the proposed gene set selection scheme.
Figure 6 Pseudo code of the proposed quality control scheme.
Ma et al. BMC Systems Biology 2013, 7(Suppl 5):S5http://www.biomedcentral.com/1752-0509/7/S5/S5
Page 12 of 15

effectiveness of different compounds if applied to an indi-vidual tumor (Reverse Prediction). For drug effectivenessprediction, the expression profile of cells/tissue treated bya new compound needs to be obtained and the goal is toidentify the MoA of the compound. For the therapeuticprediction, a query gene expression profile of the tumorsample is required. The goal is to determine the degree ofthe adverse relationship between the MoAs and the tumormarker genes expression that reveals how likely the com-pound is to reverse the expression of tumor marker genes.From the perspective of algorithm development, predic-tion of drug effect and compound screening are essentiallythe same. The only difference is the distance criteria:When similar prediction is applied, the MoA is firstranked for the largest positive distance and then eachdrugs within the MoA are then ranked with the same cri-teria; when reverse prediction is applied, then the MoA isfirst ranked for the smallest negative distance and theneach drugs within each MoA are ranked the same.
Additional material
Additional file 1: Detailed cMap prediction result for E2 treatmentquery.
Additional file 2: Detailed BRCA-MoNet prediction result for similarprediction of individual E2 treatment query.
Additional file 3: Detailed BRCA-MoNet prediction result for reverseprediction of individual E2 treatment query.
Additional file 4: Detailed BRCA-MoNet prediction result for similarprediction of individual BMS784807 treatment query.
Additional file 5: Detailed BRCA-MoNet prediction result for breastcancer patient microarray dataset.
List of abbreviations usedConnectivity map: cMap; Mode of action: MoA; Breast Cancer Mode ofAction Network: BRCA-MoNet; Hierarchical Clustering: HC; Gene ExpressionOmnibus: GEO; 17beta-estrodiol: E2; The Cancer Genome Atlas: TCGA.
Competing interestsThe authors declare that they have no competing interests.
Authors’ contributionsCM, YH, and YC conceived the idea and designed the experiments. CM andHC prepared the data and conducted the experiments. MF developed theweb application. MF, YH and YC wrote the paper.
AcknowledgementsThis work is supported by a National Science Foundation grant (CCF-1246073) to YH and YC, a Qatar National Research Fund grant (09-874-3-235)to YC and YH, and a National Institute of Health grant (NIH-NCATSUL1TR000149) to YC.
DeclarationsThe publication fees were supported by Qatar National Research Fund grant(09-874-3-235).This article has been published as part of BMC Systems Biology Volume 7Supplement 5, 2013: Selected articles from the International Conference onIntelligent Biology and Medicine (ICIBM 2013): Systems Biology. The fullcontents of the supplement are available online at http://www.biomedcentral.com/bmcsystbiol/supplements/7/S5.
Authors’ details1Department of Electrical and Computer Engineering, the University of Texasat San Antonio, One UTSA Circle, San Antonio, Texas, USA. 2GreeheyChildren Cancer Research Institute, the University of Texas Health ScienceCenter at San Antonio, San Antonio, Texas, USA. 3Department ofEpidemiology and Biostatistics, University of Texas Health Science Center atSan Antonio, San Antonio, Texas, USA.
Published: 9 December 2013
References1. Sotiriou C, Pusztai L: Gene-expression signatures in breast cancer. N Engl
J Med 2009, 360(8):790-800.2. Riedel RF, et al: A genomic approach to identify molecular pathways
associated with chemotherapy resistance. Mol Cancer Ther 2008,7(10):3141-9.
3. Schlueter PJ, Peterson RT: Systematizing serendipity for cardiovasculardrug discovery. Circulation 2009, 120(3):255-63.
4. Ebi H, et al: Relationship of deregulated signaling converging onto mTORwith prognosis and classification of lung adenocarcinoma shown by twoindependent in silico analyses. Cancer Res 2009, 69(9):4027-35.
5. Hait WN, Hambley TW: Targeted cancer therapeutics. Cancer Res 2009,69(4):1263-7, discussion 1267.
6. Garman KS, et al: A genomic approach to colon cancer risk stratificationyields biologic insights into therapeutic opportunities. Proc Natl Acad SciUSA 2008, 105(49):19432-7.
7. Yamashita T, et al: EpCAM and alpha-fetoprotein expression definesnovel prognostic subtypes of hepatocellular carcinoma. Cancer Res 2008,68(5):1451-61.
8. Jia HL, et al: Gene expression profiling reveals potential biomarkers ofhuman hepatocellular carcinoma. Clin Cancer Res 2007, 13(4):1133-9.
9. Budhu A, et al: prediction of venous metastases, recurrence, andprognosis in hepatocellular carcinoma based on a unique immuneresponse signature of the liver microenvironment. Cancer Cell 2006,10(2):99-111.
10. Ye QH, et al: predicting hepatitis B virus-positive metastatichepatocellular carcinomas using gene expression profiling andsupervised machine learning. Nat Med 2003, 9(4):416-23.
11. Kessel AGV: Large Scale Genome Variation in Health and Disease in:Cytogenetics and Genome Research.Nijmegen 2006.
12. Lamb J: The Connectivity Map: a new tool for biomedical research. NatRev Cancer 2007, 7(1):54-60.
13. Lee JK, et al: A strategy for predicting the chemosensitivity of humancancers and its application to drug discovery. Proc Natl Acad Sci USA2007, 104(32):13086-91.
14. Subramanian A, et al: Gene set enrichment analysis: a knowledge-basedapproach for interpreting genome-wide expression profiles. Proc NatlAcad Sci USA 2005, 102(43):15545-50.
15. Huang L, et al: An integrated bioinformatics approach identifies elevatedcyclin E2 expression and E2F activity as distinct features of tamoxifenresistant breast tumors. PLoS One 2011, 6(7):e22274.
16. Cohen AL, et al: A pharmacogenomic method for individualizedprediction of drug sensitivity. Mol Syst Biol 2011, 513.
17. Yeh CT, et al: Trifluoperazine an antipsychotic agent inhibits cancer stemcell growth and overcomes drug resistance of lung cancer. Am J RespirCrit Care Med 2012, 186(11):1180-8.
18. Yuen HF, et al: TAZ Expression as a Prognostic Indicator in ColorectalCancer. PLoS One 2013, 8(1):e54211.
19. Edris B, et al: Comparative gene expression profiling of benign andmalignant lesions reveals candidate therapeutic compounds forleiomyosarcoma. Sarcoma 2012, 805614.
20. Reka AK, et al: Identifying inhibitors of epithelial-mesenchymal transitionby connectivity map-based systems approach. J Thorac Oncol 2011,6(11):1784-92.
21. Claerhout S, et al: Gene expression signature analysis identifies vorinostatas a candidate therapy for gastric cancer. PLoS One 2011, 6(9):e24662.
22. Lan MY, et al: From NPC therapeutic target identification to potentialtreatment strategy. Mol Cancer Ther 2010, 9(9):2511-23.
23. Lee HS, et al: Rational drug repositioning guided by an integratedpharmacological network of protein, disease and drug. BMC Syst Biol2012, 80.
Ma et al. BMC Systems Biology 2013, 7(Suppl 5):S5http://www.biomedcentral.com/1752-0509/7/S5/S5
Page 13 of 15

24. Gottlieb A, et al: pREDICT: a method for inferring novel drug indicationswith application to personalized medicine. Mol Syst Biol 2011, 496.
25. Hu G, Agarwal P: Human disease-drug network based on genomicexpression profiles. PLoS One 2009, 4(8):e6536.
26. Shats I, et al: Using a stem cell-based signature to guide therapeuticselection in cancer. Cancer Res 2011, 71(5):1772-80.
27. Jin G, et al: A novel method of transcriptional response analysis to facilitatedrug repositioning for cancer therapy. Cancer Res 2012, 72(1):33-44.
28. Zhao C, et al: Identifying mechanistic similarities in drug responses.Bioinformatics 2012, 28(14):1902-10.
29. Shigemizu D, et al: Using functional signatures to identify repositioneddrugs for breast, myelogenous leukemia and prostate cancer. PLoSComput Biol 2012, 8(2):e1002347.
30. McArt DG, Zhang SD: Identification of candidate small-moleculetherapeutics to cancer by gene-signature perturbation in connectivitymapping. PLoS One 2011, 6(1):e16382.
31. Ma H, Zhao H: FacPad: Bayesian sparse factor modeling for the inferenceof pathways responsive to drug treatment. Bioinformatics 2012,28(20):2662-70.
32. Bulzomi P, et al: Naringenin and 17beta-estradiol coadministrationprevents hormone-induced human cancer cell growth. IUBMB Life 2010,62(1):51-60.
33. Inoue A, et al: Transcription factor EGR3 is involved in the estrogen-signaling pathway in breast cancer cells. J Mol Endocrinol 2004,32(3):649-61.
34. Drabsch Y, Robert RG, Gonda TJ: MYB suppresses differentiation andapoptosis of human breast cancer cells. Breast Cancer Res 2010, 12(4):R55.
35. Frasor J, et al: Gene expression preferentially regulated by tamoxifen inbreast cancer cells and correlations with clinical outcome. Cancer Res2006, 66(14):7334-40.
36. Greenway FL, Bray GA, Heber D: Topical fat reduction. Obes Res 1995,3(Suppl 4):561S-568S.
37. Guo AJ, et al: Kaempferol as a flavonoid induces osteoblasticdifferentiation via estrogen receptor signaling. Chin Med 2012, 10.
38. Wang J, et al: Kaempferol is an estrogen-related receptor alpha andgamma inverse agonist. FEBS Lett 2009, 583(4):643-7.
39. Hung H: Inhibition of estrogen receptor alpha expression and functionin MCF-7 cells by kaempferol. Journal of Cellular Physiology 2004,198(2):197-208.
40. Kim HJ, et al: Estrogen receptor alpha-induced cholecystokinin type Areceptor expression in the female mouse pituitary. J Endocrinol 2007,195(3):393-405.
41. Planas-Silva MD, Filatova IS: Estrogen-dependent regulation of Eg5 inbreast cancer cells. Anticancer Drugs 2007, 18(7):773-9.
42. Widdop B: Therapeutic drug monitoring. Contemporary issues in clinicalbiochemistry Edinburgh; New York: Churchill Livingstone; 1985.
43. Willemse PH, et al: Clinical and endocrine effects of cyproterone acetatein postmenopausal patients with advanced breast cancer. Eur J CancerClin Oncol 1988, 24(3):417-21.
44. Awasthi N, et al: BMS-754807, a small-molecule inhibitor of insulin-likegrowth factor-1 receptor/insulin receptor, enhances gemcitabineresponse in pancreatic cancer. Mol Cancer Ther 2012, 11(12):2644-53.
45. Lee SJ, et al: A pilot study for the early assessment of the effects of BMS-754807 plus gefitinib in an H292 tumor model by [(18)F]fluorothymidine-positron emission tomography. Invest New Drugs 2012.
46. Kolb EA, et al: Initial testing (stage 1) of the IGF-1 receptor inhibitor BMS-754807 by the pediatric preclinical testing program. Pediatr Blood Cancer2011, 56(4):595-603.
47. Carboni JM, et al: BMS-754807, a small molecule inhibitor of insulin-likegrowth factor-1R/IR. Mol Cancer Ther 2009, 8(12):3341-9.
48. Litzenburger BC, et al: High IGF-IR Activity in Triple-Negative BreastCancer Cell Lines Correlates with Sensitivity to IGF-IR Inhibitor BMS-754807 in This Subtype of Human Breast Cancer. Cancer Research 2009,69(24):581s-581s.
49. Tamura Y, et al: phase 1 Dose-Escalating Study of Bms-754807 in JapanesePatients with Advanced Solid Tumors. Annals of Oncology 2012, 111-112.
50. Kolb EA, et al: Initial Testing (Stage 1) of the IGF-1 Receptor InhibitorBMS-754807 by the Pediatric Preclinical Testing Program. Pediatr BloodCancer 2011, 56(4):595-603.
51. Chu QS, et al: BMS-754807, an oral dual IGF-1R/insulin receptor (IR)inhibitor: initial results from a Phase 1 dose- and schedule-finding study
in combination with carboplatin/paclitaxel in subjects with solid tumors.Ejc Supplements 2010, 8(7):131-131.
52. Desai J, et al: Targeting Type I Insulin-Like Growth Factor Receptor andInsulin Receptor for Cancer Therapy: The Oral Dual Inhibitor Bms-754807in Clinical Development. Annals of Oncology 2010, 9-9.
53. Macdonald RL, Bergey GK: Valproic acid: effect on GABA-mediatedpostsynaptic inhibition in cultured mammalian spinal cord neurons.Trans Am Neurol Assoc 1978, 254-6.
54. Duenas-Gonzalez A, et al: Valproic acid as epigenetic cancer drug:preclinical, clinical and transcriptional effects on solid tumors. CancerTreat Rev 2008, 34(3):206-22.
55. Michaelis M, Doerr HW, Cinatl J Jr: Valproic acid as anti-cancer drug. CurrPharm Des 2007, 13(33):3378-93.
56. Fortunati N, et al: Valproic acid is a selective antiproliferative agent inestrogen-sensitive breast cancer cells. Cancer Lett 2008, 259(2):156-64.
57. Oh DS, et al: Estrogen-regulated genes predict survival in hormonereceptor-positive breast cancers. Journal of Clinical Oncology 2006,24(11):1656-64.
58. Macdonald F: Dictionary of pharmacological agents. London; Weinheim;New York: Chapman & Hall; 1997, 1 livret d’installation d’un cédérom.
59. Munster PN, et al: Modulation of Hsp90 function by ansamycinssensitizes breast cancer cells to chemotherapy-induced apoptosis in anRB- and schedule-dependent manner. See: E. A. Sausville, Combiningcytotoxics and 17-allylamino, 17-demethoxygeldanamycin, sequenceand tumor biology matters, Clin. Cancer Res., 7: 2155-2158, 2001. ClinCancer Res 2001, 7(8):2228-36.
60. Kitson RR, et al: Synthesis of 19-substituted geldanamycins with alteredconformations and their binding to heat shock protein Hsp90. Nat Chem2013, 5(4):307-14.
61. Onuoha SC, et al: Mechanistic studies on Hsp90 inhibition by ansamycinderivatives. J Mol Biol 2007, 372(2):287-97.
62. Bellarosa D, et al: SAHA/Vorinostat induces the expression of the CD137receptor/ligand system and enhances apoptosis mediated by solubleCD137 receptor in a human breast cancer cell line. Int J Oncol 2012,41(4):1486-1494.
63. Fiskus W, et al: Co-treatment with vorinostat synergistically enhancesactivity of Aurora kinase inhibitor against human breast cancer cells.Breast Cancer Research and Treatment 2012, 135(2):433-444.
64. Uehara N, Yoshizawa K, Tsubura A: Vorinostat enhances protein stabilityof p27 and p21 through negative regulation of Skp2 and Cks1 inhuman breast cancer cells. Oncology Reports 2012, 28(1):105-110.
65. Uehara N, et al: Requirement of p38 MAPK for a cell-death pathwaytriggered by vorinostat in MDA-MB-231 human breast cancer cells.Cancer Lett 2012, 315(2):112-121.
66. Wong NS, et al: Impact of UDP-gluconoryltransferase 2B17 genotype onvorinostat metabolism and clinical outcomes in Asian women withbreast cancer. Pharmacogenet Genomics 2011, 21(11):760-768.
67. Munster PN, et al: A phase II study of the histone deacetylase inhibitorvorinostat combined with tamoxifen for the treatment of patients withhormone therapy-resistant breast cancer. Br J Cancer 2011,104(12):1828-1835.
68. Zhou Q, et al: Screening for therapeutic targets of vorinostat by SILAC-based proteomic analysis in human breast cancer cells. Proteomics 2010,10(5):1029-1039.
69. Swaby RF, et al: A Phase II Study of the Histone Deacetylase Inhibitor,Vorinostat, in Combination with Trastuzumab in Patients with AdvancedMetastatic and/or Local Chest Wall Recurrent HER-2 Amplified BreastCancer Resistant to Transtuzumab-Containing Therapy: (E1104) a Trial ofthe Eastern Cooperative Oncology Group. Cancer Research 2009,69(24):793s-793s.
70. Palmieri D, et al: preclinical studies in support of the use of vorinostat(SAHA) for the treatment of brain metastases of breast cancer. Clinical &Experimental Metastasis 2009, 26(7):905-906.
71. Munster PN, et al: phase II trial of the histone deacetylase inhibitor,vorinostat, to restore hormone sensitivity to the antiestrogentamoxifen in patients with advanced breast cancer whoprogressed on prior hormone therapy. Journal of Clinical Oncology2009, 27(15).
72. Luu TH, Morgan RJ, Leong L: A Phase II Trial of Vorinostat in MetastaticBreast Cancer (vol 14, pg 7138, 2008). Clinical Cancer Research 2009,15(1):416-416.
Ma et al. BMC Systems Biology 2013, 7(Suppl 5):S5http://www.biomedcentral.com/1752-0509/7/S5/S5
Page 14 of 15

73. Luu TH, et al: A Phase II Trial of Vorinostat (Suberoylanilide HydroxamicAcid) in Metastatic Breast Cancer: A California Cancer Consortium Study.Clinical Cancer Research 2008, 14(21):7138-7142.
74. Vanhaecke T, et al: Trichostatin A-like hydroxamate histone deacetylaseinhibitors as therapeutic agents: toxicological point of view. CurrentMedicinal Chemistry 2004, 11(12):1629-43.
75. Tavakoli-Yaraki M, et al: Induction of apoptosis by Trichostatin A inhuman breast cancer cell lines: involvement of 15-Lox-1. Tumour Biol2013, 34(1):241-9.
76. Nakajima S, et al: Trichostatin A with adenovirus-mediated p53 genetransfer synergistically induces apoptosis in breast cancer cell line MDA-MB-231. Oncology Reports 2009, 22(1):143-8.
77. Alao JP, et al: Histone deacetylase inhibitor, trichostatin A inducesubiquitin-dependent cyclin D1 degradation in MCF-7 breast cancer cells.Mol Cancer 2006, 8.
78. Min KN, et al: Estrogen receptor enhances the antiproliferative effects oftrichostatin A and HC-toxin in human breast cancer cells. Arch Pharm Res2004, 27(5):554-61.
79. Vigushin DM, et al: Trichostatin A is a histone deacetylase inhibitor withpotent antitumor activity against breast cancer in vivo. Clin Cancer Res2001, 7(4):971-6.
doi:10.1186/1752-0509-7-S5-S5Cite this article as: Ma et al.: BRCA-Monet: a breast cancer specific drugtreatment mode-of-action network for treatment effective predictionusing large scale microarray database. BMC Systems Biology 20137(Suppl 5):S5.
Submit your next manuscript to BioMed Centraland take full advantage of:
• Convenient online submission
• Thorough peer review
• No space constraints or color figure charges
• Immediate publication on acceptance
• Inclusion in PubMed, CAS, Scopus and Google Scholar
• Research which is freely available for redistribution
Submit your manuscript at www.biomedcentral.com/submit
Ma et al. BMC Systems Biology 2013, 7(Suppl 5):S5http://www.biomedcentral.com/1752-0509/7/S5/S5
Page 15 of 15