BRAZORIA CHAMBERS FORT BEND GALVESTON … · the Houston eight-county region stands in these...
31
1 BRAZORIA ❘ CHAMBERS ❘ FORT BEND ❘ GALVESTON ❘ HARRIS ❘ LIBERTY ❘ MONTGOMERY ❘ WALLER
Transcript of BRAZORIA CHAMBERS FORT BEND GALVESTON … · the Houston eight-county region stands in these...
1BRAZORIA � CHAMBERS � FORT BEND � GALVESTON � HARRIS � LIBERTY � MONTGOMERY � WALLER

3BRAZORIA � CHAMBERS � FORT BEND � GALVESTON � HARRIS � LIBERTY � MONTGOMERY � WALLER2013 HEALTHY COMMUNITIES INDICATOR REPORT CENTER FOR HOUSTON’S FUTURE The Region’s Think Tank2
Regional Nine Letter / page 2Acknowledgements / page 4Executive Summary / page 6Policy Recommendations / page 7
contentsInternational Perspective / page 8Immunizations: The Game Changer / page 10People / page 12Place / page 28
Access / page 40Scenarios 2040 / page 51 Appendices / page 52Donors / page 56
FOR AN ELECTRONIC VERSION OF THIS INDICATOR REPORT, PLEASE VISIT HOUSTONINDICATORS.ORG
THIS IS THE FIFTH IN A SERIES OF CENTER FOR HOUSTON’S FUTURECOMMUNITY INDICATOR REPORTS
2007 / An Environment Indicator Report
2009 / Air Quality, Parks & Trails, Trees
2010 / Water Quality, Water Supply & Green Buildings
2012 / Human Capital Development and Education:Early Childhood, K-12, Workforce Preparedness
2013 / Healthy Communities
THE CENTER FOR HOUSTON’S FUTURE,
T
IN ADDITION TO CORPORATE, FOUNDATION
AND INDIVIDUAL CONTRIBUTORS FROM
THROUGHOUT THE EIGHT-COUNTY REGION,
CENTER FOR HOUSTON’S FUTURE THANKS
THE FOLLOWING FOR THEIR GENEROUS
SUPPORT OF THE COMMUNITY INDICATOR
REPORT AND SYMPOSIUM:

5BRAZORIA � CHAMBERS � FORT BEND � GALVESTON � HARRIS � LIBERTY � MONTGOMERY � WALLER2013 HEALTHY COMMUNITIES INDICATOR REPORT CENTER FOR HOUSTON’S FUTURE The Region’s Think Tank4
Dear FriendsWith this report, Center for Houston’s Future continues to provide a valuable resource on how the Houston region
stacks up on competitiveness and sustainability. The 2013 Healthy Communities Indicators Report is a peer-reviewed reportcard for the region that establishes metrics on how people and place intersect to shape health and wellness in the region.
The publication is an excellent tool to facilitate good public policy decisions by making available reliable, longitudinal data.
Center for Houston’s Future has produced this report through extensive collaboration with subject matter experts, most
of whom have served as dedicated volunteers. Indicators relating to People, Place and Access give a snapshot of where the Houston eight-county region stands in these critical areas. Clearly, the health of our communities will help to determine
the vitality of our region’s future workforce and economy.
The 2013 Healthy Communities Indicators Report is the fifth annual report in a series intended to help measure progress
over time in key areas. Since 2007, the Center’s benchmark studies have covered topics including human capital
development and education, air quality, billboards, green buildings, litter and graffiti, parks and trails, tax delinquent lots,
trees, water quality, water supply and resource use.
By highlighting our region’s many successes and the critical areas of needed increased effort, the Center’s annual
Community Indicators Report serves as the basis for collaboration to advance the Houston region as a top global community
in which to work and live.
Sincerely,
Annise Parker Ed Emmett Robert HebertMayor of Houston Harris County Judge Fort Bend County Judge
Alan B. Sadler Jimmy Silvia Craig McNairMontgomery County Judge Chambers County Judge Liberty County Judge
E.J. King Glenn Beckendorff Mark HenryBrazoria County Judge Waller County Judge Galveston County Judge
HEALTHYCOMMUNITIES
INDICATOR REPORT 2013
HEALTHYCOMMUNITIES
INDICATOR REPORT 2013
The health of a community depends on the
interaction between its population – PEOPLE – and its
environment – PLACE – and ACCESS to care.

2013 HEALTHY COMMUNITY INDICATOR REPORT CENTER FOR HOUSTON’S FUTURE The Region’s Think Tank 7BRAZORIA � CHAMBERS � FORT BEND � GALVESTON � HARRIS � LIBERTY � MONTGOMERY � WALLER6
AUTHORSKarl Eschbach, Ph.D., Professor and Director of Population Research, Departments of Internal Medicine and Preventive Medicine & Community Health; Fellow, Sealy Center on Aging, UTMB Health
Charles Begley, Ph.D., Professor, Management, Policy & Community Health, UT School of Public HealthJeanne Hanks, DrPH, MSW, Assistant Director of Operations, St. Luke's Episcopal Health CharitiesPhuc Le, MPH, Ph.D., Candidate in Health Economics/Health Services Research, UT School of Public Health
CONTRIBUTING AUTHORSGracie Cavnar, Founder, President and CEO, Recipe for Success Foundation
Winifred J. Hamilton, Ph.D., Director, Environmental Health Service, Baylor College of Medicine
Graciela Lubertino, Ph.D., Chief Air Quality Planner, Houston-Galveston Area Council
DATA GROUPSPeople Data GroupOlivia Dear, M.P.A., Harris County Healthcare AllianceLarissa Estes, DrPH, Program Specialist V, Institute for Healthcare Quality and Efficiency, Texas Health and Human Services CommissionJune Hanke, RN, MSN, M.P.H., Community Health and Wellness Strategic Analyst and Planner, Harris Health System J. Scott Hickey, Ph.D., Outcomes Management Director, MHMRA of Harris CountyHarry Holmes, Ph.D., Senior Policy Advisor, Harris County Healthcare AllianceHaley Jackson, M.P.H., CHES, CPH, Team Lead for Community and Family Health Program, Texas Department of State Health Services, Health Service Region 6/5 SouthMark E. Kunik, MD, M.P.H., Michael E. DeBakey VAMC, Baylor College of MedicineJulie P. Martineau, President, Montgomery County United WayBakeyah Nelson, Ph.D., Public Health Analyst, Office of Policy and Planning, Harris County Public Health and Environmental Services
Tuan D.Nguyen, Ph.D., Director, Executive Decision Support, MHMRA of Harris CountyBeverly Nichols, PsyD, RN, Senior Staff Analyst, Office of Health Planning, Evaluation and Program Development, Houston Department of Health and Human ServicesLexi Nolen, Ph.D., M.P.H., Director, UTMB Center to Eliminate Health DisparitiesKathryn Peek, Ph.D., Assistant Vice President, University Health Initiatives, University of HoustonDavid Persse, MD, EMS Physician Director & Public Health Authority, City of HoustonApril Sanders, Ph.D., Outcome Analyst, MHMRA of Harris County
Place Data GroupLauri Andress, MPH, JD, Ph.D., Managing Partner, Andress & Associates, LLCWinifred J. Hamilton, Ph.D., Director, Environmental Health Service, Baylor College of MedicineJean Niswonger, GIS Support Specialist, Rice UniversityRoksan Okan-Vick, FAIA, Executive Director, Houston Parks Board
William Brett Perkison, MD, M.P.H., Medical Director, Texas Children’s HospitalJen Powis, Advocacy Director, Houston Parks BoardSeann Dinnon Regan, MA, GIS Spatial Analyst, The University of Texas MD Anderson Cancer CenterBrenda Reyes, MD, MPH, Chief, City of Houston Department of Health and Human ServicesJeff Taebel, FAICP, Director of Community and Environmental Planning, Houston-Galveston Area CouncilRives Taylor, AIA, LEED PA, Director, GenslerMatthew Tejada, Ph.D., Director, Air Alliance HoustonChelsea Young, AICP, Pedestrian-Bicyclist Coordinator, Houston-Galveston Area Council
Access Data Group Susan Fordice, President and CEO,Mental Health America of Greater HoustonAlejandra Posada, M.Ed., Director, Education & Training, Mental Health America of Greater Houston
PEER REVIEWERSStephen H. Linder, Ph.D., Professor and Associate Director, Institute for Health Policy, The University of Texas School of Public Health.Laura McKieran, Dr.P.H., Associate Professor, San Antonio Regional Campus at The University of Texas Health Science Center at Houston, Executive Director, Community Information Now
CONTRIBUTING EDITORSElena Marks, J.D., M.P.H, Health Policy Scholar,Baker Institute for Public Policy Nanette van Gend,MA, Independent Research Consultant
2013 COMMUNITY INDICATOR POLICY COMMITTEEDan Bellow, Policy Committee Chair, President-Houston, Jones Lang LaSalle Americas, Inc.Juanita Romans, Vice Chair, Principal, the Romans Group Katy Caldwell, Executive Director, Legacy Community Health Services Karl Eschbach, Ph.D., Professor and Director of Population Research,Departments of Internal Medicine and Preventive Medicine & Community Health; Fellow, Sealy Center on Aging, UTMB HealthWinifred J Hamilton, Ph.D., Director, Environmental Health Service, Baylor College of MedicineJeanne Hanks, DrPH, MSW, Assistant Director of Operations, St. Luke’s Episcopal Health CharitiesBrenda Hellyer, Ed.D., Chancellor, San Jacinto College DistrictMargo Hilliard Alford, M.D., M.P.H., Senior Vice President, Community Health , Harris Health System Stephen Klineberg, Ph.D., Professor of Sociology at Rice University andCo-Director of the Kinder Institute for Urban ResearchJim Lester, Ph.D., President and CEO, Houston Advanced Research CenterKaren Love, Senior Vice President, Strategic Planning and Partnerships,Community Health Choice, Inc.John Mendelsohn, M.D., President & CEO, The University of Texas – MD Anderson Cancer CenterDavid Persse, MD, EMS Physician Director & Public Health Authority – City of HoustonVictoria Routt Gerber, HSE Manager – Environment & Sustainable Development, KBR Inc. Jeff Taebel, FAICP, Director Director of Community and Environmental Planning, Houston-Galveston Area Council
SPECIAL THANKS TOJames Calaway, Board Chair 2011-2012, for his leadership on this project.
Center for Houston’s Future, Community Indicator Program
Catherine Clark Mosbacher, President and CEODonna Rybiski, Director of Strategic InitiativesSandra Wegmann, Senior Manager of Strategic InitiativesChuck Thomas, GIS and Digital Media SpecialistMargarita Perez, Manager of Marketing & Community Outreach
The Center for Houston’s Future, The Region’s ThinkTank, is proud to present this 2013 Healthy CommunitiesIndicator Report.
We owe a debt of gratitude to the more than 50 professionals, and their organizations, who generouslygave their time and talent by identifying data sources,writing and editing the text, and conductingpeer reviewsfor the accuracy and integrity of the report.
The future of the region will be healthier, more prosperous – and brighter – because of their efforts.

9BRAZORIA � CHAMBERS � FORT BEND � GALVESTON � HARRIS � LIBERTY � MONTGOMERY � WALLER2013 HEALTHY COMMUNITIES INDICATOR REPORT CENTER FOR HOUSTON’S FUTURE The Region’s Think Tank8
Executive Sum
mary
PolicyRecommendations
The Center for Houston’s Future presents its 2013 Community Indicators Report, Healthy Communities: People, Place and Access. The Center for Houston’s Future began publishinga Community Indicator Report in 2007 on topics that are critical to the competitiveness andsustainability of the 8-county region to answer the simple question, “Are things getting betteror worse?” A group of more than 50 experts participated in the development of this report,providing data and critical input into the selected indicators.
The health of a community depends on the interaction between its population—people—and its environment—place—and access to health care. Therefore, the indicators were selected in accordance with this focus and prioritized according to the following criteria: the potential of the indicator to demonstrate the interaction between people, place and access; the relevance to the region’s competitiveness andsustainability; the availability of longitudinal data; and the feasibility to act on the data.
The health status of the region’s people, overall, is below average compared to other metropolitan areas in the country, as shown in thesummary indicators table below. Place presents challenges to community health, several of which are being addressed, e.g. air quality, whileothers, like income disparities, are growing. Health care is less accessible, particularly for the working poor, than in other regions. The rising rate of obesity is the single biggest challenge to the overall health of the region and is impacted by people, place and access to care.The region’s ability to be globally competitive depends, in large part, on how the region addresses the health challenges identified in this report.
Because community health is the product of the intersection of demographic, environmental and health system factors, policies thataddress multiple factors simultaneously, at the system level when possible, are likely to have the greatest impact. A proven approachto ensure that community health is addressed systematically is to incorporate Health Impact Assessments into the planning of major development and redevelopment projects.
A Health Impact Assessment (“HIA”) measures the health effectsof policies, plans and projects in diverse economic sectors using quantitative, qualitative and participatory techniques. HIA is employed worldwide and promoted by the Centers for Disease Control, World Health Organization, Pew Charitable Trusts, RobertWoods Johnson Foundation and others. Increasingly, governmentalagencies require an HIA for its regulatory and funding allocation.
HIAs use a broad definition of health to emphasize that a person’s health is significantly influenced by their surroundings. Manyfactors—like opportunities for employment, income, housing, environment, education and transportation, and access to grocerystores—affect one’s health. Using this broad definition of health, HIAspredict the impacts—either direct or indirect—of a project on health.For example, increased auto pollutants from a highway expansionmay directly affect the health of nearby residents. HIA also considersthe indirect health effects of a project. For example, physical activityand nutrition is partially determined by location of housing, access topublic spaces and availability of fresh produce.
The following policy recommendations are offered for consideration toaddress specific concerns identified in the report:
� Because of the inextricable link between health and education, invest in the education of all residents. Fully restore state education cuts resulting from the 2011 Texas Legislative Session and provide Pre-K4 classes for all children.
� Increase the capacity of the health care delivery system to provide quality care to more patients, particularly the workingpoor. Press for expansion of the most cost effective Federally Qualified Health Centers (FQHCs).
� Advocate for increased state funding of the health care work force.
� Recognize that health disparities negatively affect the health of the entire community and address them with the serious attention they deserve.
� Create healthy living spaces by making it a priority. Disseminate widely The Healthy Homes principles through health care providers, schools and other community organizations.
� Recognize obesity as the most serious health threat to the region and devote significant resources to combating it. Give multi-faceted programs that address the multiple causes of obesity funding priority.
� Site schools and homes away from significant pollution sources. Create buffer zones to ensure that people are not unduly exposed to pollution sources.
PeopleThe region’s 6 million people are more ethnically diverse,younger and less well-educated than the US as a whole,and represent a larger percent of people in poverty. Although the region’s obesity rate is slightly lower than theUS average, more people are obese than most competitorregions. The population meets, or fails to meet, guidelinesfor diet, exercise and smoking about as well as other regions.Significant health disparities exist among ethnic groups inthe region, with Blacks most often bearing the brunt. Thisis particularly apparent in maternal-child health data whichshow starkly poorer outcomes for Blacks. On the positiveside, longitudinal data show improvement in some areasfor all groups, including colorectal cancer mortality.
PlaceIt is well documented, and the data in this report show,that poor health status, including higher mortality rates, iscorrelated with lower levels of educational attainment andlower socioeconomic status. The environment in whichpeople live also influences their health, directly and indirectly. When people live, work or go to school wherethe air is polluted, or in buildings with toxic materials, they are exposed to health hazards. People who live inneighborhoods with limited access to parks or grocerystores have a hard time getting exercise or healthy foods.And, people who live in areas of concentrated povertyhave significantly higher risks of dying of many diseases,including diabetes, stroke, heart disease and cancer.
AccessAccess to a doctor or nurse for preventive and primarycare also impacts a community’s health. Having health insurance increases the likelihood that a person will access health care, particularly in non-emergency situations. More than a million people in the region areuninsured and rely extensively on safety net providers forcare. Although the region’s safety net has grown in thepast decade, it still lags most other regions of the countryin the ability to meet the needs of the working poor. Therest of the population faces limited access as well. Texashas an insufficient number of doctors and nurses to meetthe current and projected needs of the growing and aging population, and cuts made by the state in 2011 willexacerbate the situation if not reversed. The Affordable CareAct has the potential to bring health insurance to manymore Texans, but if the access issues are not addressed,newly insured people will still face obstacles.

International Perspective
10.9%
57%
9.4%
11.7%
11.4%
10.8%
9.7%
9.8%
8.5%
11.3%
35
30
25
20
15
10
5
0
USUNITED KINGDO
M
SWITZERLAND
SWEDEN
NORW
AY
NETHERLANDS
GERM
ANY
FRANCE
CANADA
AUSTRALIA
FIGURE 1B
Obesity Rates 1970-2010, 10 nations FIGURE 216.2%
FIG
URE
1A
Obesity Rates 1970-2010, 10 nations FIGURE 2
1970 1975 1980 1985 1990 1995 2000 2005 2010
YEAR
33
25
PERC
ENT
2013 HEALTHY COMMUNITIES INDICATOR REPORT CENTER FOR HOUSTON’S FUTURE The Region’s Think Tank 11BRAZORIA � CHAMBERS � FORT BEND � GALVESTON � HARRIS � LIBERTY � MONTGOMERY � WALLER10
work in the fields is swapped for sitting at a desk. In developed nations,the share of the population that gets insufficient exercise is more than twiceas high as in poor ones. In the 21st Century it is difficult to envision a return to hard manual labor.
Why is obesity such an important metric both in the US and worldwide? It is because obesity is a contributing factor to many life threatening diseases, including heart disease, stroke, cancers, hypertension and renal failure, and at US levels is a significant contributor to the cost of health care.
Obesity, which is responsible for an increasingly large portion of disease and health care expenditure, is highest in the US among all OECDnations. A 2010 study in the US estimated that per person increases indirect medical costs associated with obesity was $1,463 per person annually. The study also reported that just a 1% reduction in the obesityrate over 20 years beginning in 2010 would save $85 billion in US health care costs (Colditz, Graham & Wong, Chapter 13 in Hu, [2008];Finkelstein et al., 2009; 2012).
While obesity rates increased in many countries from 1990 forward,in recent years, the rates have declined in a number of countries, while theUS rate has continued to climb. The growing obesity epidemic in the US,Texas and this region puts us at risk for falling even farther behind ourcompetitor nations as obesity, like many other chronic diseases, reducesproductivity and increases the overall cost of health care.
SOURCE: OSBORN, R; REED, S; SQUIRES,D; THOMSON, S. INTERNATIONAL PROFILES
OF HEALTHCARE SYSTEMS, 2011
Total Health Expenditures as a Percent of GDP
Country Comparison of Cost Barriers to Health Care
Throughout this report, the greater Houston region’s performanceon health-related indicators is compared to Texas, the United States,and other metropolitan regions in the United States (US). Because society is increasingly global, where people and capital move from one country to another, it is useful to examine the region’s performance in an international context.
Figure 1A shows that the US spends more on health as a per-cent of GDP (16.2%) than other OECD nations. France is second at11.7%; Germany at 11.4%; and, Switzerland at 11.3%. Yet, as is shownin Table 1, the health outcomes for generally accepted internationalindicators of health care, i.e. infant mortality, obesity and infant mortality are lower. France has a life expectancy of 81.3 years andan infant mortality rate of 3.6/10,000 live births; and, Germany hasa life expectancy of 80.5 years and an infant mortality rate of 3.4deaths/10,000 live births. The US lags in life expectancy at 78.7years and an infant mortality rate of 4.3 deaths/10,000 live births.Smoking cessation is the indicator on which the US has made themost progress and leads other nations.
Figure 1B shows that more patients face barriers to health caredue to costs than other OECD nation. The same research found that33% of US patients said they had experienced barriers to health carebecause of costs, compared to 25% in Germany and 22% in Australia.
While the US spends significantly more money on health carethan any other nation, it is ranked 37th for health system quality and 72ndfor population health status. (WHO, 2010) This statistic along with thedata presented above demonstrates that the high rate of US spending onhealth care does not translate into a better system.
According to the Centers for Disease Control, “since 1900, life expectancy in the US has increased approximately 40 years. Only sevenof those years can be attributed to improvements in disease care whilethe rest are the result of improved prevention, e.g. immunizations, andmodern infrastructure, e.g. sanitary sewers, water purification, etc. Thelink between health and the environment is unmistakable.”
Despite this progress, when international health statistics are compared among the 34 developed countries of the Organization forEconomic Development and Co-operation (OECD), the US still does notcompare favorably in many areas, despite the fact that the US spendsmore money on healthcare than any other country.
Table 1 shows how the US measures up on various health indicators.The most glaring fact is that the US has an infant mortality of 6.1%, behindother OECD nations, including Poland, Greece, Germany, France and the UK.
As is shown in Figure 2, obesity is an issue worldwide, more so inthe US where obesity has reached epidemic proportions. In December2012, The Economist magazine reported that “obesity rises correlate with an increase in GDP up to $5,000 per person per year then the correlation ends.” Greater wealth which has afforded many significantchanges in lifestyles has meant that walking is abandoned for cars, and
LIFE EXPECTANCY OBESITY DAILY TOBACCO INFANT AT BIRTH, YEARS RATE USE RATE MORTALITY RATE
Australia 81.8 21.3 15.1 4.1 Canada 80.8 17.5 16.3 5.1 Chile 79.0 12.1 29.8 7.9 France 81.3 12.9 23.3 3.6 Germany 80.5 14.7 21.9 3.4 Greece 80.6 17.3 31.9 3.8 Hungary 74.3 19.5 26.5 5.3 Ireland 81.0 15.0 29.0 3.8 Italy 82.0 10.3 23.1 3.4 Japan 83.0 .. 19.5 2.3 Korea 80.7 2.0 22.9 3.2 Mexico 75.5 .. 13.3 14.1 Netherlands 80.8 11.4 20.9 3.8 Poland 76.3 15.8 23.8 5.0 Spain 82.2 16.0 26.2 3.2 Sweden 81.5 12.9 14.0 2.5 Switzerland 82.6 8.1 20.4 3.8 Turkey 74.3 16.9 25.4 10.1 United Kingdom 80.6 .. 21.5 4.2 United States 78.7 28.1 15.1 6.1 OECD AVERAGE 79.8 15.0 21.1 4.3
TABLE 1Selected Indicators of Health Status
among OECD Nations
SOURCE: INTERNATIONAL PROFILES OF HEALTHCARE SYSTEMS 2011
SOURCE: WHO GLOBAL DATA REPOSITORY
USA

13BRAZORIA � CHAMBERS � FORT BEND � GALVESTON � HARRIS � LIBERTY � MONTGOMERY � WALLER2013 HEALTHY COMMUNITIES INDICATOR REPORT CENTER FOR HOUSTON’S FUTURE The Region’s Think Tank12
Immunizations: The Game Changer
US Mortality Rates at Selected Dates
Spraying for mosquitoes, Yellow Fever in New Orleans, 1905
First typhoid vaccination, U.S. Army Medical School, March, 1909
Diphtheria immunization inNew York, 1920
Cow used for smallpox vaccine production. The Historical Medical Library of The College of Physicians of Philadelphia
Today these sounds, sights and reactions are lost to the passage of time. Taken for granted are the immunizations and vaccines that make these symptoms and theirdiseases mostly a thing the past.
Among the most dreaded diseases was smallpox. Descriptions of smallpox date to the 4th Century BC in China and the 7th BC Centuryin India. Egyptian mummies 3,000 years old show evidence of smallpox. Some historians speculate that smallpox was introduced to Europeby Arab traders, and by the 16th Century, smallpox was well established.
The world’s first vaccine for smallpox was discovered by Edward Jenner, a country doctor living in Berkeley, England. Not the typical country doctor, Jenner had a broad knowledge of science and medicine, plus an interest in natural history and animal biology. He wanted tounderstand the role of human-animal boundaries, particularly in disease transmission. Moreover, he relied extensively on knowledge of thelocal customs of farming communities. Jenner may have been among the first to look at disease in a holistic fashion.
Over a number of years, he observed that milkmaids contracted smallpox but rarely suffered its oozing pustules, disfigurement or death.In 1796, Jenner took pus from a cowpox lesion on a milkmaid’s hand and inoculated an eight-year old boy. Six weeks later he performed a second inoculation. The young boy never contracted the disease. After conducting 16 additional experiments, Jenner published his resultslaying the foundation for modern vaccinology.
During the following decades effective production of smallpox vaccines was developed and deaths to smallpox declined. As time passed,other discoveries, including vaccines for diphtheria in 1892, whooping cough in 1939, and measles in 1958, resulted in significant declinesin mortality. In 1900, 21,064 smallpox cases were reported. The last known case of smallpox in the US occurred in Hidalgo County, Texasin 1949.
According to the CDC, US life expectancy has increased since 1900, mostly as a result of improved sanitation, improved diet, and better housing. Immunizations and vaccines have played an important role in reducing mortality. In 1920, almost half million measles caseswere reported with 15% resulting in death, as did 9% of the 148,000 diphtheria cases. The accompanying chart clearly shows the impact ofimmunization for five of the worst diseases in history.
Throughout history people lived in fear of fevers, laboredbreaths, dreaded coughs, unsightly lesions, swollen glandsand other unsavory reactions to illnesses.
SOURCE: SELECTED VITAL STATISTICS OF THE U.S.
FIGURE 3

2013 HEALTHY COMMUNITIES INDICATOR REPORT CENTER FOR HOUSTON’S FUTURE The Region’s Think Tank 15BRAZORIA � CHAMBERS � FORT BEND � GALVESTON � HARRIS � LIBERTY � MONTGOMERY � WALLER14
PEOPLE
A number of factors reliably inform health outcomes: education, income, ethnicity, gender, age, behavior, access to preventive care and the larger issue of place. Data from this report reveal that the greater Houston region is average or below average as compared to other areas in the U.S. Being average does not revealmarked health disparities among different racial and economic groups nor does it necessarily result in desirablehealth outcomes.
The good news is that mortality rates are falling over time for all ethnic groups. The concerning news is thatboth diabetes and obesity rates have increased steadily. More than one in four in the Houston 10-county regionis obese, surpassing all of our competitor regions except Dallas. Alarmingly, only a small percentage of residents are engaging in healthy behaviors such as exercise and consumption of fruits and vegetables that help to prevent obesity and diabetes. In most cases, higher levels of education are correlated with healthier behavior and preventative measures such as dental care, and prenatal care in the first trimester. While one infive Houstonians has a mental illness, state-supported mental health services are underfunded.
Good health is not just a quality of life issue. Higher incidence of disease and health risk behaviors imposeseconomic costs. These costs include medical resources to treat diseases arising from preventable conditions; employee and employer losses imposed by absenteeism and lost productivity; and, the opportunity cost of timeand money devoted to responding to preventable morbidity. For example, Centers for Disease Control (CDC)models estimate that annual smoking health care expenditures in 2011 were $97 billion and that productivity
losses associated with smoking were $96billion per year.
The most significant health problemfacing the nation and the 8-counties is therising level of obesity and its attendant personal and economic costs. A 2010 reportby McKinsey and Company estimated that theincreased spending the US is likely to incurbecause of obesity may be as much as$450 billion by 2018. (McKinsey, 2010).
Cost toindividuals
Cost topayors
Cost toemployers
Direct medical costs = -$160 billion
Total
Incremental food expenses
Estimated increased spending associated with obesity in the United States1
$ billion
Plus-size clothing
Weight-loss programs
Out-of-pocket health care costs
Medicare/Medicaid
Commercial payors
Adsenteeism
Decreased productivity
Short-term disability
Other (fuel, funeral, electricity, etc.)
90
30
20
20
60
80
30
70
30
20
450
1 Rounded estimates.2 Based on estimated cost of incremental calorie intake to maintain obese weight.3 Based on incremental costs of plus-size clothing.
Estimates of Direct and Indirect Costs of Obesity in the U.S.
The way you think, the way you behave, the way you eat, can influence
your life by thirty to fifty years. DEEPAK CHOPRA
SOURCE: MCKINSEY 2010
Figure 4

2013 HEALTHY COMMUNITIES INDICATOR REPORT CENTER FOR HOUSTON’S FUTURE The Region’s Think Tank16 17BRAZORIA � CHAMBERS � FORT BEND � GALVESTON � HARRIS � LIBERTY � MONTGOMERY � WALLER
Our region is ethnically diverse and relatively young… …with growing income inequality…
Ethnicity Across the Region Ethnicity in the Region, U.S. and Texas
Relatively youngThe Houston region is young compared to therest of the US. About 9% of the population is65 or older, compared to 13% for the US. Atthe same time, about 27% of Houston area residents are under age 18, compared to 24%of the US (U.S. Census, 2011).
Here as elsewhere, older adults are growingas a share of the population. But the elderly aregrowing relatively more slowly because of highimmigration rates and higher birth rates of the
younger population. This region has more children, a younger workforce, and fewer retirement age adults than the US. Meanwhileand in part because of its large blue-collar andimmigrant population, the region has an over-representation of persons with less thanhigh school education compared to the US. Importantly, low education attainment levelscontribute to our region and state’s high rate ofpeople without health insurance.
Growing income inequalityAccording to the US Census Bureau, Houstonranks among areas with the highest income inequality, ranking 4th behind New York City, Miami, Los Angeles and ahead of Memphis, TN. The Gini index measures this inequality, i.e. the extent to which the distribution of income within an economy deviates from a perfectly equal distribution (0 =perfect equality; 1 = perfect inequality). Houston’s Gini Coefficient is .488, rankingalongside of Chile at .499, Mexico at .469and the Dominican Republic at .484.
Texas wages have lagged the nationalaverage for decades. From 1979-2005, USmedian wages rose nearly 9%, yet medianwages in Texas grew by only 0.5%. In 2011,the state’s median wage was $15.44, whilethe US median wage was $16.57. (BLS2011). Even with a lower cost of living thanmany other parts of the country, wages in theHouston area do not enable many families theability to afford the basics. A single-parent family with two children needs an annual income of $38,184 or an hourly wage of$19.09 to cover basic expenses in the Houston
Ethnically DiverseOur region is one of the most ethnically diversein the country, often cited as an example of thedemographic make-up of the US by mid-century.The region’s population is 39% White, 36%Hispanic, 16.8% Black, and 6.7% Asian. Hispanics, Blacks and Asians are over-representedrelative to the US as a whole. Moreover, Blacksand Asians are over-represented relative totheir proportion of the Texas population.
SOURCE: CENSUS 2010 SUMMARY FILESOURCE: CENSUS 2010 SUMMARY FILE
1500 BC: Ebers Papyrus, the oldest known medical scroll, describes the circulatory system, noting the existence of blood vessels, how the heart functions, and refers to birth control, diabetes mellitus, hookworm and arthritis.
1100s: Barbers treated patients via bloodletting – a practice that lasted until the 1800s.
Figure 6
Figure 5
area, even with employer-provided health insurance and no money set aside for savingsor emergencies. If the same family must purchase its own insurance, it will need$47,088 annually or $23.54 per hour tomake ends meet. The median wage in theHouston area was $16.90, and fewer than1/3 of the jobs in the area pay enough to meet these income requirements (CPPP FamilyBudget Tool, 2013).
� White� Black� Hispanic
2013 HEALTHY COMMUNITIES INDICATOR REPORT CENTER FOR HOUSTON’S FUTURE The Region’s Think Tank18 19BRAZORIA � CHAMBERS � FORT BEND � GALVESTON � HARRIS � LIBERTY � MONTGOMERY � WALLER
…and high levels of poverty Most illness is due to chronic diseases
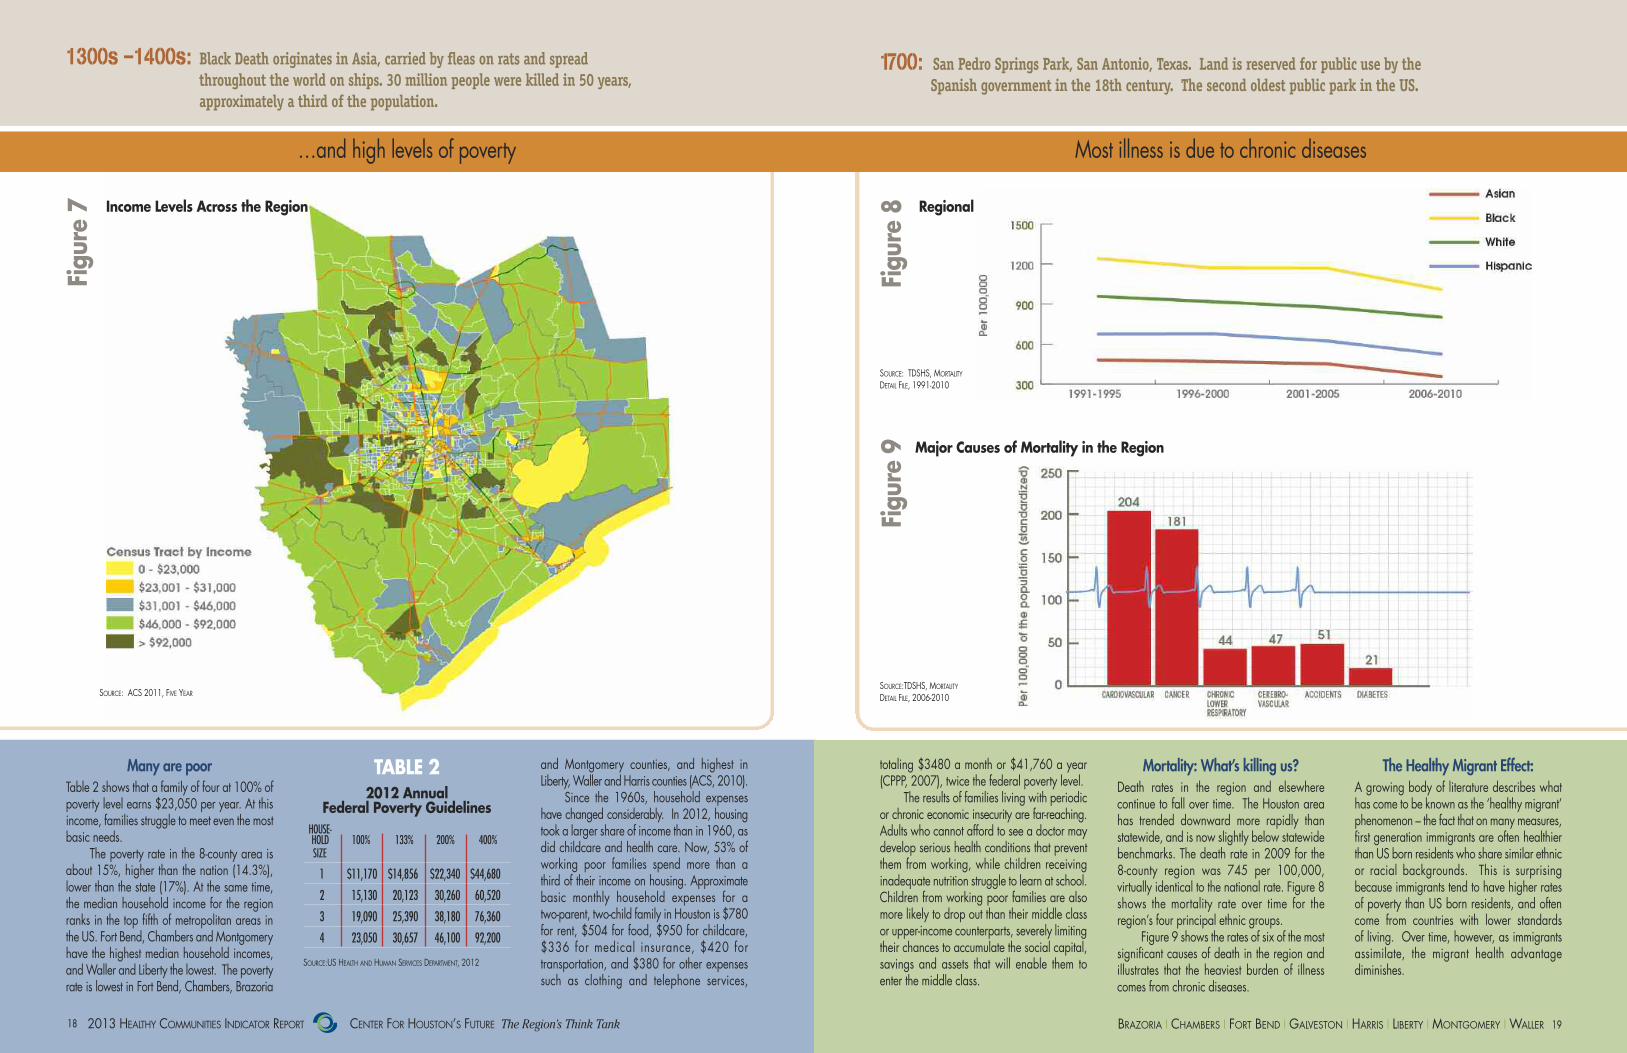
Many are poorTable 2 shows that a family of four at 100% ofpoverty level earns $23,050 per year. At thisincome, families struggle to meet even the mostbasic needs.
The poverty rate in the 8-county area isabout 15%, higher than the nation (14.3%),lower than the state (17%). At the same time,the median household income for the regionranks in the top fifth of metropolitan areas inthe US. Fort Bend, Chambers and Montgomeryhave the highest median household incomes,and Waller and Liberty the lowest. The povertyrate is lowest in Fort Bend, Chambers, Brazoria
and Montgomery counties, and highest in Liberty, Waller and Harris counties (ACS, 2010).
Since the 1960s, household expenseshave changed considerably. In 2012, housingtook a larger share of income than in 1960, asdid childcare and health care. Now, 53% ofworking poor families spend more than a third of their income on housing. Approximatebasic monthly household expenses for a two-parent, two-child family in Houston is $780for rent, $504 for food, $950 for childcare,$336 for medical insurance, $420 fortransportation, and $380 for other expensessuch as clothing and telephone services,
Mortality: What’s killing us? Death rates in the region and elsewhere continue to fall over time. The Houston areahas trended downward more rapidly thanstatewide, and is now slightly below statewidebenchmarks. The death rate in 2009 for the 8-county region was 745 per 100,000, virtually identical to the national rate. Figure 8shows the mortality rate over time for the region’s four principal ethnic groups.
Figure 9 shows the rates of six of the mostsignificant causes of death in the region and illustrates that the heaviest burden of illnesscomes from chronic diseases.
The Healthy Migrant Effect: A growing body of literature describes whathas come to be known as the ‘healthy migrant’phenomenon – the fact that on many measures,first generation immigrants are often healthierthan US born residents who share similar ethnicor racial backgrounds. This is surprising because immigrants tend to have higher ratesof poverty than US born residents, and oftencome from countries with lower standards of living. Over time, however, as immigrantsassimilate, the migrant health advantagediminishes.
Major Causes of Mortality in the Region
Regional Mortality Rates by EthnicityIncome Levels Across the Region
1300s –1400s: Black Death originates in Asia, carried by fleas on rats and spread throughout the world on ships. 30 million people were killed in 50 years, approximately a third of the population.
1700: San Pedro Springs Park, San Antonio, Texas. Land is reserved for public use by the Spanish government in the 18th century. The second oldest public park in the US.
Figure 7
Figure 8
Figure 9
totaling $3480 a month or $41,760 a year(CPPP, 2007), twice the federal poverty level.
The results of families living with periodicor chronic economic insecurity are far-reaching.Adults who cannot afford to see a doctor maydevelop serious health conditions that preventthem from working, while children receiving inadequate nutrition struggle to learn at school.Children from working poor families are alsomore likely to drop out than their middle classor upper-income counterparts, severely limitingtheir chances to accumulate the social capital,savings and assets that will enable them toenter the middle class.
SOURCE:TDSHS, MORTALITY
DETAIL FILE, 2006-2010
SOURCE: TDSHS, MORTALITY
DETAIL FILE, 1991-2010
TABLE 22012 Annual
Federal Poverty GuidelinesHOUSE-HOLD 100% 133% 200% 400%SIZE
1 $11,170 $14,856 $22,340 $44,680
2 15,130 20,123 30,260 60,520
3 19,090 25,390 38,180 76,360
4 23,050 30,657 46,100 92,200
SOURCE:US HEALTH AND HUMAN SERVICES DEPARTMENT, 2012
SOURCE: ACS 2011, FIVE YEAR

2013 HEALTHY COMMUNITIES INDICATOR REPORT CENTER FOR HOUSTON’S FUTURE The Region’s Think Tank20 21BRAZORIA � CHAMBERS � FORT BEND � GALVESTON � HARRIS � LIBERTY � MONTGOMERY � WALLER
…and costing more and moreObesity – a major factor in disease – is growing…
Figure 9: % of Adults Reporting BMI >=30
Source: Behavioral Risk Factor Surveillance System, 2011
0
10
20
30
40
50
College
Some College
High School
< High School
Asian
Hispanic
Black
White
Texas
Houston
Area
Regional Obesity Rates by Ethnicity
SOURCE: BRFSS, 2000-2010
Percentage of Region's Adults Reporting BMI ≥ 30
Factors Contributing to Obesity
SOURCE: CDC
Direct Cost of Obesity to Businesses in Texas
Obesity at Epidemic ProportionsObesity, defined as body mass index (BMI) greater than or equal to 30, is widely recognized as the nation’s most critical healthproblem because of its correlation with multiple diseases and causes of mortality, including diabetes. It is a multifactorial condition and includes genetic, lifestyle andsocio-cultural factors (Bouchard 1998). Figure10 generally shows an upward trend in the 8-county region for all ethnic groups with thepossible exception of non-Hispanic whites.
Obesity can be among the most preventableof disorders. The data show that progress isnot being made in combating this epidemic.
Regional ComparisonsIn the 8-county region, more than 1 in 4 adults,or 28% of the population, self-report BMI datathat indicates they are obese. As Figure 11shows, Hispanic and Black populations experience the highest rate of obesity. Compared to the 3 largest metro areas in theU.S., Houston has the highest obesity rate.Houston’s 10-county MSA obesity rate is29.1%, compared to Chicago at 27%, Los Angeles at 24.3% and New York at 21.9%.However, closer to home, Dallas outweighsHouston with a 33.8% obesity rate.
Contributing FactorsThere is also a strong socio-economic gradient,with higher rates of obesity among personswith lower levels of education and income. Increased obesity has also been linked to thequality of neighborhood food sources, withhigher rates of obesity in neighborhoodsserved by convenience stores and fast-food outlets (Figure 12).
Neighborhoods with limited access toparks and with physical environments that areperceived as unsafe restrain physical activityand experience increased obesity. Urbansprawl and dependency on the automobilealso increases obesity rates, a particular
challenge for cities like Houston (Bennett, Wolin& Duncan Chapter 17 in Hu, 2008).
Healthy communities are created, in part,as a result of the intersection of people and place. While obesity is multi-factorial,neighborhoods can play a huge role in mitigatingthe condition. If there are no conveniently located parks, sidewalks or bicycle paths,place is playing a negative role in obesity. If there are only fast food stores and no accessto nutritional information, place plays a significant negative role in obesity. If there areno medical clinics that residents can affordand get to easily, place plays a significantnegative role in obesity.
What is the cost of obesity? According to a 2009 estimate from the TexasComptroller and as shown in Figure 13, thetotal cost of obesity to businesses in Texas was$9.5 billion. If obesity rates continue to rise atthe same rate, the direct cost of obesity tobusinesses in the state could reach an alarming$32.5 billion in 2030 (Combs, 2011). Theseenormous expenditures on obesity required ofbusinesses, government and families meansthat the state and region will have fewer resources to spend on other priorities.
1751: America’s first hospital was founded in Philadelphia by Benjamin Franklin and Thomas Bond to care for indigent and mentally ill patients.
1800: Louis Pasteur formulates the germ theory.
In the 8-county region, more than 1 in 4 adults, or 28% of the population, self-report BMI data that indicates they are obese.
Figure 10
Figure 12
Figure 13
Figure 11
SOURCE: BRFSS, 2007-2010 ANALYTIC FILE SOURCE: TEXAS COMPTROLLER OF
PUBLIC ACCOUNTS, 2009
Billio
ns

2013 HEALTHY COMMUNITIES INDICATOR REPORT CENTER FOR HOUSTON’S FUTURE The Region’s Think Tank22 23BRAZORIA � CHAMBERS � FORT BEND � GALVESTON � HARRIS � LIBERTY � MONTGOMERY � WALLER
Diabetes rates double… …highest in Blacks and least-educated
Diabetes Doubles in 10 Years“Type 2” diabetes is a serious chronic illnessthat is affecting an increasing percentage of theregion’s population. (“Type 1” diabetes is notaddressed in this report.) Figure 13 illustratesthat the rate of “Type 2” diabetes has doubledin only 10 years time in the region. The increase in the rate of diabetes is directly correlated with the increase in obesity, not surprising considering that many of the samefactors that cause obesity also cause diabetes.Figure 14 shows the contributing factors to“Type 2” diabetes.
The reported rates of diabetes understatethe scope of the problem. While diabetes isamong the top killers in our region, it is the 7thleading cause of death in the US. Conservativeprojections show that one in four adults in thestate will be living with diagnosed diabetes in2040 (Texas Health Institute, 2010).
Percent of Population with Physician-Diagnosed Diabetes
SOURCE: TEXAS, CDC BRFSS 2007-2010
Regional Diabetes Rates, 2000-2010
1830’s: Spread by mosquitoes, yellow fever killed 12% of the Houston population. 1845: Texas’ first public hospital was opened in Galveston. In 1866, the Sisters of Charity of the Incarnate Word opened the first private hospital, also in Galveston.
Diabetes UndiagnosedAs shown in Figure 14, in the Houston region9.1% of the population has actually been diagnosed with “Type 2” diabetes. It has beenestimated that approximately one-quarter of diabetes cases are undiagnosed, so the actualprevalence in the Houston area is likely to beclose to 12% (BRFSS 2007-2010, AnalyticFile). As shown in Figure 15, Blacks and Hispanics are much more likely to have “Type2” diabetes as compared to Whites. The ratesare similar in Houston’s competitor regions.
Cost of DiabetesThe medical management of diabetes is enormously expensive for the diabetic and thehealth care system as a whole. According tothe American Diabetes Association, the totalcost in the US for diagnosed diabetes in 2011was $174 billion; direct medical costs were$116 billion and indirect costs, including disability, work loss and premature mortality,were $8 billion. The average medical expenditures among people with diagnosed diabetes were 2.3 times higher than what expenditures would be in the absence of diabetes.
In Texas, almost 3.3 million people had diabetes at a total medical and indirectsocietal cost of $29.56 billion.
The costs to patients and their families gobeyond the financial costs of treatment, to include the burden of disease managementand surveillance for complications (DiabetesReport Card, 2012). While the region is now advantaged by its relatively youthful agestructure, this will change in the future, and prevention of “Type 2” diabetes will becomeincreasingly important.
Figure 14
Figure 15
SOURCE: TEXAS BRFSS, 2000-2010

25BRAZORIA � CHAMBERS � FORT BEND � GALVESTON � HARRIS � LIBERTY � MONTGOMERY � WALLER2013 HEALTHY COMMUNITIES INDICATOR REPORT CENTER FOR HOUSTON’S FUTURE The Region’s Think Tank24
Healthy People 2020 Goal
Pregnancy Related Mortality*
Maternal Mortality Ratio**
* *Maternal Mortality
Ratio (deaths during
pregnancy or within 42 days of delivery)
*Pregnancy Related
Deaths (During or
within 1 year of pregnancy & caused
by pregnancy complications)
FIGURE 17: Maternal Mortality in Harris County, 2001-2009
2001-2003 2002-2004 2003-2005 2004-2006 2005-2007 2006-2008 2007-2009
De
ath
s p
er
10
0,0
00
liv
e b
irth
s
35
30
25
20
15
10
Healthy pregnancies create lifelong benefits Maternal mortality growing in Harris County
Early Prenatal Care by Demographic Group
SOURCE: TDSHS, NATALITY DETAIL FILE, 2009
Maternal Mortality in Harris County
SOURCE: HARRIS HEALTH SYSTEM 2012
Percent Preterm and low birthweight births for 5 MSAs, 2009
Healthy Pregnancy = Healthy Baby
Early entry to prenatal care, preterm deliveryand low birth weight newborns are importantindicators that influence the health of every person throughout their lives. When womenhave healthier pregnancies, they deliver healthierbabies. Moreover, their infants have fewerrisks for illnesses throughout their lives.
Consequences of No Prenatal CareWhile prenatal care is just one factor in maternal and infant health, it is correlated withbetter pregnancy outcomes and is a commonindicator for evaluating and predicting
pregnancy outcomes. Infants born to womenwho do not receive early prenatal care arethree times more likely to be born with a dramatically low birth weight and are fivetimes more likely to die in infancy.
Prenatal care in the first trimester is an important preventive measure to decrease pre-term births. Preterm birth (before 37 weeksgestation) is closely linked with low birth weightand is the leading cause of infant mortality. Babies born prematurely are at increased riskfor lifelong disabilities, including intellectual disabilities, cerebral palsy, breathing and respiratory problems, visual problems andhearing loss. Most at risk of having pre-term
births are Black and immigrant Hispanicwomen who are under 20 years of age.
Costs of Premature BirthsIn addition to the human cost, a premature infant incurs almost $50,000 in medical costsin its first year, compared to less than $5,000for full term infants. (March of Dimes, 2008).Hospitalization charges for newborn care inTexas were approximately $6 billion in 2009.(TDSHS, 2011). As Figures 16 and 17 show,just over half of our region’s pregnant womenobtain early prenatal care, and our rates ofpreterm deliveries and low birth weight newborns are worse than other regions. Table
3 shows that the region has among the highestpercentage of low birth weight babies amongcompetitor regions.
High Maternal MortalityThe US spends $98 billion annually onhospitalization for pregnancy and childbirth,yet the US maternal mortality rate has doubled inthe past 25 years. The US ranks 50th, alongsidethird world nations, for maternal mortality,meaning 49 countr ies were bet ter atkeeping new mothers alive (CDC, 2012).Research has shown that approximately 80%of maternal deaths could be averted if womenhad access to essential maternity and basic
health care services. (UNICEF) The women who have babies in our
region also do not fare so well. Women inHarris County have a higher risk of dying fromcomplications of pregnancy than in 49 countries in the world (WHO, 2011). Foreach woman who dies, about 50 experiencea severe complication. Black women are threetimes more likely to die of pregnancy relatedcauses than White women. The CDC’sHealthy People 2020 Goal for maternal mortality is 11.4 deaths per 100,000 livebirths. In Harris County, for 2007-2009 thematernal mortality rate was 22.8/100,000,double the goal.
MSA PRETERM LOW BIRTH WEIGHT
Houston 13.3 8.8Chicago 12.6 8.6NY 12.5 8.3Dallas 12 8.1LA 10.6 7.1
1850: Accident insurance was first offered in the United States by the Franklin Health Assurance Company of Massachusetts and covered injuries arising from railroad and steamboat accidents.
1853: The first school lunch program was initiated by the Children’s Aid Society of New York City.
Figure 16
Figure 17
TABLE 3
SOURCE: CDC NATIONAL VITAL STATISTICS SYSTEM

27BRAZORIA � CHAMBERS � FORT BEND � GALVESTON � HARRIS � LIBERTY � MONTGOMERY � WALLER2013 HEALTHY COMMUNITIES INDICATOR REPORT CENTER FOR HOUSTON’S FUTURE The Region’s Think Tank26
Behaviors Impact HealthChronic diseases can be viewed as diseasesrelated to behavior. Just three behaviors accountfor the majority of the chronic disease burden:tobacco smoking, diet, and physical inactivity.
Figure 18 shows the relationship betweenethnicity and education levels and behaviorsthat impact health status in the region. Clearlythe most critical factor to improving health behaviors is a quality education for all area residents. (CHF, 2012 Community Indicator Report)
Education EffectThe data show that the more education a person has, the less likely he is to engage inunhealthy behaviors. The most pronounced difference is with respect to smoking: those witha college degree are less than half as likely tosmoke as those without a college degree. Thedisconcerting message from this data is howpoorly most groups do on most measures.
A majority of adults in the region do not meet guidelines for physical activity and a large majority does not meet guidelines for fruit and vegetable consumption.
Socio-economic FactorsDecisions about whether to smoke, exercise oreat healthy foods are not purely ones of personal choice. Factors that affect choice arestrongly shaped by socio-economic situations.A person’s physical environment, neighborhoodand ability to access recreational and freshfood sources can severely limit one’s ability toavoid health hazards. Limited income, leisuretime and transportation options also constrain.It is important to keep these factors in mindwhen assessing health risks shaped by behaviorsand designing interventions to reduce risks.
Regional Health Risk Behaviors by Education Regional Poor Mental Health Days per Month
Mental Health, A Complex IssueOne of every five Houstonians (665,000) has amental illness. (UT School of Public Health, 2009)Mental illness is described as “mental disordersthat negatively affect one’s performance as a familymember, a student, an employee and an employer”and is the most stigmatized medical condition.
The rate of mental illness can be measuredby the number of self-reported “poor mental healthdays”(CDC). Figure 19 shows the average rate ofpoor mental health days for the region at 3.9days/month, which compares unfavorably withstate (3.3 days) and national (2.3 days) figures.These rates can be affected by lack of access tomental health.
Cost of Mental IllnessHouston loses more than $5.6 billion/year inproductivity and annual earnings from severemental illness. In 2009, depression accountedfor a loss of $1.29 billion due to work absences.Schizophrenia added $1 billion, with thecombined losses from bipolar and severe anxiety disorders totaling an estimated $3.1 billion (UT School of Public Health, 2009).
Insufficient Funding and FacilitiesA formidable barrier to mental health care in Houston is the substantial underfunding of the state-supported mental health services. Inadequate access to mental health services
2006 to 2010
2000 to 2005Texas
Chambers,
Liberty, Waller
Montgomery
HarrisGalveston
Fort Bend
Brazoria
HGB 8 County Region
FIGURE 19: Regional Poor Mental Health Days per Month
PERC
ENT
6
5
4
3
2
1
0
Behaviors impact health Mental health services lacking
u Cigarette smoking accounts for about 443,000 deaths; 1of every 5 US deaths/year.
u More deaths are due each year to tobacco use than by all deaths from HIV, illegal drug use, alcohol use, motor vehicle injuries, suicides, and murders combined.
u Smoking causes almost 90% of lung cancer deaths in men; 80%, in women
1800: Dr. E.B. Ramsey became the first Black physician to practice in Houston. 1830s: Ernst von Bergmann introduced heat sterilization of surgical instruments, marking the beginning of aseptic surgery.
often results in the mentally ill falling into a cycle of crisis care. In 2009 it was estimatedthat 2,500 people in the Harris County Jail (out of roughly 9,500 detainees) were receiving psychiatric care (UT School of PublicHealth, 2009).
Another barrier is the lack of psychiatricbeds. National statistics recommend 70 inpatientbeds/100,000 people; however, a minimum of50 public beds/100,000 is needed. Houstonfalls short of both standards, with about 23 totalbeds/100,000 and 7 public beds/ 100,000(MHA Texas; UT School of Public Health, 2009).
TEXAS RANKS 49TH IN STATE PER CAPITA FUNDING FOR MENTAL HEALTH AND HARRIS COUNTY RANKS AMONG THE LOWEST IN TEXAS.
Figure 18
Figure 19
SOURCE: TEXAS BRFSS, 2000-2010
SOURCE: BRFSS, 2007-2010 ANALYTIC FILE
�� ��
�� ��
� �� �

SOURCE: TEXAS BRFSS, 2007-2010 ANALYTIC FILE
Dental CareApproximately 3 million Texans do not obtainappropriate dental care due to barriersincluding affordability and dental providershortages.
Oral health is an essential component ofoverall health. (HRSA, June 2012; Kaiser Family Foundation, June 2012). As shown inFigure 20, there are significant disparitiesamong populations with regard to obtaining
TABLE 12 Dental visits
within one year by region
1887: Houston’s St. Joseph's Infirmary was founded by the Sisters of Charity of the Incarnate Word.
Percent Receiving Dental Care by Ethnicity, Age, Education and Income
appropriate dental care. Whites and those withhigher education and income levels are themost likely to report having accessed dentalcare within the past year. Children were theleast likely age group to have accessed dental care. Notwithstanding this lacklusterperformance, the region as a whole compares favorably with other competitor regions (Table 12).
Dental care important for overall health
Figure 14
Houston Chicago Dallas LA NYC
35.5 30 40.9 34.9 27.4
SOURCE: CDC, BRFSS, 2010
292013 HEALTHY COMMUNITIES INDICATOR REPORT CENTER FOR HOUSTON’S FUTURE The Region’s Think Tank28
El Centro de CorazonIn April 2011, El Centro deCorazón, a Federally QualifiedHealth Center in Houston, begana collaborative partnership withthe Mental Health/Mental Retar-dation Authority of Harris County (MHMRA), a major public mental health provider to addressthe great challenge that psychiatric patients may face in getting routine primary care.
Major barriers for psychiatric patients include homelessness, problems obtaining medications, and issues related to transportation to appointments, essentials for managing their illness. So, MHMRA providedspace for El Centro to establish a small primary care practice within an MHMRA facility. This arrangement allows patients with a psychiatric illness to coordinate their primary care visits with their trips to the psychiatrist, all in one facility. Moreover, itfacilitates coordination and discussion of patient care between the two physicians.
El Centro’s clinic is staffed by a family physician and provides services to adults and children. Mental health patients aregiven a broad range of primary care opportunities, including pap smears. As a result of more opportunity for primary care, nearly80% of female patients obtained cervical cancer screening.
Similar benefits accrued. During the first year of operation data indicate that more than 81% of patients being treated forhypertension reached goal by their second primary care visit and that more than 95% showed significant improvement. Diabeticpatients were analogous with 97% showing improvement by their second visit. Social workers within MHMRA work closely withthe El Centro primary care provider to overcome obstacles and coordinate care. Psychiatric patients are benefiting greatly.
Legacy Community Health ServicesFrom five main locations in the greater Houston area, Legacy Community Health Services addresses the healthcare needsof the uninsured and underinsured. Legacy’s goal is to provide high-quality, compassionate healthcare to all membersof the community in a non-judgmental, culturally-sensitive manner regardless of their ability to pay. As a FQHC, Legacyprovides essential preventive and primary healthcare services at low or no cost.
In its most recent fiscal year, Legacy treated nearly 45,000 patients through 145,041 office visits. In many cases,these patients would have nowhere else to turn if Legacy did not provide them with essential health services.
Legacy’s started its story in Houston more than 30 years ago when, as the Montrose Clinic, it provided testing and support services to people living with AIDS. In 1988, Legacy began providing comprehensive primary healthcareservices to those living with HIV/AIDS, and has since become a nationally recognized leader in HIV/AIDS preventionand treatment. Approximately 25 percent of HIV positiveAmericans are underinsured, of whom about 18.5% areuninsured. Legacy serves as the healthcare home for manyof these disadvantaged individuals.
From Next Step—its educational program designedfor newly diagnosed patients facing a scary and confusingtime—to its primary care and medication services, Legacyoffers the full spectrum of care that today’s HIV positive patient requires.
BRAZORIA � CHAMBERS � FORT BEND � GALVESTON � HARRIS � LIBERTY � MONTGOMERY � WALLER
Best Practices

2013 HEALTHY COMMUNITIES INDICATOR REPORT CENTER FOR HOUSTON’S FUTURE The Region’s Think Tank 31BRAZORIA � CHAMBERS � FORT BEND � GALVESTON � HARRIS � LIBERTY � MONTGOMERY � WALLER30
The previous section of this report contained a variety of statistics relating to the region’s population and its health status indicators. These statistics, like the people they represent, do not exist in a vacuum; they live in particular places that influence health.The demographic factors and behavioral variations apparent in the health data are driven in part by the environment in which people live. This section explains the region’s many environmental factors—from clean air to concentrated poverty to green spaceto fresh food sources—that impact community health.
Concentrated poverty is an overarching concern in the region because it is increasing over time and is associated with significantly higher mortality rates for many diseases. The burdens faced by people living in neighborhoods with high concentrations of poverty include lack of access to green space and grocery stores and overexposure to pollution. These factorslimit the residents’ ability to engage in healthy behaviors like exercise and healthy eating, which adversely impacts their health. Recent efforts to establish community gardens in lower income neighborhoods show promise. To improve population health, manyenvironmental factors interact to promote or work against better health.
In addition to concentrated poverty, indicators of place include the associated risk of mortality byconcentration of poverty, LEED buildings, 8-hour Ozone, fine particulate pollution (PM 2.5), Diesel Particulate Matter near schools, biking and walking as a transportation mode, and access to supermarkets.The good news is that the number of LEED buildings has risen quickly. As well, in the last decade workers are commuting by bike or foot in much greater proportions. Air quality is a mixed story. Clearlygreat strides have been made in improving air quality, yet new standards for both ozone and PM2.5 meanthat compliance with national standards is still elusive. Further, concentrations of diesel particulate matterpose a major concern, especially given that offices, shopping areas and schools are close to major roadways where people are subject to unhealthy air. In terms of access to healthy food, Houston hasfewer supermarkets per capita than most of the nation’s large metropolitan areas.
Healthy places are those designed and built to improve the quality of life for all people who live, work,
worship, learn, and play within their borders – where every person is free to make choices amid a variety of healthy,
available, accessible and affordable options.CENTER FOR DISEASE CONTROL AND PREVENTION
PLACE
2013 HEALTHY COMMUNITIES INDICATOR REPORT CENTER FOR HOUSTON’S FUTURE The Region’s Think Tank32 33BRAZORIA � CHAMBERS � FORT BEND � GALVESTON � HARRIS � LIBERTY � MONTGOMERY � WALLER
Concentrated poverty affects health… …and mortality
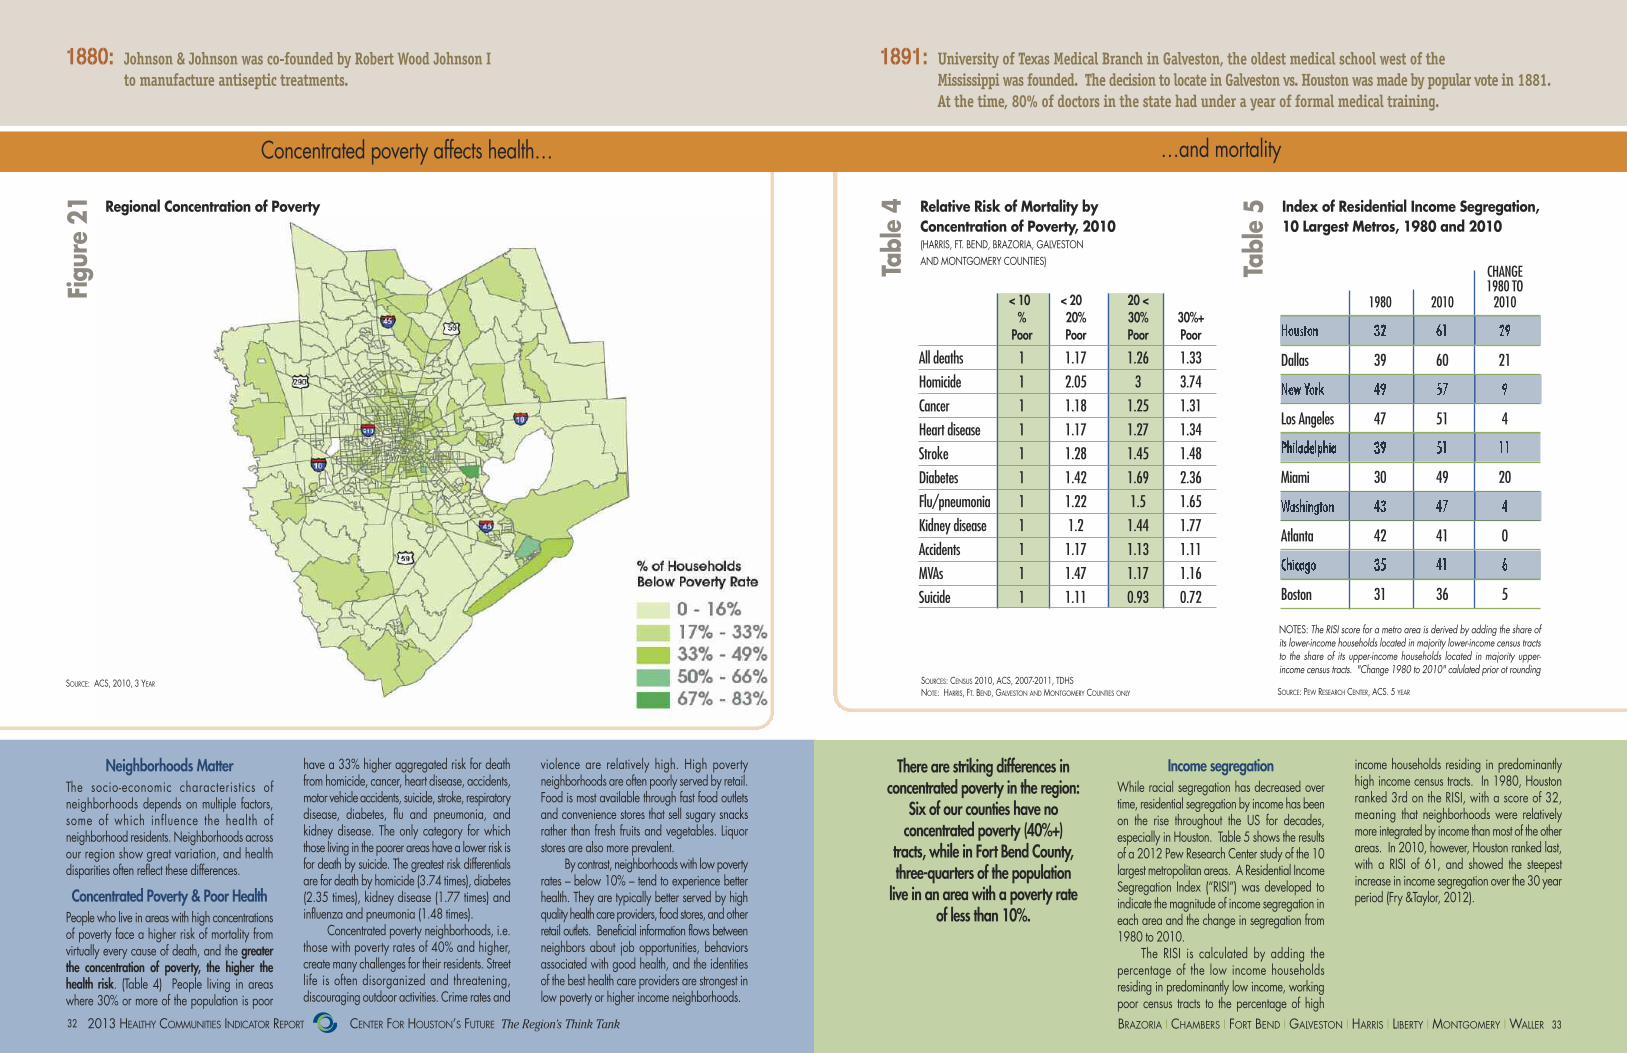
have a 33% higher aggregated risk for deathfrom homicide, cancer, heart disease, accidents,motor vehicle accidents, suicide, stroke, respiratorydisease, diabetes, flu and pneumonia, and kidney disease. The only category for whichthose living in the poorer areas have a lower risk isfor death by suicide. The greatest risk differentialsare for death by homicide (3.74 times), diabetes(2.35 times), kidney disease (1.77 times) and influenza and pneumonia (1.48 times).
Concentrated poverty neighborhoods, i.e.those with poverty rates of 40% and higher, create many challenges for their residents. Streetlife is often disorganized and threatening, discouraging outdoor activities. Crime rates and
Regional Concentration of Poverty Relative Risk of Mortality by Concentration of Poverty, 2010 (HARRIS, FT. BEND, BRAZORIA, GALVESTON AND MONTGOMERY COUNTIES)
Index of Residential Income Segregation, 10 Largest Metros, 1980 and 2010
Neighborhoods MatterThe socio-economic characteristics of neighborhoods depends on multiple factors,some of which influence the health of neighborhood residents. Neighborhoods acrossour region show great variation, and health disparities often reflect these differences.
Concentrated Poverty & Poor HealthPeople who live in areas with high concentrationsof poverty face a higher risk of mortality from virtually every cause of death, and the greaterthe concentration of poverty, the higher thehealth risk. (Table 4) People living in areaswhere 30% or more of the population is poor
There are striking differences in concentrated poverty in the region:
Six of our counties have no concentrated poverty (40%+)
tracts, while in Fort Bend County,three-quarters of the population live in an area with a poverty rate
of less than 10%.
violence are relatively high. High poverty neighborhoods are often poorly served by retail.Food is most available through fast food outletsand convenience stores that sell sugary snacksrather than fresh fruits and vegetables. Liquorstores are also more prevalent.
By contrast, neighborhoods with low povertyrates – below 10% – tend to experience betterhealth. They are typically better served by highquality health care providers, food stores, andotherretail outlets. Beneficial information flows betweenneighbors about job opportunities, behaviors associated with good health, and the identitiesof the best health care providers are strongest inlow poverty or higher income neighborhoods.
Income segregationWhile racial segregation has decreased overtime, residential segregation by income has beenon the rise throughout the US for decades, especially in Houston. Table 5 shows the resultsof a 2012 Pew Research Center study of the 10largest metropolitan areas. A Residential IncomeSegregation Index (“RISI”) was developed to indicate the magnitude of income segregation ineach area and the change in segregation from1980 to 2010.
The RISI is calculated by adding the percentage of the low income households residing in predominantly low income, workingpoor census tracts to the percentage of high
income households residing in predominantlyhigh income census tracts. In 1980, Houstonranked 3rd on the RISI, with a score of 32,meaning that neighborhoods were relativelymore integrated by income than most of the otherareas. In 2010, however, Houston ranked last,with a RISI of 61, and showed the steepest increase in income segregation over the 30 yearperiod (Fry &Taylor, 2012).
SOURCES: CENSUS 2010, ACS, 2007-2011, TDHSNOTE: HARRIS, FT. BEND, GALVESTON AND MONTGOMERY COUNTIES ONLY SOURCE: PEW RESEARCH CENTER, ACS. 5 YEAR
1880: Johnson & Johnson was co-founded by Robert Wood Johnson I to manufacture antiseptic treatments.
1891: University of Texas Medical Branch in Galveston, the oldest medical school west of the Mississippi was founded. The decision to locate in Galveston vs. Houston was made by popular vote in 1881. At the time, 80% of doctors in the state had under a year of formal medical training.
Figure 21
Table 4
Table 5
< 10 < 20 20 < % 20% 30% 30%+Poor Poor Poor Poor
All deaths 1 1.17 1.26 1.33
Homicide 1 2.05 3 3.74
Cancer 1 1.18 1.25 1.31
Heart disease 1 1.17 1.27 1.34
Stroke 1 1.28 1.45 1.48
Diabetes 1 1.42 1.69 2.36
Flu/pneumonia 1 1.22 1.5 1.65
Kidney disease 1 1.2 1.44 1.77
Accidents 1 1.17 1.13 1.11
MVAs 1 1.47 1.17 1.16
Suicide 1 1.11 0.93 0.72
SOURCE: ACS, 2010, 3 YEAR
CHANGE1980 TO
1980 2010 2010
Houston 32 61 29
Dallas 39 60 21
New York 49 57 9
Los Angeles 47 51 4
Philadelphia 39 51 11
Miami 30 49 20
Washington 43 47 4
Atlanta 42 41 0
Chicago 35 41 6
Boston 31 36 5
NOTES: The RISI score for a metro area is derived by adding the share ofits lower-income households located in majority lower-income census tractsto the share of its upper-income households located in majority upper-income census tracts. "Change 1980 to 2010" calulated prior ot rounding

2013 HEALTHY COMMUNITIES INDICATOR REPORT CENTER FOR HOUSTON’S FUTURE The Region’s Think Tank34 35BRAZORIA � CHAMBERS � FORT BEND � GALVESTON � HARRIS � LIBERTY � MONTGOMERY � WALLER
Elements of a Healthy Home
Good housing – an essential element for good health Houston LEEDs in schools, offices and homes
Result of Unhealthy HomeAsthma can be the result of an unhealthy home.Nearly 25 million US residents suffer withchronic asthma at an annual cost of $18 billion/year, $10 billion of which is directcosts. Asthma, the most common chronic condition among children, ranks number threefor hospitalizations and is the leading cause ofschool absences. Asthma accounts for one-quarter of child emergency room visits inthe US each year. For adults, asthma is the 4thleading cause of absenteeism, costing employers nearly $3 billion (Asthma and Allergy Foundation of America, 2012).
Social & Economic ConditionsA direct causal relationship between wherepeople live and good or poor health is open to question, but studies have shown how neighborhood conditions and residents’ healthare closely interrelated (Pickett and Pearl,2001). The socio-economic characteristics ofindividuals and neighborhood socio-economiccontext interact with aspects of the built environment to influence health outcomes.
Direct neighborhood health effects mayexist where there is harmful pollution, noise,poverty and crime causing chronic stress andculminating in higher incidences of depression,mental distress and even heart disease (Diez
Roux et al., 2001). The US Atherosclerosis Riskin Communities study found that living indisadvantaged neighborhoods resulted in a70%-90% higher risk of coronary heart diseasefor Whites and a 30%-50% higher risk for Blacks than living in advantaged neighborhoods.
Even though neighborhoods and the builtenvironment do not cause health problems, evidence suggests that place affects behaviorssuch as smoking, poor diet and low levels ofphysical exercise (Diez Roux et al., 2001; Sallis & Glanz, 2006).
LEED Certified Projects in the Region
LEED Certified and Pending Projects
LEED Makes a DifferenceFigure 23 shows the location of Leadership inEnergy and Environmental Design (LEED) projects across the region while Figure 24shows the robust rise in the number of LEEDcertified buildings. In only a short time, this region is among the leaders in LEED buildingdesign and construction.
Increased ProductivityFor non-residential structures, the US GreenBuilding Council, through its educationalvenues and LEED protocols, has assumed amajor role in improving the health of the buildings’inhabitants (USGBC, 2012). Researchers from
Michigan State University found that occupantsof LEED-certified buildings missed fewer workdays due to depression, asthma and allergiesand improved productivity by 2.16%, an increase of 39 hours/year (Singh & Syal, 2009).
Not only are LEED buildings important forthe environment and health, they also makegood business sense. LEED buildings increasea building’s value by 7.5%, decrease total operating cost by 8%-9%, increase occupancyrates by 3.5%, and increase rental rates by 3%(USGBC).
Growing NumbersAs of October 2012, there were approximately
580 commercial, governmental, academic andnonprofit LEED registered or certified projectsin our region, and approximately 375 residential LEED projects. Indeed, Houston hasmore LEED-certified projects per capita thanany other city in the U.S. except Los Angeles.
The Houston Independent School Districthas the second largest number of LEED registered schools in the US; 10 schools haveLEED certification with an additional 20 inprocess. These schools use less water and energy, and place a priority on natural lightingand feature green roofs, outdoor learning laboratories and rainwater capture.
1900: Houston Mayor Sam Brashear bought the Kellum-Noble land and house on the edge of town to create Sam Houston Park.
1901: Emil von Behring, a German, was awarded the first Nobel Prize in Physiology or Medicine for his work on serum therapy, particularly for its use in treatment diphtheria.
250
200
150
100
50
01 i
n 20
05
3 in
2006
36 in 2009
65 in 2010
58 in 2011
12 in 20081 in
2004
49 in 2012
7 in
2007
2004 2005 2006 2007 2008 2009 2010 2011 2012
Tota
l LEE
D C
ert
ifie
d P
roje
cts
� �Hidden things that make your home unhealthy
People spend 90% of their time indoors, surrounded by the following harmful substances
and sources of chemical fumes:
CIGARETTES
FIREPLACES
DEODORIZERS
DRY CLEANING
FLOOR WAXES
HIGH VOC PAINT
LEAD FROM PRE-1978 PAINTGAS STOVES
MOLD
COCKROACHES/DUST MITESPESTICIDES
Figure 23
Figure 24
Figure 22
SOURCE: USGBC 2012
��
SOURCE: USGBC, 2012 SOURCE: NATIONAL CENTER FOR HEALTHY HOUSING

2013 HEALTHY COMMUNITIES INDICATOR REPORT CENTER FOR HOUSTON’S FUTURE The Region’s Think Tank36 37BRAZORIA � CHAMBERS � FORT BEND � GALVESTON � HARRIS � LIBERTY � MONTGOMERY � WALLER
Air quality – getting better, but a long way to go Particulates pose health risks
3-Year Average of Annual 4th Highest Daily Max 8-HR Ozone, Houston Monitors
PM2.5 Levels at Clinton Drive
SOURCE: TCEQ MONITOR POINT STATION 2011
Roadway Traffic Counts, Diesel Particulate Levels, and Schools near Highways
Costs of clean airClean air is important for health and the economy.The total economic benefit of attaining the federal ozone and particulate matter standardsin the Houston area is estimated to be valued atapproximately $3 billion annually (Lurmann,1999). The contribution of environmental pollutants to the incidence, prevalence, mortality,and costs of asthma, lead poisoning, cancer andneurobehavioral disorders in American childrenhave been found to total approximately $54.9 billion, 2.8% of total U.S. health cost(Landrigan, 2002).
OzoneTThe region’s long-standing struggle to controlair pollution, particularly combustion-generatedpollution, while maintaining economic growthis a familiar story. The region has achievedtremendous improvements in ozone levels, butnow, scientific evidence has indicated that thestandards may not be sufficiently protective of public health. As a result, the EPA has developed even stricter standards. Thus, thisregion must develop new or more rigorousways to decrease pollutants even further.
Figure 25 shows regional ozone levelsand standards over 15 years and illustrates theprogress that has been made.
PM2.5 While ozone has received the most attention,studies consistently find that higher morbidityand mortality are associated with particle pollution, especially particles smaller than 2.5microns in diameter (PM2.5). These tiny particles,less than 1/7th the average width of a humanhair, lodge deeply into the lungs. They are theresult of all types of combustion, includingmotor vehicles, power plants, wood burning, etc.
Figure 26 shows the region hoveringclose to the federal standard of 15mg/m3 formany years. However, in December 2012, thestandard was reduced to 12 mg/m3 effectivein or after 2014. Harris County is one of 66
counties across the country that does not meetthe new standard but is expected to be in compliance later in the decade (EPA, 2012).Regardless of the standard, health studies consistently have found no acceptable thresholdfor PM2.5-related health effects. A recent studypublished by Rice University examined datafrom Houston’s Emergency Medical Service toassess the relationship between fine particulatelevels and heart attacks based on actual cardiac arrest cases in Houston. The studyshowed an increased risk of 2% to 9% in heartattacks due to an increase in fine particulatelevels on the day of, or day before, the heartattack (Raun & Ensor, 2012).
Diesel Particulate MatterIt is highest in areas of concentrated emissions,such as near manufacturing centers, ports, rail yards, freeways and distribution centers;thus it disproportionately affects industrial communities and populations near freeways.The spatial distribution of DPM across the eightcounties is shown in Figure 27.
Roadway pollution, including tailpipe exhaust, vapor from leaking fluids, heat, contaminated water, tire and concrete particles, copper and asbestos from brakes,and noise, is also associated with multiple adverse health effects. Proximity to majorroadways has been associated with adverse
health effects even carrying as few as 20,000vehicles/day. Figure 27 illustrates that manyof our region’s roadways carry more than125,000 vehicles/day. While most guidelinessay that schools should be at least 500 feetfrom a major roadway, 46 school campuses inthe region do not meet this guideline.
1903: Marie Curie was the first woman to win the Noble Prize for her study of radiation, which led to the invention of the x-ray.
1905: The Texas Dental College, founded in Houston, was the first dental school in the state.Figure 25
Figure 26
Figure 27
SOURCE: TCEQ 2012. GRAPHIC BY DR. LAURACAMPOS AND DR. LOREN RAUN, RICE UNIVERSITY
SOURCE: U.S. EPA AIR TOXICS ASSESSMENT, 2005; SCHOOL POINT DATA AND PARCEL DATA: H-GAC
2013 HEALTHY COMMUNITIES INDICATOR REPORT CENTER FOR HOUSTON’S FUTURE The Region’s Think Tank38 39BRAZORIA � CHAMBERS � FORT BEND � GALVESTON � HARRIS � LIBERTY � MONTGOMERY � WALLER
Biking and walking contribute to health and environment Green space enables exercise and healthy behaviors
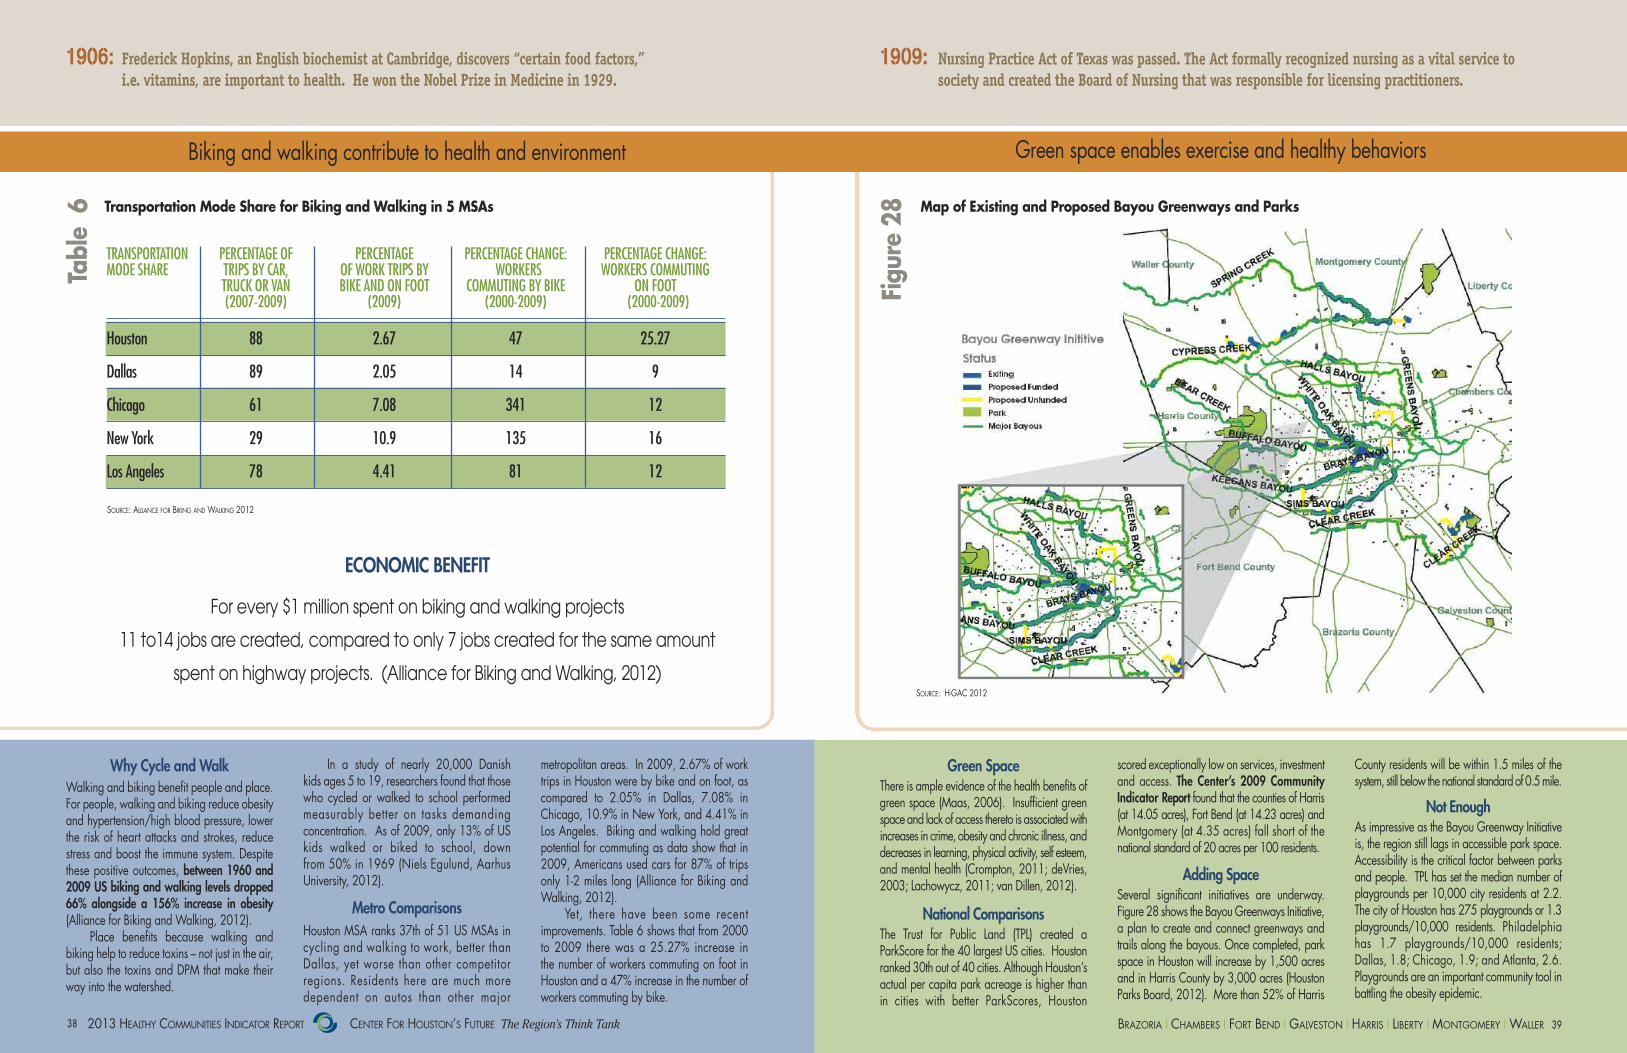
Why Cycle and WalkWalking and biking benefit people and place.For people, walking and biking reduce obesityand hypertension/high blood pressure, lowerthe risk of heart attacks and strokes, reducestress and boost the immune system. Despitethese positive outcomes, between 1960 and2009 US biking and walking levels dropped66% alongside a 156% increase in obesity(Alliance for Biking and Walking, 2012).
Place benefits because walking and biking help to reduce toxins – not just in the air,but also the toxins and DPM that make theirway into the watershed.
In a study of nearly 20,000 Danish kids ages 5 to 19, researchers found that thosewho cycled or walked to school performedmeasurably better on tasks demanding concentration. As of 2009, only 13% of USkids walked or biked to school, down from 50% in 1969 (Niels Egulund, AarhusUniversity, 2012).
Metro ComparisonsHouston MSA ranks 37th of 51 US MSAs in cycling and walking to work, better than Dallas, yet worse than other competitor regions. Residents here are much more dependent on autos than other major
metropolitan areas. In 2009, 2.67% of worktrips in Houston were by bike and on foot, ascompared to 2.05% in Dallas, 7.08% inChicago, 10.9% in New York, and 4.41% inLos Angeles. Biking and walking hold greatpotential for commuting as data show that in2009, Americans used cars for 87% of tripsonly 1-2 miles long (Alliance for Biking andWalking, 2012).
Yet, there have been some recent improvements. Table 6 shows that from 2000to 2009 there was a 25.27% increase in the number of workers commuting on foot inHouston and a 47% increase in the number ofworkers commuting by bike.
scored exceptionally low on services, investment and access. The Center’s 2009 Community Indicator Report found that the counties of Harris(at 14.05 acres), Fort Bend (at 14.23 acres) andMontgomery (at 4.35 acres) fall short of the national standard of 20 acres per 100 residents.
Adding SpaceSeveral significant initiatives are underway. Figure 28 shows the Bayou Greenways Initiative,a plan to create and connect greenways andtrails along the bayous. Once completed, parkspace in Houston will increase by 1,500 acresand in Harris County by 3,000 acres (HoustonParks Board, 2012). More than 52% of Harris
Green SpaceThere is ample evidence of the health benefits ofgreen space (Maas, 2006). Insufficient greenspace and lack of access thereto is associated withincreases in crime, obesity and chronic illness, anddecreases in learning, physical activity, self esteem,and mental health (Crompton, 2011; deVries,2003; Lachowycz, 2011; van Dillen, 2012).
National ComparisonsThe Trust for Public Land (TPL) created aParkScore for the 40 largest US cities. Houstonranked 30th out of 40 cities. Although Houston’sactual per capita park acreage is higher than in cities with better ParkScores, Houston
County residents will be within 1.5 miles of thesystem, still below the national standard of 0.5 mile.
Not EnoughAs impressive as the Bayou Greenway Initiativeis, the region still lags in accessible park space. Accessibility is the critical factor between parksand people. TPL has set the median number ofplaygrounds per 10,000 city residents at 2.2.The city of Houston has 275 playgrounds or 1.3playgrounds/10,000 residents. Philadelphia has 1.7 playgrounds/10,000 residents; Dallas, 1.8; Chicago, 1.9; and Atlanta, 2.6. Playgrounds are an important community tool inbattling the obesity epidemic.
ECONOMIC BENEFIT
For every $1 million spent on biking and walking projects
11 to14 jobs are created, compared to only 7 jobs created for the same amount
spent on highway projects. (Alliance for Biking and Walking, 2012)
TRANSPORTATION PERCENTAGE OF PERCENTAGE PERCENTAGE CHANGE: PERCENTAGE CHANGE:MODE SHARE TRIPS BY CAR, OF WORK TRIPS BY WORKERS WORKERS COMMUTING
TRUCK OR VAN BIKE AND ON FOOT COMMUTING BY BIKE ON FOOT (2007-2009) (2009) (2000-2009) (2000-2009)
Houston 88 2.67 47 25.27
Dallas 89 2.05 14 9
Chicago 61 7.08 341 12
New York 29 10.9 135 16
Los Angeles 78 4.41 81 12
Transportation Mode Share for Biking and Walking in 5 MSAs
SOURCE: ALLIANCE FOR BIKING AND WALKING 2012
1906: Frederick Hopkins, an English biochemist at Cambridge, discovers “certain food factors,” i.e. vitamins, are important to health. He won the Nobel Prize in Medicine in 1929.
1909: Nursing Practice Act of Texas was passed. The Act formally recognized nursing as a vital service to society and created the Board of Nursing that was responsible for licensing practitioners.
Map of Existing and Proposed Bayou Greenways and Parks
Table 6
Figure 28
SOURCE: H-GAC 2012

41BRAZORIA � CHAMBERS � FORT BEND � GALVESTON � HARRIS � LIBERTY � MONTGOMERY � WALLER2013 HEALTHY COMMUNITIES INDICATOR REPORT CENTER FOR HOUSTON’S FUTURE The Region’s Think Tank40
Access to healthy food – a must for healthy life
Access to Healthy FoodsAccess to healthy food enables people to maintaina healthy diet and reduce the risk of diet- andobesity-related disease including diabetes, hypertension, cardiovascular disease and somecancers. Studies show that fresh fruit and vegetableconsumption increases by as much as 32% foreach additional supermarket in a community.A shortage of supermarkets and lack of accessto higher quality, more nutritious foods are amongthe many contributing causes of obesity.
Comparisons to Other MSAsAccording to a 2010 study conducted by TheFood Trust, Houston has fewer supermarkets
per capita than most of the nation’s large metropolitan areas. Nationally, there are11.6 supermarkets per 100,000 people. TheHouston average is 8.2. Texas has the lowestnumber of supermarkets per capita of anystate, 8.8 per 100,000 people (Manon,Giang, & Treering, 2011).
Food DesertsIn addition to having too few supermarkets inthe Houston area, the existing supermarketsare unevenly distributed. Residents are morelikely to choose healthy behaviors in areaswhere fresh food is available. As Figure 29shows, low income areas of the city that have
high rates of diet-related deaths are underserved. Working poor zip codes have25% fewer supermarkets per capita than middle-income zip codes. As a result, manypeople in these underserved communities resort to buying food from convenience stores where the selection is limited and notparticularly healthy.
Community gardens and farmers marketscan also provide convenient access to freshfruits and vegetables and other healthy foods.Recently Houston committed 10 acres of landfor a community garden in Sunnyside, a low income neighborhood, and created 8 community gardens in neighborhood parks.
1914: George H. Hermann, who made his fortune from the Humble Oil Field, commissioned the construction of Herman Park so Houstonians would have a place “to breathe.” His will also provided for the construction, maintenance and operation of Hermann Hospital, which was one of the largest nonprofit, secular, private hospitals in the country.
Low Income Areas with High Risk of Diet-Related Disease and Limited Supermarkets/Capita
Figure29
SOURCE: THE FOOD TRUST 2011
Note: Red=low incomepopulations with highrates of diet-related
deaths.
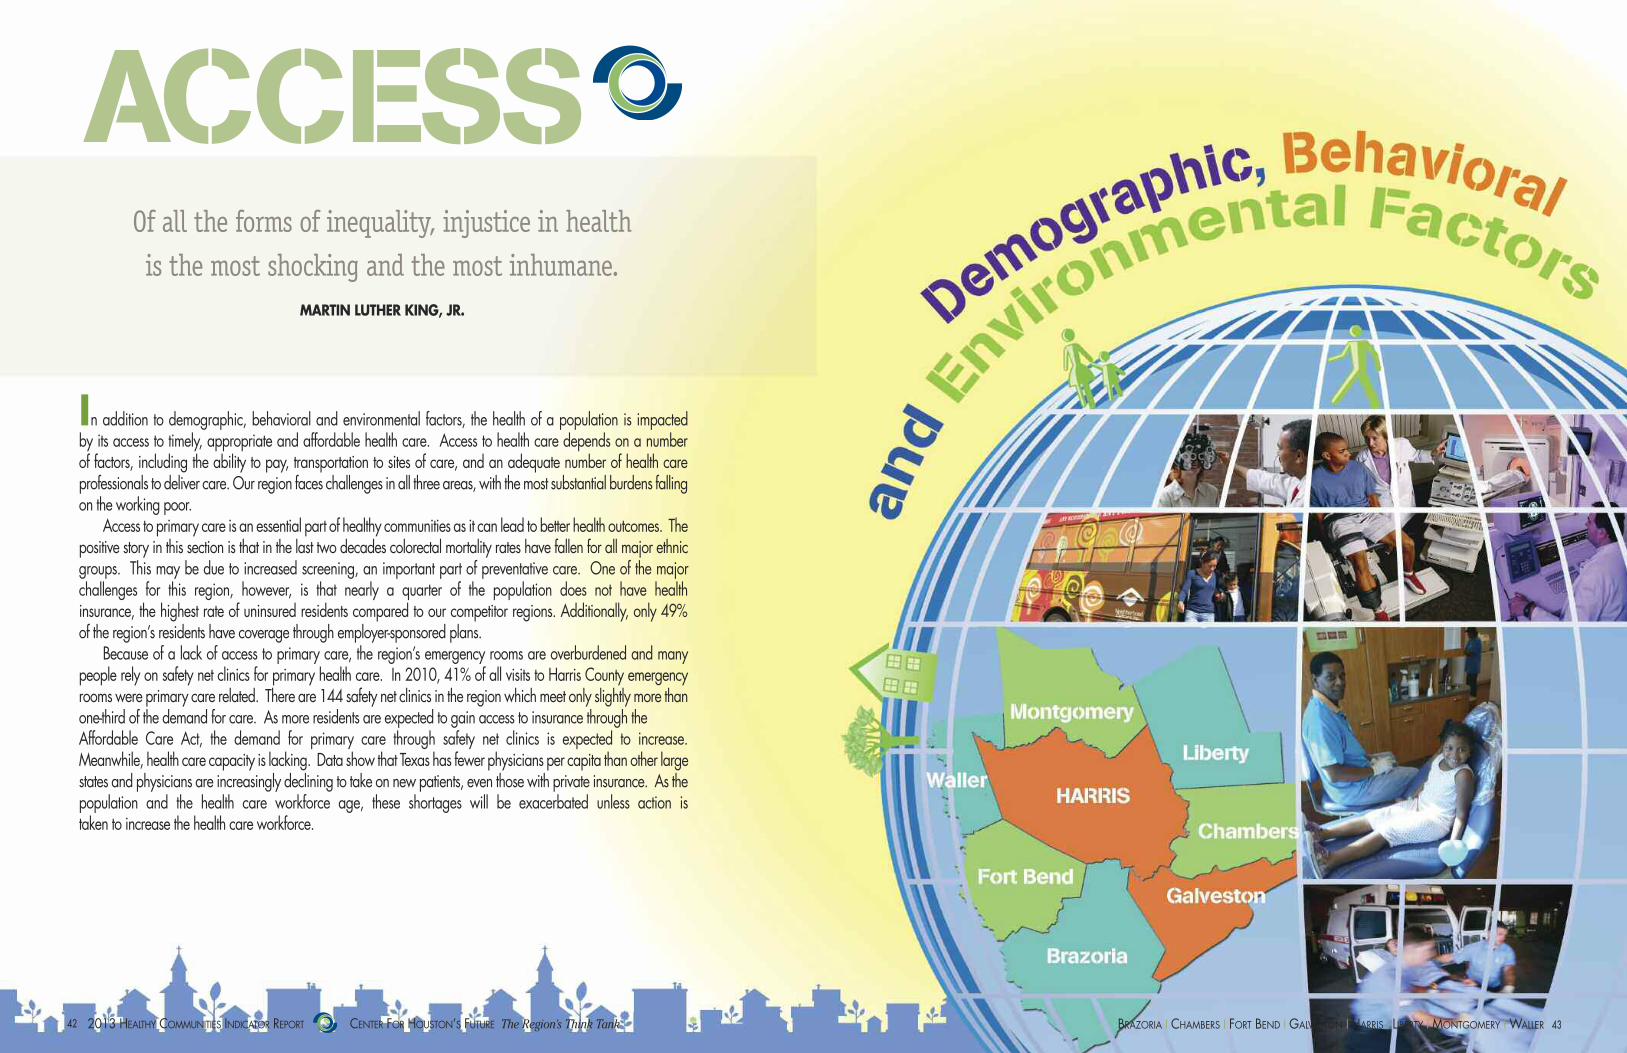
43BRAZORIA � CHAMBERS � FORT BEND � GALVESTON � HARRIS � LIBERTY � MONTGOMERY � WALLER2013 HEALTHY COMMUNITIES INDICATOR REPORT CENTER FOR HOUSTON’S FUTURE The Region’s Think Tank42
In addition to demographic, behavioral and environmental factors, the health of a population is impacted by its access to timely, appropriate and affordable health care. Access to health care depends on a number of factors, including the ability to pay, transportation to sites of care, and an adequate number of health care professionals to deliver care. Our region faces challenges in all three areas, with the most substantial burdens fallingon the working poor.
Access to primary care is an essential part of healthy communities as it can lead to better health outcomes. Thepositive story in this section is that in the last two decades colorectal mortality rates have fallen for all major ethnicgroups. This may be due to increased screening, an important part of preventative care. One of the major challenges for this region, however, is that nearly a quarter of the population does not have health insurance, the highest rate of uninsured residents compared to our competitor regions. Additionally, only 49% of the region’s residents have coverage through employer-sponsored plans.
Because of a lack of access to primary care, the region’s emergency rooms are overburdened and many people rely on safety net clinics for primary health care. In 2010, 41% of all visits to Harris County emergencyrooms were primary care related. There are 144 safety net clinics in the region which meet only slightly more thanone-third of the demand for care. As more residents are expected to gain access to insurance through the Affordable Care Act, the demand for primary care through safety net clinics is expected to increase. Meanwhile, health care capacity is lacking. Data show that Texas has fewer physicians per capita than other largestates and physicians are increasingly declining to take on new patients, even those with private insurance. As thepopulation and the health care workforce age, these shortages will be exacerbated unless action is taken to increase the health care workforce.
Of all the forms of inequality, injustice in health is the most shocking and the most inhumane.
MARTIN LUTHER KING, JR.
ACCESS

2013 HEALTHY COMMUNITIES INDICATOR REPORT CENTER FOR HOUSTON’S FUTURE The Region’s Think Tank44 45BRAZORIA � CHAMBERS � FORT BEND � GALVESTON � HARRIS � LIBERTY � MONTGOMERY � WALLER
Cost of the UninsuredIn the US, the main source of payment forhealth care is health insurance, including public plans like Medicare and Medicaid, employer-sponsored group plans, and privatelypurchased individual and family plans. Numerous studies have documented that havinghealth insurance improves health status andsaves lives (Levy & Meltzer, 2008; IOM,2009; Finkelstein et al., 2011). In addition tothe adverse health impacts due to lack of insurance, the cost of care is much higher because people without insurance often delay
Lack of insurance and primary care… …leads to high costs
Consequences of UninsuredThe high rate of uninsured people impacts theentire region, not just the uninsured. Taxpayersand insured people bear the cost of large numbers of uninsured people by paying moretaxes to support city, county and hospital district clinics. Insurance premiums paid byfamilies and businesses include a “hidden tax”in the form of additional premiums that arecollected to offset costs for the uninsured thatproviders pass along to insured patients andemployers. Inappropriate use of emergencyrooms strains the capacity to respond to truecommunity emergencies.
If Texas employers met the national average forproviding insurance, an additional 1.25 millionTexans would be covered.
Figure 32 shows that across the US, more than half of all people are covered byemployer-sponsored plans. In Texas, however,only 46% are covered through their employers.Uninsured residents include many people whowork in jobs less likely to provide health insurance, including restaurant, retail and construction. Many work for small businessesthat are increasingly less likely to provide insurance to their employees (Robertson, Stremikis, Collins, Doty and Davis, 2012).
seeking care and ultimately doing so in emergency rooms where the costs are substantially higher. Delaying care generally requires more expensive treatments, e.g.chemotherapy, when access to preventativecare could have mitigated the disease and its costs.
Table 7 indicates that the cost of medicalcare for a child under the age of 17 in anemergency room is 3.75 times the cost in adoctor’s office. For those 45-64 years of age,it is approximately 4.6 times more expensivein an emergency room as in a doctor’s office.
Uninsured Residents by County
Texas has the highest rate of uninsured residents in the US at 23%and the 8-county region is even
higher at 24%.There are nearly 1.5 million uninsured residentsin the 8-county region. Figure 31 illustrates thenumber and percentage of uninsured residentsby county. Harris County at 28% has the highest percentage uninsured while Fort BendCounty has the lowest at 19%.
1921-22: Insulin was isolated and treatment for diabetes identified at the University of Toronto by Doctors Fredrick Banting, Charles Best, J.J.R. Macleod and James Collip.
1929: Ima Hogg founded the Houston Child Guidance Center, an agency to provide therapy and counseling for disturbed children and their families and which later became the Hogg Foundation for Mental Health at the University of Texas.
TABLE 7Primary Care CostsOutpatient vs.
Emergency Room, US, 2010
AGE GROUP HOSPITAL PHYSICIAN ER COSTS OFFICE COSTS
17 and under $598 $15918 to 44 $778 $22045 to 64 $1,155 $25365 and over $794 $220
SOURCE: MACHLIN 2009.
Insurance Status for U.S., Texas and Competitor Regions
Figure 31
Figure 32
SOURCE: ACS, 1-YEAR EST. PUMS DATA SPRING 2011
Montgomery
Waller
Harris
Fort Bend
Brazoria
Liberty
Chambers
Galveston
SOURCE: ACS 2011
8,78823% of Waller
County
102,56919% of Fort Bend County
66,13423% of Brazoria County
57,83722% of Galveston County
7,89622% of Chambers County
17,38924% of Liberty County
91,12321% of
Montgomery County
1,048,05728% of
Harris County

2013 HEALTHY COMMUNITIES INDICATOR REPORT CENTER FOR HOUSTON’S FUTURE The Region’s Think Tank46 47BRAZORIA � CHAMBERS � FORT BEND � GALVESTON � HARRIS � LIBERTY � MONTGOMERY � WALLER
Access to primary care and screening lowers costs ... …and leads to better health outcomes
gateway to the health care system. It is duringthese visits that patients receive immunizationsand booster shots and are screened for chronicand/or potential life-threatening diseases, including pre-diabetic conditions, hypertensionand cancers.
Prevention Means Less DiseaseTable 8 shows that insured people receivemore preventative care than the uninsured. The American Cancer Society found that one-quarter of US cancer patients put off testing or
treatment because of cost. It should thereforenot be surprising that the uninsured suffer morediseases and cost the system more money.Susan G. Komen for the Cure estimates that thefirst three stages of breast cancer cost an average of $22,000 while stages 3 and 4,when the cancer has spread to other parts ofthe body, cost more than $120,000.
Table 9 shows that more than one-third of the region’s population does not receive colorectal screening.
Primary Care Visits by Low Income Population
Percent Population in Non-Compliance with Colorectal Screening Guidelines, 2010, 5 MSAs
2008200319981993
Figure 33: Regional Colorectal Mortality Rates by Ethnicity 1993-2008
35
30
25
20
15
10
5
Asian
Black
White
Hispanic
Primary Care Leads to PreventionThe Agency for Healthcare Research andQuality defines primary care as “the provisionof integrated, accessible health care servicesby clinicians who are accountable for addressing a large majority of personal healthcare needs, developing a sustained partnership with patients, and practicing in thecontext of family and community.”
Primary care prevents illness and death,reduces health disparities among populationsand lowers spending. It is the most important
1918: The influenza pandemic of 1918-1919 killed an estimated 20 and 40 million people worldwide. 1926: “The Houston Negro Hospital,” later known as the Riverside General Hospital was built in Third Ward with $80,000 in seed money donated by Joseph S Cullinan. It provided a place to work and learn for Black physicians and medical personnel.
VISITS PER PERSON TOTAL POPULATION TOTAL VISITS/YEAR
Uninsured 1.55 832,002 1,291,324
Insured 2.52 1,176,487 2,959,707
SOURCE: BEGLEY, ET. AL., 2012
Houston Chicago Dallas LA NYC
37.3 29.2 39.5 43.7 31.2
SOURCE: BEHAVIORAL RISK FACTOR SURVEILLANCE SYSTEM, CDC
Regional Colorectal Mortality Rates by Ethnicity
Screening Reduces IllnessFor cancers, screening is an essential tool for early intervention, where the chances ofpositive outcomes are greatest. Screening mayhelp eliminate risks before a cancer develops.A study by Stanford University concluded thatthe decline of colorectal cancer could be ex-plained by an increase in colonoscopies(Sharaf & Ladabaum, 2013).
Lower screening rates could impose a large preventable burden of cancer deathsbecause diagnosis and treatment are delayed.Evidence can be seen in the trend of deathsfrom colorectal cancer. Colorectal cancerscreening and mortality rates are important indicators because they illustrate the link between access to preventive care and health.Colorectal cancer screening occurs at the recommendation of a primary care provider.
Figure 33 shows that, for all ethnicities,colorectal mortality rates have declined duringthe past two decades. Compliance is unevenacross ethnic groups with Whites having thehighest compliance rates, followed by Blacks,Hispanics and Asians. The rate has droppedmost sharply for Whites and Blacks. While colorectal cancer mortality is actually lowest forAsians and Hispanics, their mortality rate hasdecreased more slowly over time.
Table 8
Table 9
Figure 33
Primary Care Visits per Year in Low Income Population
SOURCE: TDSHS, MORTALITY DETAIL FILE, 1993-2008

2013 HEALTHY COMMUNITIES INDICATOR REPORT CENTER FOR HOUSTON’S FUTURE The Region’s Think Tank48 49BRAZORIA � CHAMBERS � FORT BEND � GALVESTON � HARRIS � LIBERTY � MONTGOMERY � WALLER
Demand for primary care exceeds supply Safety net clinics fill only 36% of demand
who cannot get care in the safety net end upseeking care in emergency rooms, private clinicsor they and their children do without care.
Figure 34 shows the location and types of safety net primary care clinics across the 8-county region. They offer a broad spectrumof health care services to adults and childrenin community and school-based settings. Thereare 144 safety net clinics in our region, including 105 in Harris County (78%) and 39in the other seven counties. (Table 10)
Capacity ComparisonsComparing safety net system capacity amongcities is difficult as their composition varies
Location of the Region's Safety Net Clinics
THE SUPPLY OF SAFETY NET CLINICS MEET ONLY 36% OF THEDEMAND FOR HEALTH CARE BY
THE WORKING POOR.
Inadequate Supply for Working PoorThere are nearly 1.5 million people in the 8-county region who are uninsured at anygiven time and it is estimated that they needapproximately 4.2 million visits (Begley et al.,2012). This population relies on safety netproviders—a loose network of public and privatenonprofit clinics—to meet their primary careneeds. There are only enough safety net clinics inthe region to meet 36% of the demand. People
1927: A prepaid system was developed by “The Houston Negro Hospital” wherein family memberships were sold for $6/year that guaranteed all family members free hospitalization for a limited number of days annually.
1945: The trustees of the M.D. Anderson Foundation conceived the idea for the Texas Medical Center.
NEW MAP
SAFETY NET CLINICS, 8-COUNTY REGIONCLINIC TYPE NUMBER NUMBER
OF CLINICS OF VISITS
FQHC 37 358,935 Private Nonprofit 47 36,813 Hospital District 30 716,646 Health Departments 14 49,165 RHCs 6 7,914 UTMB-RMCHP 10 155,47Total 144 1,524,720
SOURCE: PROJECT SAFETY NET, 2009 SURVEY
MSA % Working poor served by safety net clinics
Chicago 37%
New York 26%
Los Angeles 22%
Houston 6%
Dallas 5%
SOURCE: HEALTH RESOURCES ANDSERVICES ADMINISTRATION
Demand Exceeds SupplyAt the request of the Center for Houston’s Future, Dr. Charles Begley of UT School ofPublic Health, and Dr. Jeanne Hanks of St.Luke’s Episcopal Health Charities conductedground-breaking work to determine the gap between the supply and demand for primarycare clinics among the working poor in the 8-county region. They projected the future gapbetween supply and demand following full implementation of the Affordable Care Act (ACA).
The study found that in 2012, there wasenough capacity/supply to serve 36% of theprimary care demand of the working poorthrough safety net clinics. However, as the
ACA is fully implemented, demand increasesbecause more working poor gain access to insurance. If demand increases by 11%-14%,and there is no growth in clinic supply, the proportion of primary care met by safetynet clinics will be reduced from 36% to 31%-33%. The study concluded that the remaining demand will have to be met by increased capacity among private practice, non-safety netproviders, including hospital emergencyrooms, or people will go without primary care(Begley et al., 2012).
County ComparisonsFigure 35 shows that, with the exception ofChambers County, most counties in the regionexperience a supply gap for safety netproviders of 60% plus. This gap is expected toincrease given two different ACA scenarios(Begley et al., 2012).
Failure to meet the increased demand forprimary care through expansion in safety netand private practice primary care capacity islikely to further burden our already overtaxedemergency room facilities.
Table 11 shows the safety net compositionthroughout the region, the number of clinicsand the number of visits they receive.
120
100
80
60
40
20
0
-20
-40
Harris
Brazo
ria
Fort
Bend
Galve
ston
Liber
ty
Mon
tgom
ery
Walle
r
Current Gap
Projected Gap in Scenario 1 (50%)
Projected Gap in Scenario 2 (75%)
Cham
bers
De
ma
nd G
ap
for S
afe
ty N
et C
linic
s (P
erc
ent
ag
e)
Safety Net Capacity Post-ACA: Two Projections
widely. However, data on FQHCs, a commonsafety net component, responsible for about24% of the 1.5 million primary care visits canbe examined. Table 10 shows the percentageof the working poor served by FQHCs in several cities and reveals that Houston is seriously lagging other cities except Dallas.
FQHCs have been a significant part ofthe national health care delivery system for almost 50 years, yet this region did not take advantage of this program until recently. Harris County organized its first FQHC in1994, obtaining a second one only in 2004.
Figure 34
Table 10
Table 11
Figure 35FQHC Capacity
in 5 CitiesFQHC Penetration in 6 Cities, 2006-2010
Visits to Safety Net Clinic by Type of Provider, 8 counties
SOURCE: ST. LUKE'S EPISCOPAL HEALTH CHARITIES 2012 SOURCE: BEGLEY ET.AL 2012

51BRAZORIA � CHAMBERS � FORT BEND � GALVESTON � HARRIS � LIBERTY � MONTGOMERY � WALLER2013 HEALTHY COMMUNITIES INDICATOR REPORT CENTER FOR HOUSTON’S FUTURE The Region’s Think Tank50
Emergency rooms: the ultimate and most expensive safety net Even with enough clinics, are there enough medical professionals?
Emergency Room Visits by Type, Harris County
Emergency Room CostsEmergency room visits are the most inefficientand costly means of receiving primary care.In 2006, 70% of calls resulting in ambulancedispatches by the City of Houston were for non-emergent needs, costing $1,750 each. Goingto an emergency room for primary care costsmore than three times the cost of an office visit.
TransportationLack of transportation is a significant barrier tohealth care for many of the working poor.Most of the working poor do not have cars, theoverwhelming means of mobility in the region.While most safety net clinics are located close
Serious Shortage of PhysiciansEven if people can pay for and get to a provider, there is a shortage of medical personnel. Texas has the lowest ratio of patientcare doctors to population of any of the sixlargest states and ranks 45th among all states.Table 12 shows that doctors are increasinglyrefusing to see new patients, even those withprivate insurance which may exacerbate theshortage.
Getting primary care does not guaranteethat an individual will be healthier, but it doesmean that individuals will gain access to information about healthy behaviors and screeningfor disease. In turn, screening and healthy
behaviors can lead to better health outcomes.By 2025 the US will need almost 52,000
additional primary care physicians (Petterson et al., 2012). In 2011, the national average of primary care physicians/ 100,000 residents was90.5/100,000 people; however, Texas only had81/100,000 (AAMC, 2011).
The provider shortage is expected to growas baby boomers age and require more care;as older providers retire; and, as the ACA expands insurance coverage to as many as 30million more Americans, including 5 millionTexans. In addition, many medical schools are facing a shortage of physicians to teachmedical students.
Obtaining Primary CareMany residents call 9-1-1 in non-emergency situations because they need transportation to ahealth care facility. The University of Texas Schoolof Public Health estimates that in 2010, 41% of allemergency room visits in Harris County were forprimary care, meaning that the services couldhave been delivered in a clinic or avoided altogether with primary care treatment (Begley et.al., 2012). The five most frequent diagnosesamong patients seeking care in an ER for primarycare-related visits are acute upper respiratory infections, acute ear infections, fever, noninfectiousgastroenteritis, and urinary tract infections (UT School of Public Health, 2008).
to bus stops, a person relying on public transportation may not live close to a bus stop,may have to transfer bus lines more than onceand be forced to wait a long time betweenbuses to reach a destination.
In response, the City of Houston and theHarris County Healthcare Alliance developeda triage program for safety net clients to determine whether 9-1-1 calls were true emergencies and to provide other services, including clinic appointment booking and transportation via taxi vouchers, for non-emergencies. This has reduced, but noteliminated, the number ambulances dispatchedsolely for transportation.
Physician Capacity, Six Most Populous States
1963: A new charity hospital was built and named in honor of Ben Taub, a renowned Houston philanthropist and medical benefactor. In 2012, it is still one of only a few Level 1 trauma centers serving 6 million people.
1964: Dr. Michael DeBakey performs the world’s first coronary bypass procedure at Methodist Hospital. During World War II, Dr. DeBakey helped modernize battlefield surgery by urging that doctors be moved from hospitals to the front lines, the beginning of MASH units.
Change in DeclineDECLINE DECLINE DECLINE 2002-08
PPO 4 4 5 1Uninsured 2 3 5 3Tricare 25 19 23 -2Medicare 17 15 19 2HMO 20 14 21 1MA 23 26 31 8CHIP 53 45 54 1Medicaid 35 32 44 9Comp 65 55 64 -1
SOURCE: TEXAS MEDICAL ASSOCIATION 2012
Nursing Gap Nurses are also facing supply shortages. According to the Texas Center for Nursing Workforce Studies, demand for full-time nursesin Texas exceeds supply by 22,000. Texasnursing schools turned away more than11,000 qualified applicants in 2010 due tolack of faculty (Texas Center for Nursing Workforce Studies, 2013).
The nursing gap is expected to grow from22,000 to 70,000 by 2020. Nurses will soonage out of employment; in 2010, the averageage of registered nurses in Texas was 46 years.
Figure 36
Table 13
Table 12 Texas physicians’ rates of declining new patients
TEXAS CALIFORNIA FLORIDA ILLINOIS NEW YORK
Medical Schools 7 8 4 7 12
Medical Students 5,419 5,591 2,578 5,238 8,148
Med. Students/100,000 pop. 24 15 14 41 42
Medical Grads/100,000 pop. 5.5 3.6 2.9 9.6 10.4
Resident MDs/100,000 pop 28 25 18 45 81
Patient care MDs/100,000 pop 186 227 217 241 330
SOURCE: TEXAS MEDICAL ASSOCIATION
SOURCE: UTSPH 2012

It had always been JENNY’s neighborhood. Whenshe and Shafik married she persuaded him to buy ahouse here. Despite its being an old neighborhoodthey loved raising their family where everythingwas familiar.
Now in their 60s with their three children out of the house they were consideringa move. The neighborhood just isn’t what it used to be or what they had hoped itwould become. Jenny was often depressed when she realized how much herneighborhood had changed.
Their modest neighborhood, with little influence in the seats of power, hadbeen overlooked by the prosperity of past decades. Oh, they finally got their parkupgraded with play ground equipment and a basketball court. But, it was too little,too late; there weren’t many children anymore. What they really needed werebetter sidewalks so they could get some exercise, a neighborhood clinic for Shafikto monitor his heart condition, better police patrols and easy access to the healthy foodthat the doctors recommended. The nearest decent grocer was almost 7 miles away.
Most days Jenny looked longingly at the one bench in the park, imagining herself sitting in the sun. All she could do was look; it wasn’t safe or healthy to beoutside. Unsavory characters were often hanging around. And, a nearby streethad become a major thoroughfare, so much of the day the air quality was questionable. Jenny and Shafik felt trapped and saw no way out.
ROSA AND MICAH, newcomers to the region, decided tomove into the Plaza Argentina. It is a vibrant spotwhere social capital is strong. The entire complex is LEED 4.0 certified and had been designed usingCDC’s 2035 Health Impact Assessment. The entireneighborhood was solar powered.
Fresh from graduate school, they were seeking a convenient place to establish roots and raise a family. They were initially attracted to the area becausea robust light rail system afforded them easy access to work – less than 20 minutesto Micah’s office - while other residents in the suburbs spent more than an hourcommuting to and from work.
Rosa, a mathematician and violin player, discovered that a 10 minute railride found her at the heart of the music scene and a vast creative community. Shecould also reach the region’s new 4-year Tier 1 University where she is pursuingher doctorate.
Micah had a genetic predisposition to coronary disease so good nutritionand exercise and regular check-ups had been inculcated into his life from elementaryschool. Micah, an outdoor enthusiast, found that Plaza Argentina was only a 10minute bicycle ride to access miles and miles of the Bayou Greenway hiking andbiking paths. Micah was delighted to learn of the neighborhood clinic staffed withnurse practitioners that had been a part of Plaza Argentina when it was designedand built.Ever the health nuts, both Rosa and Micah were delighted that the Plaza’sfarmers market was open every day. It not only had fresh vegetables and meatsfrom local sources but also had flowers that filled the Plaza with sweet smells.
Two SCENARIOS two storiesSCENARIOS 2040
is the largest public-interestbusiness-led regional scenarioplanning project in thecountry, a multi-year projectbased on rigorous research,analysis and communityfeedback. More vivid anddynamic than forecastingor visioning, scenario planning creates possible
and plausible stories of our future that serveas a powerful tool to help each of us clarifythe critical choices we must make today to ensure the health and prosperity of our region tomorrow.
CENTER FOR HOUSTON’S FUTURE hastaken its two Scenarios 2040 videos, Learningto Live and Playing to Win, to more than 3000people across eight counties in RegionalRoundtables and Briefings to focus the region – as a community – on our future,and develop shared goals and next steps tocontinue to make Houston globally competitiveand sustainable.
Why SCENARIO planning?
ENLARGES YOUR LENS . Challenges current assumptions and
encourages a look at the uncertainties
. Is a different context for decision making that includes global, national and local forces
ENCOURAGES INNOVATION
. Does not answer questions; helps you know what questions to ask
ILLUMINATES A COMPLEX AND UNCERTAIN WORLD. Helps force decisions based on
values, not merely what you know
53BRAZORIA � CHAMBERS � FORT BEND � GALVESTON � HARRIS � LIBERTY � MONTGOMERY � WALLER2013 HEALTHY COMMUNITIES INDICATOR REPORT CENTER FOR HOUSTON’S FUTURE The Region’s Think Tank52
THE MAGIC BUSNeighborhood Centers, Inc.
Many families in the Gulfton area cannot afford to buy and own a car. They walk to the grocery store, the school, the laundry and the doctor meetingtheir basic needs. The Magic Bus was started particularlyto help large families traveling by foot with young children. The Bus extends the reach of neighborhood residents since traditional transportation systems are accessible only on major thoroughfares and are not available in ‘pocket areas’.
Access to affordable transportation through the MagicBus makes trips to school, work, medical appointments andgrocery stores possible. Approximately 800 riders/monthuse the Magic Bus with 60% of daily ridership taking place before noon. This readily available and accessible type oftransportation helps to sustain neighborhoods by promoting independence and preserving a sense of community. It alsoboosts the neighborhood economy by increasing the local customer base for services, such as medical facilities, shops,restaurants and local educational facilities.
Neighborhood Centers Inc. launched the Magic Bus toaddress critical unmet transportation needs in the GulftonArea. Neighborhood Centers is a nonprofit organizationthat has served Houston’s communities for more than 100years, bringing resources, education and connection tomore than 340,000 people throughout Houston and theTexas Gulf Coast area each year.
BEST PRACTICES
LEAR
NIN
GTO
LIVE
PLAYIN
GTOWIN
OUR TWO SCENARIOS CAN BE USED AS FILTERS TO CREATE NEW STORIES ABOUT THE FUTURE OFOUR HEALTHY COMMUNITY.
Greater HoustonHealthconnect ispioneering a securenetwork of electronichealth records to linkall providers in Southeast Texas, enabling higherquality healthcare at amore affordable cost.
This independent, nonprofit, community-based organizationwas established by the Center for Houston’s Future and the Harris County Healthcare Alliance in 2010 to connect doctorsand hospitals in 20 Texas counties through a private, securetechnology system so that a patient’s data is available whereverthe patient goes for care. This patient-centric continuum of carewill improve the quality of care by giving doctors more information about their patients and will reduce costs by enabling doctors to see test results from elsewhere, rather thanrepeating tests. Ultimately, patients will interact with the exchange and have greater information about and control overtheir own health and health care. When fully functional, GHHwill provide referrals, direct messaging, lab results and a community health portal to an area containing 6.8 million people, 133 hospitals and 14,000 physicians.
PARTICIPATING PROVIDERS INCLUDE Baptist Hospitalsof Southeast Texas, CHRISTUS Healthcare, The MethodistHealth System, Texas Children’s Hospital, UT Medical Branchat Galveston, Kelsey–Seybold Clinic, Renaissance Physicians Organization, Legacy Community Health Services, MontroseCounseling Center, Houston Fire Department, City of HoustonHealth and Human Services, Galveston County Health District anda host of independent physicians.
GREATER HOUSTONHEALTHCONNECT

55BRAZORIA � CHAMBERS � FORT BEND � GALVESTON � HARRIS � LIBERTY � MONTGOMERY � WALLER2013 HEALTHY COMMUNITIES INDICATOR REPORT CENTER FOR HOUSTON’S FUTURE The Region’s Think Tank54
Finkelstein E.A., Khavjou O.A., Thompson, H., Trogdon, J.G., Liping, P., Sherry, B., & Dietz, W. (2012). Obesity and Severe Obesity Forecasts through2030. American Journal of Preventive Medicine, 42(6), 563-570.
Finkelstein, E.A., Trogdon, J.G., Cohen, J.W. & Dietz, W. (2009). Annual Medical Spending Attributable To Obesity: Payer-And Service-Specific Estimates. Health Affairs, 28(5), w822-w831
Haley, J., Kenney, G., Pelletier, J. (2008). Access to Affordable Dental Care: Gaps for Low-Income Adults. Kaiser Family Foundation. Retrieved fromhttp://www.kff.org/medicaid/upload/7798.pdf .
Howard, C. (2012, December 15th). The Big Picture. The Economist. Retrieved from http://www.economist.com/news/special-report/21568065-world-getting-wider-says-charlotte-howard-what-can-be-done-about-it-bigHu, F. (2008). Obesity Epidemiology. New York: Oxford University Press.
March of Dimes Foundation. (2008). The cost of prematurity to employers. Retrieved fromhttp://www.marchofdimes.com/peristats/pdfdocs/cts/ThomsonAnalysis2008_SummaryDocument_final121208.pdf
McKinsey Quarterly. (2011). The Real Cost of Obesity. Retrieved from http://www.mckinseyquarterly.com/newsletters/chartfocus/2011_01.htm
Mental Health Policy Analysis Collaborative (MHPAC). (2009). The Consequences of Untreated Mental Illness in Houston. University of Texas School of Public Health. Retrieved from http://www.mhtransformation.org/documents/reports/external/The%20Consequences%20of%20Untreated%20Mental%20Illness%20In%20Houston.pdf
Texas Department of State Health Services (TDSHS). (2011). The Most Expensive Conditions for Hospitalization by Payer, 2009. Statistical Brief. Retrieved from http://www.google.com/url?sa=t&rct=j&q=&esrc=s&frm=1&source=web&cd=1&ved=0CC8QFjAA&url=http%3A%2F%2Fwww.dshs.state.tx.us%2FWorkArea%2Flinkit.aspx%3FLinkIdentifier%3Did%26ItemID%3D8589955953&ei=4gQIUf2RJ4fVyAHZxY-DIDA&usg=AFQjCNGk3rBEMLi47-qI8X4Bij_xU_AGkw&bvm=bv.41524429,d.b2I
Texas Health Institute (THI). (2010). Responding to the Epidemic: Strategies for Improving Diabetes Care in Texas. Retrieved from http://content.govdelivery.com/bulletins/gd/TXGOV-1ce0ae
United Nations Children’s Fund (UNICEF). Maternal and newborn health. Retrieved from http://www.unicef.org/health/index_maternalhealth.htmlUnited States Census Bureau. (2011). Current Estimates Data. Retrieved from http://www.census.gov/popest/data/index.html
US Department of Health and Human Services, National Center for Chronic Disease Prevention and Health Promotion. (2012). Diabetes Report Card.Retrieved from http://www.cdc.gov/diabetes/pubs/pdf/DiabetesReportCard.pdf
Weir, L.M., Andrews, R.M. (2011). The national hospital bill: The most expensive conditions by payer, 2008. Agency for Healthcare Research andQuality, Statistical brief no. 107. Retrieved from http://www.hcup-us.ahrq.gov/reports/statbriefs/sb107.pdf.
World Health Organization (WHO). (2008). Maternity Mortality Ratio (per 100 000 live births). Indicator Measurement Registry, Retrieved fromhttp://apps.who.int/gho/indicatorregistry/App_Main/view_indicator.aspx?iid=26
World Health Organization. (WHO). (2000). World Health Organization Assesses the World's Health Systems - World Health Report Press Release.Retrieved from http://www.who.int/whr/2000/media_centre/press_release/en/
PLACEAlliance for Biking and Walking. (2012). Benchmarking Report. Retrieved from http://peoplepoweredmovement.org/site/images/up-loads/2012%20Benchmarking%20Report%20%20-%20Final%20Draft%20-%20WEB.pdf
Asthma and Allergy Foundation America. (2012). Facts and Figures. Retrieved from http://www.asthmacapitals.com/
Center for Houston’s Future. (2010). Counting on Quality of Place: Air Quality, Parks & Trails and Trees.
Crompton, J., & Marsh Darcy Partners Inc. (2011). Bayou Greenways -- A Key to a Healthy Houston. Houston, T. Houston Parks Board. Retrieved fromhttp://www.houstonparksboard.org/projects/documents/BayouGreenwaysBenefitsAnalysis--JohnCrompton8-26-2011.pdf
de Vries, S., Verheij, R. A., Groenewegen, P. P. & Spreeuwenberg, P. (2003). Natural environments- Healthy environments? An exploratory analysis ofthe relationship between greenspace and health. Environment and Planning A, 35(10), 1717-1731.
— continued on page 54
PEOPLEBehavioral Risk Factor Surveillance System (BRFSS). 2007-2010 Analytic File.
Bouchard, C., Perusse, L. Leblanc, C., Tremblay, A., & Theriault, G. (1998). Inheritance ofthe amount and distribution of human body fat. International Journal of Obesity, 12 (3),205-215.
Centers for Disease Control and Prevention (CDC). About Healthy Places. Retrieved from:http://www.cdc.gov/healthyplaces/about.htm
Centers for Disease Control and Prevention (CDC). Health Effects of Cigarette Smoking. Retrieved fromhttp://www.cdc.gov/tobacco/data_statistics/fact_sheets/health_effects/effects_cig_smoking/
Centers for Disease Control and Prevention (CDC). (2012). Pregnancy-related Mortality in the United States. Retrieved from http://www.cdc.gov/reproductivehealth/maternalinfanthealth/pregnancy-relatedmortality.htm
Centers for Disease Control and Prevention (CDC). (2012). National Vital Statistics System – Birth Data. Retrieved from http://www.cdc.gov/nchs/births.htm
Centers for Disease Control and Prevention (CDC). (2006). State Maternal Mortality Review:Accomplishments of Nine states, Retrieved from http://www.cdph.ca.gov/data/statistics/Documents/MO-CDC-ReportAccomplishments9States.pdf
Center for Houston’s Future. (2012). Community Indicator Report, Human Capital Development and Education: Early Childhood, K-12, Workforce Preparedness.
Cole, C. & Deviney, F. (2007). The Family Budget Estimator: What it Really Takes to Get by in Texas. Center for Public Policy Priorities (CPPP). Retrieved from http://library.cppp.org/files/8/FBE.pdf
Combs, S. (2011). Gaining Costs, Losing Time: the obesity crisis in Texas. Retrieved from http://www.window.state.tx.us/specialrpt/obesitycost/pdf/GainingCostsLosingTime.pdf
Fellows, J.L., Trosclair, A., Adams, E.K. & Rivera, C.C. (2002). Annual Smoking-Attributable Mortality, Years of Potential Life Lost, and Economic Costs - United States. 1995-1999. Morbidity and Mortality Weekly Report, 51(14), 300-303.
Fennelly, K. (2005). The ‘Healthy’ Migrant Effect. Healthy Generations, 5(3).Maternal & Child Health Program, School of Public Health, University of Minnesota, Retrieved from http://www.epi.umn.edu/mch/resources/hg/hg_immi.pdf
Appendix and ReferencesNOTE: THIS REPORT, WHERE POSSIBLE, COMPARES THE HOUSTON REGION TO ITS COMPETITOR REGIONS. FOR THIS PURPOSE, THE CENTER HAS CHOSEN TO USE BOTH NATIONAL AND REGIONAL DATA FROM THE BEHAVIORAL RISK FACTOR SURVEILLANCE SYSTEM (BRFSS). THE BRFSS IS USED RATHER THAN THE NATIONAL HEALTH INTERVIEW SURVEY (NHIS) IN THE INTEREST OF COMPARING DATA COLLECTED THROUGH SIMILAR METHODS.

57BRAZORIA � CHAMBERS � FORT BEND � GALVESTON � HARRIS � LIBERTY � MONTGOMERY � WALLER2013 HEALTHY COMMUNITIES INDICATOR REPORT CENTER FOR HOUSTON’S FUTURE The Region’s Think Tank56
ACCESSAssociation of American Medical Colleges. (2011). State Physician Workforce Data Book. Center for Workforce Studies, Retrieved fromhttps://www.aamc.org/download/263512/data/statedata2011.pdf
Begley C.E., Courtney P., Burau K. (2012). Houston Hospitals Emergency Department Use Study: January 1, 2010 through January 31, 2010. University of Texas School of Public Health at Houston. Retrieved from https://sph.uth.edu/content/uploads/2012/06/REVFinal2010ED.pdf
Begley C.E., Courtney P., Burau K. (2008). Houston Hospitals Emergency Department Use Study: January 1, 2006 through January 31, 2006. University of Texas School of Public Health at Houston. Retrieved from https://sph.uth.edu/content/uploads/2011/12/Houston_Hospitals_ER_Utilization_Study_2006.pdf
Finkelstein A., Taubman S., Wright B., Bernstein, M., Gruber, J., Newhouse, J.P., Allen, H., Baicker, K. (2011). The Oregon health insurance experiment: evidence from the first year. NBER working paper no. 17190. Cambridge, MA: National Bureau of Economic Research. Retrieved from http://www.nber.org/programs/ag/rrc/NB10-14%20Baicker,%20Finkelstein%20et%20al%20FINAL.pdf
Institute of Medicine (IOM). (2009). America’s uninsured crisis: consequences for health and health care. Washington, DC: National Academies Press.Retrieved from http://www.iom.edu/~/media/Files/Report%20Files/2009/Americas-Uninsured-Crisis-Consequences-for-Health-and-Health-Care/Ayanian%20IOM%20Ways%20and%20Means%20Testimony%203-11-09.pdf
Levy, H., Meltzer, D. (2008). The impact of health insurance on health. Annual Review of Public Health, 29, 399-409. doi: 10.1146/annurev.publhealth.28.021406.144042
Petterson, S.M., Liaw, W.R., Phillips, R.L., Rabin, D.L., Meyers, D.S. & Bazmore A.W. (2012). Projecting US Primary Physician Workforce Needs:2010-2025. Annals of Family Medicine, 10(6), 503-509. doi: 10.1370/afm1431 Retrieved fromhttp://www.annfammed.org/content/10/6/503.full.pdf+html
Robertson, R., Stremikis, K., Collins, S.R., Doty, M.M., Davis, K. (2012). Jobs Without Benefits: The Health Insurance Crisis Faced by Small Businesses and Their Workers. Commonwealth Fund. Retrieved from http://www.commonwealthfund.org/Publications/Issue-Briefs/2012/Nov/Jobs-Without-Benefits.aspx?omnicid=20
Sharaf, R.N., & Ladabaum U. (2013). Comparative effectiveness and cost-effectiveness of screening colonoscopy vs. sigmoidoscopy and alternativestrategies. The American Journal of Gastroenterology. 108 (1), 120-32. doi: 10.1038/ajg.2012.380
St. Luke's Episcopal Health Charities. (2009) Project Safety Net Clinic Survey. Houston, Texas. Retrieved from www.projectsafetynet.net.
Texas Center for Nursing Workforce Studies. (2013). Nursing Workforce in Texas – 2011: Demographics and Trends. Texas Department of State Health Services, EPublication No. E25-14020, Retrieved from http://www.dshs.state.tx.us/chs/cnws/Npublica.shtm#Wrkforce
PHOTOGRAPHY CREDITSFront Cover / The University of Texas Medical Branch at Galveston (UTMB), Neighborhood Centers, Inc. (NCI), City of HoustonBack Cover / Legacy Community Health Services (Legacy), Waller County Economic Development Partnership (WCEDP), UTMBPage 1 / City of Houston, Legacy, NCIPage 3 / Greater Houston Convention and Visitors Bureau (GHCVB), The Woodlands Township, Gensler,
Katy Prairie Conservancy (KPC), KPC – Michael Morton, WCEDP, City of Houston, UTMBPage 10 & 11 / The Historical Medical Library of the College of Physicians of PhiladelphiaPage 12 / GHCVB, WCEDP, Legacy, RediClinicPage 27 / El Centro de Corazon, RediClinicPage 28 / KPC, WCEDPPage 39 / Houston-Galveston Area CouncilPage 41 / NCI, LegacyPage 50 / NCI, Greater Houston HealthconnectPage 52 & 54 / GHCVBPage 57 / KPC
PLACE — continued from page 53
Diez Roux, A.V., Stein Merkin, S., Arnett, D., Chambless, L., Massing, M., Nieto, J.,…Watson, R. L. (2001). Neighborhood of residence and incidence of coronary heart disease. The New England Journal of Medicine. 345(2) 99-106. doi:10.1056/NEJM200107123450205
Fry, R. & Taylor, P. (2012) The Rise of Residential Segregation by Income. Pew Research Center, Retrieved from http://www.pewsocialtrends.org/2012/08/01/the-rise-of-residential-segregation-by-income/
Gordon-Larsen, P., Nelson, M. C., Page, P., & Popkin, B. M. (2006). Inequality in thebuilt environment underlies key health disparities in physical activity and obesity. Pediatrics, 117(2), 417-424. doi: 10.1542/peds.2005-0058.Lachowycz, K., & Jones,A. P. (2011). Greenspace and obesity: a systematic review of the evidence. Obesity Reviews, 12(5) e183-189. doi: 10.1111/j.1467-789X.2010.00827.x.
Landrigan, P. J., Schechter, C. B., Lipton, J. M., Fahs, M. C., & Schwartz, J. (2002). Environmental pollutants and disease in American children: estmates of morbidity, mortality, and costs for lead poisoning, asthma, cancer, and developmental disabilities.Environmental Health Perspectives, 110(7), 721-728. PMCID: PMC1240919Retrieved from http://www.ncbi.nlm.nih.gov/pmc/articles/PMC1240919/pdf/ehp0110-000721.pdf Lurmann, F. W., Hall, J. V., Kleinman, M. T., Chinkin, L. R.,Brajer, V., Meacher, D., Mummery, F., …Kumar, N. (1999). Assessment of the healthbenefits of improving air quality in Houston, Texas. Sonoma Technology, Inc. Retrievedfrom http://www.greenhoustontx.gov/reports/improvingair.pdf
Maas, J., Verheij, R. A., Groenewegen, P. P., de Vries, S., & Spreeuwenberg, P. (2006).Green space, urbanity, and health: how strong is the relation? Journal of Epidemiologyand Community Health, 60(7), 587-592. doi: 10.1136/jech.2005.043125.
Manon, M., Giang, T., & Treering, D. (2011) Food for every child: the need for more supermarkets in Houston. Special Report, The Food Trust, Retrieved fromhttp://www.thefoodtrust.org/pdf/FoodForEveryChild--Houston.pdf
Pickett KE, Pearl M. (2001) Multilevel analyses of neighborhood socioeconomic contextand health outcomes: a critical review. Journal of Epidemiology and Community Health,55(2), 111-122. doi: 10.1136/jech.55.2.111
Raun, L., & Ensor, K. (2012) Association of out-of-hospital cardiac arrest with exposureto fine particulate and ozone ambient air pollution from case-crossover analysis results: Are the standards protective? James A. Baker III Institute for Pub-lic Policy, Rice University. Retrieved from http://128.42.206.130/publications/HPF-pub-Raun EnsorParticulateExposure-101212.pdf
Singh, A., & Syal, M. (2009). Life Cycle Cost Analysis of Occupant Well-being and Productivity in LEED Offices. School of Planning, Design, Construction, Michigan State University. Retrieved from http://www.usgbc.org/ShowFile.aspx?DocumentID=6059
U.S. Environmental Protection Agency (EPA). (2012a). About Air Toxics. Retrieved from www.epa.gov/air/toxicair/newtoxics.html.
U.S. EPA. (2012b). Indoor Air Quality. Retrieved from www.epa.gov/iaq.
U.S. Green Building Council. (2012). LEED. Retrieved from https://new.usgbc.org/leed.
van Dillen, S. M., de Vries, S., Groenewegen, P. P., & Spreeuwenberg, P. (2012). Greenspace in urban neighbourhoods and residents' health: addingquality to quantity. Journal of Epidemiology and Community Health, 66(6), e8. doi: 10.1136/jech.2009.104695.
Appendix and References

59BRAZORIA � CHAMBERS � FORT BEND � GALVESTON � HARRIS � LIBERTY � MONTGOMERY � WALLER
Dorothy and Mickey AblesAccess Data Supply/Renee LogansStanford and Joan Alexander FoundationAllegiance Bank Texas Allen Boone Humphries Robinson LLP Amegy Bank of TexasAnadarko Petroleum Corporation Jana and John ArnoldyAsia Chemical Corporation AT&T James A. Baker, IIIBaker Botts LLPBank of America E. William BarnettAdele and Lan BentsenAlex and Astley BlairLeslie and Jack Blanton, Jr.Blue Lance, Inc.BoyarMiller Bracewell & Giuliani, LLP Vianei L. and Jason BraunAnn and Peter BrownThe Brown FoundationErin and Judge Brett BusbyJenny and James CalawayCenterPoint Energy Anne and Albert ChaoChevron Citizens for Affordable Energy Donna ColeComerica Bank Community Health Choice, Inc. Cooper IndustriesMolly and James CrownoverBruce CulpepperDataCert, Inc.William DeLaneyJoan and Lawrence Del PapaDevon Energy Corporation Jenny and Jim Elkins Family FundEverett Family Fund Exxon Mobil Corporation Federal Reserve Bank of Dallas, Houston Forethought Financial GroupSarah and Douglas FosheeFosterQuan, LLP Irene and Lupe FragaCarmela and Kelly FrelsFrost National Bank Fulbright & Jaworski, LLP
G&A PartnersGensler Gwendolyn Goffe Greater Houston Community Foundation Greater Houston Convention &
Visitors' Bureau Karen and Alan HardingHaynes Whaley Associates, Inc. H-E-B Houston Community College SystemHouston Endowment, Inc. Houston First Corporation Howell Family FoundationMarianne and Rob JonesJones Lang LaSalle - HoustonJPMorgan Chase Foundation Beverly KaufmanKayser FoundationKBR Kempner Capital Management, Inc./
Peaches and Harris KempnerKinder Foundation King & SpaldingStephen Klineberg, PhDHarriet and Truett LatimerLocke Lord, LLPLone Star College System Lufkin IndustriesMadison Charitable FoundationMarathon Oil CompanyThe Marek Companies/
Reinnette and Stan MarekGeorge and Kathryn Martinez Sylvia Mayer and Rob AndersonMayer Brown, LLPMcCord Development Inc.Robert and Janice McNair FoundationMD Anderson Foundation Memorial Hermann Hospital System Anne and John MendelsohnMetroBank, N. A.Metropolitan Transit Authority MFR Healthcare Solutions, Inc. Steven and Sheila Miller Foundation Ginni and Richard MithoffCatherine Clark MosbacherNational Fire Sprinkler Association Neighborhood Centers Inc. Palmetto Partners, Ltd. Pannell Kerr Forster of Texas, PC Leila Perrin
Donors
2013 HEALTHY COMMUNITIES INDICATOR REPORT CENTER FOR HOUSTON’S FUTURE The Region’s Think Tank58
Tina and Joseph PyneSheryl and Ernie Rapp/The UP Experience Perry Ann and Dr. John ReedReliant Energy, an NRG Company Rice UniversityRice University Shell Center for Sustainability Sherry Robinson and George FinkJ. Hugh and Ann RoffRegina RogersJuanita RomansSan Jacinto College DistrictThe Scurlock Foundation Steven H. Schweitzer Terry M. ShaikhJeri and Marc ShapiroShell Oil FoundationSilver Eagle Distributors Charitable Fund/
John L. Nau, IIILouis H. Skidmore, Jr.Smith, Graham & Co. Investment Advisors, LP South Main AllianceSouth Montgomery County Economic
Development PartnershipSpectra Energy Statesman Business AdvisorsLois and George StarkY. Ping Sun and David LeebronSysco Corporation Tellepsen Family Fund Texas Children's HospitalThunder Exploration, Inc.Brittney and Max TribblePhoebe and Bobby TudorTyco Flow ControlUHY Advisors TX, LLCUniversity of Houston University of Houston Downtown University of Texas Health
Science Center at Houston UTMB Health Van Dyke Energy Company Susan and Eugene VaughanVerizon WirelessVinson & Elkins, LLPWells FargoMary and Ralph Wheeler The Woodlands TownshipLorraine and E.D. WulfeSusan Young
FY2012 Donors, list complete as of publication deadline
THANK YOU TO OUR BOARD OF DIRECTORS 2013
James CalawayCHAIRMAN
Eugene H.VaughanFOUNDING CHAIRMAN
Catherine Clark MosbacherPRESIDENT AND CEO
Dorothy AblesDan BellowAstley BlairLeslie BlantonBruce CulpepperJames DannenbaumBill DeLaneyKelly FrelsHarry Gee, Jr.George Y. GonzalezThomas D. GrosRobert W. HarveyBrenda Hellyer, Ed.D.Paul W. HobbyJohn HofmeisterLynne HumphriesRick JaramilloMichael K. JhinShauna Johnson-ClarkHarris “Shrub” Kempner, Jr.Stan MarekDavid McClanahanScott McClellandJohn Mendelsohn, M.D.Adrian PattersonPerry Ann ReedAnne TaylorWalter TomlinsonBruce Coulson ToughUmesh Verma
ADVISORY COUNCIL
Linda AddisonE. William BarnettRichard CampoChip CarlislePhil ConwayRufus CormierGeorge DeMontrond, IIIC. Richard EverettRoger GalatasNed S. HolmesStephen Klineberg, Ph.D.Renee LogansGeorge MartinezDavid L. MendezSteven MillerThe Honorable Annise ParkerJuanita RomansJames R. RoyerThe Honorable Bill WhiteE.D. WulfeRosie Zamora
CHF STAFF
Russell RichardDIRECTOR, LEADERSHIP
Donna Rybiski DIRECTOR, STRATEGIC INITIATIVES
Ann Shaw DIRECTOR, EXTERNAL RELATIONS
Ralph Wheeler DIRECTOR, DEVELOPMENT
Claudette Harvey ASSISTANT, LEADERSHIP AND ADMINISTRATION
Laura McLooneCOORDINATOR, COMMUNICATIONS
Margarita Perez MANAGER, MARKETING
Mercedes Santos-GarayMANAGER, DEVELOPMENT
Lauren Stewart COORDINATOR, DEVELOPMENT
Chuck Thomas GIS AND DIGITAL MEDIA SPECIALIST
Sandra Wegmann SENIOR MANAGER, STRATEGIC INITIATIVES

2013 HEALTHY COMMUNITIES INDICATOR REPORT CENTER FOR HOUSTON’S FUTURE The Region’s Think Tank60