Brazil: Economic and Monetary Outlook · 1 Tiago Berriel Deputy Governor for International Affairs...
43
1 Tiago Berriel Deputy Governor for International Affairs and Corporate Risk Management JP Morgan Investor Seminar Washington, USA April 21 st , 2017 Brazil: Economic and Monetary Outlook
Transcript of Brazil: Economic and Monetary Outlook · 1 Tiago Berriel Deputy Governor for International Affairs...
1
Tiago BerrielDeputy Governor for International Affairs
and Corporate Risk Management
JP Morgan Investor Seminar
Washington, USA
April 21st, 2017
Brazil: Economic and Monetary Outlook

2
1. International Context and External Sector
2. Growth Dynamics: stabilization and signals of recovery
3. Monetary Policy
4. Structural Reforms and Resilience

3
• Positive outlook for global economic activity, despite underlying uncertainty• US tightening with limited impacts on global yields• Mitigating factors for some EMEs:
• Terms of trade and commodity prices, despite recent volatility;• Resilient capital flows and asset prices;• Growth Stimulus in G4 with low inflationary risks: Europe and Japan
• Risks:• Sustainability of current growth momentum.• Commodities prices volatility• Faster than expected MP tightening in advanced economies• Protectionism and global growth• Outlook for Chinese economy
International Context: uncertainty and mitigating factors for some EMEs

4
Source: Thomson Reuters Datastream
Sovereign Bonds – 2 year (G4) Sovereign Bonds – 10 year (G4)
US tightening with limited impacts on global yields

5
Market Indicators
US Elections
Skew Index vs VIX
Brexit
Skew IndexVIX (RH Scale)
Source: Thomson Reuters Datastream

6
Emerging Markets and US Corporative Spreads
6
High Yield Spread*
Emerging Markets Corporate Spread*
Source: Thomson Reuters Datastream

7
CDS Sovereigns5 year
Stock Markets – Emerging Economies01/01/10 = 100
EME benefiting from better risk perception
Source: Thomson Reuters Datastream

8
Commodity prices
Iron OrePetroleumBrent & WTI
Source: Thomson Reuters Datastream

9
• The global outlook coincides with a period of economicstabilization in the Brazilian economy, and improvement in itsfundamentals.
• Brazil is now less vulnerable to external shocks.
Brazil in the International Context

1010
US$
bill
ion
Source: BCB *through April 19th
Brazil: International Reserves vs. FX Swap and Repo Lines or FX Loans
376.2
-17.8
1.3
-150
-100
-50
0
50
100
150
200
250
300
350
400
20
03
20
04
20
05
20
06
20
07
20
08
20
09
20
10
20
11
20
12
20
13
20
14
20
15
20
16
20
17
international reserves FX swap position repo lines + FX loan operations

11
79 75*
- 24 - 26*
- 150
- 100
- 50
-
50
100
150
2010 2011 2012 2013 2014 2015 2016 2017
FDI
CC
US$ BI
Source: BCB*Market Expectations – Focus Report, Apr 13th - 2017
Brazil: Current Account x FDI

1212
12m until Feb/17
Exports/GDP
Total exports 10.1%
Latin America and the Caribbean 1.8%
European Union 1.8%
Asia (ex-ME and China) 1.3%
USA 1.3%
China 2.0%
others 1.8%
Mar/16 – Feb/17: US$191.0 billion
Apr/16 – Mar/17: US$195.1 billion
Apr/16 – Mar/17
Latin America and the
Caribbean18,1%
EU17,4%
Asia (ex-ME and China)
12,9%
US12,3%
China21,6%
others17,6%
Brazil: Exports by Destination
Source: BCB

1313
External Vulnerability Indicators (% of GDP)
Net external debt Total external debt International reserves Current transactions
Reduction of External Vulnerability
Source: BCB, National Treasury Secretariat

14
% %%
12,4
12,7
13,8
13,8
13,9
14,1
14,2
14,3
14,5
14,8
15,5
15,6
16,2
17,1
17,9
18,0
0 5 10 15 20
Russia
India
Australia
Canada
South Africa
USA
Korea
Spain
Mexico
Italy
Japan
Turkey
Brazil
France
UK
Germany
Capital Adequacy Ratio
-32,3
-24,0
-18,0
-8,3
-7,2
-5,8
-4,5
-3,9
-3,8
4,6
12,0
14,3
17,0
-50 -40 -30 -20 -10 0 10 20
Spain
Japan
South Africa
Australia
USA
Canada
UK
Turkey
Korea
Mexico
Brazil
Russia
India
(Provisions – NPL) / Capital
24,6
33,4
36,8
38,7
39,3
44,5
47,7
69,6
91,2
93,1
118,4
121,8
153,1
195,2
0 70 140 210
India
South Africa
UK
Japan
Australia
Mexico
Canada
Turkey
USA
Italy
Korea
Russia
Germany
Brazil
Liquid Assets to Short Term Liabilities
Financial Soundness Indicators
Source: FMI (FSI) – latest available data

15
1. International Context and External Sector
2. Growth Dynamics: stabilization and signals of recovery
3. Monetary Policy
4. Structural Reforms and Resilience

16
• Recovery in businessmen confidence indexes
• Monetary Policy easing cycle
• Deleveraging process well advanced
• Strong growth in agricultural sector
• Infrastructure Concessions. Asset Sales and Privatization Agenda. Concessions tothe Private Sector: Logistics Investment Program (PIL) and Infrastructure Workswith regulatory stability
• Business Climate improvement and efficiency and productivity gains
• Structural Reforms (government expenditure cap, social security, tax and laborreforms)
Stabilization and signs of gradual recovery

17
80
84
88
92
96
100
104
108m
ai 1
3
jul 1
3
set
13
no
v 1
3
jan
14
mar
14
mai
14
jul 1
4
set
14
no
v 1
4
jan
15
mar
15
mai
15
jul 1
5
set
15
no
v 1
5
jan
16
mar
16
mai
16
jul 1
6
set
16
no
v 1
6
jan
17
Industrial Production
20
12
=10
0, s
.a.
132
134
136
138
140
142
144
146
148
150
ago
13
no
v 1
3
fev
14
mai
14
ago
14
no
v 1
4
fev
15
mai
15
ago
15
no
v 1
5
fev
16
mai
16
ago
16
no
v 1
6
fev
17
IBC-BR Index
3mma
montly
Industrial Production and IBC-BR Index
Source: IBGE

18
%
Sources: BCB / IBGE *Market Expectations – Focus Survey of Apr 13th
4,0
1,9
3,0
0,5
-3,8 -3,6
0,40*
2,5* 2,5*
-5
-4
-3
-2
-1
0
1
2
3
4
5
6
7
8
20
11
20
12
20
13
20
14
20
15
20
16
20
17
*
20
18
*
20
19
*
GDP Real Growth

19
Source: FGVObs.: proportion of favorable answers – proportion of unfavorable answers + 100
60
70
80
90
100
110
jun
13
ou
t 1
3
fev
14
jun
14
ou
t 1
4
fev
15
jun
15
ou
t 1
5
fev
16
jun
16
ou
t 1
6
fev
17
services
industry
3m
ma,
s.a
.
3m
ma,
s.a
.
60
70
80
90
100
110
jun
13
ou
t 1
3
fev
14
jun
14
ou
t 1
4
fev
15
jun
15
ou
t 1
5
fev
16
jun
16
ou
t 1
6
fev
17
construction
commerce
Agents’ Confidence - Businessmen

20
mill
ion
hec
tare
s, m
illio
nto
ns
Source: Conab
*average estimate in Apr 17
Production (1991-2016)
Growth: 222% = 4.8% / year
Cropped Area (1991-2016)
Growth: 54% = 1.7% / year
37,9
60,157,9
227,9
20
40
60
80
100
120
140
160
180
200
220
240
90/9
1
91/9
2
92/9
3
93/9
4
94/9
5
95/9
6
96/9
7
97/9
8
98/9
9
99/0
0
00/0
1
01/0
2
02/0
3
03/0
4
04/0
5
05/0
6
06/0
7
07/0
8
08/0
9
09/1
0
10/1
1
11/1
2
12/1
3
13/1
4
14/1
5
15/1
6
16/1
7*
Grains, Production and Cropped Area

21
% o
fin
com
eHousehold Debt
17
22
27
32
37
42
47
jan
08
jul 0
8
jan
09
jul 0
9
jan
10
jul 1
0
jan
11
jul 1
1
jan
12
jul 1
2
jan
13
jul 1
3
jan
14
jul 1
4
jan
15
jul 1
5
jan
16
jul 1
6
jan
17
debt debt ex-housing credit
Deleveraging Process (I)
Source: BCB

22
% o
fin
com
eDebt Service
17
18
19
20
21
22
23
jan
08
jul 0
8
jan
09
jul 0
9
jan
10
jul 1
0
jan
11
jul 1
1
jan
12
jul 1
2
jan
13
jul 1
3
jan
14
jul 1
4
jan
15
jul 1
5
jan
16
jul 1
6
jan
17
debt service, s.a.
Deleveraging Process (II)
Source: BCB

23
% p
.a.
11,25
7
8
9
10
11
12
13
14
15
ou
t 11
ab
r 1
2
ou
t 12
ab
r 1
3
ou
t 13
ab
r 1
4
ou
t 14
ab
r 1
5
ou
t 15
ab
r 1
6
ou
t 16
ab
r 1
7
Selic Rate
Source: BCB

24
mill
ion
s
R$
, in
rea
l ter
ms
formal employees(accumulated in 12 months)
average salary(12-month average)
14
15
16
17
18
19
20
21
22fe
v 1
0
fev 1
1
fev 1
2
fev 1
3
fev 1
4
fev 1
5
fev 1
6
fev 1
7dismissals admissions
1.200
1.250
1.300
1.350
1.400
1.450
1.500
1.550
1.600
1.650
fev
10
fev
11
fev
12
fev
13
fev
14
fev
15
fev
16
fev
17
admissions dismissals
Admissions and Dismissals vs. Salaries
Sources: MTPS (CAGED) / IBGE (INPC)

25
1. International Context and External Sector
2. Growth Dynamics: stabilization and signals of recovery
3. Monetary Policy
4. Structural Reforms and Resilience

26
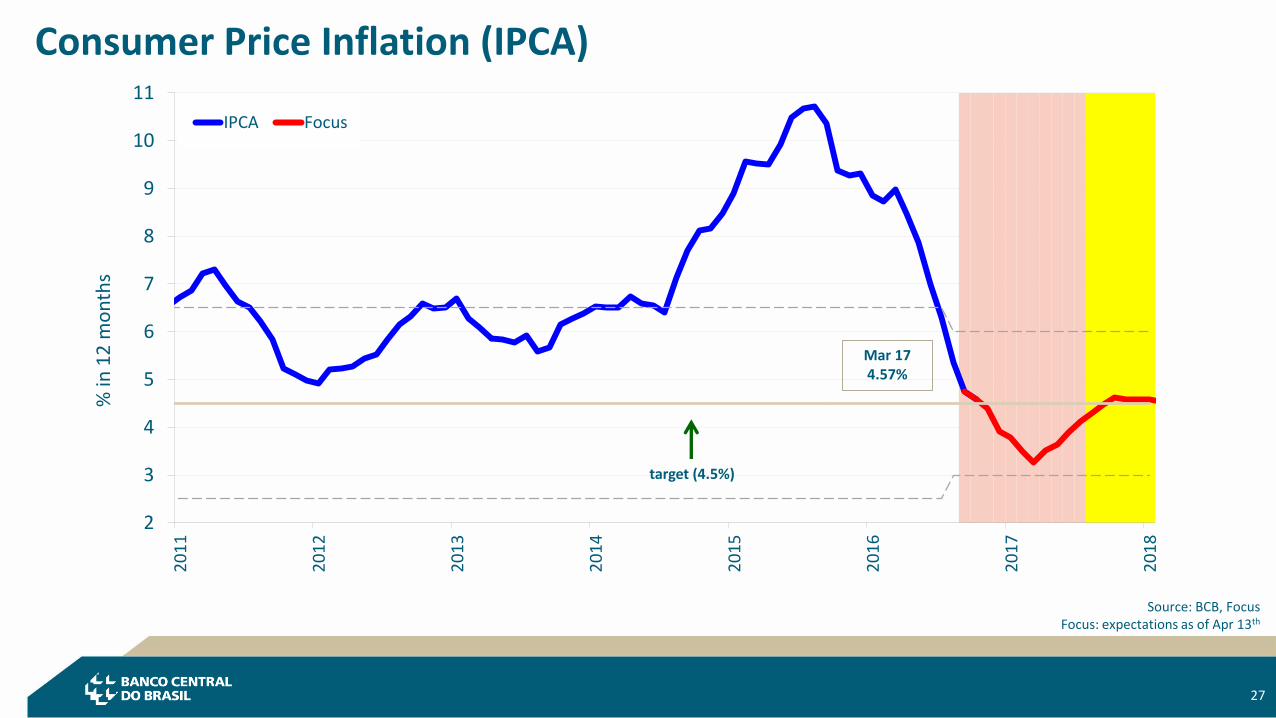
• Consolidation of a disinflation for inflation components that are most sensitiveto the economic cycle and to monetary policy justified a moderateintensification of the monetary easing process. The Committee judged thepace of 100bps adequate.
• IPCA diffusion indexes exhibited a relatively large drop in recent months
• Favorable inflation dynamics, with widespread disinflation, lower persistenceand expectations well anchored in longer horizons.
Monetary Policy Outlook: Inflation and current easing cycle
27
2
3
4
5
6
7
8
9
10
11
20
11
20
12
20
13
20
14
20
15
20
16
20
17
20
18
IPCA Focus
target (4.5%)
Mar 174.57%
% in
12
mo
nth
s
Source: BCB, FocusFocus: expectations as of Apr 13th
Consumer Price Inflation (IPCA)

28
Mar 175.6
Mar 174.3
0
2
4
6
8
10
12
14
16
18
20ju
n 1
0
dez
10
jun
11
dez
11
jun
12
dez
12
jun
13
dez
13
jun
14
dez
14
jun
15
dez
15
jun
16
dez
16
20
17
IPCA regulated prices IPCA market prices
y-o
-y c
han
ge(%
)
Sources: BCB, IBGE
*as of April 13th
IPCA Regulated Prices (%)2015 18.072016 5.50mkt expectations 2017* 5.50
IPCA Market Prices (%)2015 8.512016 6.54mkt expectations 2017* 3.60
marketexpectations*
Market, Regulated and Food Prices

29
% in
12
mo
nth
s
%
IPCA Diffusion Index
4
5
6
7
8
9
10
11
jul 14
nov 1
4
ma
r 1
5
jul 15
nov 1
5
ma
r 1
6
jul 16
nov 1
6
ma
r 1
7
IPCA smoothed trimmed means
exclusion of regulated prices and household food double weight
50
55
60
65
70
75
80
jul 14
nov 1
4
ma
r 1
5
jul 15
nov 1
5
ma
r 1
6
jul 16
nov 1
6
ma
r 1
7
monthly
IPCA – Headline, Cores and Diffusion Index
Source: IBGE

30
3
4
5
6
7
8
9
10
11
12
Mar2010
Mar2011
Mar2012
Mar2013
Mar2014
Mar2015
Mar2016
Mar2017
12
m V
aria
tio
n (
%)
12M Inflation – Underlying Services(*)
Underlying Services - 12M 3M Dessaz
Source: BCB(*) Overall services excluding domestic services, courses, communication and tourism.
Services Prices Path (CPI-IPCA): Underlying Component (moving average)

31
0
2
4
6
8
10
1Q
16
2Q
16
3Q
16
4Q
16
1Q
17
2Q
17
3Q
17
4Q
17
1Q
18
2Q
18
3Q
18
4Q
18
1Q
19
% in
12
mo
nth
sScenario with Focus Selic and Exchange Rates
Conditional Inflation Forecasts
Source: BCB

32
1. International Context and External Sector
2. Growth Dynamics: stabilization and signals of recovery
3. Monetary Policy
4. Structural Reforms and Resilience
33
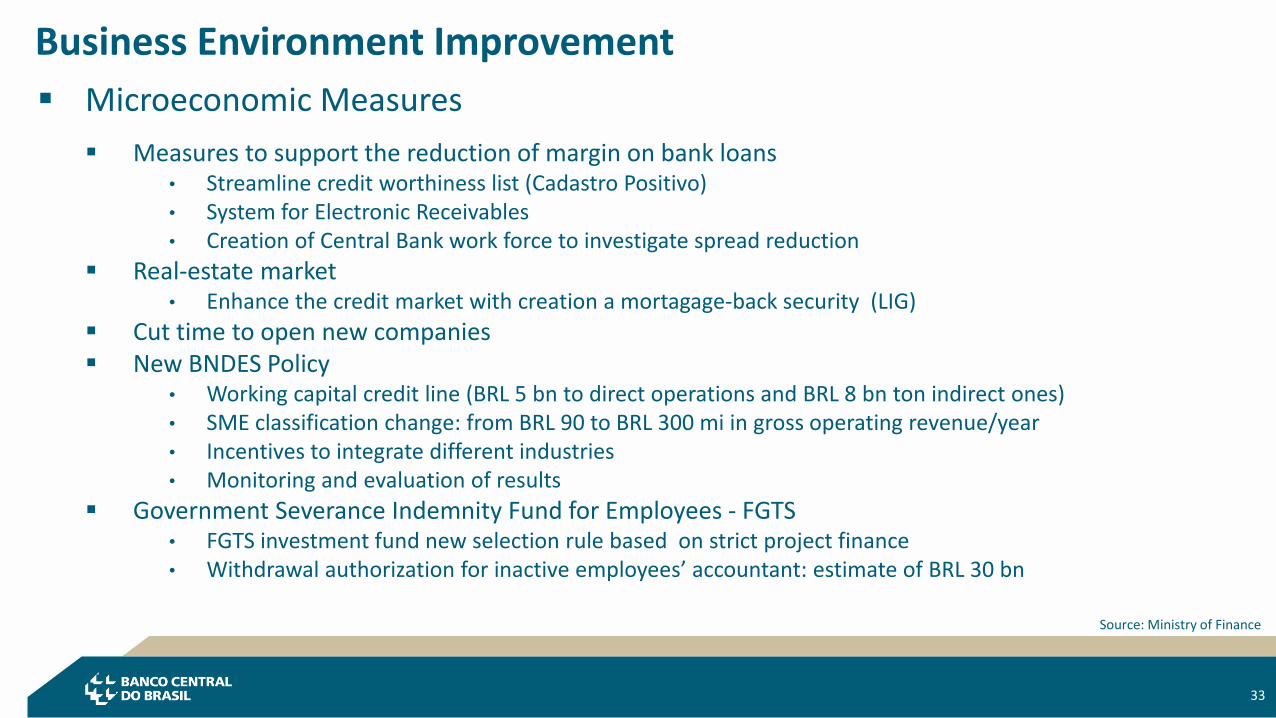
Microeconomic Measures
Measures to support the reduction of margin on bank loans• Streamline credit worthiness list (Cadastro Positivo)• System for Electronic Receivables• Creation of Central Bank work force to investigate spread reduction
Real-estate market• Enhance the credit market with creation a mortagage-back security (LIG)
Cut time to open new companies New BNDES Policy
• Working capital credit line (BRL 5 bn to direct operations and BRL 8 bn ton indirect ones)• SME classification change: from BRL 90 to BRL 300 mi in gross operating revenue/year• Incentives to integrate different industries• Monitoring and evaluation of results
Government Severance Indemnity Fund for Employees - FGTS• FGTS investment fund new selection rule based on strict project finance• Withdrawal authorization for inactive employees’ accountant: estimate of BRL 30 bn
Business Environment Improvement
Source: Ministry of Finance
34
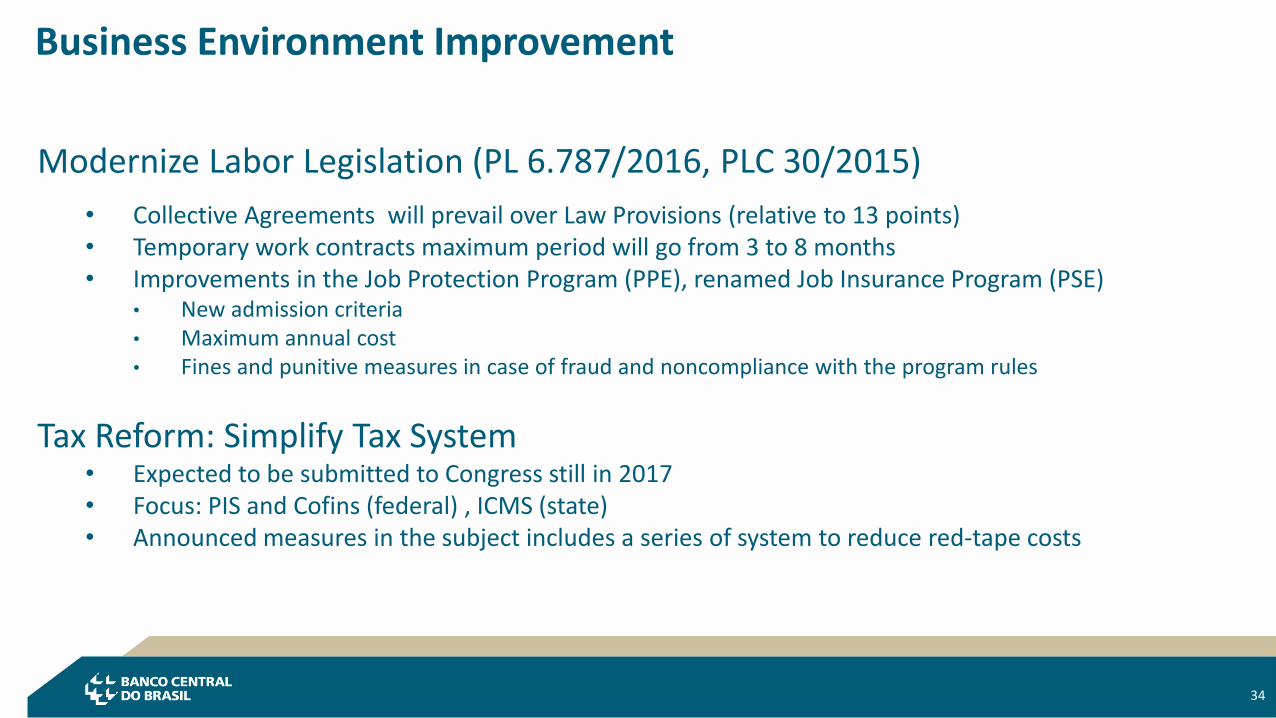
Modernize Labor Legislation (PL 6.787/2016, PLC 30/2015)
• Collective Agreements will prevail over Law Provisions (relative to 13 points)• Temporary work contracts maximum period will go from 3 to 8 months• Improvements in the Job Protection Program (PPE), renamed Job Insurance Program (PSE)
• New admission criteria• Maximum annual cost• Fines and punitive measures in case of fraud and noncompliance with the program rules
Tax Reform: Simplify Tax System• Expected to be submitted to Congress still in 2017• Focus: PIS and Cofins (federal) , ICMS (state)• Announced measures in the subject includes a series of system to reduce red-tape costs
Business Environment Improvement

35
- The main goal is to pursue a more efficient financial system, with more free market
credit, contributing to increase the power of monetary policy.
- Based on four Pillars:
I. Increase financial citizenship III. Improve legal framework
II. Increase financial system efficiency IV. Reduce cost of credit
Agenda BC+: lower neutral rate and higher MoP Effectiveness

36
• New economic policy involved a significant decrease in expansionary quasi-fiscalimpulses
• From the monetary policy standpoint, a more efficient financial system, with more freemarket credit, contributes to increase the power of monetary policy.
• Structural measures (Agenda BC+) aim to reach a sustainable reduction in overall costof credit, increasing economic efficiency and productivity, thereby helping monetarypolicy effectiveness
• New methodology for TLP (parameter for the remuneration system of directed credit)aligned with market rates favors monetary policy effectiveness.
Directed Credit, Quasi-Fiscal Impulses and Long Term Rates

37
34,3
37,538,9
36,3
33,532,0
33,5 32,5
36,438,4
39,541,1
44,5
47,849,1 49,9 50,2
0
5
10
15
20
25
30
35
40
45
50
55
2001
2002
2003
2004
2005
2006
2007
2008
2009
2010
2011
2012
2013
2014
2015
2016
2017*
% o
fto
tal c
red
it
Source: BCB
new methodology since Mar 07
*Feb/17
Earmarked Credit

38
Structural Fiscal Reform Agenda and Monetary Policy Effectiveness
• Persistent growth in expenditures caused a fiscal deterioration that eroded confidence.
• Structural Fiscal Reform Agenda is critical to bring fiscal equilibrium back, assuring public debt sustainability through a recovery in primary surpluses' horizon;
• Intertemporal consistency in fiscal policy is critical for monetary policy effectiveness, definitively removing uncertainty for longer horizons.
• Spending Ceiling - Constitutional Amendment was approved in October 2016.
• Social Security Reform is under sound debate in the society, and in advanced consideration in the Chamber, with expected examination in the floor by mid-May.

39
Spending Cap will anchor fiscal policy opening room for primary surpluses
Source: National Treasury Secretariat
Projection of Primary Expenditures with and without Expenditures Cap (% GDP)
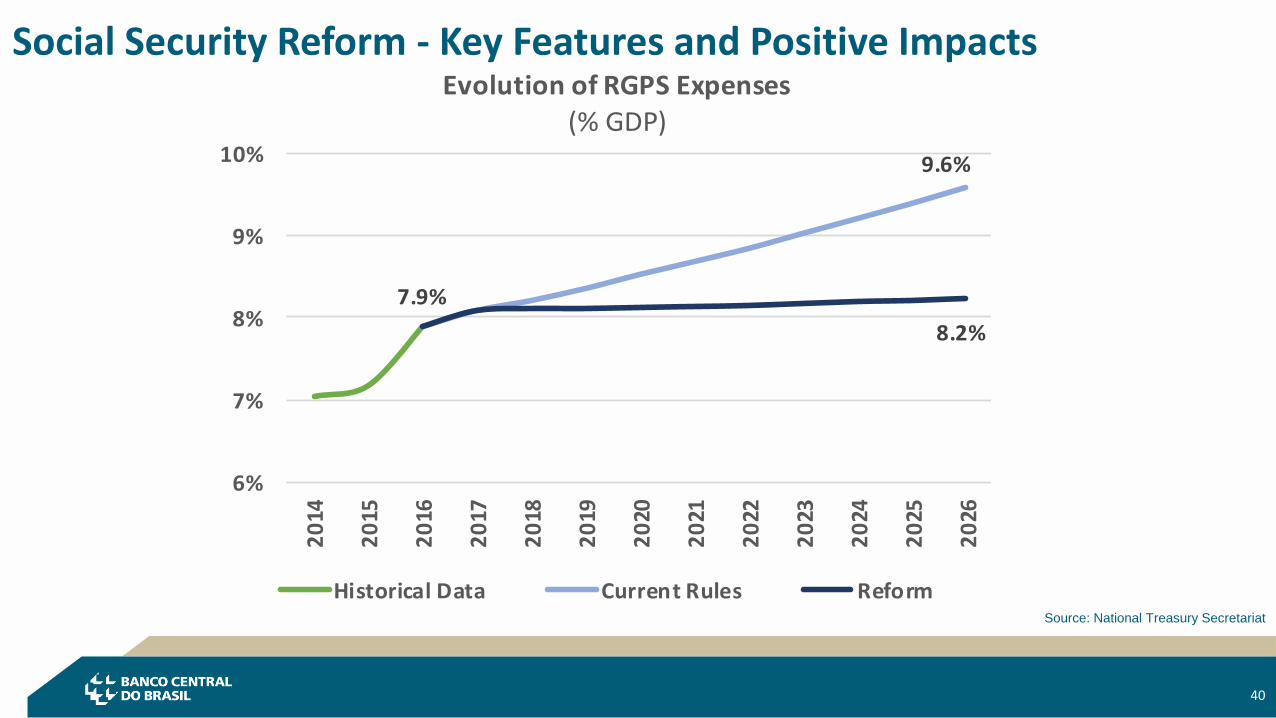
40
Source: National Treasury Secretariat
9.6%
7.9%
8.2%
6%
7%
8%
9%
10%
20
14
20
15
20
16
20
17
20
18
20
19
20
20
20
21
20
22
20
23
20
24
20
25
20
26
Evolution of RGPS Expenses
(% GDP)
Historical Data Current Rules Reform
Social Security Reform - Key Features and Positive Impacts
41
• Positive outlook for global economic activity, but relevant global uncertainty and risks for EME (faster tightening in US, protectionism, Europe´s politics, Protectionism and global growth, and Outlook for Chinese economy)
• Brazil is resilient to external volatility and risks. Sound current account financing through FDI; Low overall exposure to forex liabilities including corporates; diversified trade ties (global trader) and financial system with solid capital structure and limited leverage.
• Monetary Policy easing, microeconomic reform agenda, and structural sound growth in agriculture favor a gradual growth recovery along 2017.
• Real and nominal interest rates are falling in Brazil. The policy rate (Selic) fell during the past few months and it is expected to fall further. The real interest rate have also receded.
Outlook for the Brazilian Economy: Conclusions (I)

42
• Favorable inflation dynamics, with widespread disinflation, lower persistence andexpectations well anchored for longer horizons
• Consolidation of a disinflation for inflation components that are most sensitive to theeconomic cycle and to monetary policy justified a moderate intensification of themonetary easing process. The Committee judged the pace of 100bps adequate.
• Structural Fiscal Reform Agenda is critical to assure public debt sustainability, definitively removing uncertainty for longer horizons. Spending Ceiling was approved in Oct/16, and the Social Security Reform is under advanced consideration in Congress.
Outlook for the Brazilian Economy: Conclusions (II)

43
Thank You!
43
Tiago BerrielDeputy Governor for International Affairs
and Corporate Risk Management