Branding in Social Media and the Impact of Social Media on ...
70
Tomi Jokinen Branding in Social Media and the Impact of Social Media on Brand Image Thesis Spring 2016 School of Business and Culture International Business
Transcript of Branding in Social Media and the Impact of Social Media on ...
Tomi Jokinen
Branding in Social Media and the Impact of Social Media on Brand Image
Thesis
Spring 2016
School of Business and Culture
International Business
2
SEINÄJOKI UNIVERSITY OF APPLIED SCIENCES
Thesis abstract
Faculty: School of Business and Culture
Degree Programme: Bachelor of Business Administration
Specialisation: International Business
Author(s): Tomi Jokinen
Title of thesis: Branding in Social Media and the Impact of Social Media on Brand Image
Supervisor(s): Miia Koski
Year: 2016 Number of pages: 65 Number of appendices: 1
The purpose of this thesis is to examine how social media can be used for branding purposes, what should be taken into consideration when using social media for branding purposes, and to research the impact of social media on brand image in comparison to traditional media.
Concepts related to branding, social media and finally branding in social media are introduced and examined in the theoretical part of the thesis. The empirical part of the thesis consists of a quantitative consumer survey among Finnish consumers between the ages of 15 and 64.
The results indicate that the overall significance of social media for branding and its impact on brand image is generally equivalent to those of traditional media. How-ever, there may be significant differences depending on the targeted segment of consumers. The results show that the demographics and social media usage show a significant correlation with consumers’ perceptions of the impact of social media on brand image.
Keywords: social media, branding, brand image
3
SEINÄJOEN AMMATTIKORKEAKOULU
Opinnäytetyön tiivistelmä
Koulutusyksikkö: Liiketoiminta ja kulttuuri
Tutkinto-ohjelma: Liiketalous
Suuntautumisvaihtoehto: Kansainvälinen kauppa
Tekijä: Tomi Jokinen
Työn nimi: Branding in Social Media and the Impact of Social Media on Brand Image
Ohjaaja: Miia Koski
Vuosi: 2016 Sivumäärä: 65 Liitteiden lukumäärä: 1
Tämän opinnäytetyön tarkoituksena on tarkastella, kuinka sosiaalista mediaa voidaan käyttää brändäämiseen, mitä tulisi ottaa huomioon käytettäessä sosiaalista mediaa brändäämiseen, sekä tutkia sosiaalisen median vaikutusta brändikuvaan verrattuna perinteiseen mediaan.
Käsitteitä jotka liittyvät brändäämiseen, sosiaaliseen mediaan ja lopuksi brändäämiseen sosiaalisessa mediassa, esitellään ja tarkastellaan opinnäytetyön teoreettisessa osuudessa. Opinnäytetyön empiirinen osuus koostuu määrällisestä kuluttajakyselystä, jonka kohderyhmänä ovat 15–64-vuotiaat suomalaiset.
Kyselyn tulokset osoittavat, että sosiaalisen median merkitys brändäämisen kannalta ja sen vaikutus brändikuvaan ovat yleisesti rinnastettavissa perinteisen median merkitykseen ja vaikutukseen. Merkittäviä eroja saattaa kuitenkin esiintyä kohderyhmänä olevasta kuluttajasegmentistä riippuen. Tulokset osoittavat, että demografian ja sosiaalisen median käytön sekä kuluttajien sosiaalisen median brändikuvaan kohdistuvien vaikutuksiin liittyvien mielikuvien välillä on merkittävä korrelaatio.
Asiasanat: sosiaalinen media, brändäys, brändikuva
4
TABLE OF CONTENTS
Thesis abstract .................................................................................... 2
Opinnäytetyön tiivistelmä ..................................................................... 3
TABLE OF CONTENTS ...................................................................... 4
Tables and Figures .............................................................................. 6
1 INTRODUCTION ............................................................................ 9
2 BRANDING ................................................................................... 10
2.1 Definition of a brand .................................................................................. 10
2.2 Branding .................................................................................................... 11
2.3 Brand equity .............................................................................................. 13
2.4 Brand identity ............................................................................................ 14
2.5 Brand image .............................................................................................. 15
2.6 Brand awareness ...................................................................................... 17
2.7 The differences of branding and marketing ............................................... 17
3 SOCIAL MEDIA ............................................................................ 19
3.1 Definition of social media .......................................................................... 19
3.2 Types of social media ............................................................................... 19
3.3 How social media differs from traditional media ........................................ 20
3.4 Prevalence of social media ....................................................................... 23
4 BRANDING IN SOCIAL MEDIA .................................................... 26
4.1 Overview ................................................................................................... 26
4.2 Advantages and disadvantages ................................................................ 26
4.3 Utilization of social media for branding purposes ...................................... 28
5 METHODOLOGY .......................................................................... 29
5.1 Research method ...................................................................................... 29
5.2 Implementation.......................................................................................... 29
5.3 Limitations ................................................................................................. 30
6 RESULTS ..................................................................................... 31
6.1 Response and respondent demographics ................................................. 31
5
6.2 Weighting .................................................................................................. 33
6.3 Media usage ............................................................................................. 35
6.4 Social media user activity and reach ......................................................... 40
6.5 Impact of social and traditional media on brand image ............................. 43
6.6 Comparison of attitudes on advertising by channel ................................... 51
6.7 Importance of brands’ social media activities to consumers ..................... 54
6.8 Influence on buying behavior .................................................................... 55
7 CONCLUSION .............................................................................. 57
8 RELIABILITY AND VALIDITY ....................................................... 59
BIBLIOGRAPHY ................................................................................ 60
APPENDICES ................................................................................... 65
6
Tables and Figures
Table 1. Population and sample age distribution and weights calculated using the
function T/A=W ..................................................................................................... 34
Table 2. Pearson correlation of age with brand image variables........................... 46
Table 3. Pearson correlation of time spent on social and traditional media with brand
image variables. .................................................................................................... 50
Figure 1. ‘The commodity slide’, decay from brand to commodity (De Chernatony et
al. 2011, 19) .......................................................................................................... 12
Figure 2. How brand equity is formed ................................................................... 14
Figure 3. Vertical engagement: one-directional (Blanchard 2011, 9) .................... 21
Figure 4. Vertical engagement: two-directional (Blanchard 2011, 10) ................... 22
Figure 5. Lateral engagement (Blanchard 2011, 11) ............................................. 22
Figure 6. Social networks by monthly active users (Barr 2013; Statista 2015a,
2015b; Socialbakers 2015; Kemp 2014; Vanderklippe 2015) ............................... 23
Figure 7. “Individuals who used the internet for participation in social networking,
2014 (% of individuals aged 16 to 74)” (Eurostat, 2015) ....................................... 24
Figure 8. Social media usage in Finland (MTV, Kurio and Laurea University of
Applied Sciences 2015, 3). ................................................................................... 25
Figure 9. Percentage of respondents per channel ................................................ 30
Figure 10. Completed responses and non-response ............................................ 31
Figure 11. Sample and population gender distribution .......................................... 32
Figure 12. Sample and population age distribution ............................................... 32
7
Figure 13. Percentage of social media users ........................................................ 35
Figure 14. Average of hours spent per day on social and traditional media .......... 35
Figure 15. Average of hours spent per day on social media by age group ........... 36
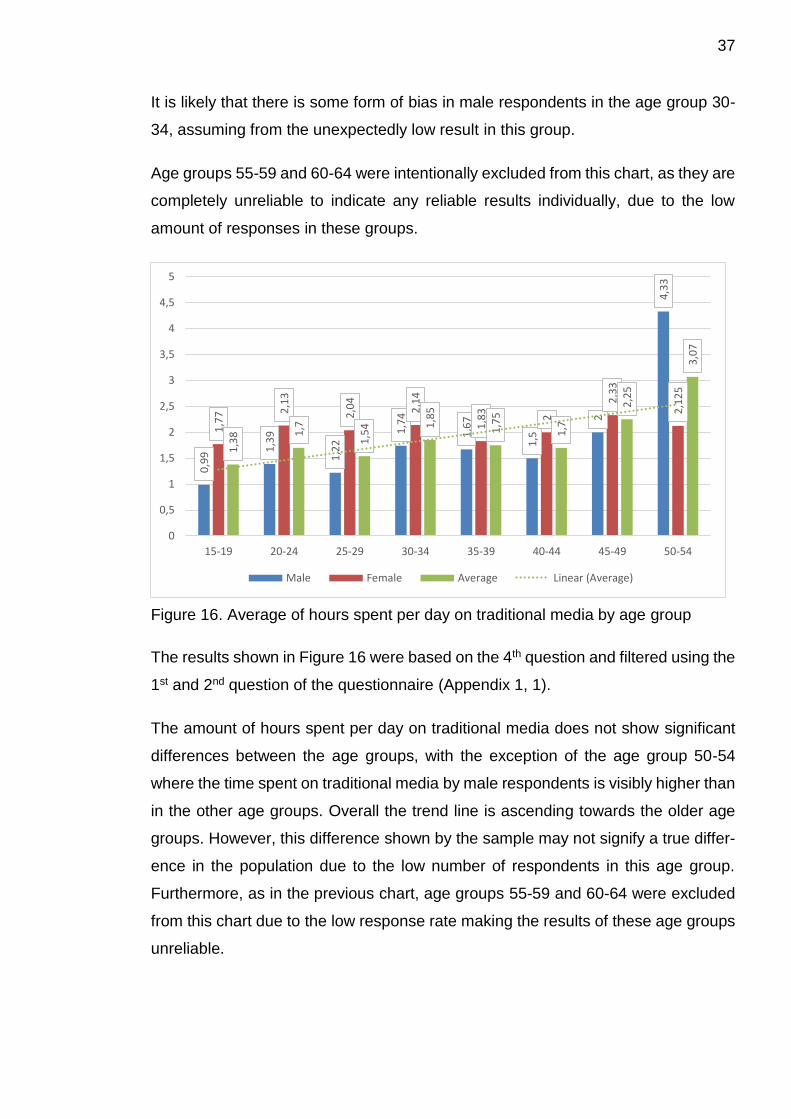
Figure 16. Average of hours spent per day on traditional media by age group ..... 37
Figure 17. Popularity of social media platforms by percentage of users ............... 38
Figure 18. User gender distribution of Reddit and Pinterest ................................. 39
Figure 19. User activity in the past 30 days in social media .................................. 40
Figure 20. Amount of ‘friends’ or ‘followers’ on primary social network ................. 41
Figure 21. Social media users who have ‘liked’ or ‘followed’ a brand because a friend
‘liked’ or ‘followed’ it .............................................................................................. 42
Figure 22. Social media users who have ‘liked’ or ‘followed’ a brand because a friend
‘liked’ or ‘followed’ it, by gender ............................................................................ 42
Figure 23. Consumer-perceived influence of social and traditional media presence
and non-presence on trust .................................................................................... 43
Figure 24. Consumer-perceived influence of social and traditional media on
functional and experiential brand image ............................................................... 44
Figure 25. Consumer-perceived influence of social and traditional media on brand
recall ..................................................................................................................... 45
Figure 26. Consumer-perceived influence of social and traditional media on positive
brand image .......................................................................................................... 46
Figure 27. Consumer-perceived influence of social and traditional media on
functional brand image by age group .................................................................... 47
Figure 28. Consumer-perceived influence of social and traditional media on
experiential brand image by age group ................................................................. 48
8
Figure 29. Consumer-perceived influence of social and traditional media on brand
recall by age group ............................................................................................... 48
Figure 30. Consumer-perceived influence of social and traditional media on positive
brand image by age group .................................................................................... 49
Figure 31. Consumer-perceived influence of social and traditional media on positive
brand image, by gender ........................................................................................ 50
Figure 32. Advertising channels by consumer-perceived irritation ........................ 52
Figure 33. Advertising channels by consumer-perceived usefulness.................... 53
Figure 34. Brand-activity on social media by consumer-perceived importance .... 54
Figure 35. Purchase decision influencers by consumer-perceived influence ........ 55
Figure 36. Percentage of consumers who bought a product after being exposed to
it first through social media in the past 30 days .................................................... 56
Figure 37. Percentage of consumers who bought a product after being exposed to
it first through traditional media in the past 30 days .............................................. 56
9
1 INTRODUCTION
The topic of the thesis is branding in social media and the impact of social media on
brand image. In the context of this thesis, branding is defined as the activities that
aim to enhance brand equity. Brand image refers to consumers’ perceptions of a
brand. The purpose of the thesis is to examine how social media can be used for
branding purposes and to research the impact of social media on brand image. The
thesis examines what things should be taken into consideration when using social
media for branding purposes and additionally it compares the usage of social media
to the usage of traditional media and the significance of social media to the signifi-
cance of traditional media as an influencer on brand image.
Therefore the research questions consist of the following: how can social media be
used for branding purposes, what should be taken into consideration when using
social media for branding purposes, and what is the impact of social media on brand
image in comparison to traditional media.
The topic is current and important to companies that operate in the consumer mar-
kets, and to some extent to those that operate in the business-to-business markets,
based on the idea that social media has become an important marketing channel
for brands, its impact on brand equity and brand image is significant, and due to its
nature it requires a different kind of approach in comparison to communication on
traditional media. It is important to know how significantly social media activities may
affect brand equity and brand image, so companies can allocate resources to it ac-
cordingly.
Branding and marketing are under an ongoing change because of new media chan-
nels: internet and social media. Strategies of marketing and branding are changing
when communication is becoming multi-directional and more consumer oriented.
This thesis examines the opportunities provided by social media in branding. One
of its goals is to answer the question, how can companies benefit from social media
in building a brand and what things to consider in building a brand on social media.
10
2 BRANDING
2.1 Definition of a brand
The definition of a brand is a unique name, term, words, sign, symbol, design, a
combination of these, or any other feature that identifies products and services of a
company and differentiates them from the competition. (Business Dictionary 2015;
American Marketing Association 2016)
According to Davis (2005, 26), brands aid the consumer to “select one product over
another in a complex world of increased choice”. Brands help consumers to identify
and choose products that they perceive as better in comparison to the alternatives.
The role of brands as a “guide to choice” has continued the same way to the modern
day since shortly after the brands were first begun to be used on livestock as a mark
of ownership (Clifton, Simmons and Ahmad, 2003, 14).
The aforementioned features describe the core idea of a brand. However, what has
changed is that now the concept of the brand has extended to cover something
more than just a symbol or a name representing a product. Brands no longer repre-
sent the mere tangible products and their features or characteristics – today brands
may represent things such as values, emotions and lifestyles.
Along with the contemporary concept of the brand, advertising has also changed
from product descriptions to advertisements that try to invoke emotions in consum-
ers and position the brand as representing something more than the product.
A brand is an intangible, but also a critical component of what a company represents
(Davis and Bojalil Rebora, 2002, 3). Brands with positive brand equity may set
higher prices for their products and services or earn more sales. Brands help com-
panies to create a connection with customers on an emotional level. For this reason,
many companies try to build unique and favorable strong brands (Kotler and Keller,
2012, 32).
The success of a brand depends on the experience that the consumer obtains from
it. A brand is successful if the consumers perceive it as better than the competition,
11
and fails if they do not (Weilbacher 1999, 22). In the era of social media, this is
becoming even more apparent, when communication is becoming more centered
on the consumer.
2.2 Branding
Branding consists of a company differentiating itself from its competition, by creating
a unique offer with tangible and intangible characteristics aimed at distinct target
markets, and more importantly combining these with an identifying name and image
that can be associated with quality and satisfaction. (Building a Brand, 2004, ii)
According to Miletsky and Smith (2009, 68), branding consists of two parts:
– The consistent fulfillment of the brand promise and raising of expecta-
tions.
– The development and assignment of distinct visual and personality-driven
characteristics and the ongoing effort to reflect the brand positively
through all marketing and communication vehicles.
(Miletsky and Smith 2009, 68)
The purpose of branding or brand building is to create and effectively communicate
a brand that is distinct from the competition, to which consumers have a strong
brand awareness and a positive brand image, which lead to brand equity.
Differentiating a brand from the competition is called brand positioning. Brand posi-
tioning consists of defining the brand’s distinct values, goals and qualities (Geel-
hoed, Samhoud and Hamurcu 2013, 125) and using these as a basis for creating a
brand that is perceived by consumers as distinct in comparison to competing
brands.
A strong brand is an important intangible asset which may have significant monetary
value. According to De Chernatony, McDonald and Wallace (2011, 8), it is estimated
that at least 20% of the value of businesses on major stock markets comes from
brands.
12
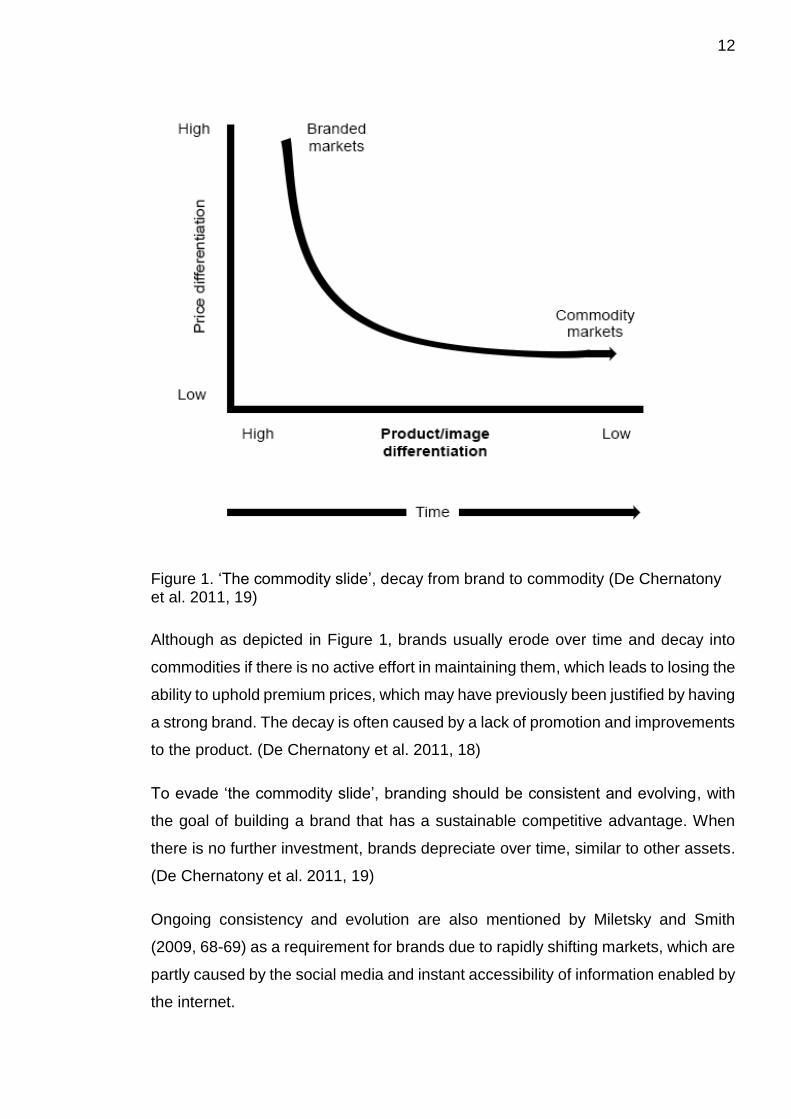
Figure 1. ‘The commodity slide’, decay from brand to commodity (De Chernatony et al. 2011, 19)
Although as depicted in Figure 1, brands usually erode over time and decay into
commodities if there is no active effort in maintaining them, which leads to losing the
ability to uphold premium prices, which may have previously been justified by having
a strong brand. The decay is often caused by a lack of promotion and improvements
to the product. (De Chernatony et al. 2011, 18)
To evade ‘the commodity slide’, branding should be consistent and evolving, with
the goal of building a brand that has a sustainable competitive advantage. When
there is no further investment, brands depreciate over time, similar to other assets.
(De Chernatony et al. 2011, 19)
Ongoing consistency and evolution are also mentioned by Miletsky and Smith
(2009, 68-69) as a requirement for brands due to rapidly shifting markets, which are
partly caused by the social media and instant accessibility of information enabled by
the internet.
13
2.3 Brand equity
Brand equity means the additional monetary value that a company may gain from
having a branded product in comparison to a situation where a company has a non-
branded although otherwise identical product or service. Brand equity may be pos-
itive or negative. (Investopedia 2003; Mohsin 2009, 8)
Virtually all products have names or symbols that identify them, but if they do not
have positive brand equity attached to them, they are not truly brands. They may be
called brands, but if they have no positive brand equity, they are not fulfilling the
purpose of having a brand.
Brand equity is formed by the non-price or feature related value and perceived qual-
ity of the product (Mohsin 2009, 8). Brands do not have any value if they do not have
positive brand equity. Therefore brands must project an intangible value to the con-
sumers, to fulfill their purpose.
Brand equity is what makes branded products different from commodity products.
To gain brand equity, brands must communicate things such as values, emotions,
lifestyle, status; something more than just a product name and functionality. (Mohsin
2009, 8)
According to Mohsin (2009, 8) “brands create a perception in the mind of the cus-
tomer that there is no other product or service on the market that is quite like yours”.
These consumer perceptions on brands create brand equity. When the perceptions
are positive, the brand is valuable.
14
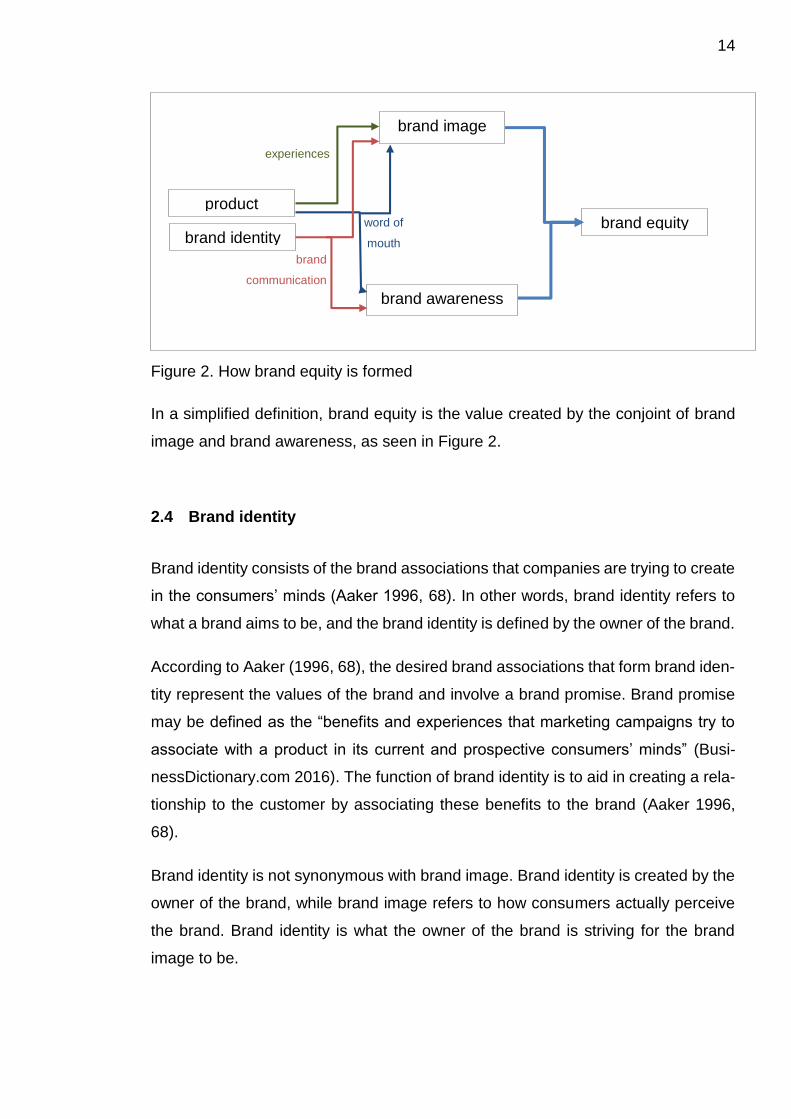
Figure 2. How brand equity is formed
In a simplified definition, brand equity is the value created by the conjoint of brand
image and brand awareness, as seen in Figure 2.
2.4 Brand identity
Brand identity consists of the brand associations that companies are trying to create
in the consumers’ minds (Aaker 1996, 68). In other words, brand identity refers to
what a brand aims to be, and the brand identity is defined by the owner of the brand.
According to Aaker (1996, 68), the desired brand associations that form brand iden-
tity represent the values of the brand and involve a brand promise. Brand promise
may be defined as the “benefits and experiences that marketing campaigns try to
associate with a product in its current and prospective consumers’ minds” (Busi-
nessDictionary.com 2016). The function of brand identity is to aid in creating a rela-
tionship to the customer by associating these benefits to the brand (Aaker 1996,
68).
Brand identity is not synonymous with brand image. Brand identity is created by the
owner of the brand, while brand image refers to how consumers actually perceive
the brand. Brand identity is what the owner of the brand is striving for the brand
image to be.
brand identity
brand image
brand awareness
product
brand equity
experiences
brand
communication
word of
mouth
15
2.5 Brand image
The brand image is what and how a group of consumers subjectively perceive the
brand to be. (Riezebos, Kist and Kootstra, 2003, 63; Parameswaran, 2006, 123-
124; Wilson and Blumenthal, 2008, 58; Management Study Guide, 2016)
Brand image is formed by various brand associations that consumers develop in
their mind (Management Study Guide, 2016), which can be classified into three cat-
egories:
1. attributes
2. benefits
3. attitudes
(Keller 1993, 4)
Attributes are features which the consumer thinks a product or service has. There
are two kinds of attributes, product-related and non-product-related attributes. The
former relate to the function of the product or service, and the latter are the aspects
related to its purchase or consumption, which are not directly related to the perfor-
mance or function of the product or service. (Keller 1993, 4)
Keller (1993, 4) lists four types of non-product-related attributes:
1. Price information
2. Packaging or product appearance information
3. User imagery (i.e., what type of person uses the product or service)
4. Usage imagery (i.e., where and in what types of situations the product or
service is used).
Price is considered to be an important non-product-related attribute because of the
relation between price and perceived value of a brand. (Blattberg and Wisniewski
1989, according to Keller 1993, 4)
Packaging and product appearance are classified as non-product-related attributes
as they are not directly related to product performance. (Keller 1993, 4)
16
User and usage imagery are formed from a consumer’s experiences, word of mouth,
or from how the target market is depicted in brand advertising. (Keller 1993, 4)
Keller (1993, 4) describes benefits as something that “consumers think a product or
service can do for them”.
There are three categories of benefits:
1. functional benefits
2. experiential benefits
3. symbolic benefits
(Park, Jaworski, and MacInnis 1986, according to Keller 1993, 4)
Functional benefits are the most basic benefits of the product or service. These
benefits are related to the basic needs (Maslow 1970, according to Keller 1993, 4)
and aim to remove or avoid a problem (Fennell 1978; Rossiter and Percy 1987,
according to Keller 1993, 4).
According to Keller (1993, 4), experiential benefits “satisfy experiential needs such
as sensory pleasure, variety, and cognitive stimulation” and they are about the ex-
perience of using a product or service; what it feels like.
Symbolic benefits, unlike functional and experiential benefits, are often linked to
non-product-related attributes. Symbolic benefits may respond to needs such as
“social approval or personal expression and outer-directed self-esteem”. (Keller
1993, 4)
Brand attitudes indicate the evaluations made by consumers about a brand (Wilkie
1986, according to Keller 1993, 4). Brand attitudes consist of:
– The beliefs a consumer has about a product or service (i.e., the extent to
which consumers think the brand has certain attributes or benefits)
– The evaluative judgment of those beliefs (i.e., how good or bad those at-
tributes or benefits are)
(Keller 1993, 4)
17
Brand images cannot be created by companies, instead they are formed by con-
sumers (Management Study Guide, 2016). However, companies may try to influ-
ence the brand image to move towards their desired brand image through marketing
and brand building.
2.6 Brand awareness
Brand awareness is a very important factor in brand equity, and increasing brand
awareness is usually one of the most important goals of branding. For new brands,
it should be the first step in building a brand (Kapferer 2012, 188).
While brand image consists of the associations that a consumer links to a brand
(Keller 1993), brand awareness is the consumer’s ability to recall and recognize a
brand (Rossiter and Percy 1987). Brand awareness therefore consists of two sepa-
rate types: brand recall and brand recognition (Percy and Rossiter 1992, 264).
Brand recognition refers to the consumer’s ability to recognize a brand when pre-
sented with a visual or a verbal cue. Brand recall on the other hand refers to the
consumer’s ability to remember a brand name when thinking about the category it
is linked to. (Percy and Rossiter 1992, 265)
2.7 The differences of branding and marketing
There exists some confusion over the concepts of branding and marketing as their
meanings seem to overlap each other in some ways and sometimes the terms are
used almost interchangeably. To understand the differences between branding and
marketing, first it must be understood what marketing is.
Miletsky and Smith (2009, 69) define marketing as “the act of bringing a product,
service, company, or brand to market”. Marketing is considered to be an important
part of any business by virtually all authors in this field. Most successful modern
organizations are strongly market oriented and dedicated to meeting customers’
needs in distinct target markets. (Armstrong et al. 2014, 4)
18
According to Armstrong et al. (2014, 4), the goal of marketing is to communicate a
value proposition to gain new customers and to maintain existing customers by
matching or surpassing their expectations. Kotler (2015) defines marketing as the
activities that identify needs of a target market and create and deliver value to satisfy
them while creating a profit.
Marketing is not a function that is separate from other business activities, rather than
the whole business seen from the customer’s point of view (Armstrong et al. 2014,
4). Kotler (2015) seems to support this notion by pointing out that the marketing
activities of an organization should be present in all its activities instead of being
performed in a single department.
According to Miletsky and Smith (2009, 69) brands require marketing “to spread the
word to larger audiences, help increase recognition, and embed expectations in
consumers’ minds”. In other words marketing is a function that is needed to imple-
ment the brand strategy. However, as it was mentioned, marketing is a vast concept
that also includes many other elements.
19
3 SOCIAL MEDIA
3.1 Definition of social media
Social media is composed of those interactive platforms on the internet, which may
be web or mobile-based, that involve user-generated content and their main pur-
pose is social interaction. They often gather people who share common interests. It
is essential that these pages are interactive; the interaction is bi- or multidirectional.
Characteristically the communication on these websites happens as individual peo-
ple. (Cite 2012; Nations 2012; Turban et al. 2015, 18; Durango 2015, 10)
3.2 Types of social media
Social media is an umbrella term that consists of various types of social media. In
some cases it may be difficult to determine whether a website, application or plat-
form fits the definition of social media or not.
Often the word social media is used synonymously with online social networks to
refer to websites such as Facebook, Google+ and LinkedIn. However, the extensive
concept of social media also includes other types, such as blogging, micro-blogging,
online rating, social news, social bookmarking, forum, and various multimedia plat-
forms (Cite 2012; Grahl 2016). Many social media platforms combine elements from
two or more of these categories (Cite 2012).
Social networks are web-based applications or platforms that allow communication
between users, which may be through information, comments, messages, images
or other types of communication (Oxford Dictionaries 2016a). Social networks in-
clude websites like Facebook, Google+ and LinkedIn, and usually user profiles are
a key part of the platform (Cite 2012). These are the type of social media that are
most often discussed and referred to when the term social media is used.
Blogs are websites that are updated regularly (Oxford Dictionaries 2016b) which
consists of articles. They are usually focused on a specific topic or an individual
blogger’s life in general (Cite 2012). What makes blogs social, is the ability to make
20
comments on blog posts. It is difficult to determine if individual blogs should be clas-
sified as social media. They involve social interaction and user-generated content,
but individual blogs do not characteristically form communities by themselves, in-
stead the discussion is focused only on specific blog posts created by the author of
the blog. However, blogging platforms such as WordPress and Blogger fit the defi-
nition of social media better.
Microblogs include websites like Twitter and Tumblr (Cite 2012). Microblogging ser-
vices center on short posts (Grahl 2016), which may consist of text, images or video
that usually appear to other users who have ‘followed’ the user who is sharing the
post (Cite 2012).
Forums and message boards are most likely the oldest form of (Cite 2012), and
predate the use of the term, social media. The function of forums and message
boards is to provide a platform for conversations by members (Grahl 2016) and the
conversation usually revolves around some specific topic (Cite 2012).
Media sharing platforms allow their users to upload, share and view media content,
which is usually pictures or video (Grahl 2016). Media sharing platforms include
YouTube and Instagram for example (Cite 2012).
Social media platforms and social media as a concept is continuously evolving.
Hence this list of subcategories of social media is not intended to be comprehensive,
instead it only covers the most common types of social media. There exists also
other types of social media, and new types of social media are being formed contin-
uously, which may not fit into any of the previously mentioned subcategories.
3.3 How social media differs from traditional media
Traditional media consists of media such as television, print, radio, direct mail and
outdoor, which are conventional forms of advertising (Quilici, 2011). Advertising in
traditional media involves many challenges including the large amount of valueless
contacts, high expenses, and the diminishing impact related to the changes of media
behavior and the digital revolution (Karjaluoto 2010, 108-109).
21
Traditional media relies on a one-to-many model. The brand message is created
and communicated to a mass audience through traditional media channels, as a
one-way communication. This one-way communication is not as effective in creating
engagement or promoting word of mouth, in comparison to social media. (Hausman,
2014)
Blanchard (2011, 9) calls this one-way communication form of traditional media, as
seen in Figure 3, one-directional vertical engagement. It is also known as the
sender-message-receiver model (Smith, Pulford and Berry 1999, 23).
Figure 3. Vertical engagement: one-directional (Blanchard 2011, 9)
Social media is multidirectional and real-time, and it enables necessity-based com-
munication and use of content, in the desired moment in time and in the desired
quantity. The internet and social media contravene the traditional media communi-
cation model and change the rules of communication markets. (Juslén 2009). On
social media users can engage in direct conversation with brands and with each
other, which makes it a good platform for relationship and word-of-mouth marketing.
When Web 2.0 was introduced, it changed the communication to two-directional; it
enabled a dialogue between users and organizations. This two-directional vertical
engagement can be seen in Figure 4. (Blanchard, 2011, 10)
ORGANIZATION
CONSUMERS
22
Figure 4. Vertical engagement: two-directional (Blanchard 2011, 10)
Today social media allows users to share content, links, comments, and post their
opinions that reach a multitude of other users rapidly. This lateral engagement can
be seen in Figure 5. (Blanchard 2011, 11)
Figure 5. Lateral engagement (Blanchard 2011, 11)
ORGANIZATION
CONSUMERS
ORGANIZATION
CONSUMERS
23
3.4 Prevalence of social media
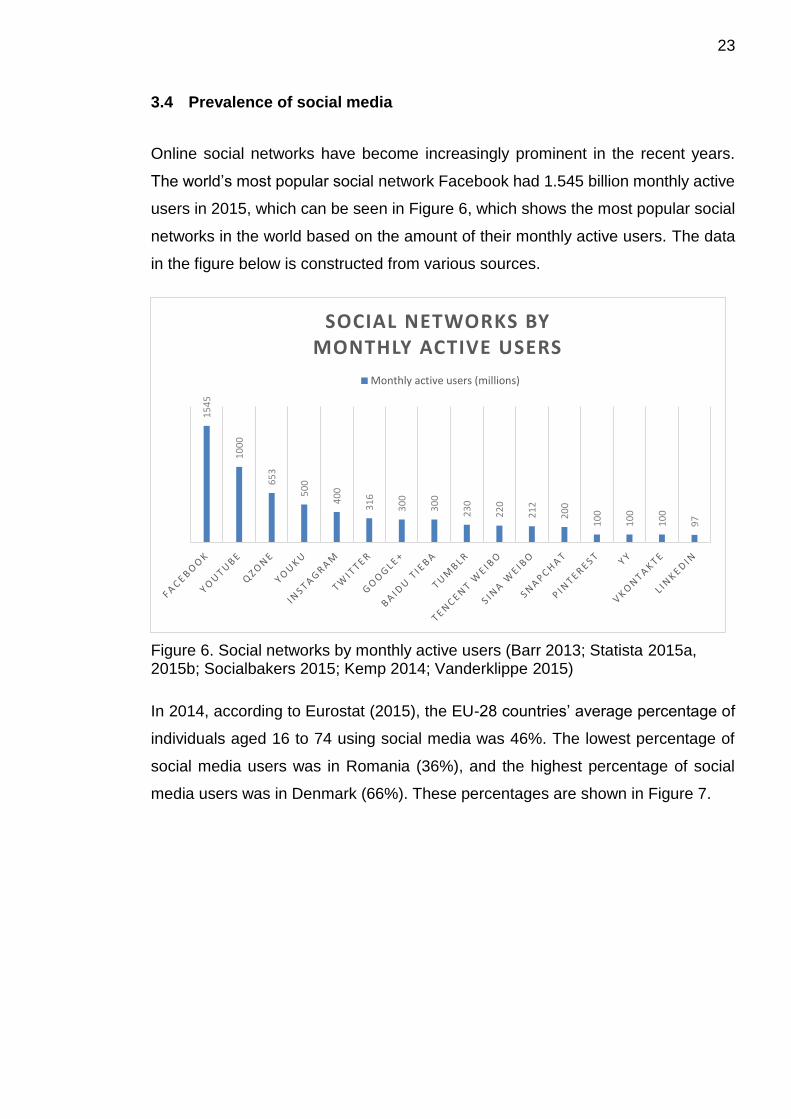
Online social networks have become increasingly prominent in the recent years.
The world’s most popular social network Facebook had 1.545 billion monthly active
users in 2015, which can be seen in Figure 6, which shows the most popular social
networks in the world based on the amount of their monthly active users. The data
in the figure below is constructed from various sources.
Figure 6. Social networks by monthly active users (Barr 2013; Statista 2015a, 2015b; Socialbakers 2015; Kemp 2014; Vanderklippe 2015)
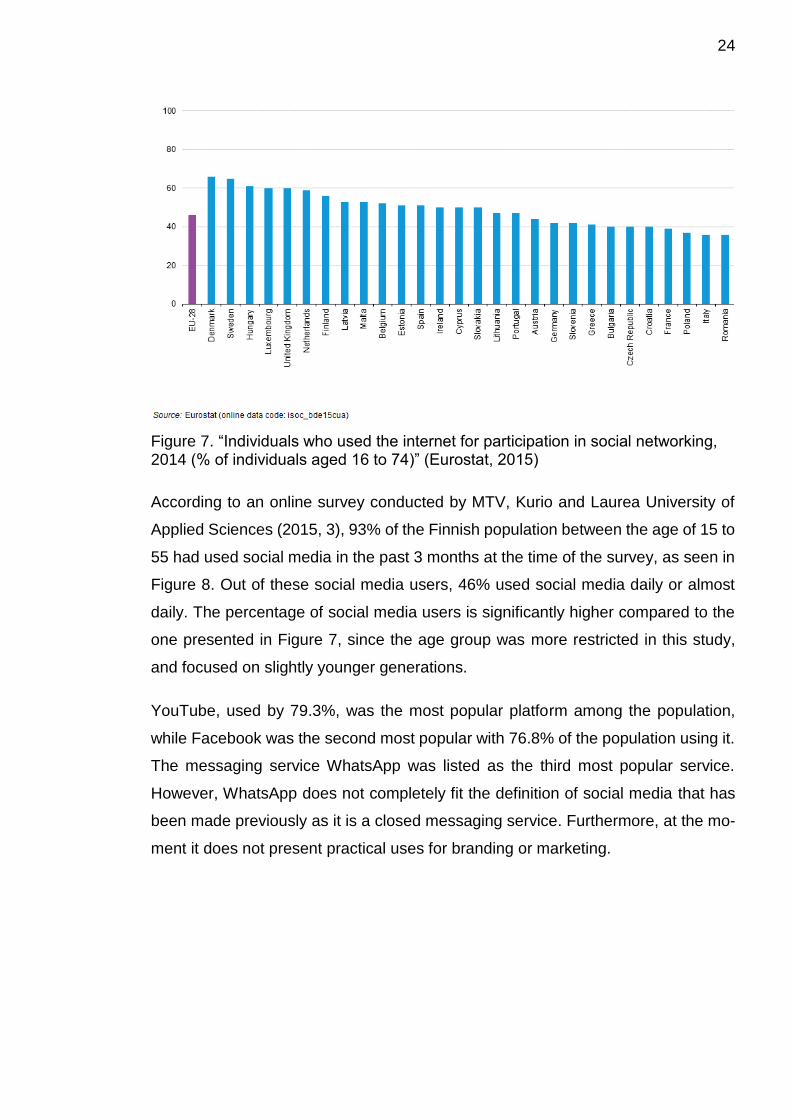
In 2014, according to Eurostat (2015), the EU-28 countries’ average percentage of
individuals aged 16 to 74 using social media was 46%. The lowest percentage of
social media users was in Romania (36%), and the highest percentage of social
media users was in Denmark (66%). These percentages are shown in Figure 7.
15
45
10
00
65
3
50
0
40
0
31
6
30
0
30
0
23
0
22
0
21
2
20
0
10
0
10
0
10
0
97
SOCIAL NETWORKS BYMONTHLY ACTIVE USERS
Monthly active users (millions)
24
Figure 7. “Individuals who used the internet for participation in social networking, 2014 (% of individuals aged 16 to 74)” (Eurostat, 2015)
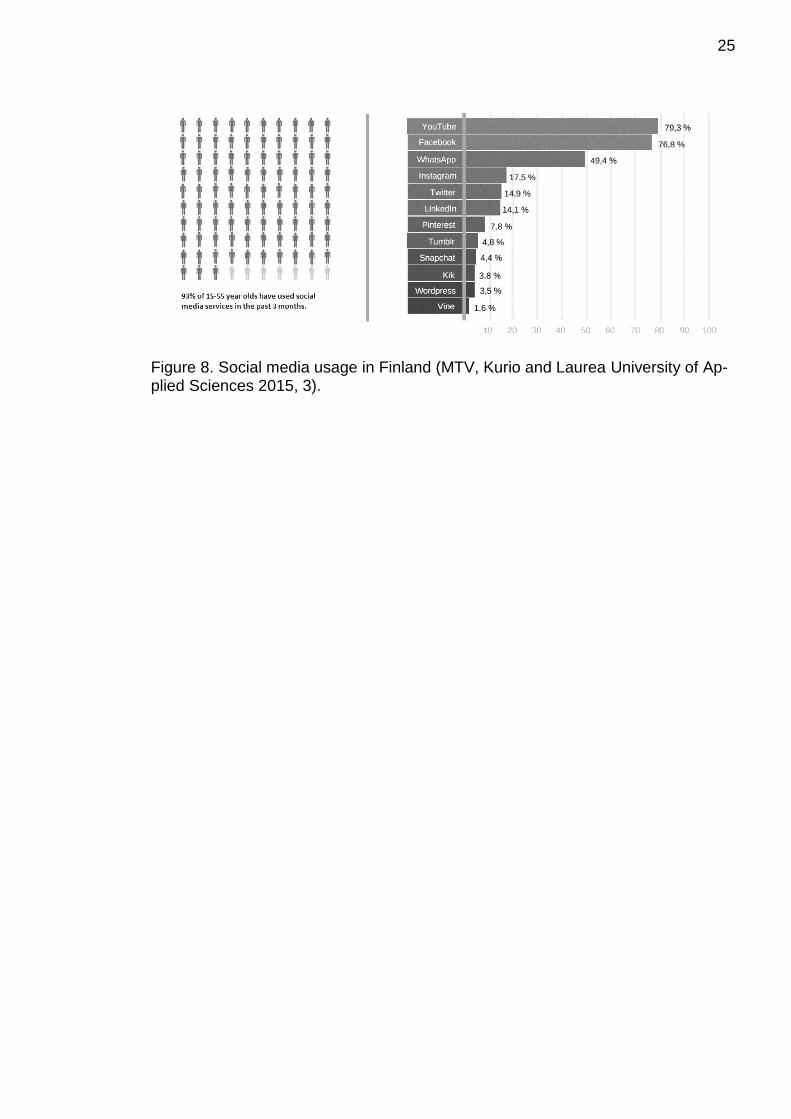
According to an online survey conducted by MTV, Kurio and Laurea University of
Applied Sciences (2015, 3), 93% of the Finnish population between the age of 15 to
55 had used social media in the past 3 months at the time of the survey, as seen in
Figure 8. Out of these social media users, 46% used social media daily or almost
daily. The percentage of social media users is significantly higher compared to the
one presented in Figure 7, since the age group was more restricted in this study,
and focused on slightly younger generations.
YouTube, used by 79.3%, was the most popular platform among the population,
while Facebook was the second most popular with 76.8% of the population using it.
The messaging service WhatsApp was listed as the third most popular service.
However, WhatsApp does not completely fit the definition of social media that has
been made previously as it is a closed messaging service. Furthermore, at the mo-
ment it does not present practical uses for branding or marketing.
25
Figure 8. Social media usage in Finland (MTV, Kurio and Laurea University of Ap-plied Sciences 2015, 3).
26
4 BRANDING IN SOCIAL MEDIA
4.1 Overview
Social media is used to gain the attention and involvement of consumers by many
brands around the world (Graves 2016). According to Celaya (2008, 85-88), when
companies include social media programs in their marketing, the main return they
are looking for is to improve the interaction with their clients and to increase their
sales. In addition to this, social media has many uses in branding. According to
Pozin (2014, 2), social media is important for “branding, acquisition, and retention”.
The importance of including a social media in branding strategy is the fact that the
amount of active social media users is already large and growing. Through the in-
troduction of smartphones, social media has become mobile and ever-present, mak-
ing presence on social media important to brands.
Some of the most important aspects of social media from a branding and marketing
perspective, are that the users are in control of the content they view, share, create,
or comment on, and marketing efforts are inexpensive, highly measurable and tar-
getable in comparison to traditional media.
However, this does not mean imply that advertising on traditional media is outdated.
Instead, traditional media and online media such as social networks should be used
as mutually supporting channels in marketing campaigns. One of the benefits of
traditional mass media come from its effectiveness in creating brand awareness fast
in the general audience.
4.2 Advantages and disadvantages
Social media’s perhaps greatest advantage is the low or non-existing cost and low
amount of resources required to have a social media presence. Therefore social
media has opened up more possibilities especially for small businesses.
27
According to Montero Torres (2015, 3-4), through social networking sites, brands
may have direct conversations and interactions with individuals. This type of per-
sonal interaction may create and strengthen brand loyalty towards brands that are
actively participating in conversations on social media.
Word-of-mouth now exists in social media in the same way it exists in real life, but
the difference is that the reach of one consumer’s opinions is exponentially greater
than it would be outside of social media. However, this means that negative word-
of-mouth will also have more reach on social media.
According to Turban et al. (2008, 847), social media often allows precise targeting
to the desired demographic or target market. For instance discussion forums often
serve some specific group of people, and sub-categories allow targeting subgroups
of subgroups.
Facebook is one of the social media platforms that have developed the targeting
capability in advertising on their platform to a great extent and it is a key factor to
their business model. On Facebook, the advertiser can easily and accurately target
their advertisements based on segments including but not limited to age, gender,
geolocation, and interests (Facebook 2015).
The measurability of social media and the data it provides is a huge advantage.
According to Graves (2016), data obtained from social media may be used to gain
valuable insights on for example brand perceptions, or to help in creating more ef-
fective strategies. For example, it is possible monitor and analyze the brand in real
time in various ways by using data from social media, or to “scan and interpret” the
posts made by users on social media enabling the designing of marketing cam-
paigns that are very accurately targeted based on the segmentation of audiences
on very deep levels (Graves 2016).
It may be argued that traditional mass media is more powerful than social media in
creating brand awareness due to the reach of large mass media campaigns. How-
ever, the drawback of creating brand awareness through advertising in traditional
mass media is the lack of accurate targeting possibilities and measurability, and
therefore inevitably some undefined percentage of the consumers reached by the

28
advertising is not part of the target audience. Campaigns with the intention of creat-
ing brand awareness are only successful for the parts that reach the correct audi-
ence.
4.3 Utilization of social media for branding purposes
Social media may help to strengthen or change brand image, but in order to benefit
from the power of social media, brands need to manage and enact their presence
constantly (Pozin 2014, 2-3).
Brands may seek customer acquisitions by taking part in social media activities,
such as discussions, that promote the brand to be associated with relevant themes
and brands whose audiences are similar as the target market (Pozin 2014, 2). They
key to new customer acquisitions is content that is interesting to the users, and par-
ticipating on discussions on social media (Pozin 2014, 1).
According to Pozin (2014, 3) social media is very useful for creating and maintaining
brand loyalty by managing the relationships with the users who are already custom-
ers of the brand. For example, social media may be utilized for customer service
purposes (Pozin 2014, 3).
Brands should be consistent in their style of communication on different social media
platforms, while customizing the content to match the characteristics of each plat-
form (Pozin 2014, 1). The communication should be consistent in visual and textual
style. According to Perkins (2014), consistency in the colors which are used on so-
cial media “will help consumers become familiar with your brand”. In other words,
visual consistency helps in creating brand recognition, with the assumption that the
colors match to the overall brand visuals.
According to Perkins (2014), visual content may be used to boost user engagement
on social media. Posts that include pictures or video are shared more often than
content that does not include visual elements (Pozin 2014, 1). Having a well-planned
“visual branding strategy” benefits companies on social media (Perkins 2014).
29
5 METHODOLOGY
5.1 Research method
The method of research chosen for this study was quantitative. Quantitative ap-
proach was chosen in order to produce comparable data about the usage of social
media and traditional media and consumer perceptions on branding in these chan-
nels.
Quantitative research approach was chosen as appropriate for collecting a sufficient
amount of data that was intended to be suitable for statistical analysis and interpre-
tation (London School of Economics and Political Science 2010).
5.2 Implementation
The data was collected through an online questionnaire. The questionnaire con-
sisted of 56 closed-ended questions (Appendix 1) and the goal of the questionnaire
was to find out how strong is the potential impact of social media on brand image
and brand awareness in comparison to traditional media.
The population for this research was Finnish consumers between the age of 15 and
64. The size of the population is 3,483,757 (Tilastokeskus 2016). The goal was to
make the sample as large and representative as possible. The target sample size
was defined as 385 based on a 95% confidence level and 5% margin of error, cal-
culated using normal distribution.
Various channels were used to gather respondents for the questionnaire in an at-
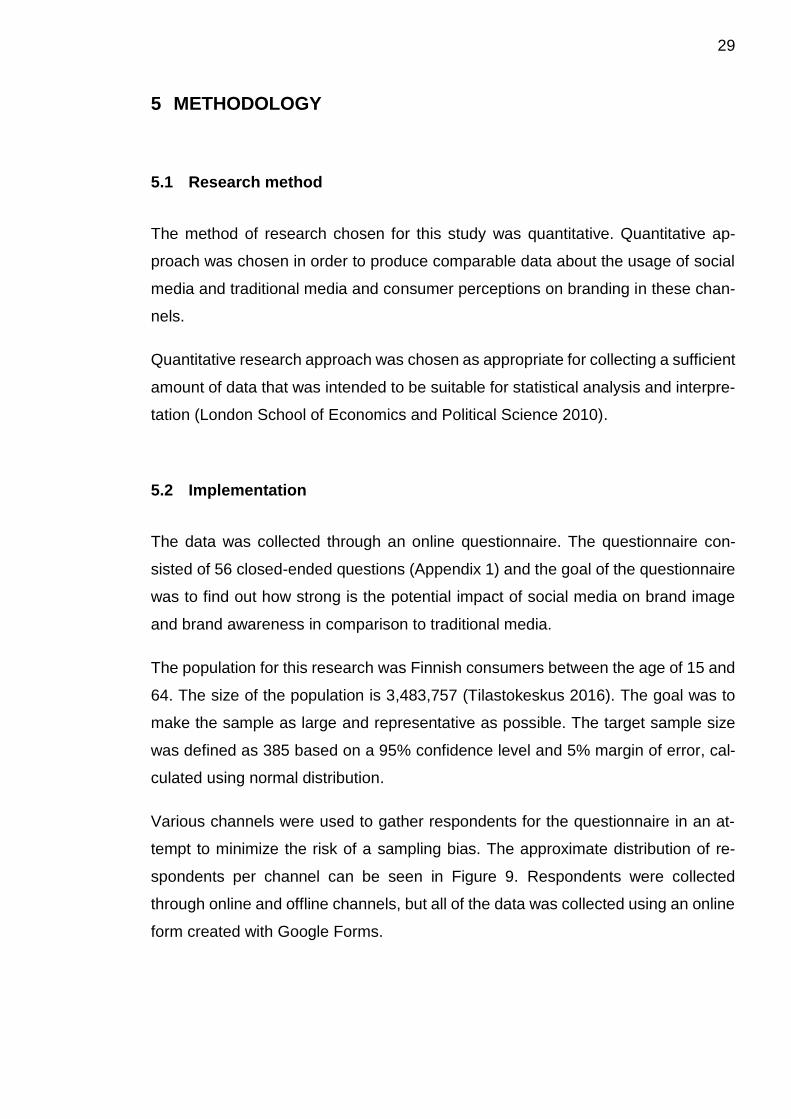
tempt to minimize the risk of a sampling bias. The approximate distribution of re-
spondents per channel can be seen in Figure 9. Respondents were collected
through online and offline channels, but all of the data was collected using an online
form created with Google Forms.
30
The achieved sample size was 166 respondents. This means that the margin of
error is within 8% with a confidence level of 95%, using normal distribution for cal-
culation.
The analysis of data was performed using the PSPP software.
Figure 9. Percentage of respondents per channel
5.3 Limitations
Due to the abstract nature of some of the concepts that were studied in this re-
search, it was somewhat difficult to determine what were the relevant variables that
are related to the subject of the study and what questions could be used to accu-
rately measure these variables in a questionnaire that was sent to consumers.
The research data was based on a consumer survey, hence all of the data is self-
reported by the respondents. The limitation of this is that respondents might some-
times not answer questions in a way that corresponds with reality.
The quantitative research method is not very capable of enabling the formation of
more insightful explanations behind a certain behavior (Madrigal and McClain 2012).
In addition to this, even with the total 56 questions of the questionnaire, it was not
possible to cover the research subject from all possible points of view.
Another limitative factor was the time constraint in the gathering of the data. The
responses of the questionnaire were gathered in a time frame of five days, which
contributed to the non-response and limited the size of the sample.
32,80%
52,90%
14,30%
Unknown (e-mail, direct, offline) Social media Other online sources
31
6 RESULTS
6.1 Response and respondent demographics
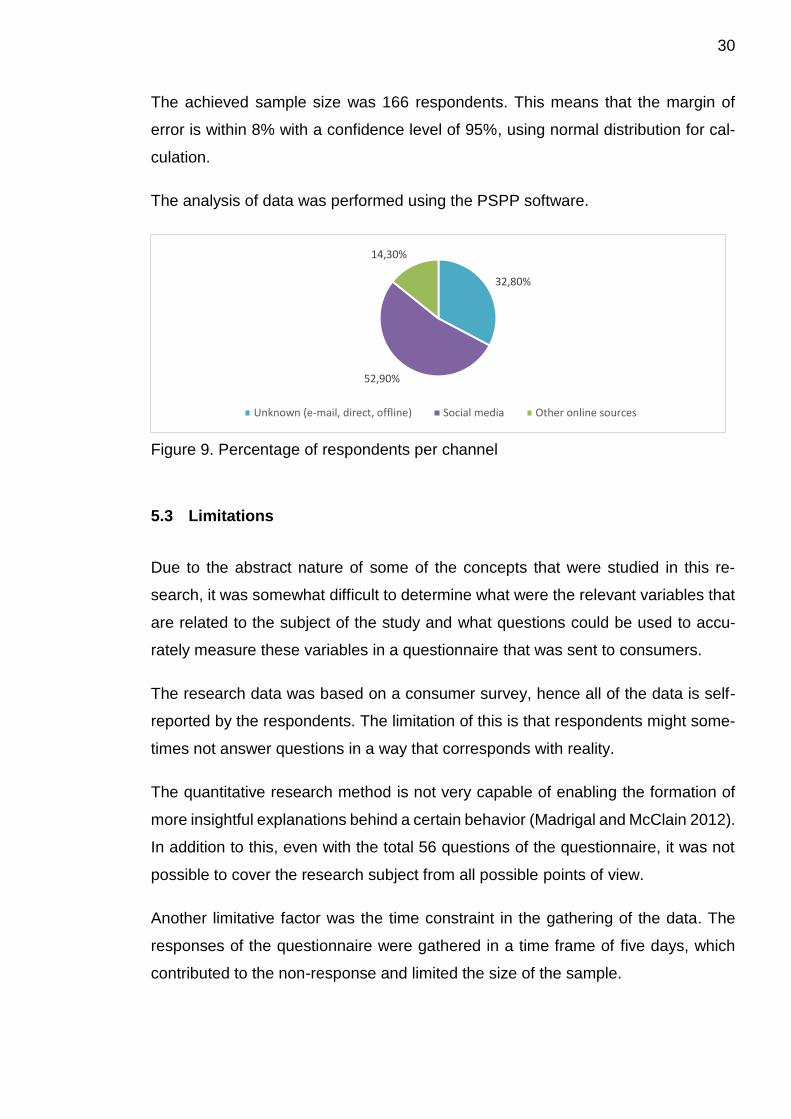
The survey was sent out to approximately 421 people. The non-response rate was
61%. In other words, the completion rate of the survey was 39%. The aforemen-
tioned information is shown in Figure 10.
The total amount of completed responses was 166. With a sample consisting of 166
respondents and a population of 3,483,757 (Tilastokeskus 2016) the margin of error
is within 8% with a 95% confidence level, using normal distribution.
Figure 10. Completed responses and non-response
The responses were examined and subsequently two respondents were removed
from the dataset. One of the respondents was removed from the dataset due to
invalid answers. The other removed respondent belonged to the age group ‘65 or
over’ and thus did not belong to the population of the survey. The resulting total of
164 valid cases still fits in the previously presented error margin.
The demographics section of the questionnaire consisted of two questions: gender
and age; the 1st and 2nd questions of the questionnaire, respectively (Appendix 1,
1). Including more socio-demographic questions may provide more insights (Do-
bronte 2013), but these questions were decided to be sufficient in regard to the
purpose of this research and to avoid unnecessarily lengthening the questionnaire.
39%
61%
Completed responses Non-response
32
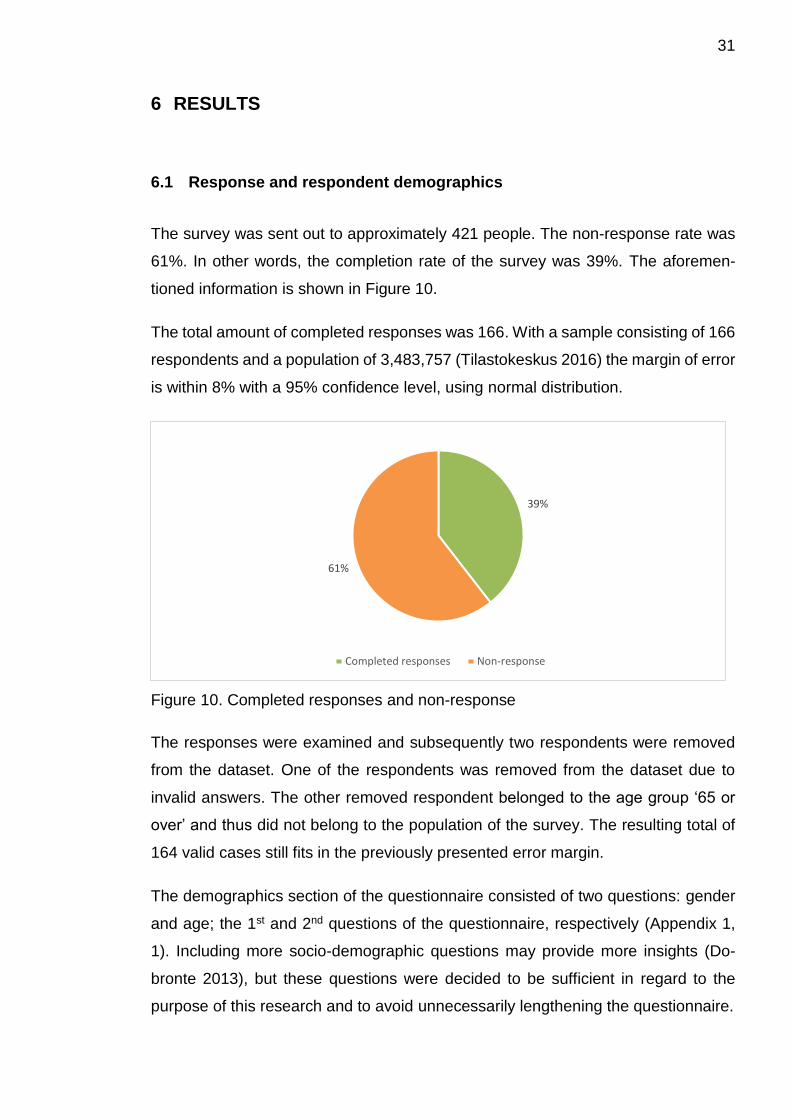
Figure 11. Sample and population gender distribution
The results presented in Figure 11 are based on the 1st question of the question-
naire, which asked the gender of the respondents (Appendix 1, 1).
The gender distribution of the sample was 41% female and 59% male, while the
gender distribution of the population is 49% female and 51% male, which is shown
in Figure 11. This means that there was an over-representation of male respondents
in the sample. In the presentation of the results, this is accounted for by presenting
separate results for male and female respondents when appropriate.
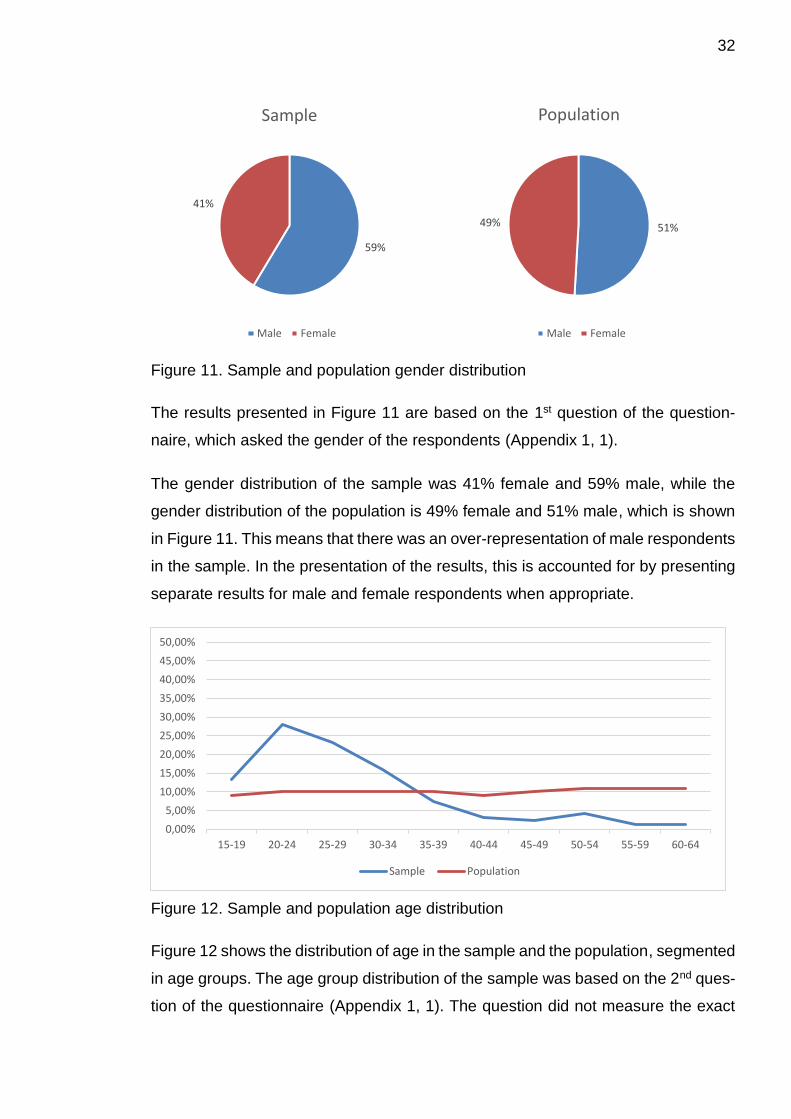
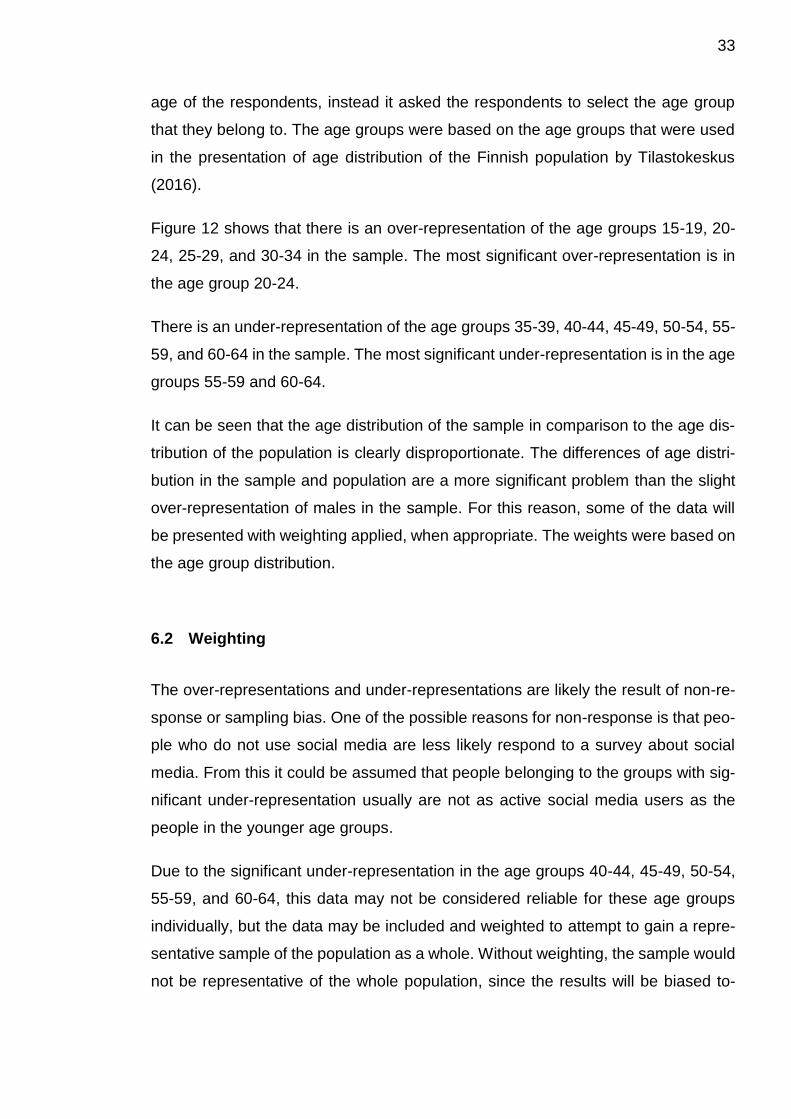
Figure 12. Sample and population age distribution
Figure 12 shows the distribution of age in the sample and the population, segmented
in age groups. The age group distribution of the sample was based on the 2nd ques-
tion of the questionnaire (Appendix 1, 1). The question did not measure the exact
59%
41%
Sample
Male Female
51%49%
Population
Male Female
0,00%
5,00%
10,00%
15,00%
20,00%
25,00%
30,00%
35,00%
40,00%
45,00%
50,00%
15-19 20-24 25-29 30-34 35-39 40-44 45-49 50-54 55-59 60-64
Sample Population
33
age of the respondents, instead it asked the respondents to select the age group
that they belong to. The age groups were based on the age groups that were used
in the presentation of age distribution of the Finnish population by Tilastokeskus
(2016).
Figure 12 shows that there is an over-representation of the age groups 15-19, 20-
24, 25-29, and 30-34 in the sample. The most significant over-representation is in
the age group 20-24.
There is an under-representation of the age groups 35-39, 40-44, 45-49, 50-54, 55-
59, and 60-64 in the sample. The most significant under-representation is in the age
groups 55-59 and 60-64.
It can be seen that the age distribution of the sample in comparison to the age dis-
tribution of the population is clearly disproportionate. The differences of age distri-
bution in the sample and population are a more significant problem than the slight
over-representation of males in the sample. For this reason, some of the data will
be presented with weighting applied, when appropriate. The weights were based on
the age group distribution.
6.2 Weighting
The over-representations and under-representations are likely the result of non-re-
sponse or sampling bias. One of the possible reasons for non-response is that peo-
ple who do not use social media are less likely respond to a survey about social
media. From this it could be assumed that people belonging to the groups with sig-
nificant under-representation usually are not as active social media users as the
people in the younger age groups.
Due to the significant under-representation in the age groups 40-44, 45-49, 50-54,
55-59, and 60-64, this data may not be considered reliable for these age groups
individually, but the data may be included and weighted to attempt to gain a repre-
sentative sample of the population as a whole. Without weighting, the sample would
not be representative of the whole population, since the results will be biased to-
34
wards the younger age groups. On the other hand, due to the small amount of re-
sponses in the under-represented age groups, weighting in this case will probably
lead to the results being unreliable.
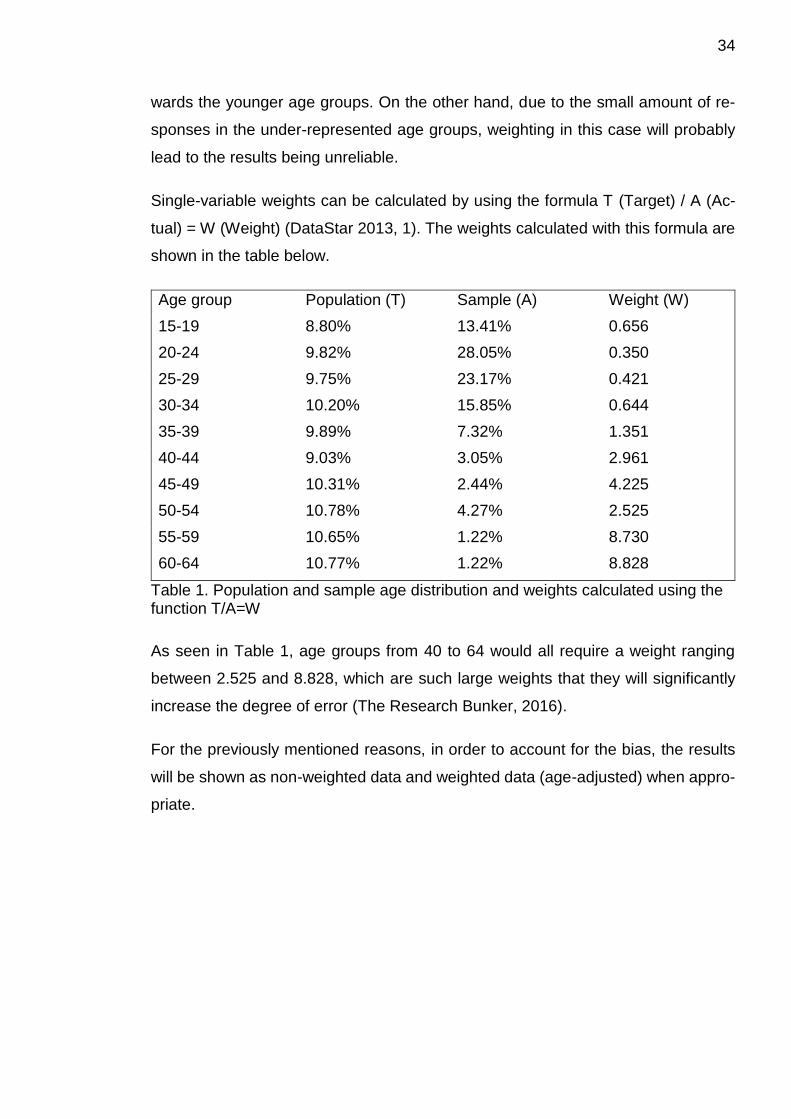
Single-variable weights can be calculated by using the formula T (Target) / A (Ac-
tual) = W (Weight) (DataStar 2013, 1). The weights calculated with this formula are
shown in the table below.
Age group Population (T) Sample (A) Weight (W)
15-19 8.80% 13.41% 0.656
20-24 9.82% 28.05% 0.350
25-29 9.75% 23.17% 0.421
30-34 10.20% 15.85% 0.644
35-39 9.89% 7.32% 1.351
40-44 9.03% 3.05% 2.961
45-49 10.31% 2.44% 4.225
50-54 10.78% 4.27% 2.525
55-59 10.65% 1.22% 8.730
60-64 10.77% 1.22% 8.828
Table 1. Population and sample age distribution and weights calculated using the function T/A=W
As seen in Table 1, age groups from 40 to 64 would all require a weight ranging
between 2.525 and 8.828, which are such large weights that they will significantly
increase the degree of error (The Research Bunker, 2016).
For the previously mentioned reasons, in order to account for the bias, the results
will be shown as non-weighted data and weighted data (age-adjusted) when appro-
priate.
35
6.3 Media usage
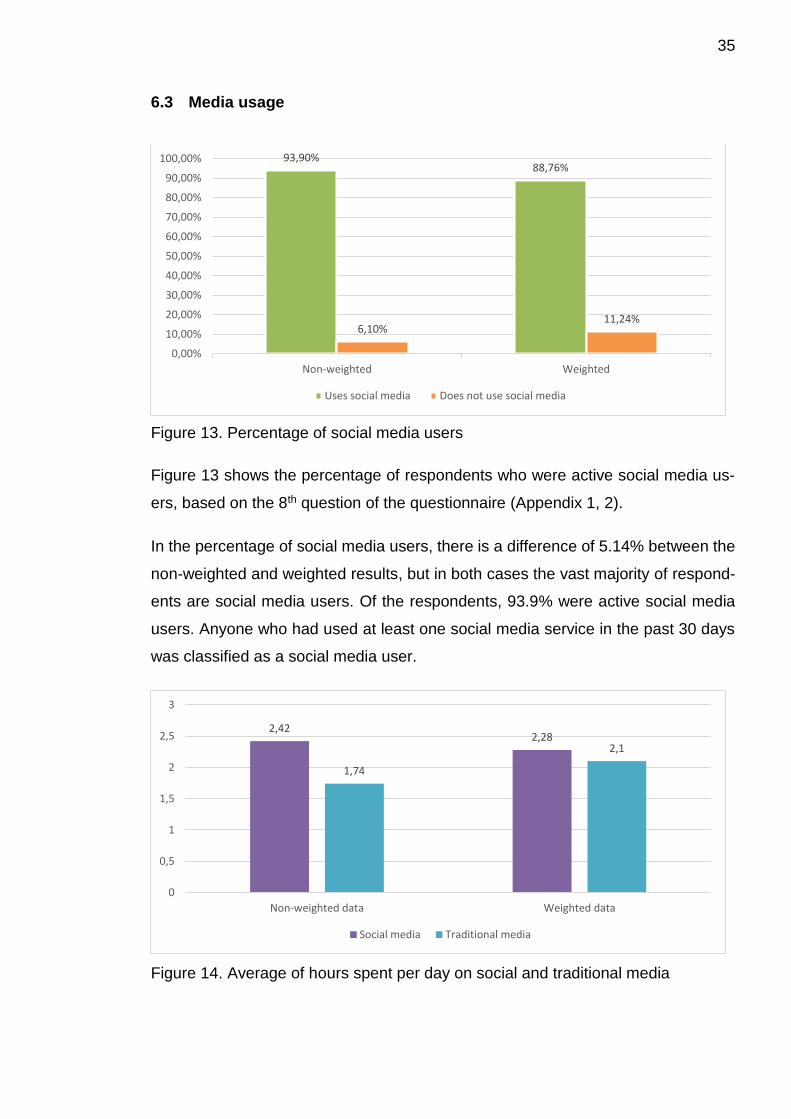
Figure 13. Percentage of social media users
Figure 13 shows the percentage of respondents who were active social media us-
ers, based on the 8th question of the questionnaire (Appendix 1, 2).
In the percentage of social media users, there is a difference of 5.14% between the
non-weighted and weighted results, but in both cases the vast majority of respond-
ents are social media users. Of the respondents, 93.9% were active social media
users. Anyone who had used at least one social media service in the past 30 days
was classified as a social media user.
Figure 14. Average of hours spent per day on social and traditional media
93,90%88,76%
6,10%11,24%
0,00%
10,00%
20,00%
30,00%
40,00%
50,00%
60,00%
70,00%
80,00%
90,00%
100,00%
Non-weighted Weighted
Uses social media Does not use social media
2,422,28
1,74
2,1
0
0,5
1
1,5
2
2,5
3
Non-weighted data Weighted data
Social media Traditional media
36
The results presented in Figure 14 were based on the 3rd and 4th questions of the
questionnaire (Appendix 1, 1), which measured the hours per day used on social
and traditional media by the respondents.
The results show that the respondents spent on average 2 hours 25 minutes on
social media and 1 hour 44 minutes on traditional media per day. When the data is
weighted, the results are 2 hours 17 minutes and 2 hours 6 minutes, respectively.
In percentages this difference is 39% more time on social media in comparison to
traditional media, or 9% when the result is weighted. The results imply that people
of older age use more traditional media and less social media, compared to people
of younger ages. Nonetheless, the results indicate that more time is spent on social
media than traditional media on average.
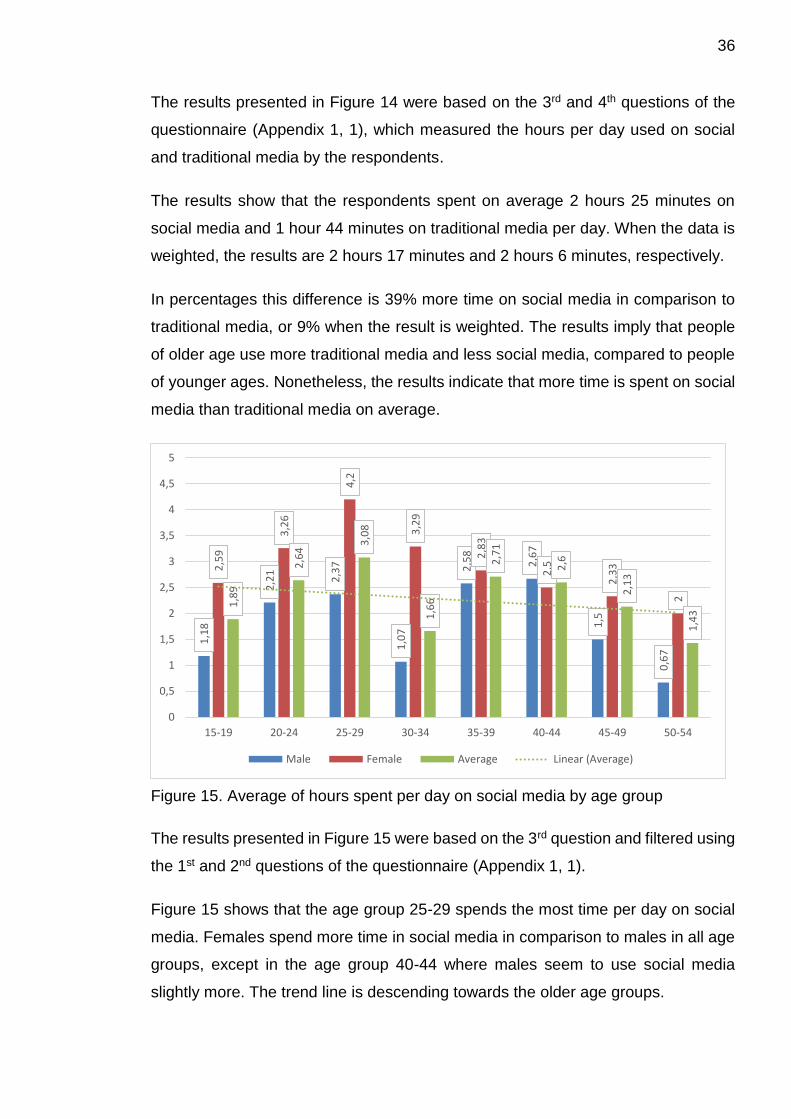
Figure 15. Average of hours spent per day on social media by age group
The results presented in Figure 15 were based on the 3rd question and filtered using
the 1st and 2nd questions of the questionnaire (Appendix 1, 1).
Figure 15 shows that the age group 25-29 spends the most time per day on social
media. Females spend more time in social media in comparison to males in all age
groups, except in the age group 40-44 where males seem to use social media
slightly more. The trend line is descending towards the older age groups.
1,1
8
2,2
1
2,3
7
1,0
7
2,5
8
2,6
7
1,5
0,6
7
2,5
9
3,2
6
4,2
3,2
9
2,8
3
2,5
2,3
3
21,8
9
2,6
4
3,0
8
1,6
6
2,7
1
2,6
2,1
3
1,4
3
0
0,5
1
1,5
2
2,5
3
3,5
4
4,5
5
15-19 20-24 25-29 30-34 35-39 40-44 45-49 50-54
Male Female Average Linear (Average)
37
It is likely that there is some form of bias in male respondents in the age group 30-
34, assuming from the unexpectedly low result in this group.
Age groups 55-59 and 60-64 were intentionally excluded from this chart, as they are
completely unreliable to indicate any reliable results individually, due to the low
amount of responses in these groups.
Figure 16. Average of hours spent per day on traditional media by age group
The results shown in Figure 16 were based on the 4th question and filtered using the
1st and 2nd question of the questionnaire (Appendix 1, 1).
The amount of hours spent per day on traditional media does not show significant
differences between the age groups, with the exception of the age group 50-54
where the time spent on traditional media by male respondents is visibly higher than
in the other age groups. Overall the trend line is ascending towards the older age
groups. However, this difference shown by the sample may not signify a true differ-
ence in the population due to the low number of respondents in this age group.
Furthermore, as in the previous chart, age groups 55-59 and 60-64 were excluded
from this chart due to the low response rate making the results of these age groups
unreliable.
0,9
9 1,3
9
1,2
2
1,7
4
1,6
7
1,5
2
4,3
3
1,7
7 2,1
3
2,0
4
2,1
4
1,8
3
2
2,3
3
2,1
25
1,3
8 1,7
1,5
4 1,8
5
1,7
5
1,7
2,2
5
3,0
7
0
0,5
1
1,5
2
2,5
3
3,5
4
4,5
5
15-19 20-24 25-29 30-34 35-39 40-44 45-49 50-54
Male Female Average Linear (Average)
38
Figure 17. Popularity of social media platforms by percentage of users
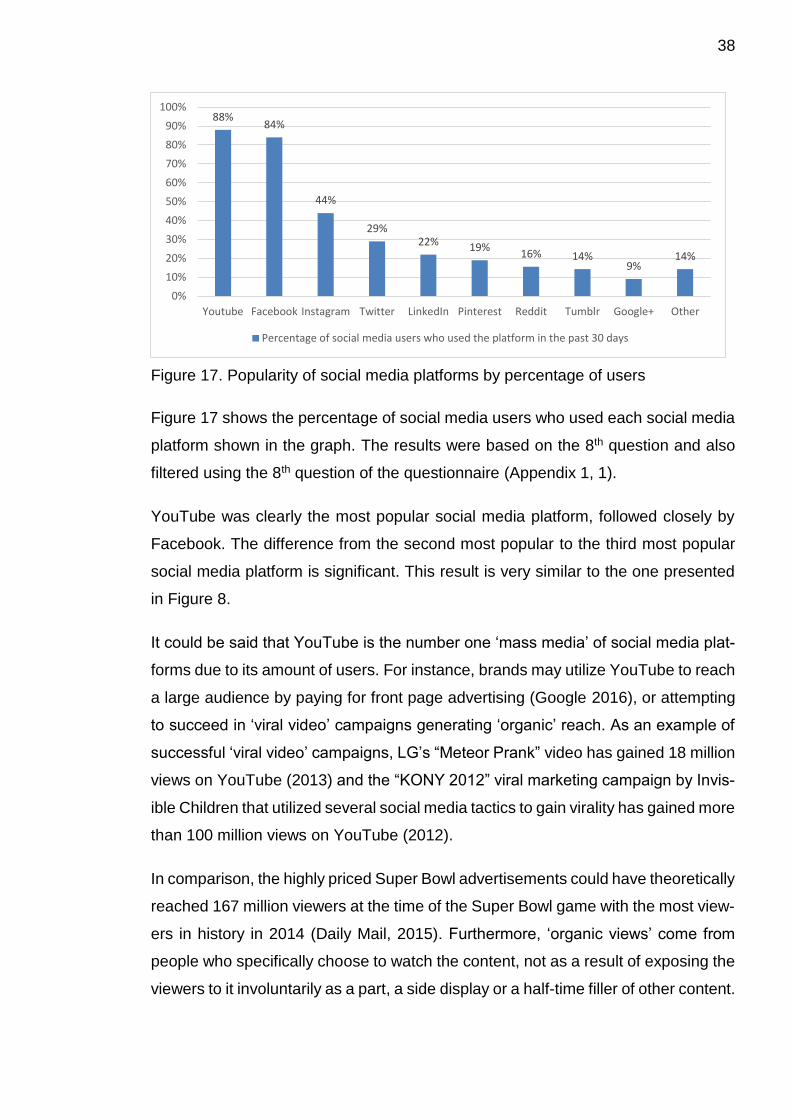
Figure 17 shows the percentage of social media users who used each social media
platform shown in the graph. The results were based on the 8th question and also
filtered using the 8th question of the questionnaire (Appendix 1, 1).
YouTube was clearly the most popular social media platform, followed closely by
Facebook. The difference from the second most popular to the third most popular
social media platform is significant. This result is very similar to the one presented
in Figure 8.
It could be said that YouTube is the number one ‘mass media’ of social media plat-
forms due to its amount of users. For instance, brands may utilize YouTube to reach
a large audience by paying for front page advertising (Google 2016), or attempting
to succeed in ‘viral video’ campaigns generating ‘organic’ reach. As an example of
successful ‘viral video’ campaigns, LG’s “Meteor Prank” video has gained 18 million
views on YouTube (2013) and the “KONY 2012” viral marketing campaign by Invis-
ible Children that utilized several social media tactics to gain virality has gained more
than 100 million views on YouTube (2012).
In comparison, the highly priced Super Bowl advertisements could have theoretically
reached 167 million viewers at the time of the Super Bowl game with the most view-
ers in history in 2014 (Daily Mail, 2015). Furthermore, ‘organic views’ come from
people who specifically choose to watch the content, not as a result of exposing the
viewers to it involuntarily as a part, a side display or a half-time filler of other content.
88%84%
44%
29%22% 19%
16% 14%9%
14%
0%
10%
20%
30%
40%
50%
60%
70%
80%
90%
100%
Youtube Facebook Instagram Twitter LinkedIn Pinterest Reddit Tumblr Google+ Other
Percentage of social media users who used the platform in the past 30 days
39
Based on the results, Facebook should generally act as the main platform for com-
municating and building relationships with consumers, because it has the largest
amount of users of social networking platforms and it enables direct communication
with the consumers.
Other social media platforms do not have nearly as many users as YouTube and
Facebook, but they may often be equally important channels for the brand, depend-
ing on the target market. Companies must evaluate which social media platforms
best fit their brand identity and the social media usage of their target market.
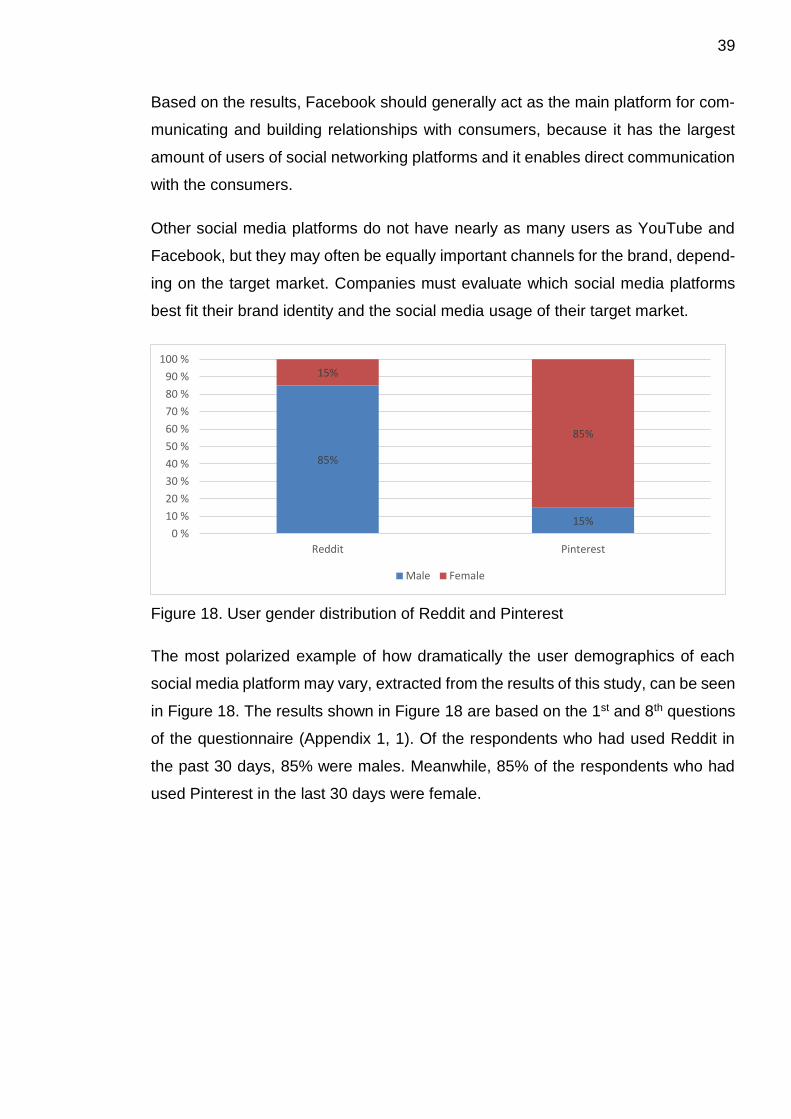
Figure 18. User gender distribution of Reddit and Pinterest
The most polarized example of how dramatically the user demographics of each
social media platform may vary, extracted from the results of this study, can be seen
in Figure 18. The results shown in Figure 18 are based on the 1st and 8th questions
of the questionnaire (Appendix 1, 1). Of the respondents who had used Reddit in
the past 30 days, 85% were males. Meanwhile, 85% of the respondents who had
used Pinterest in the last 30 days were female.
85%
15%
15%
85%
0 %
10 %
20 %
30 %
40 %
50 %
60 %
70 %
80 %
90 %
100 %
Reddit Pinterest
Male Female
40
6.4 Social media user activity and reach
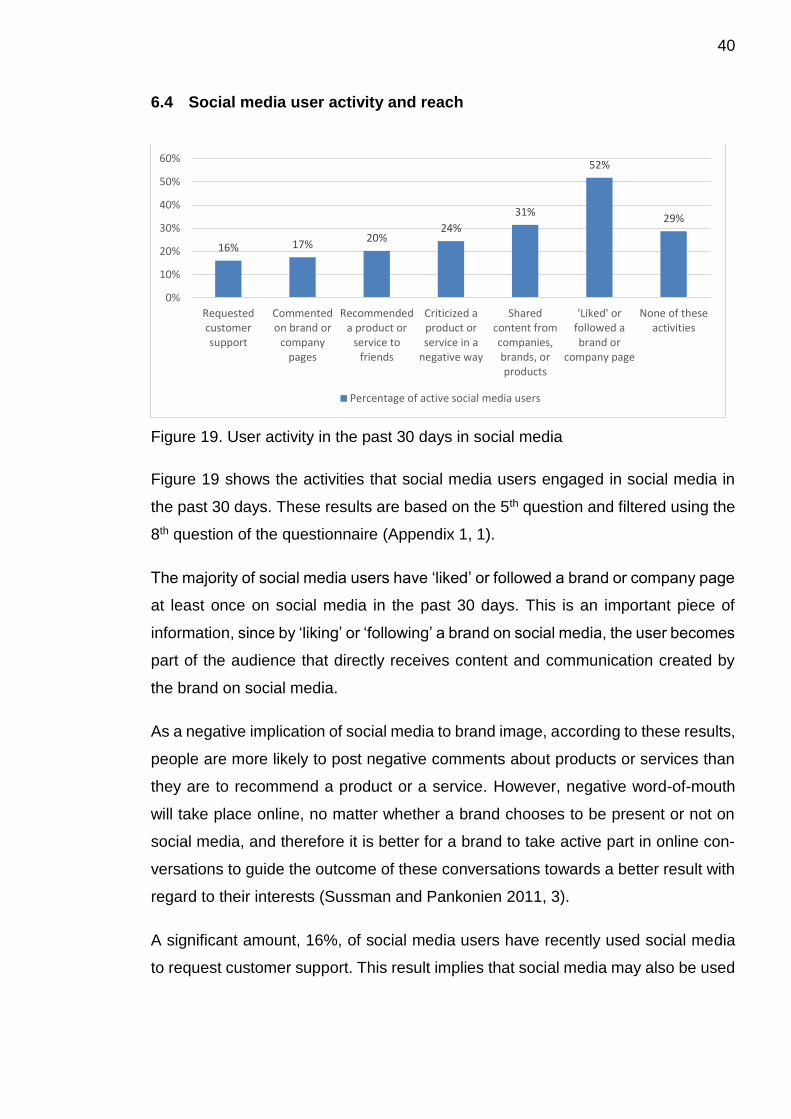
Figure 19. User activity in the past 30 days in social media
Figure 19 shows the activities that social media users engaged in social media in
the past 30 days. These results are based on the 5th question and filtered using the
8th question of the questionnaire (Appendix 1, 1).
The majority of social media users have ‘liked’ or followed a brand or company page
at least once on social media in the past 30 days. This is an important piece of
information, since by ‘liking’ or ‘following’ a brand on social media, the user becomes
part of the audience that directly receives content and communication created by
the brand on social media.
As a negative implication of social media to brand image, according to these results,
people are more likely to post negative comments about products or services than
they are to recommend a product or a service. However, negative word-of-mouth
will take place online, no matter whether a brand chooses to be present or not on
social media, and therefore it is better for a brand to take active part in online con-
versations to guide the outcome of these conversations towards a better result with
regard to their interests (Sussman and Pankonien 2011, 3).
A significant amount, 16%, of social media users have recently used social media
to request customer support. This result implies that social media may also be used
16% 17%20%
24%
31%
52%
29%
0%
10%
20%
30%
40%
50%
60%
Requestedcustomersupport
Commentedon brand or
companypages
Recommendeda product or
service tofriends
Criticized aproduct orservice in a
negative way
Sharedcontent fromcompanies,brands, orproducts
'Liked' orfollowed abrand or
company page
None of theseactivities
Percentage of active social media users
41
for other non-branding related business functions, such as customer service in this
case.
Altogether 71% of social media users have recently used social media in ways that
have a direct or indirect effect on brands. This result implies that social media users
are actively engaging with brands and therefore this adds to the impact of social
media on brand image.
Figure 20. Amount of ‘friends’ or ‘followers’ on primary social network
The results in Figure 20 are based on the 6th question and filtered using the 1st and
8th questions of the questionnaire (Appendix 1, 1). The number of ‘friends’ or ‘fol-
lowers’ important to know in order to make conclusions on the theoretic reach of
user activity on social media.
Figure 20 shows the average, weighted and median average amount of ‘friends’ or
‘followers’ on the social media service used the most by each respondent who was
an active user of social media. The average would suggest that females tend to
have more friends or followers on social media, and therefore their user activity
would have more reach. The weighted average however, is contradictory to the non-
weighted results. The median shows the most significant difference between males
and females in the amount of ‘friends’ or ‘followers’ on social media.
Based on these results, it can be said that the average amount of ‘friends’ or ‘fol-
lowers’ on social media is somewhere near 200, but the median is less. This means
193206
100
236
170180
194 188
133
0
50
100
150
200
250
Average Weighted average Median
Male Female Total
42
that most users have less than 200 ‘friends’ or ‘followers’, but a minority of users
have significantly more.
Figure 21. Social media users who have ‘liked’ or ‘followed’ a brand because a friend ‘liked’ or ‘followed’ it
The results shown in Figure 21 show the percentage of active social media users
that have at some point ‘liked’ or ‘followed’ a brand because their friend ‘liked’ or
‘followed’ it on social media. These results are based on the 7th question and filtered
using the 8th question of the questionnaire (Appendix 1, 1).
The results imply the existence and scale of the potential of user activity in influenc-
ing other users to engage with a brand on social media, by using one of the possible
variables that could be used to observe this. Based on these results, at least 45%
of social media users have at least once engaged with a brand on social media as
a direct result of other users’ social media activity.
Figure 22. Social media users who have ‘liked’ or ‘followed’ a brand because a friend ‘liked’ or ‘followed’ it, by gender
45,45%
54,55%
Yes No
31%
17%
64% 67%
0%
10%
20%
30%
40%
50%
60%
70%
80%
Average Weighted average
Male Female
43
As shown in Figure 22, of which the results are based on the 7th question and filtered
with the 8th and 1st question of the questionnaire (Appendix 1, 1), females are at
least twice as likely as males to have ‘liked’ or ‘followed’ a brand because their friend
has ‘liked’ or ‘followed’ it. The results shown in Figure 22 imply that brands that
target female consumers, are more likely to succeed in engaging more users of their
target market through viral campaigns on social media.
6.5 Impact of social and traditional media on brand image
Figure 23. Consumer-perceived influence of social and traditional media presence and non-presence on trust
The results based on questions 9-12 of the questionnaire (Appendix 1, 2), which are
presented in Figure 23, show the consumer-perceived influence of social and tradi-
tional media brand presence and non-presence on trust. The total difference be-
tween the influence of social and traditional media presence and non-presence is
10.37%.
The positive influence of presence and the negative influence of non-presence are
shown as percentages of the results on the four dichotomous questions that meas-
46,95%40,24%
-27,44% -23,78%
-100,00%
-80,00%
-60,00%
-40,00%
-20,00%
0,00%
20,00%
40,00%
60,00%
80,00%
100,00%
Social media Traditional media
Presence-positive Non-presence-negative
44
ured consumer perceptions on these variables. The negative influence of non-pres-
ence is presented as negative percentage in order to visualize better the scale of
the total influence of presence and non-presence on trust.
Based on these results it may be said that the mere presence on social media has
slightly more importance to consumers in regard to having trust towards a brand or
not.
Figure 24. Consumer-perceived influence of social and traditional media on func-tional and experiential brand image
The results shown in Figure 24 were based on questions 13-16 and 19-22 of the
questionnaire (Appendix 1, 2-3). These questions measured consumer perceptions
on the influence of social and traditional media on functional and experiential brand
image. The results of the whole sample did not show significant differences in the
measured variables. The influence of social media was ranked only slightly higher
in experiential brand image than functional brand image. Traditional media’s influ-
ence on functional brand image was ranked slightly higher than the influence of
social media. The influence on experiential brand image does not show significant
differences between social and traditional media.
3,4
8
3,6
2
3,2
8
3,4
4
3,5
7
3,4
1
3,5
1
3,5
2
0
0,5
1
1,5
2
2,5
3
3,5
4
4,5
5
Functional Experiential
Social media Social media (weighted) Traditional media Traditional media (weighted)
45
Figure 25. Consumer-perceived influence of social and traditional media on brand recall
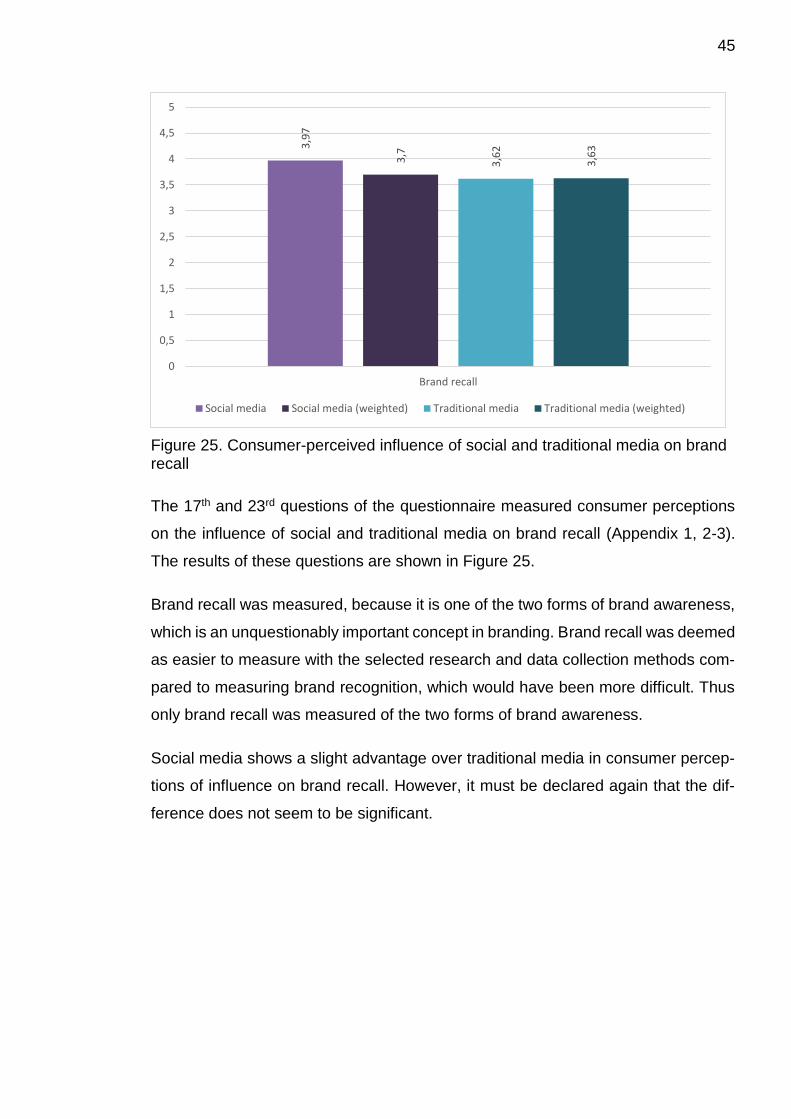
The 17th and 23rd questions of the questionnaire measured consumer perceptions
on the influence of social and traditional media on brand recall (Appendix 1, 2-3).
The results of these questions are shown in Figure 25.
Brand recall was measured, because it is one of the two forms of brand awareness,
which is an unquestionably important concept in branding. Brand recall was deemed
as easier to measure with the selected research and data collection methods com-
pared to measuring brand recognition, which would have been more difficult. Thus
only brand recall was measured of the two forms of brand awareness.
Social media shows a slight advantage over traditional media in consumer percep-
tions of influence on brand recall. However, it must be declared again that the dif-
ference does not seem to be significant.
3,9
7
3,7
3,6
2
3,6
3
0
0,5
1
1,5
2
2,5
3
3,5
4
4,5
5
Brand recall
Social media Social media (weighted) Traditional media Traditional media (weighted)
46
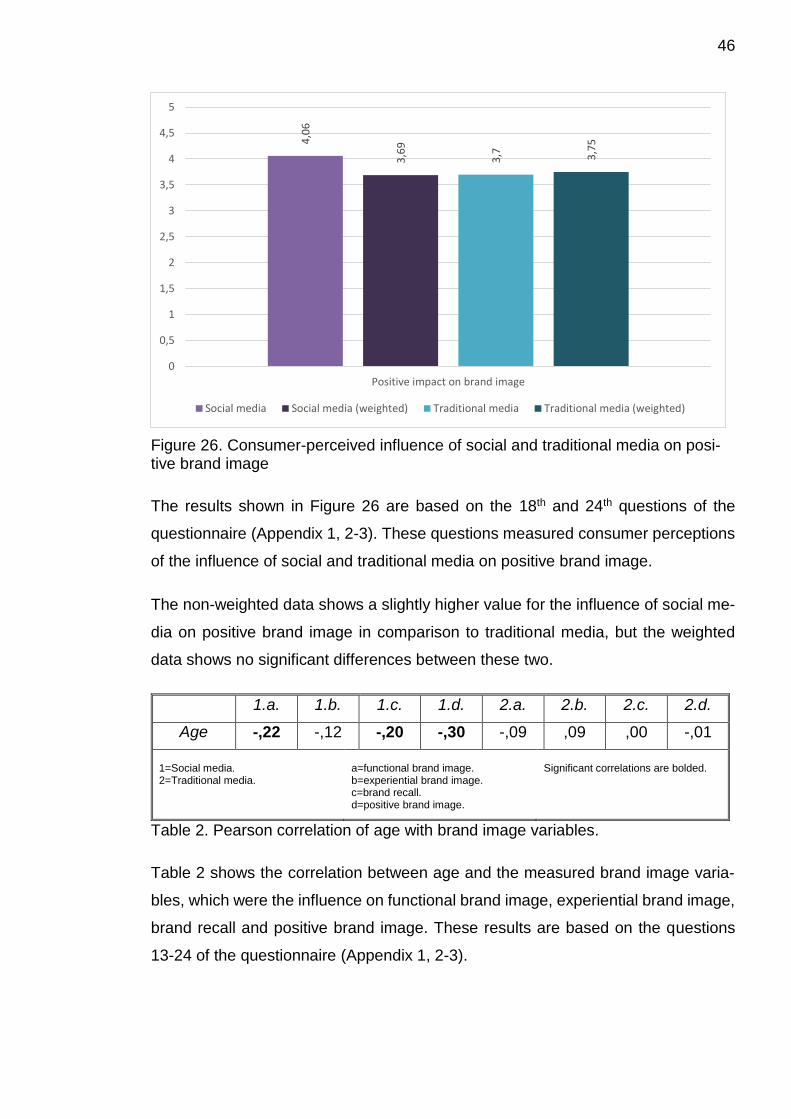
Figure 26. Consumer-perceived influence of social and traditional media on posi-tive brand image
The results shown in Figure 26 are based on the 18th and 24th questions of the
questionnaire (Appendix 1, 2-3). These questions measured consumer perceptions
of the influence of social and traditional media on positive brand image.
The non-weighted data shows a slightly higher value for the influence of social me-
dia on positive brand image in comparison to traditional media, but the weighted
data shows no significant differences between these two.
1.a. 1.b. 1.c. 1.d. 2.a. 2.b. 2.c. 2.d.
Age -,22 -,12 -,20 -,30 -,09 ,09 ,00 -,01
1=Social media. 2=Traditional media.
a=functional brand image. b=experiential brand image. c=brand recall. d=positive brand image.
Significant correlations are bolded.
Table 2. Pearson correlation of age with brand image variables.
Table 2 shows the correlation between age and the measured brand image varia-
bles, which were the influence on functional brand image, experiential brand image,
brand recall and positive brand image. These results are based on the questions
13-24 of the questionnaire (Appendix 1, 2-3).
4,0
6
3,6
9
3,7 3,7
5
0
0,5
1
1,5
2
2,5
3
3,5
4
4,5
5
Positive impact on brand image
Social media Social media (weighted) Traditional media Traditional media (weighted)
47
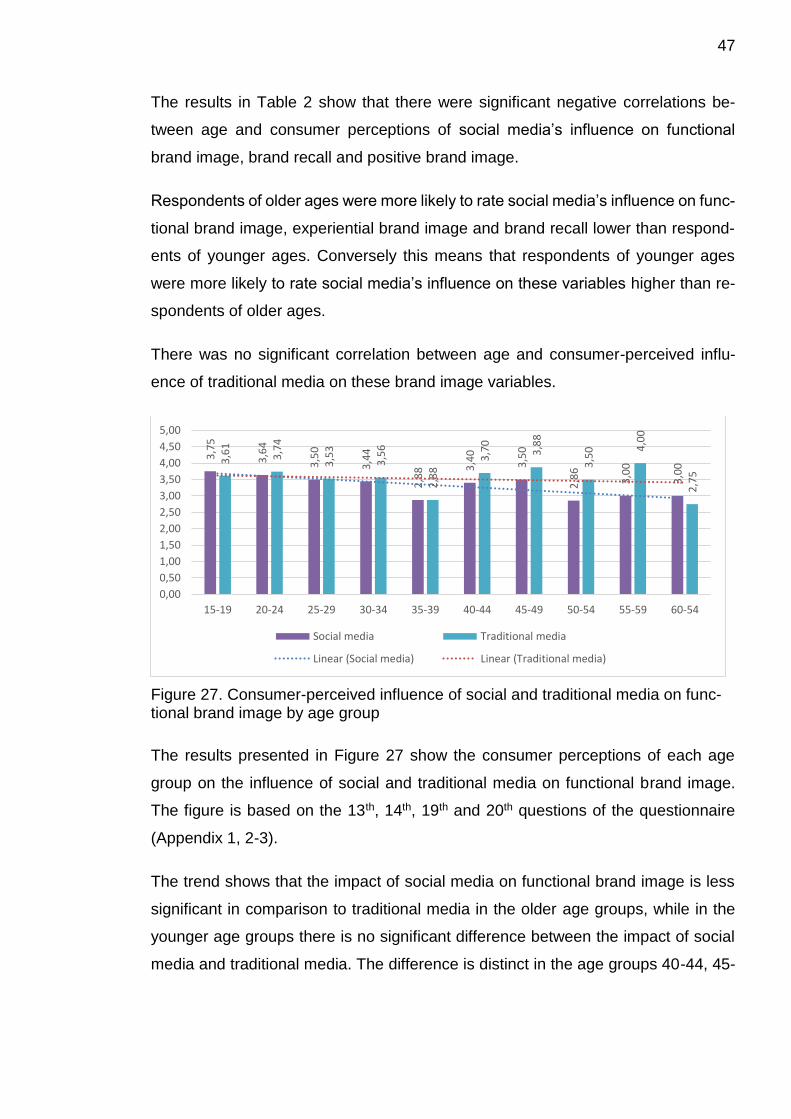
The results in Table 2 show that there were significant negative correlations be-
tween age and consumer perceptions of social media’s influence on functional
brand image, brand recall and positive brand image.
Respondents of older ages were more likely to rate social media’s influence on func-
tional brand image, experiential brand image and brand recall lower than respond-
ents of younger ages. Conversely this means that respondents of younger ages
were more likely to rate social media’s influence on these variables higher than re-
spondents of older ages.
There was no significant correlation between age and consumer-perceived influ-
ence of traditional media on these brand image variables.
Figure 27. Consumer-perceived influence of social and traditional media on func-tional brand image by age group
The results presented in Figure 27 show the consumer perceptions of each age
group on the influence of social and traditional media on functional brand image.
The figure is based on the 13th, 14th, 19th and 20th questions of the questionnaire
(Appendix 1, 2-3).
The trend shows that the impact of social media on functional brand image is less
significant in comparison to traditional media in the older age groups, while in the
younger age groups there is no significant difference between the impact of social
media and traditional media. The difference is distinct in the age groups 40-44, 45-
3,7
5
3,6
4
3,5
0
3,4
4
2,8
8 3,4
0
3,5
0
2,8
6
3,0
0
3,0
03,6
1
3,7
4
3,5
3
3,5
6
2,8
8
3,7
0
3,8
8
3,5
0 4,0
0
2,7
5
0,00
0,50
1,00
1,50
2,00
2,50
3,00
3,50
4,00
4,50
5,00
15-19 20-24 25-29 30-34 35-39 40-44 45-49 50-54 55-59 60-54
Social media Traditional media
Linear (Social media) Linear (Traditional media)
48
49, 50-54, and 55-59. These results are consistent with the results presented in
Table 2.
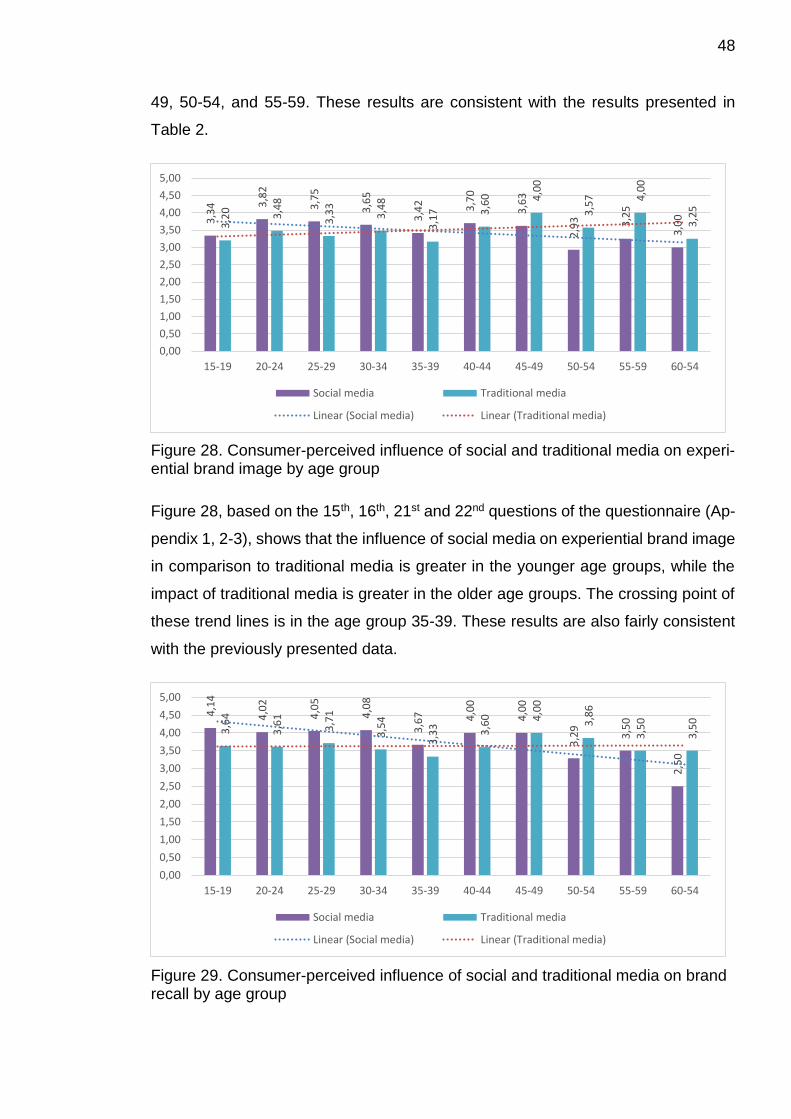
Figure 28. Consumer-perceived influence of social and traditional media on experi-ential brand image by age group
Figure 28, based on the 15th, 16th, 21st and 22nd questions of the questionnaire (Ap-
pendix 1, 2-3), shows that the influence of social media on experiential brand image
in comparison to traditional media is greater in the younger age groups, while the
impact of traditional media is greater in the older age groups. The crossing point of
these trend lines is in the age group 35-39. These results are also fairly consistent
with the previously presented data.
Figure 29. Consumer-perceived influence of social and traditional media on brand recall by age group
3,3
4 3,8
2
3,7
5
3,6
5
3,4
2 3,7
0
3,6
3
2,9
3 3,2
5
3,0
0
3,2
0 3,4
8
3,3
3
3,4
8
3,1
7 3,6
0 4,0
0
3,5
7 4,0
0
3,2
5
0,00
0,50
1,00
1,50
2,00
2,50
3,00
3,50
4,00
4,50
5,00
15-19 20-24 25-29 30-34 35-39 40-44 45-49 50-54 55-59 60-54
Social media Traditional media
Linear (Social media) Linear (Traditional media)
4,1
4
4,0
2
4,0
5
4,0
8
3,6
7 4,0
0
4,0
0
3,2
9
3,5
0
2,5
0
3,6
4
3,6
1
3,7
1
3,5
4
3,3
3 3,6
0 4,0
0
3,8
6
3,5
0
3,5
0
0,00
0,50
1,00
1,50
2,00
2,50
3,00
3,50
4,00
4,50
5,00
15-19 20-24 25-29 30-34 35-39 40-44 45-49 50-54 55-59 60-54
Social media Traditional media
Linear (Social media) Linear (Traditional media)
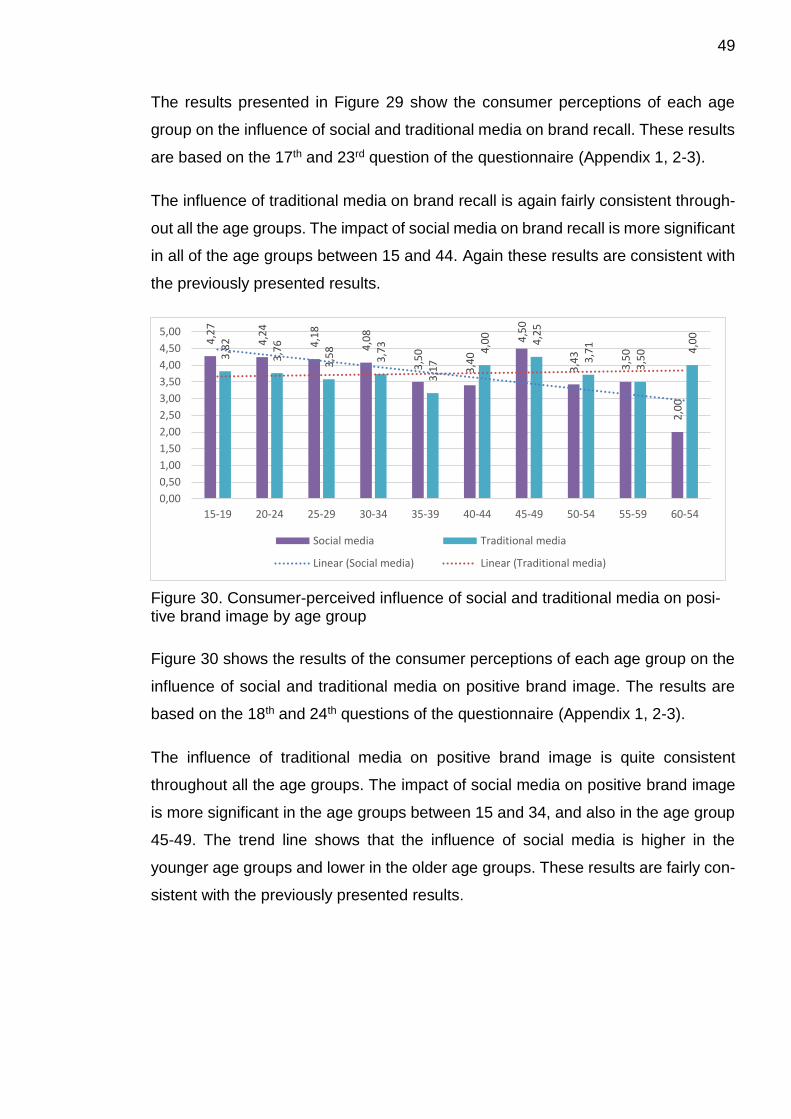
49
The results presented in Figure 29 show the consumer perceptions of each age
group on the influence of social and traditional media on brand recall. These results
are based on the 17th and 23rd question of the questionnaire (Appendix 1, 2-3).
The influence of traditional media on brand recall is again fairly consistent through-
out all the age groups. The impact of social media on brand recall is more significant
in all of the age groups between 15 and 44. Again these results are consistent with
the previously presented results.
Figure 30. Consumer-perceived influence of social and traditional media on posi-tive brand image by age group
Figure 30 shows the results of the consumer perceptions of each age group on the
influence of social and traditional media on positive brand image. The results are
based on the 18th and 24th questions of the questionnaire (Appendix 1, 2-3).
The influence of traditional media on positive brand image is quite consistent
throughout all the age groups. The impact of social media on positive brand image
is more significant in the age groups between 15 and 34, and also in the age group
45-49. The trend line shows that the influence of social media is higher in the
younger age groups and lower in the older age groups. These results are fairly con-
sistent with the previously presented results.
4,2
7
4,2
4
4,1
8
4,0
8
3,5
0
3,4
0
4,5
0
3,4
3
3,5
0
2,0
0
3,8
2
3,7
6
3,5
8
3,7
3
3,1
7
4,0
0
4,2
5
3,7
1
3,5
0 4,0
0
0,00
0,50
1,00
1,50
2,00
2,50
3,00
3,50
4,00
4,50
5,00
15-19 20-24 25-29 30-34 35-39 40-44 45-49 50-54 55-59 60-54
Social media Traditional media
Linear (Social media) Linear (Traditional media)
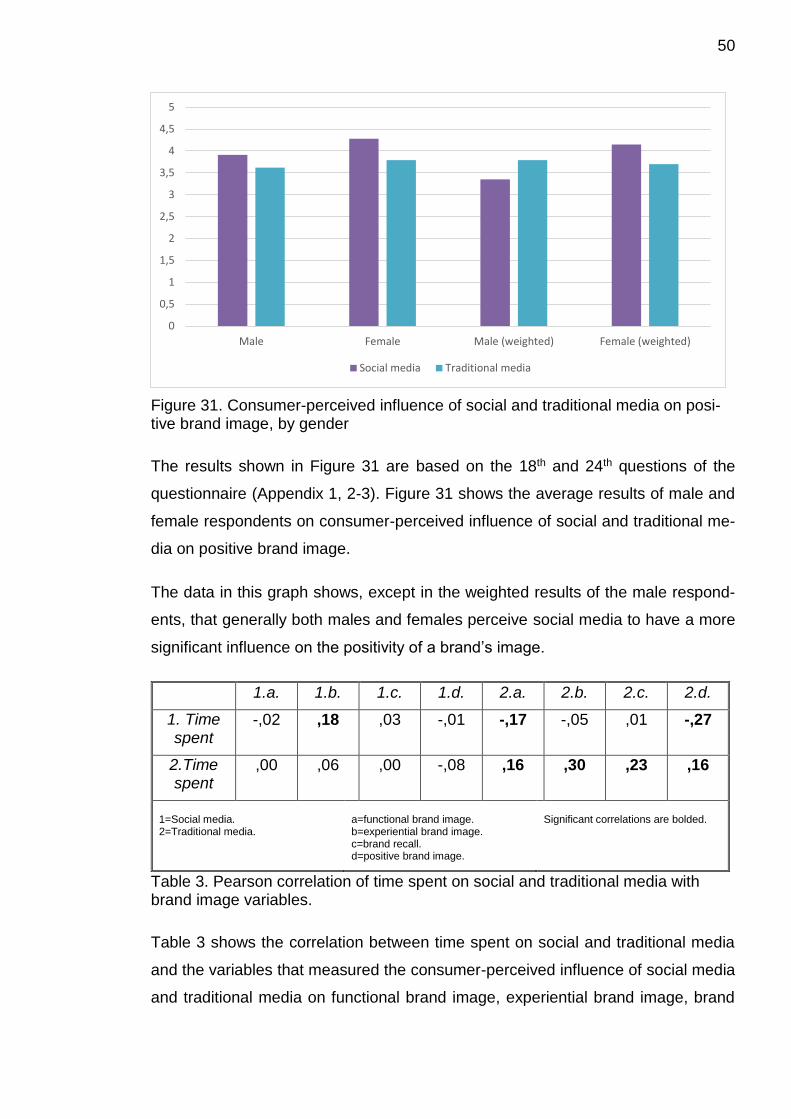
50
Figure 31. Consumer-perceived influence of social and traditional media on posi-tive brand image, by gender
The results shown in Figure 31 are based on the 18th and 24th questions of the
questionnaire (Appendix 1, 2-3). Figure 31 shows the average results of male and
female respondents on consumer-perceived influence of social and traditional me-
dia on positive brand image.
The data in this graph shows, except in the weighted results of the male respond-
ents, that generally both males and females perceive social media to have a more
significant influence on the positivity of a brand’s image.
1.a. 1.b. 1.c. 1.d. 2.a. 2.b. 2.c. 2.d.
1. Time spent
-,02 ,18 ,03 -,01 -,17 -,05 ,01 -,27
2.Time spent
,00 ,06 ,00 -,08 ,16 ,30 ,23 ,16
1=Social media. 2=Traditional media.
a=functional brand image. b=experiential brand image. c=brand recall. d=positive brand image.
Significant correlations are bolded.
Table 3. Pearson correlation of time spent on social and traditional media with brand image variables.
Table 3 shows the correlation between time spent on social and traditional media
and the variables that measured the consumer-perceived influence of social media
and traditional media on functional brand image, experiential brand image, brand
0
0,5
1
1,5
2
2,5
3
3,5
4
4,5
5
Male Female Male (weighted) Female (weighted)
Social media Traditional media
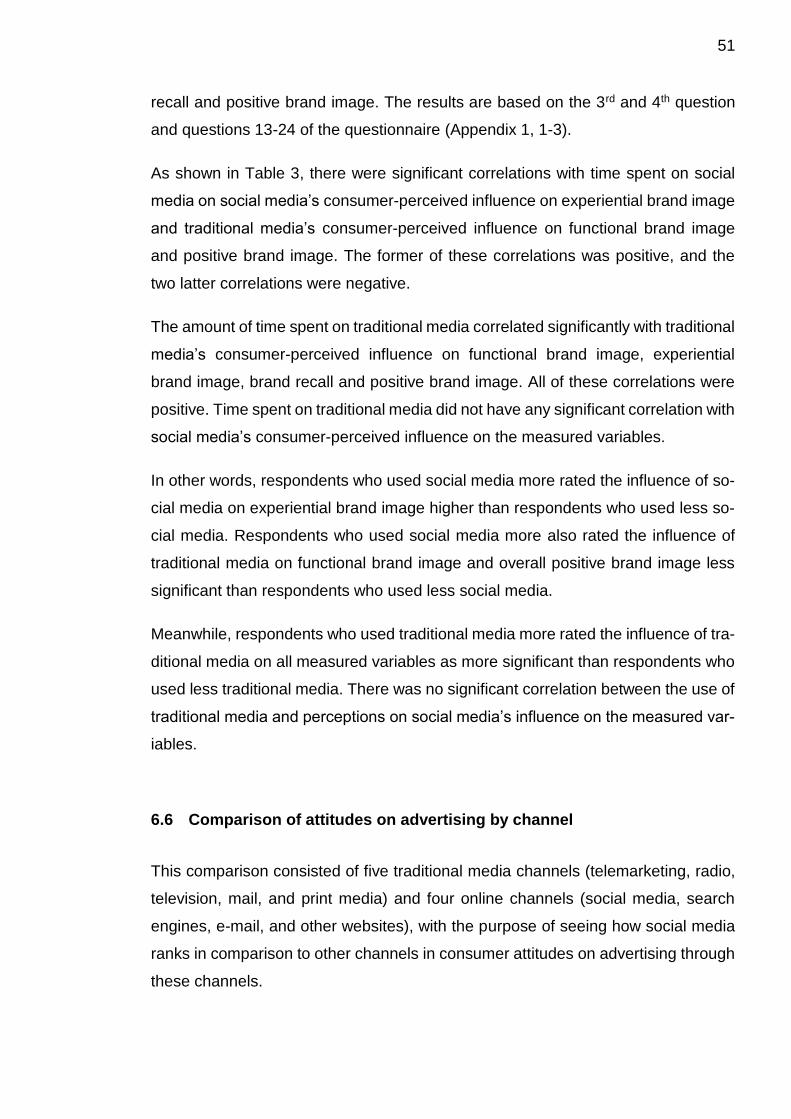
51
recall and positive brand image. The results are based on the 3rd and 4th question
and questions 13-24 of the questionnaire (Appendix 1, 1-3).
As shown in Table 3, there were significant correlations with time spent on social
media on social media’s consumer-perceived influence on experiential brand image
and traditional media’s consumer-perceived influence on functional brand image
and positive brand image. The former of these correlations was positive, and the
two latter correlations were negative.
The amount of time spent on traditional media correlated significantly with traditional
media’s consumer-perceived influence on functional brand image, experiential
brand image, brand recall and positive brand image. All of these correlations were
positive. Time spent on traditional media did not have any significant correlation with
social media’s consumer-perceived influence on the measured variables.
In other words, respondents who used social media more rated the influence of so-
cial media on experiential brand image higher than respondents who used less so-
cial media. Respondents who used social media more also rated the influence of
traditional media on functional brand image and overall positive brand image less
significant than respondents who used less social media.
Meanwhile, respondents who used traditional media more rated the influence of tra-
ditional media on all measured variables as more significant than respondents who
used less traditional media. There was no significant correlation between the use of
traditional media and perceptions on social media’s influence on the measured var-
iables.
6.6 Comparison of attitudes on advertising by channel
This comparison consisted of five traditional media channels (telemarketing, radio,
television, mail, and print media) and four online channels (social media, search
engines, e-mail, and other websites), with the purpose of seeing how social media
ranks in comparison to other channels in consumer attitudes on advertising through
these channels.
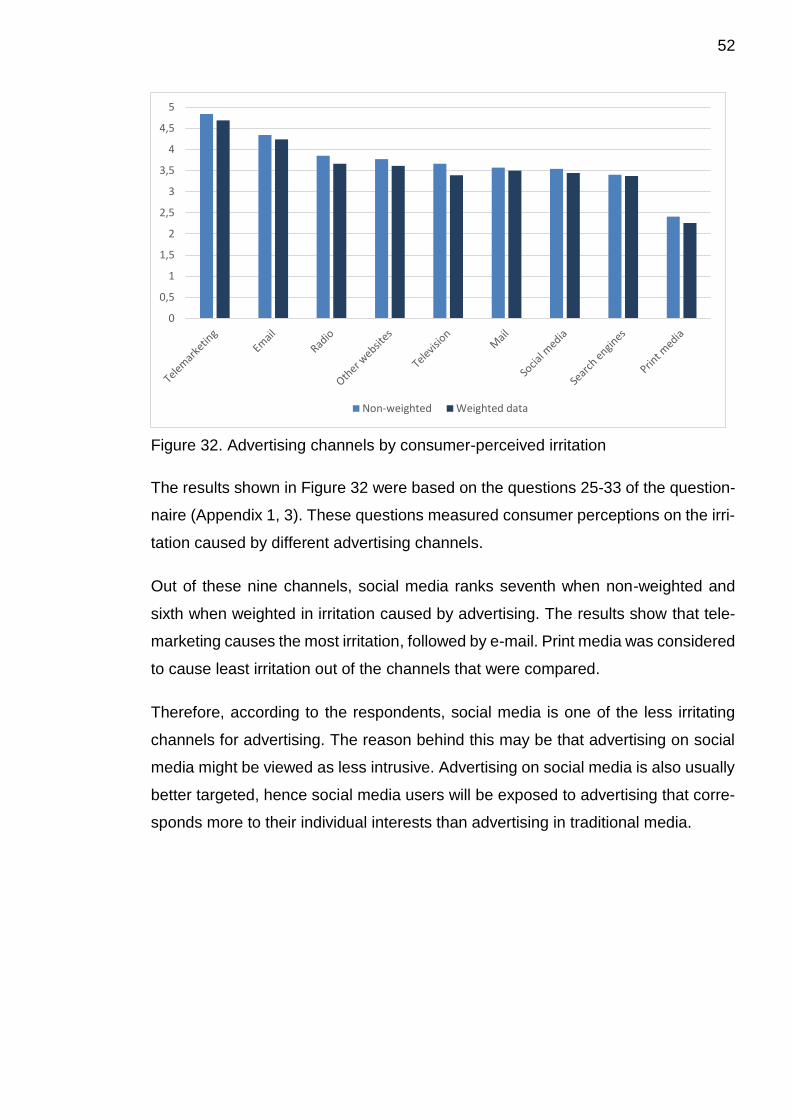
52
Figure 32. Advertising channels by consumer-perceived irritation
The results shown in Figure 32 were based on the questions 25-33 of the question-
naire (Appendix 1, 3). These questions measured consumer perceptions on the irri-
tation caused by different advertising channels.
Out of these nine channels, social media ranks seventh when non-weighted and
sixth when weighted in irritation caused by advertising. The results show that tele-
marketing causes the most irritation, followed by e-mail. Print media was considered
to cause least irritation out of the channels that were compared.
Therefore, according to the respondents, social media is one of the less irritating
channels for advertising. The reason behind this may be that advertising on social
media might be viewed as less intrusive. Advertising on social media is also usually
better targeted, hence social media users will be exposed to advertising that corre-
sponds more to their individual interests than advertising in traditional media.
0
0,5
1
1,5
2
2,5
3
3,5
4
4,5
5
Non-weighted Weighted data
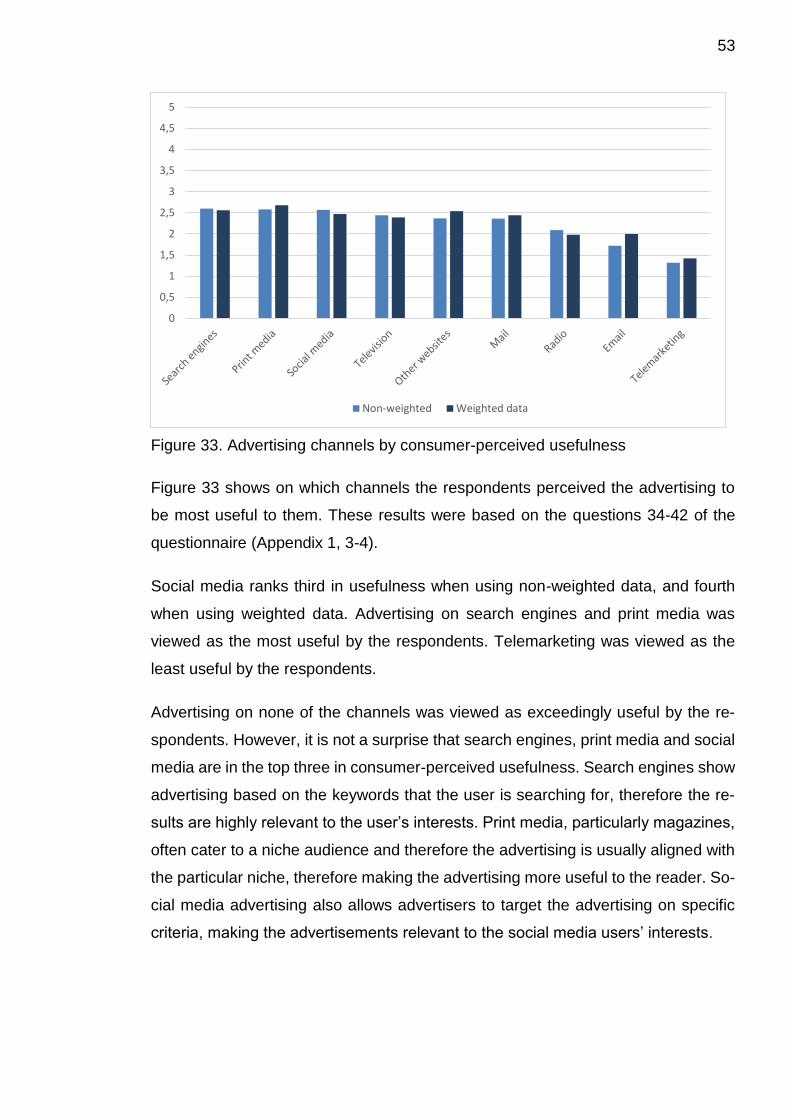
53
Figure 33. Advertising channels by consumer-perceived usefulness
Figure 33 shows on which channels the respondents perceived the advertising to
be most useful to them. These results were based on the questions 34-42 of the
questionnaire (Appendix 1, 3-4).
Social media ranks third in usefulness when using non-weighted data, and fourth
when using weighted data. Advertising on search engines and print media was
viewed as the most useful by the respondents. Telemarketing was viewed as the
least useful by the respondents.
Advertising on none of the channels was viewed as exceedingly useful by the re-
spondents. However, it is not a surprise that search engines, print media and social
media are in the top three in consumer-perceived usefulness. Search engines show
advertising based on the keywords that the user is searching for, therefore the re-
sults are highly relevant to the user’s interests. Print media, particularly magazines,
often cater to a niche audience and therefore the advertising is usually aligned with
the particular niche, therefore making the advertising more useful to the reader. So-
cial media advertising also allows advertisers to target the advertising on specific
criteria, making the advertisements relevant to the social media users’ interests.
0
0,5
1
1,5
2
2,5
3
3,5
4
4,5
5
Non-weighted Weighted data
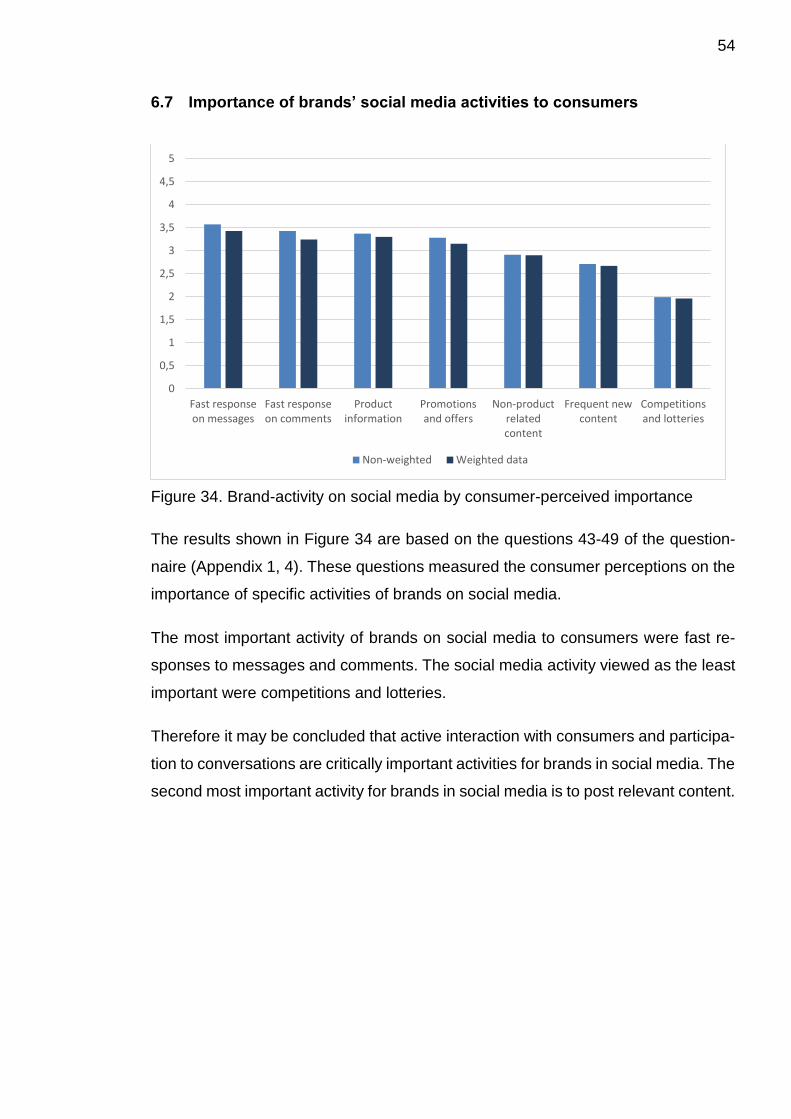
54
6.7 Importance of brands’ social media activities to consumers
Figure 34. Brand-activity on social media by consumer-perceived importance
The results shown in Figure 34 are based on the questions 43-49 of the question-
naire (Appendix 1, 4). These questions measured the consumer perceptions on the
importance of specific activities of brands on social media.
The most important activity of brands on social media to consumers were fast re-
sponses to messages and comments. The social media activity viewed as the least
important were competitions and lotteries.
Therefore it may be concluded that active interaction with consumers and participa-
tion to conversations are critically important activities for brands in social media. The
second most important activity for brands in social media is to post relevant content.
0
0,5
1
1,5
2
2,5
3
3,5
4
4,5
5
Fast responseon messages
Fast responseon comments
Productinformation
Promotionsand offers
Non-productrelatedcontent
Frequent newcontent
Competitionsand lotteries
Non-weighted Weighted data
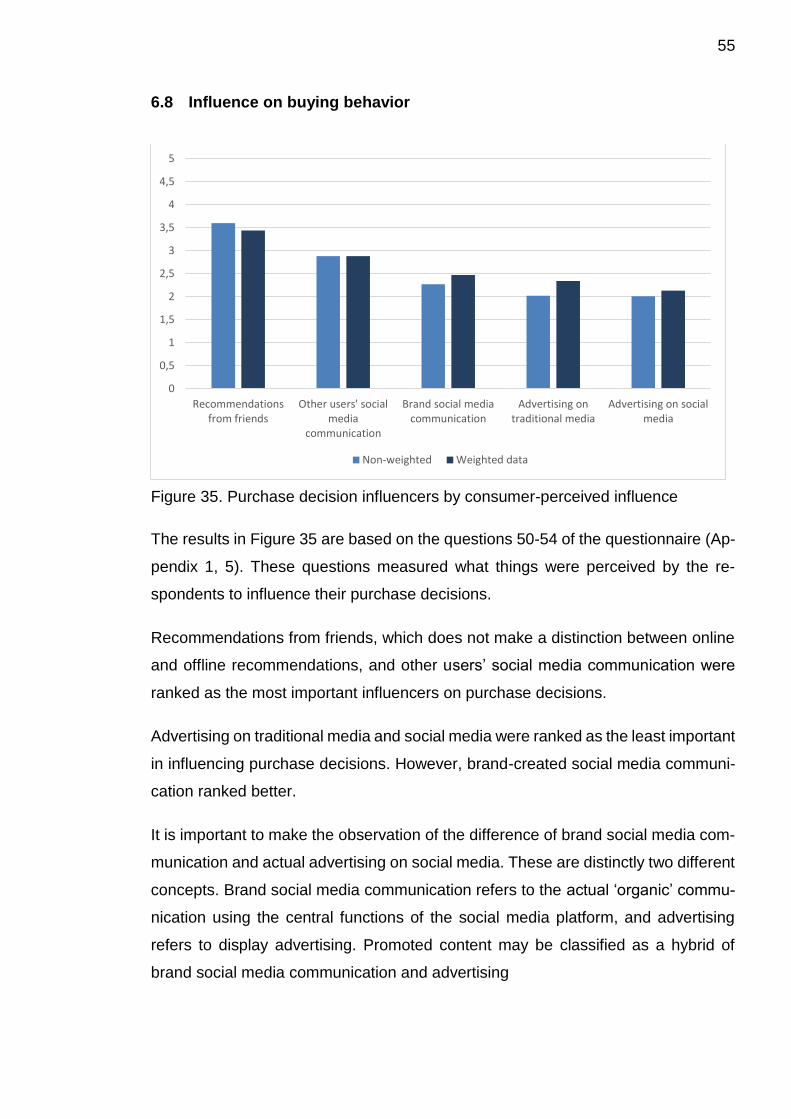
55
6.8 Influence on buying behavior
Figure 35. Purchase decision influencers by consumer-perceived influence
The results in Figure 35 are based on the questions 50-54 of the questionnaire (Ap-
pendix 1, 5). These questions measured what things were perceived by the re-
spondents to influence their purchase decisions.
Recommendations from friends, which does not make a distinction between online
and offline recommendations, and other users’ social media communication were
ranked as the most important influencers on purchase decisions.
Advertising on traditional media and social media were ranked as the least important
in influencing purchase decisions. However, brand-created social media communi-
cation ranked better.
It is important to make the observation of the difference of brand social media com-
munication and actual advertising on social media. These are distinctly two different
concepts. Brand social media communication refers to the actual ‘organic’ commu-
nication using the central functions of the social media platform, and advertising
refers to display advertising. Promoted content may be classified as a hybrid of
brand social media communication and advertising
0
0,5
1
1,5
2
2,5
3
3,5
4
4,5
5
Recommendationsfrom friends
Other users' socialmedia
communication
Brand social mediacommunication
Advertising ontraditional media
Advertising on socialmedia
Non-weighted Weighted data
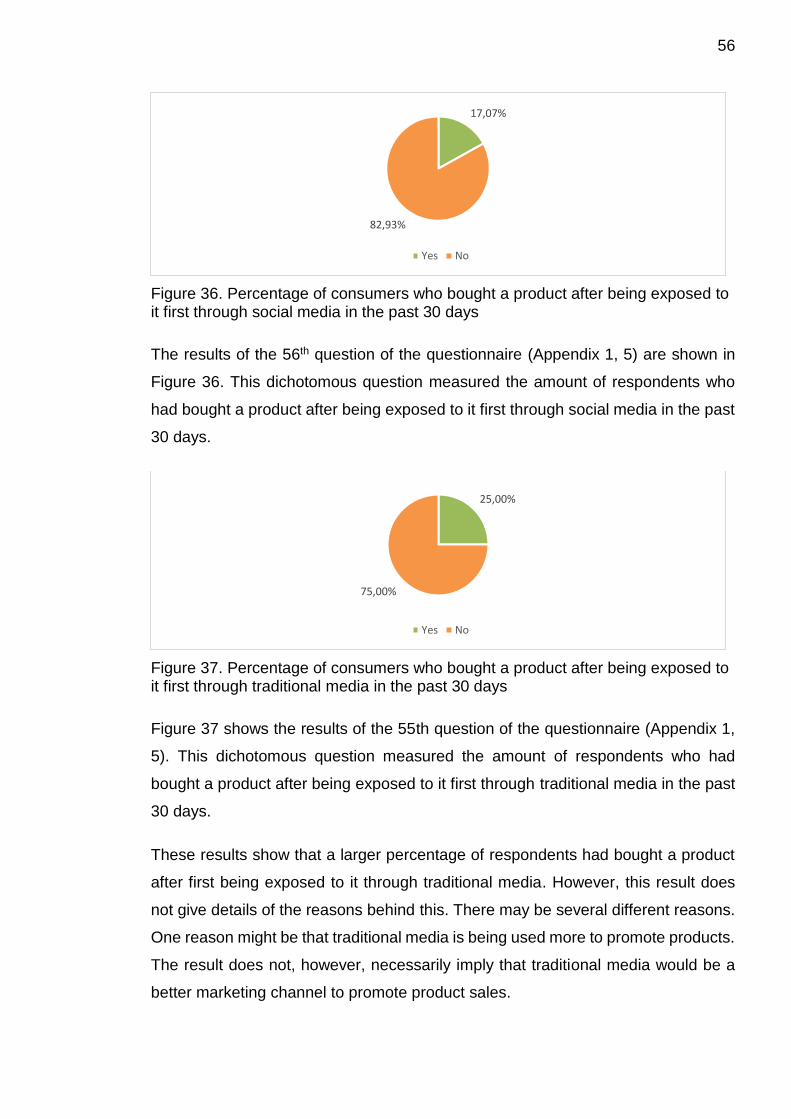
56
Figure 36. Percentage of consumers who bought a product after being exposed to it first through social media in the past 30 days
The results of the 56th question of the questionnaire (Appendix 1, 5) are shown in
Figure 36. This dichotomous question measured the amount of respondents who
had bought a product after being exposed to it first through social media in the past
30 days.
Figure 37. Percentage of consumers who bought a product after being exposed to it first through traditional media in the past 30 days
Figure 37 shows the results of the 55th question of the questionnaire (Appendix 1,
5). This dichotomous question measured the amount of respondents who had
bought a product after being exposed to it first through traditional media in the past
30 days.
These results show that a larger percentage of respondents had bought a product
after first being exposed to it through traditional media. However, this result does
not give details of the reasons behind this. There may be several different reasons.
One reason might be that traditional media is being used more to promote products.
The result does not, however, necessarily imply that traditional media would be a
better marketing channel to promote product sales.
17,07%
82,93%
Yes No
25,00%
75,00%
Yes No
57
7 CONCLUSION
The prevalence of social media in society is now at least as significant as the one
of traditional media channels. The vast majority of Finnish consumers between the
ages 15 to 64 are now active social media users. On average, the respondents of
the questionnaire spent more time on social media than traditional media per day.
The results show the general distinctions over branding in social and traditional me-
dia, but they do not provide a large amount of detail on specific segments of the
consumer population or the reasons behind the observations.
Based on the results, brand presence on social media is generally regarded as
slightly more important to consumer-perceived trust on a brand. Additionally, brand
social media communication was perceived as having slightly more influence on the
overall positivity of brand image. Despite of this, the data did not present any gen-
eralizable, significant differences in regard to direct influence on functional or expe-
riential brand image by brand communication itself on social and traditional media.
However, the overall impact of traditional media on brand image seems to be fairly
consistent on all age groups, while the overall impact of social media on brand im-
age is the most significant in younger age groups and females. The results therefore
imply that there may be significant differences of the impact on brand image de-
pending on more specific targeted segments of consumers.
Unequivocally the impact of social media on brand image is strongly linked to the
media usage of the target market, more specifically to how much time the target
market spends in social media. To reiterate the results of this study, there may be
significant differences in the social media usage with strong correlation to attitudes
on brand communication on social media between genders and age groups.
The study did not measure other socio-demographic variables in addition to age and
gender, which most likely could be used to identify more differences between the
subgroups of the population. Therefore the evaluation of the target market’s social
media usage and attitudes on brand communication on social media is a task that
58
is left for the marketers, and the results of this study are only to be used to identify
the broad differences between social and traditional media’s impact on brand image.
In order to identify these differences amongst the consumer segments, research
has to be made with more detailed socio-demographic variables and there has to
be development of more accurate and detailed ways to measure the impact on
brand image.
The section that compared advertising channels, showed that social media ranks
well compared to other advertising channels in regard to irritation caused by adver-
tising (seventh out of nine compared channels) and perceived usefulness of adver-
tising (third out of nine compared channels).
With regard to brand strategy, the study found that there may be significant differ-
ences in the demographics of each social media service and brands should deter-
mine which social media services to use based on their target market. Additionally,
the results show that fast response time in messages and comments is the most
important factor to consumers with regard to brand activity on social media. The
second most important brand activity was posting relevant content.
The conclusion of the relative impacts of social media and traditional media on brand
image, is that brands should start out with the presumption that social and traditional
media are equally significant in regard to the brand image, when they begin forming
their branding strategies. The differences in nature of social media and traditional
media should be accounted for and used as channels that support each other cre-
ating a synergy of each channel’s strengths. Furthermore, even if there was a case
where a company would not agree with social media having the benefits that it is
said to have, it would be unwise to exclude it from their strategy and leave untapped
a channel that the vast majority of consumers is using.
59
8 RELIABILITY AND VALIDITY
The data of the research suffered from non-response bias and possibly other types
of bias, which led to the sample being unrepresentative of the population, mainly
due to the age distribution of the respondents. The questionnaire did not measure
other socio-demographic variables and therefore it may not be known if there are
other problem areas with regard to representativeness of the sample.
Due to the bias in the sample, the results may not be directly generalizable to the
general population, but they are useful for providing an approximation of the differ-
ences in potential impact of social media and traditional media on brand image. To
account for the bias, the results were presented in a weighted form when appropri-
ate.
The validity may be questioned with regard to the data gathering instrument, and
more specifically to the variables that it was intended to measure and whether they
may be considered valid in measuring these variables accurately. However, for the
most part, the results seem to be in line with previous theory and research on the
subject.
60
BIBLIOGRAPHY
Aaker, D. 1996. Building strong brands. New York: Free Press.
American Marketing Association. 2016. [Web page]. Dictionary. [Ref. 3 Jan. 2016]. Available at: https://www.ama.org/resources/Pages/Dictionary.aspx?dLetter=B
Barr, A. 2013. Google's social network sees 58% jump in users. [Online article]. USA Today. [Ref. 17. December 2015]. Available at: http://www.usato-day.com/story/tech/2013/10/29/google-plus/3296017/
Blanchard, O. 2011. Social media ROI. Indianapolis, Ind.: Que.
Blattberg, R. and Wisniewski, K. 1989. Price-Induced Patterns of Competition. Marketing Science, 8 (4), 291-309.
Brand Image - Meaning and Concept of Brand Image. 2016. [Web page] Manage-ment Study Guide [Ref. 4 Jan. 2016]. Available at: http://www.management-studyguide.com/brand-image.htm
Building a Brand. 2004 [E-book]. Bradford, GBR: Emerald Group Publishing Ltd. [Ref. 2 October 2015.] Available in the ProQuest ebrary.
BusinessDictionary.com, 2016. [Web page] What is brand promise? definition and meaning. [Ref. 28 Jan. 2016]. Available at: http://www.businessdiction-ary.com/definition/brand-promise.html
Celaya, J. 2008. La empresa en la Web 2.0. Barcelona: Gestion 2000.
Cite, 2012. [Web page] Different types of social media. [Ref. 28 Jan. 2016]. Availa-ble at: https://www.cite.co.uk/the-different-types-of-social-media/
Clifton, R., Simmons, J. and Ahmad, S. 2003. Brands and branding. London: Pro-file Books.
Daily Mail, 2015. [Web page] Super Bowl breaks TV ratings record as more view-ers than ever tune in to the big game. [Ref. 31 Jan. 2016]. Available at: http://www.dailymail.co.uk/news/article-2936488/Record-overnight-ratings-game.html
DataStar. 2013. [Online publication]. Weight, Weight... Please Tell Me!. [Ref. 27 Jan. 2016]. Available at: http://www.surveystar.com/startips/apr2013.pdf
Davis, M. and Baldwin, J. 2005. More than a name. Lausanne: AVA.
61
Davis, S. and Bojalil Rebora, M. 2002. La marca: Máximo valor de su empresa. Mexico: Pearson Educacion.
De Chernatony, L., McDonald, M. and Wallace, E. 2011. Creating powerful brands. 4th edition. Amsterdam: Butterworth-Heinemann.
Dobronte, A. 2013. [Web page] The importance of socio-demographics in online surveys. CheckMarket. [Ref. 31 Jan. 2016]. Available at: https://www.checkmarket.com/2013/08/the-importance-of-socio-demographics-in-online-surveys/
Durango, A. 2015. Mercadotecnia en los Medios Sociales. IT Campus Academy.
Eurostat, 2015. [Web page] Information society statistics - households and individ-uals - Statistics Explained. [Ref. 22 Jan. 2016]. Available at: http://ec.eu-ropa.eu/eurostat/statistics-explained/index.php/Information_society_statistics_-_households_and_individuals
Facebook, 2015. [Web page]. Facebook for business. [Ref. 03. October 2015]. Available at: http://www.facebook.com/business
Fennell, G. 1978. Consumer's Perceptions of the Product-Use Situation. Journal of Marketing (42), 38-47.
Geelhoed, J., Samhoud, S. and Hamurcu, N. 2013. Creating lasting value. Lon-don: Kogan Page Publishers.
Google, 2016. [Web page] What is a YouTube Masthead? [Ref. 31 Jan. 2016]. Available at: https://support.google.com/richmedia/answer/2560792?hl=en
Grahl, T. 2016. The 6 Types of Social Media. [Web page]. Timgrahl.com. [Ref. 28 Jan. 2016]. Available at: http://timgrahl.com/the-6-types-of-social-media/
Graves, J. 2016. What Can Social Media Intelligence Do for Your Brand. [Web page] American Marketing Association. [Ref. 28 Jan. 2016]. Available at: https://www.ama.org/resources/Best-Practices/Pages/What-Can-Social-Media-Intelligence-Do-for-Your-Brand.aspx
Hausman, A. 2014. Social Media Versus Traditional Media. [Web page] Hausman Marketing Letter. [Ref. 6 Jan. 2016]. Available at: https://www.hausmanmarket-ingletter.com/social-media-versus-traditional-media/
Investopedia. 2003. [Web page] Brand Equity Definition. [Ref. 9 Jan. 2016]. Avail-able at: http://www.investopedia.com/terms/b/brandequity.asp
62
Juslén, J. 2009. Netti mullistaa markkinoinnin. Hyödynnä uudet mahdollisuudet. Hämeenlinna: Talentum.
Kapferer, J. 2012. The new strategic brand management. London: Kogan Page.
Karjaluoto, H. 2010. Digitaalinen markkinointiviestintä. Esimerkkejä parhaista käytännöistä yritys- ja kuluttajamarkkinointiin. Jyväskylä: WSOY
Keller, K. L. 1993. Conceptualizing, Measuring, and Managing Customer-Based Brand Equity. Journal of Marketing (57), 1-22.
Kemp, S. 2014. Social, Digital & Mobile Worldwide in 2014. [Web page]. Weareso-cial.net. [Ref. 17. December 2015]. Available at: http://weareso-cial.net/blog/2014/01/social-digital-mobile-worldwide-2014/
Kotler, P. 2015. Dr. Philip Kotler Answers Your Questions on Marketing. [Web page] Kotler Marketing Group, Inc. [Ref. 22 Dec. 2015]. Available at: http://www.kotlermarketing.com/phil_questions.shtml
London School of Economics and Political Science, 2010. [Web page] When is it better to do qualitative or quantitative research?. [Ref. 29 Jan. 2016]. Available at: http://www.lse.ac.uk/media@lse/research/EUKidsOnline/BestPrac-ticeGuide/FAQ01.aspx
Madrigal, D. and McClain, B. 2012. [Web page] Strengths and Weaknesses of Quantitative and Qualitative Research. UXmatters. [Ref. 31 Jan. 2016]. Availa-ble at: http://www.uxmatters.com/mt/archives/2012/09/strengths-and-weak-nesses-of-quantitative-and-qualitative-research.php
Maslow, A. H. 1970. Motivation and Personality, 2nd ed. New York: Harper & Row Publishers, Inc.
Miletsky, J. and Smith, G. 2009. Perspectives on branding. Boston, Mass.: Course Learning.
Mohsin, M. 2009. Encyclopaedia of brand equity management. Mumbai [India]: Himalaya Pub. House.
Montero Torres, R. 2015. Las Redes Sociales en la Empresa. IT Campus Acad-emy.
MTV, Kurio and Laurea University of Applied Sciences, 2015. Suomalaisten sosiaalisen median käyttö 2015. [Online publication] MTV. [Ref. 22 Jan. 2016]. Available at: http://im.mtv.fi/blob/4941078/6c812d65a85598db50814610bd1da47b/suoma-laisten-sosiaalisen-median-kaytto-2015-mtv-white-paper-data.pdf
63
Nations D. 2012. [Web page] What is social media? [Ref. 03 October 2015]. Avail-able at: http://webtrends.about.com/od/web20/a/social-media.htm
Oxford Dictionaries, 2016a. [Web page]. social network - definition of social net-work in English from the Oxford dictionary. [Ref. 28 Jan. 2016]. Available at: http://www.oxforddictionaries.com/definition/english/social-network
Oxford Dictionaries, 2016b. [Web page]. blog - definition of blog in English from the Oxford dictionary. [Ref. 28 Jan. 2016]. Available at: http://www.oxforddic-tionaries.com/definition/english/blog
Parameswaran, M. 2006. Building brand value. New Delhi: Tata McGraw-Hill.
Park, C., Jaworski, B. and Maclnnis, D. 1986. Strategic Brand Concept-Image Management. Journal of Marketing, 50(4), 621-35.
Percy, L. and Rossiter, J. 1992. A model of brand awareness and brand attitude advertising strategies. Psychology and Marketing, 9(4), 263-274.
Perkins, M. (2014). How to Develop a Strong Visual Brand on Social Media. [Web page] Hubspot.com. [Ref. 28 Jan. 2016]. Available at: http://blog.hub-spot.com/marketing/strong-brand-voice-social-media
Pozin, I. 2014. [Web page] Small Business Expert: Answers To Your Five Biggest Social Media Branding Questions. Forbes. [Ref. 28 Jan. 2016]. Available at: http://www.forbes.com/sites/ilyapozin/2014/11/07/small-business-expert-an-swers-to-your-five-biggest-social-media-branding-questions/
Quilici, M. 2011. Principles of Traditional Media vs. Social Media. [Web page] Q. Consulting. [Ref. 6 Jan. 2016]. Available at: http://qconsultinginc.com/blog/prin-ciples-of-traditional-media-vs-social-media/
Riezebos, H., Kist, B. and Kootstra, G. 2003. Brand management. Harlow: Finan-cial Times Prentice Hall.
Rossiter, J. R., Percy, L. 1987. Advertising and Promotion Management. New York: McGraw-Hill Book Company.
Smith, P., Pulford, A. and Berry, C. (1999). Strategic marketing communications. London: Kogan Page.
Statista. 2015a. Global social networks ranked by number of users. [Web page]. Statista.com. [Ref. 17. December 2015]. Available at: http://www.sta-tista.com/statistics/272014/global-social-networks-ranked-by-number-of-users/
64
Statista. 2015b. Number of monthly active Facebook users worldwide as of 3rd quarter 2015 (in millions). [Web page]. Statista.com. [Ref. 17. December 2015]. Available at: http://www.statista.com/statistics/264810/number-of-monthly-ac-tive-facebook-users-worldwide/
Sussman, K. and Pankonien, L. 2011. Addressing Negative Press in Social Media Marketing. [Web page] Social Distillery. [Ref. 31 Jan. 2016]. Available at: http://socialdistillery.com/wp-content/uploads/2013/03/Addressing-Negative-Press.pdf
The Research Bunker, 2016. [Web page] What is Weighting Data in Market Re-search. [Ref. 26 Jan. 2016]. Available at: https://rmsbunkerblog.word-press.com/tag/what-is-weighting-data-in-market-research/
Tilastokeskus, 2016. [Web page] Tilastokeskus - Väestö. [Ref. 14 Jan. 2016]. Available at: http://tilastokeskus.fi/tup/suoluk/suoluk_vaesto.html
Turban E., King D., Mckay J., Marshall P., Lee J. & Viehland D. 2008. Electronic Commerce 2008 A managerial perspective. London: Pearson Education.
Turban, E., King, D., Lee, J.K., Liang, T.-P., Turban, D.C. 2015. Electronic com-merce: A Managerial and Social Networks Perspective. Cham: Springer.
Vanderklippe, N. 2015. China’s top video site Youku Tudou plans user-targeted productions. [Web page]. The Globe and Mail. [Ref. 17. December 2015]. Avail-able at: http://www.theglobeandmail.com/report-on-business/international-busi-ness/chinas-top-video-site-youku-tudou-plans-user-targeted-productions/arti-cle22816108/
Weilbacher, W. 1999. El marketing de la marca. Barcelona: Granica.
“What is brand? Definition and meaning”. 2015. [Web page]. Business Dictionary. [Ref. 01 October 2015]. Available at: http://www.businessdictionary.com/defini-tion/brand.html
Wilson, J. and Blumenthal, I. 2008. Managing brand you. New York: AMA-COM/American Management Association.
YouTube, 2012. [Web page] KONY 2012. [Ref. 31 Jan. 2016]. Available at: https://www.youtube.com/watch?v=Y4MnpzG5Sqc
YouTube, 2013. [Web page] Ultra Reality: What would you do in this situation? - LG Meteor Prank. [Ref. 31 Jan. 2016]. Available at: http://www.youtube.com/watch?v=ynvKWYvyCqw
Youtube statistics directory. 2015. [Web page]. Socialbakers.com. [Ref. 17. De-cember 2015]. Available at: http://www.socialbakers.com/statistics/youtube/

65
APPENDICES
APPENDIX 1. Questionnaire form
1(5)
APPENDIX 1. Questionnaire form
Social media survey
*Required
1. Gender o Male o Female
2. Age 14 or under 15-19 20-24 25-29 30-34 35-39 40-44 45-49 50-54 55-59 60-64 65 or over
3. How many hours per day do you spend on social media? * (e.g. Facebook, Twitter)
Your answer _____
4. How many hours per day do you spend on traditional media? * (e.g. television, radio, magazines)
Your answer _____
5. In the past 30 days, have you done the following activities on social media? Recommended a product or service to friends Criticized a product or service in a negative way Shared content from companies, brands or products (e.g. posts, photos, videos) Commented on a company or brand page Requested customer support 'Liked' or 'followed' a company or brand page
6. How many 'friends' or 'followers' do you have on the social media service that you use
the most? Your answer _____
7. Have you ever 'liked' or 'followed' a brand on social media, because a friend of yours
'liked' or 'followed' it? * o Yes o No
8. Select all social media services that you have used in the past 30 days Facebook Google+ Instagram
2(5)
LinkedIn Pinterest Tumblr Twitter Youtube Other: _____
9. Are you more likely to trust a brand that is present on social media? *
o Yes o No
10. Are you less likely to trust a brand that is not present on social media * o Yes o No
11. Are you more likely to trust a brand that is present on traditional media? * o Yes o No
12. Are you less likely to trust a brand that is not present on traditional media? * o Yes o No
Rate the following claims on a scale of 1 (completely disagree) to 5 (completely agree)
1 - Completely disagree
2 - Somewhat disagree
3 - Not agree nor disagree
4 - Somewhat agree
5 - Completely agree
Communication on social media can make a brand more...
13. Reliable * 1 2 3 4 5
14. Credible * 1 2 3 4 5
15. Attractive * 1 2 3 4 5
16. Desirable * 1 2 3 4 5
17. Memorable * 1 2 3 4 5
18. Communication on social media may create a more positive image for a brand * 1 2 3 4 5
Communication on traditional media can make a brand more...
19. Reliable * 1 2 3 4 5
20. Credible * 1 2 3 4 5
3(5)
21. Attractive * 1 2 3 4 5
22. Desirable * 1 2 3 4 5
23. Memorable * 1 2 3 4 5
24. Communication on traditional media can create a more positive image for a brand * 1 2 3 4 5
How irritating do you experience advertising to be in the following media channels?
Please rate on a scale of 1 to 5.
1 - Not irritating
2 - Slightly irritating
3 - Somewhat irritating
4 - Very irritating
5 - Extremely irritating
25. Television * 1 2 3 4 5
26. Radio * 1 2 3 4 5
27. Social media * 1 2 3 4 5
28. Search engines * (e.g. Google)
1 2 3 4 5
29. Other websites * 1 2 3 4 5
30. Newspapers and magazines * 1 2 3 4 5
31. Mail * 1 2 3 4 5
32. E-mail *
1 2 3 4 5
33. Telephone *
1 2 3 4 5
How useful to yourself do you experience advertising to be in the following media chan-nels?
Please rate on a scale of 1 to 5.
1 - Not useful
2 - Slightly useful
3 - Somewhat useful
4 - Very useful
5 - Extremely useful
34. Television *
4(5)
1 2 3 4 5
35. Radio * 1 2 3 4 5
36. Social media *
1 2 3 4 5
37. Search engines * (e.g. Google)
1 2 3 4 5
38. Other websites * 1 2 3 4 5
39. Newspapers and magazines * 1 2 3 4 5
40. Mail * 1 2 3 4 5
41. E-mail * 1 2 3 4 5
42. Telephone * 1 2 3 4 5
When you 'like' or 'follow' a brand on social media, how important is it to you that the page is...
Please rate on a scale of 1 to 5.
1 - Not important
2 - Slightly important
3 - Somewhat important
4 - Very important
5 - Extremely important
43. Posting interesting content (not necessarily product-related) *
1 2 3 4 5
44. Posting new content often *
1 2 3 4 5
45. Responding to comments fast *
1 2 3 4 5
46. Responding to messages fast *
1 2 3 4 5
47. Creating competitions or lotteries *
1 2 3 4 5
48. Posting information about products *
1 2 3 4 5
49. Posting promotions and offers * 1 2 3 4 5
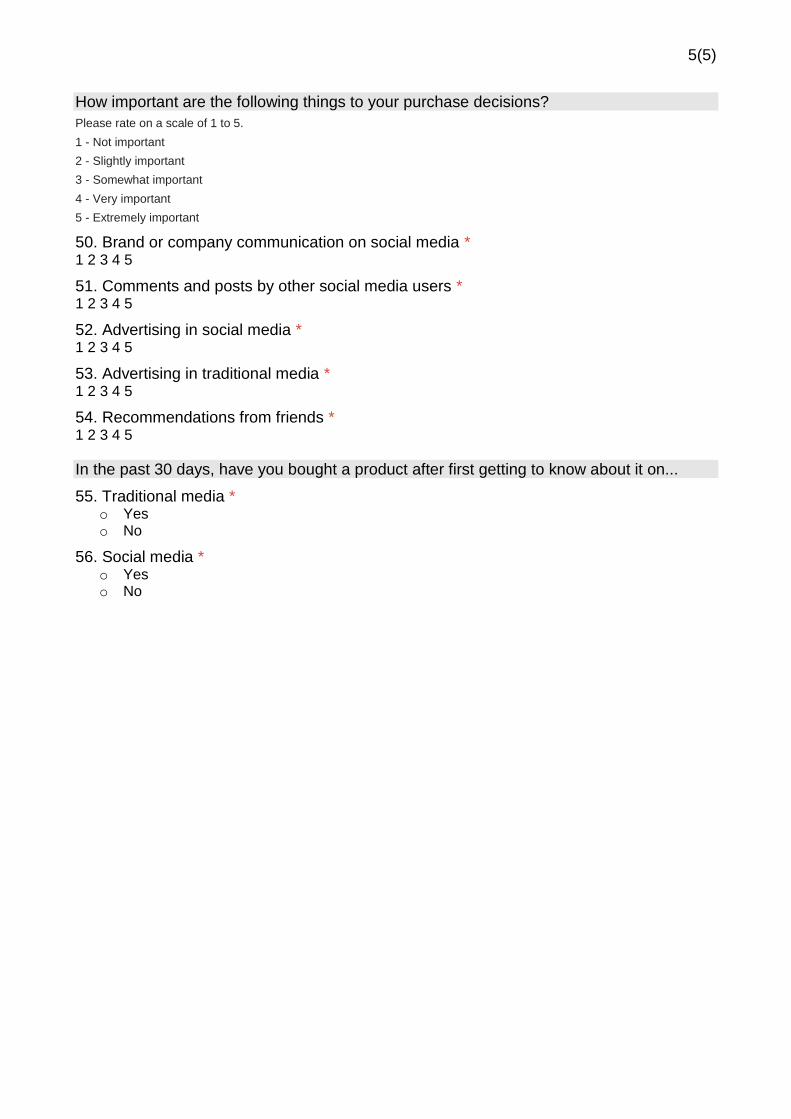
5(5)
How important are the following things to your purchase decisions?
Please rate on a scale of 1 to 5.
1 - Not important
2 - Slightly important
3 - Somewhat important
4 - Very important
5 - Extremely important
50. Brand or company communication on social media * 1 2 3 4 5
51. Comments and posts by other social media users * 1 2 3 4 5
52. Advertising in social media * 1 2 3 4 5
53. Advertising in traditional media * 1 2 3 4 5
54. Recommendations from friends * 1 2 3 4 5
In the past 30 days, have you bought a product after first getting to know about it on...
55. Traditional media * o Yes o No
56. Social media * o Yes o No