Consumer preference over branded jewellery and non branded jwellery
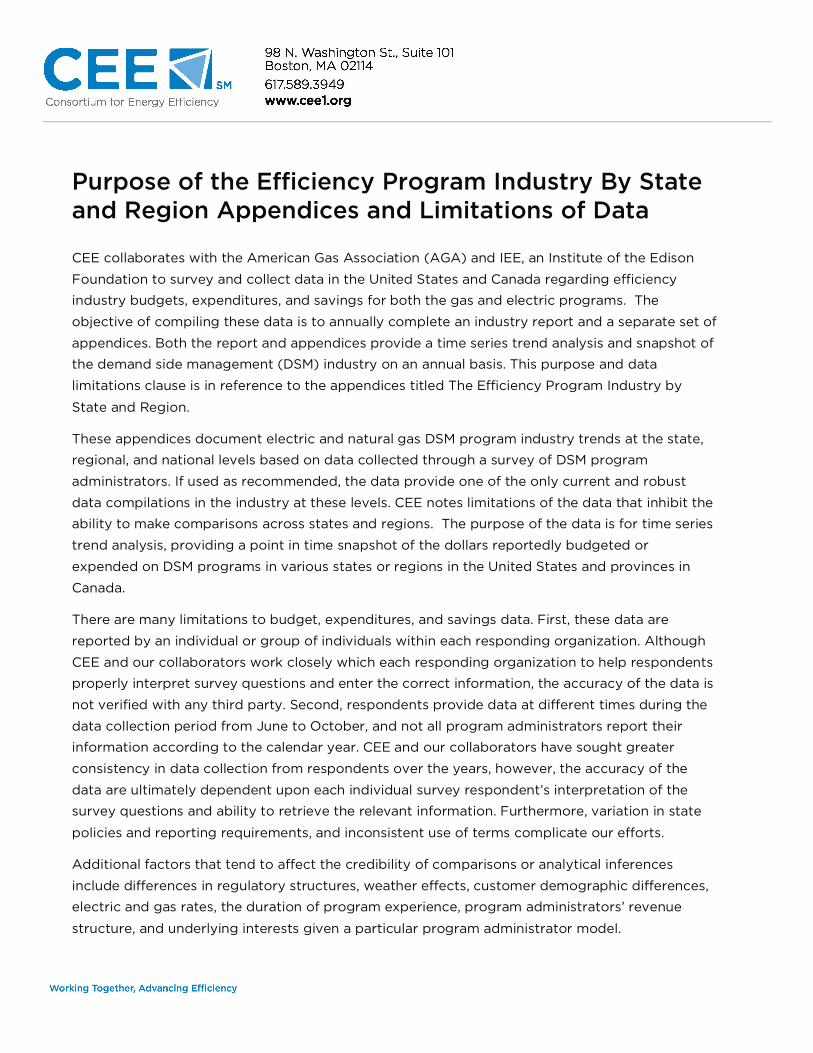
Purpose of the Efficiency Program Industry By State and Region Appendices and Limitations of Data
CEE collaborates with the American Gas Association (AGA) and IEE, an Institute of the Edison
Foundation to survey and collect data in the United States and Canada regarding efficiency
industry budgets, expenditures, and savings for both the gas and electric programs. The
objective of compiling these data is to annually complete an industry report and a separate set of
appendices. Both the report and appendices provide a time series trend analysis and snapshot of
the demand side management (DSM) industry on an annual basis. This purpose and data
limitations clause is in reference to the appendices titled The Efficiency Program Industry by
State and Region.
These appendices document electric and natural gas DSM program industry trends at the state,
regional, and national levels based on data collected through a survey of DSM program
administrators. If used as recommended, the data provide one of the only current and robust
data compilations in the industry at these levels. CEE notes limitations of the data that inhibit the
ability to make comparisons across states and regions. The purpose of the data is for time series
trend analysis, providing a point in time snapshot of the dollars reportedly budgeted or
expended on DSM programs in various states or regions in the United States and provinces in
Canada.
There are many limitations to budget, expenditures, and savings data. First, these data are
reported by an individual or group of individuals within each responding organization. Although
CEE and our collaborators work closely which each responding organization to help respondents
properly interpret survey questions and enter the correct information, the accuracy of the data is
not verified with any third party. Second, respondents provide data at different times during the
data collection period from June to October, and not all program administrators report their
information according to the calendar year. CEE and our collaborators have sought greater
consistency in data collection from respondents over the years, however, the accuracy of the
data are ultimately dependent upon each individual survey respondent’s interpretation of the
survey questions and ability to retrieve the relevant information. Furthermore, variation in state
policies and reporting requirements, and inconsistent use of terms complicate our efforts.
Additional factors that tend to affect the credibility of comparisons or analytical inferences
include differences in regulatory structures, weather effects, customer demographic differences,
electric and gas rates, the duration of program experience, program administrators’ revenue
structure, and underlying interests given a particular program administrator model.

2
Given the wide variation in the circumstances surrounding individual data points, we do not
believe these data are suitable for comparisons at any level other than the levels represented
within this report. CEE notes that when this information is used beyond the stated limits,
reviewers are encouraged to inquire as to the sufficiency of the method or quality of
supplemental data for the specified purpose.
Terms of Use for the Efficiency Program Industry By State and Region Appendices
The terms of use for the Efficiency Program Industry By State and Region Appendices are
significantly more restrictive than the terms of use for the State of the Efficiency Program
Industry Report. Please review carefully the terms of use below.
This document may not be reproduced, disseminated, published, or transferred in any form or by
any means, except with prior request or written permission of CEE.
CEE does not make, sell, or distribute any products or services, other than CEE membership
services, and CEE does not play any implementation role in the programs offered and operated
by or on behalf of its members. The accuracy of member program information discussed in this
document is the sole responsibility of the organization furnishing such information to CEE. CEE is
not responsible for any inaccuracies or misrepresentations that may appear therein. CEE does
not itself test or cause to be tested any data, equipment, or technology for merchantability,
fitness for purpose, product safety, or energy efficiency and makes no claim with respect thereto.
All data published by CEE in this Annual Report has been supplied by third parties. CEE has not
independently verified the accuracy of any such data and assumes no responsibility for errors or
omissions therein. The reference and descriptions of products or services within this document
are provided “as is” without any warranty of any kind, express or implied. CEE is not liable for any
damages, including consequential damages, of any kind that may result to the user from the use
of the site, or any of the products or services described therein.
Data Requests
These appendices are available for viewing only and cannot be downloaded. To request these
appendices in an Excel format, please send an email to [email protected].
3
Erratum
Tables 1, 2, and 6 of these appendices were updated on June 13, 2013 to correct an error in
Washington’s natural gas efficiency budgets.

2006200620062006 2007200720072007 2008200820082008 2009200920092009 2010201020102010 2011201120112011 2012201220122012
Northeast Northeast Northeast Northeast 674.1674.1674.1674.1 755.9755.9755.9755.9 869.7869.7869.7869.7 1,255.61,255.61,255.61,255.6 1,853.41,853.41,853.41,853.4 2,712.92,712.92,712.92,712.9 2,638.22,638.22,638.22,638.2
New England …………………………………………….New England …………………………………………….New England …………………………………………….New England ……………………………………………. 277.2277.2277.2277.2 340.9340.9340.9340.9 358.9358.9358.9358.9 430.6430.6430.6430.6 606.5606.5606.5606.5 706.3706.3706.3706.3 917.0917.0917.0917.0
Connecticut ……………………………………...…………….60.5 107.7 114.3 118.2 134.0 120.2 137.5
Maine ……………………………………..…………….… 11.9 15.9 16.8 20.8 14.6 14.0 23.1
Massachusetts …………………..……………….. 148.1 148.8 148.9 208.5 357.1 506.7 613.9
New Hampshire …………………...……………. 17.8 21.3 22.0 19.3 29.4 25.1 26.9
Rhode Island …………………………..………….. 21.0 21.8 20.9 31.1 35.2 - 75.4
Vermont ………………………………….………….. 17.9 25.3 36.1 32.6 36.2 40.2 40.1
Mid-Atlantic ……………………………..…………Mid-Atlantic ……………………………..…………Mid-Atlantic ……………………………..…………Mid-Atlantic ……………………………..………… 396.9396.9396.9396.9 415.0415.0415.0415.0 510.7510.7510.7510.7 825.0825.0825.0825.0 1,246.91,246.91,246.91,246.9 2,006.72,006.72,006.72,006.7 1,721.21,721.21,721.21,721.2
New Jersey …………………………….………… 125.2 144.4 196.8 388.9 395.0 499.4 483.6
New York**** …………………………………..……….. 271.7 270.6 314.0 436.1 688.4 1,215.5 877.3
Pennsylvania* ……………………………..………. - - - - 163.5 291.8 360.4
Midwest Midwest Midwest Midwest 375.2375.2375.2375.2 355.4355.4355.4355.4 490.5490.5490.5490.5 662.3662.3662.3662.3 1,013.41,013.41,013.41,013.4 1,071.21,071.21,071.21,071.2 1,461.01,461.01,461.01,461.0
Illinois ………………………………...……………….. 32.8 8.5 41.8 69.7 133.4 175.3 336.1
Indiana ……………………………………….………. 5.7 10.6 11.7 39.1 38.8 94.4 135.4
Iowa ……………………………………………….. 93.9 94.7 96.7 134.5 156.7 154.8 180.8
Kansas …………………………..……………………. - 4.3 4.8 4.3 14.6 17.6 13.5
Michigan…………………………………………. 15.0 20.0 20.0 72.3 103.0 184.8 231.5
Minnesota …………………………….………….. 99.9 89.6 89.2 84.3 151.0 165.8 164.3
Missouri …………………………………...………… 8.3 7.7 9.1 24.6 47.4 61.3 40.8
Nebraska ………………………………..…………… - - - 12.0 20.1 4.9 11.9
North Dakota …………………….……………. - - - 1.0 0.1 0.7 1.0
Ohio………………………………………...…………. 15.8 6.2 76.4 49.6 183.4 183.5 261.1
South Dakota ………………………….…………. - - - 1.2 1.6 1.8 2.2
Wisconsin ……………………………...…………. 103.9 113.8 140.8 169.7 163.4 26.5 82.4
South South South South 374.8374.8374.8374.8 402.2402.2402.2402.2 494.2494.2494.2494.2 916.3916.3916.3916.3 965.2965.2965.2965.2 1,254.51,254.51,254.51,254.5 1,256.31,256.31,256.31,256.3
South Central …………………..……………South Central …………………..……………South Central …………………..……………South Central …………………..…………… 99.599.599.599.5 99.199.199.199.1 143.9143.9143.9143.9 377.7377.7377.7377.7 358.7358.7358.7358.7 495.9495.9495.9495.9 485.1485.1485.1485.1
Alabama ……………………………….…………… - - - 44.3 63.2 82.1 55.7
Arkansas …………………………….…………… - - 0.9 8.9 17.5 33.3 66.7
Kentucky…………………………..………………. 2.5 2.4 2.4 29.6 43.5 50.5 53.9
Louisiana ……………………………..…………….. - - - 2.4 - - 3.7
Mississippi ……………………………..…………….. - - - 4.4 17.8 33.2 16.5
Oklahoma ……………………….………………… - - - 3.8 30.6 44.3 45.7
Tennessee ……………………………………….. - - - 64.0 116.8 80.3
Texas…………………………………...…………….. 82.9 83.0 114.3 110.1 122.2 135.7 162.6
Tennessee Valley Authority*….…………… 14.1 13.7 26.4 174.3 - - -
Table 1. U.S. Electric and Gas Program Budgets by State, Including Demand Response, 2006 - 2012 Table 1. U.S. Electric and Gas Program Budgets by State, Including Demand Response, 2006 - 2012 Table 1. U.S. Electric and Gas Program Budgets by State, Including Demand Response, 2006 - 2012 Table 1. U.S. Electric and Gas Program Budgets by State, Including Demand Response, 2006 - 2012
(Millions USD)(Millions USD)(Millions USD)(Millions USD)

2006200620062006 2007200720072007 2008200820082008 2009200920092009 2010201020102010 2011201120112011 2012201220122012
South Atlantic …………………………………South Atlantic …………………………………South Atlantic …………………………………South Atlantic ………………………………… 275.2275.2275.2275.2 303.1303.1303.1303.1 350.2350.2350.2350.2 538.7538.7538.7538.7 606.5606.5606.5606.5 758.6758.6758.6758.6 771.2771.2771.2771.2
Delaware …………………………………………… - - 1.0 - - - -
District of Columbia …………………………. - - 1.5 - - - -
Florida ……………………………………………… 245.4 256.0 303.0 321.7 322.9 367.1 425.8
Georgia ……………………………………………… 27.7 29.7 38.6 40.5 43.1 31.7 48.5
Maryland …………………………………………… 2.2 17.3 6.1 76.9 116.9 216.3 150.5
North Carolina …………………………………. - - - 80.9 86.4 107.7 99.5
South Carolina ………………………………….. - - - 18.7 30.8 28.2 31.2
Virginia ………………………………………………. - - - - 6.4 7.6 5.7
West Virginia ………………………………….. - - - - - - 9.9
West West West West 1,223.81,223.81,223.81,223.8 1,625.11,625.11,625.11,625.1 1,827.11,827.11,827.11,827.1 2,356.02,356.02,356.02,356.0 2,658.92,658.92,658.92,658.9 2,869.02,869.02,869.02,869.0 2,902.02,902.02,902.02,902.0
Pacific Northwest ……………………….Pacific Northwest ……………………….Pacific Northwest ……………………….Pacific Northwest ………………………. 223.8223.8223.8223.8 256.0256.0256.0256.0 348.7348.7348.7348.7 415.6415.6415.6415.6 428.6428.6428.6428.6 619.0619.0619.0619.0 652.2652.2652.2652.2
Idaho…………………………………………….….. 15.0 22.9 27.2 50.8 51.6 50.5 62.2
Montana ………………………………………… 10.6 12.0 15.4 0.3 9.5 10.1 16.5
Oregon …………………………………………… 51.0 56.0 77.1 106.0 119.0 136.9 152.9
Washington…………………………………… 66.4 87.2 131.5 151.4 141.8 180.5 253.0
BPA and NEEA*****………………………………… 80.8 78.0 97.5 107.2 106.8 241.1 167.6
Pacific West ………………………………………..Pacific West ………………………………………..Pacific West ………………………………………..Pacific West ……………………………………….. 891.5891.5891.5891.5 1,234.71,234.71,234.71,234.7 1,286.51,286.51,286.51,286.5 1,648.21,648.21,648.21,648.2 1,852.11,852.11,852.11,852.1 1,805.01,805.01,805.01,805.0 1,832.61,832.61,832.61,832.6
Alaska ………………………………………………… - - - - - -
California …………………………………………… 872.6 1,210.3 1,255.5 1,606.3 1,832.8 1,805.0 1,799.3
Hawaii …………………………………………………. 18.9 24.4 31.0 41.8 19.3 - 33.3
Southwest …………………………………………Southwest …………………………………………Southwest …………………………………………Southwest ………………………………………… 108.4108.4108.4108.4 134.4134.4134.4134.4 191.9191.9191.9191.9 292.2292.2292.2292.2 378.2378.2378.2378.2 445.1445.1445.1445.1 417.2417.2417.2417.2
Arizona ………………………………………………… 25.9 30.5 46.7 60.9 98.3 144.7 143.2
Colorado……………………………………………. 24.1 24.8 34.4 93.0 96.4 96.5 100.1
Nevada ………………………………………………. 30.1 37.1 56.9 54.0 61.5 79.3 56.4
New Mexico ………………………………………… 2.7 2.0 11.0 19.8 27.0 34.2 36.6
Utah ………………………………………………………. 25.2 38.7 43.0 61.9 90.4 84.7 75.4
Wyoming ……………………………………………… 0.4 1.2 0.0 2.6 4.7 5.7 5.6
Additional Gas Budgets**…………………………….Additional Gas Budgets**…………………………….Additional Gas Budgets**…………………………….Additional Gas Budgets**……………………………. - - - - - - - - - - - - 97.697.697.697.6 85.885.885.885.8 - - - - - - - -
Additional Aggregated Budgets***…………………………Additional Aggregated Budgets***…………………………Additional Aggregated Budgets***…………………………Additional Aggregated Budgets***………………………… - - - - - - - - - - - - 9.29.29.29.2 - - - - 94.094.094.094.0 - - - -
Total Total Total Total 2,647.82,647.82,647.82,647.8 3,138.63,138.63,138.63,138.6 3,681.43,681.43,681.43,681.4 5,297.05,297.05,297.05,297.0 6,576.86,576.86,576.86,576.8 8,001.68,001.68,001.68,001.6 8,257.58,257.58,257.58,257.5
Notes:Notes:Notes:Notes:
***** “BPA and NEEA” is defined as program activities carried out by the Bonneville Power Administration (BPA) and the Northwest Energy
Efficiency Alliance (NEEA) in Idaho, Montana, Oregon, and Washington. Other energy efficiency programs in those states are reported separately
by state.
* The Tennessee Valley Authority (TVA) administers efficiency programs in seven states in the U.S. southern region. Prior to 2010, TVA provided
CEE with aggregated budget and expenditures data for its regional activities, which could not be broken down by state. Starting in 2010, TVA's
budgets are included in state totals.
** Total of gas budgets from respondents that did not grant permission to release their data at the state level.
**** The decrease in NY from 2011 to 2012 can largely be attributed to one program administrator in the state having difficulty reporting their 2011
budget on an annual basis. This program administrator was at the end of a three-year approved budget cycle in 2011 and therefore reported that
their total remaining money from that three-year budget was their budget for 2011, even though they didn’t intend to spend all of the money in
2011.
Between 2009 and 2011, CEE aggregated state level data in cases where we received information from only one program administrator in a state.
States marked with this symbol " - " indicate either (1) no organization responded with data in this state or (2) only one organization responded
with data in this state. CEE aggregated these totals in "Additional Aggregated Budgets".
*** Total budgets in cases where only one program administrator responded with data in a state.
ResidentialResidentialResidentialResidential Low IncomeLow IncomeLow IncomeLow Income
Commercial & Commercial & Commercial & Commercial &
IndustrialIndustrialIndustrialIndustrial Other*Other*Other*Other*
Demand Demand Demand Demand
Response**Response**Response**Response** Grand TotalGrand TotalGrand TotalGrand Total
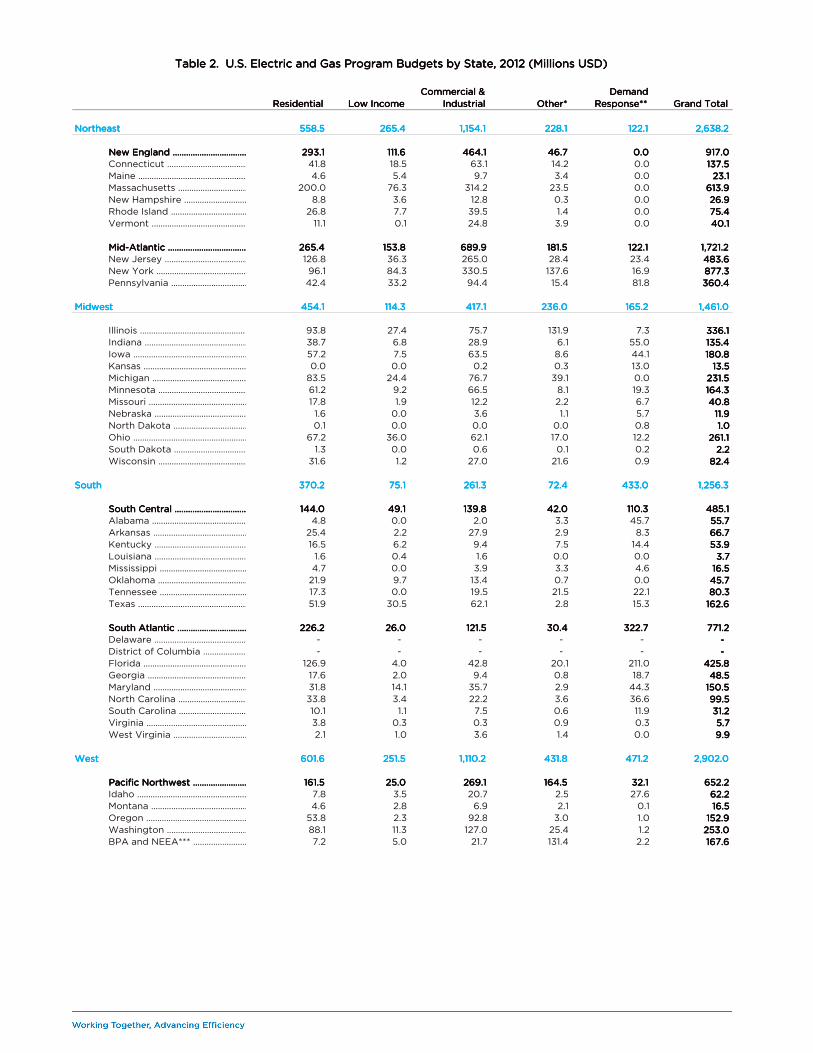
Northeast Northeast Northeast Northeast 558.5558.5558.5558.5 265.4265.4265.4265.4 1,154.11,154.11,154.11,154.1 228.1228.1228.1228.1 122.1122.1122.1122.1 2,638.22,638.22,638.22,638.2
New England ………………………………New England ………………………………New England ………………………………New England ……………………………… 293.1293.1293.1293.1 111.6111.6111.6111.6 464.1464.1464.1464.1 46.746.746.746.7 0.00.00.00.0 917.0917.0917.0917.0
Connecticut ………………………………. 41.8 18.5 63.1 14.2 0.0 137.5137.5137.5137.5
Maine …………………………………………….… 4.6 5.4 9.7 3.4 0.0 23.123.123.123.1
Massachusetts ……………………………….. 200.0 76.3 314.2 23.5 0.0 613.9613.9613.9613.9
New Hampshire ……………………………. 8.8 3.6 12.8 0.3 0.0 26.926.926.926.9
Rhode Island ……………………………….. 26.8 7.7 39.5 1.4 0.0 75.475.475.475.4
Vermont ……………………………………….. 11.1 0.1 24.8 3.9 0.0 40.140.140.140.1
Mid-Atlantic …………………………………Mid-Atlantic …………………………………Mid-Atlantic …………………………………Mid-Atlantic ………………………………… 265.4265.4265.4265.4 153.8153.8153.8153.8 689.9689.9689.9689.9 181.5181.5181.5181.5 122.1122.1122.1122.1 1,721.21,721.21,721.21,721.2
New Jersey …………………………………… 126.8 36.3 265.0 28.4 23.4 483.6483.6483.6483.6
New York …………………………………….. 96.1 84.3 330.5 137.6 16.9 877.3877.3877.3877.3
Pennsylvania ………………………………. 42.4 33.2 94.4 15.4 81.8 360.4360.4360.4360.4
Midwest Midwest Midwest Midwest 454.1454.1454.1454.1 114.3114.3114.3114.3 417.1417.1417.1417.1 236.0236.0236.0236.0 165.2165.2165.2165.2 1,461.01,461.01,461.01,461.0
Illinois ……………………………………….. 93.8 27.4 75.7 131.9 7.3 336.1336.1336.1336.1
Indiana ………………………………………. 38.7 6.8 28.9 6.1 55.0 135.4135.4135.4135.4
Iowa ……………………………………………….. 57.2 7.5 63.5 8.6 44.1 180.8180.8180.8180.8
Kansas ……………………………………………. 0.0 0.0 0.2 0.3 13.0 13.513.513.513.5
Michigan …………………………………………. 83.5 24.4 76.7 39.1 0.0 231.5231.5231.5231.5
Minnesota …………………………………….. 61.2 9.2 66.5 8.1 19.3 164.3164.3164.3164.3
Missouri ………………………………………… 17.8 1.9 12.2 2.2 6.7 40.840.840.840.8
Nebraska ………………………………………… 1.6 0.0 3.6 1.1 5.7 11.911.911.911.9
North Dakota …………………………………. 0.1 0.0 0.0 0.0 0.8 1.01.01.01.0
Ohio ………………………………………………. 67.2 36.0 62.1 17.0 12.2 261.1261.1261.1261.1
South Dakota ………………………………. 1.3 0.0 0.6 0.1 0.2 2.22.22.22.2
Wisconsin ……………………………………. 31.6 1.2 27.0 21.6 0.9 82.482.482.482.4
South South South South 370.2370.2370.2370.2 75.175.175.175.1 261.3261.3261.3261.3 72.472.472.472.4 433.0433.0433.0433.0 1,256.31,256.31,256.31,256.3
South Central ………………………………South Central ………………………………South Central ………………………………South Central ……………………………… 144.0144.0144.0144.0 49.149.149.149.1 139.8139.8139.8139.8 42.042.042.042.0 110.3110.3110.3110.3 485.1485.1485.1485.1
Alabama ……………………………………… 4.8 0.0 2.0 3.3 45.7 55.755.755.755.7
Arkansas ……………………………………… 25.4 2.2 27.9 2.9 8.3 66.766.766.766.7
Kentucky …………………………………………. 16.5 6.2 9.4 7.5 14.4 53.953.953.953.9
Louisiana ……………………………………….. 1.6 0.4 1.6 0.0 0.0 3.73.73.73.7
Mississippi ……………………………………….. 4.7 0.0 3.9 3.3 4.6 16.516.516.516.5
Oklahoma ………………………………………… 21.9 9.7 13.4 0.7 0.0 45.745.745.745.7
Tennessee ……………………………………….. 17.3 0.0 19.5 21.5 22.1 80.380.380.380.3
Texas ……………………………………………….. 51.9 30.5 62.1 2.8 15.3 162.6162.6162.6162.6
South Atlantic …………………………………South Atlantic …………………………………South Atlantic …………………………………South Atlantic ………………………………… 226.2226.2226.2226.2 26.026.026.026.0 121.5121.5121.5121.5 30.430.430.430.4 322.7322.7322.7322.7 771.2771.2771.2771.2
Delaware …………………………………… - - - - - - - - -
District of Columbia …………………… - - - - - - - - -
Florida ……………………………………………… 126.9 4.0 42.8 20.1 211.0 425.8425.8425.8425.8
Georgia ……………………………………………… 17.6 2.0 9.4 0.8 18.7 48.548.548.548.5
Maryland …………………………………………… 31.8 14.1 35.7 2.9 44.3 150.5150.5150.5150.5
North Carolina …………………………………. 33.8 3.4 22.2 3.6 36.6 99.599.599.599.5
South Carolina ………………………………….. 10.1 1.1 7.5 0.6 11.9 31.231.231.231.2
Virginia ………………………………………………. 3.8 0.3 0.3 0.9 0.3 5.75.75.75.7
West Virginia ………………………………….. 2.1 1.0 3.6 1.4 0.0 9.99.99.99.9
West West West West 601.6601.6601.6601.6 251.5251.5251.5251.5 1,110.21,110.21,110.21,110.2 431.8431.8431.8431.8 471.2471.2471.2471.2 2,902.02,902.02,902.02,902.0
Pacific Northwest ……………………….Pacific Northwest ……………………….Pacific Northwest ……………………….Pacific Northwest ………………………. 161.5161.5161.5161.5 25.025.025.025.0 269.1269.1269.1269.1 164.5164.5164.5164.5 32.132.132.132.1 652.2652.2652.2652.2
Idaho …………………………………………….….. 7.8 3.5 20.7 2.5 27.6 62.262.262.262.2
Montana ………………………………………… 4.6 2.8 6.9 2.1 0.1 16.516.516.516.5
Oregon …………………………………………… 53.8 2.3 92.8 3.0 1.0 152.9152.9152.9152.9
Washington …………………………………… 88.1 11.3 127.0 25.4 1.2 253.0253.0253.0253.0
BPA and NEEA*** ………………………………… 7.2 5.0 21.7 131.4 2.2 167.6167.6167.6167.6
Table 2. U.S. Electric and Gas Program Budgets by State, 2012 (Millions USD)Table 2. U.S. Electric and Gas Program Budgets by State, 2012 (Millions USD)Table 2. U.S. Electric and Gas Program Budgets by State, 2012 (Millions USD)Table 2. U.S. Electric and Gas Program Budgets by State, 2012 (Millions USD)

ResidentialResidentialResidentialResidential Low IncomeLow IncomeLow IncomeLow Income
Commercial & Commercial & Commercial & Commercial &
IndustrialIndustrialIndustrialIndustrial Other*Other*Other*Other*
Demand Demand Demand Demand
Response**Response**Response**Response** Grand TotalGrand TotalGrand TotalGrand Total
Pacific West ………………………………………..Pacific West ………………………………………..Pacific West ………………………………………..Pacific West ……………………………………….. 298.5298.5298.5298.5 210.0210.0210.0210.0 679.5679.5679.5679.5 239.9239.9239.9239.9 369.0369.0369.0369.0 1,832.61,832.61,832.61,832.6
Alaska ………………………………………………… - - - - - - - - -
California …………………………………………… 285.2 208.8 663.1 237.6 369.0 1,799.31,799.31,799.31,799.3
Hawaii …………………………………………………. 13.2 1.3 16.4 2.4 0.0 33.333.333.333.3
Southwest …………………………………………Southwest …………………………………………Southwest …………………………………………Southwest ………………………………………… 141.7141.7141.7141.7 16.516.516.516.5 161.7161.7161.7161.7 27.427.427.427.4 70.170.170.170.1 417.2417.2417.2417.2
Arizona ………………………………………………… 53.5 4.1 59.3 11.0 15.3 143.2143.2143.2143.2
Colorado ……………………………………………. 26.4 6.9 45.2 8.1 13.5 100.1100.1100.1100.1
Nevada ………………………………………………. 15.7 0.3 15.6 3.2 21.7 56.456.456.456.4
New Mexico ………………………………………… 9.5 3.4 13.7 1.2 8.8 36.636.636.636.6
Utah ………………………………………………………. 34.6 1.5 24.8 3.6 10.9 75.475.475.475.4
Wyoming ……………………………………………… 1.9 0.3 3.1 0.2 0.0 5.65.65.65.6
Total Total Total Total 1,984.51,984.51,984.51,984.5 706.2706.2706.2706.2 2,942.72,942.72,942.72,942.7 968.3968.3968.3968.3 1,191.51,191.51,191.51,191.5 8,257.58,257.58,257.58,257.5
Notes:Notes:Notes:Notes:
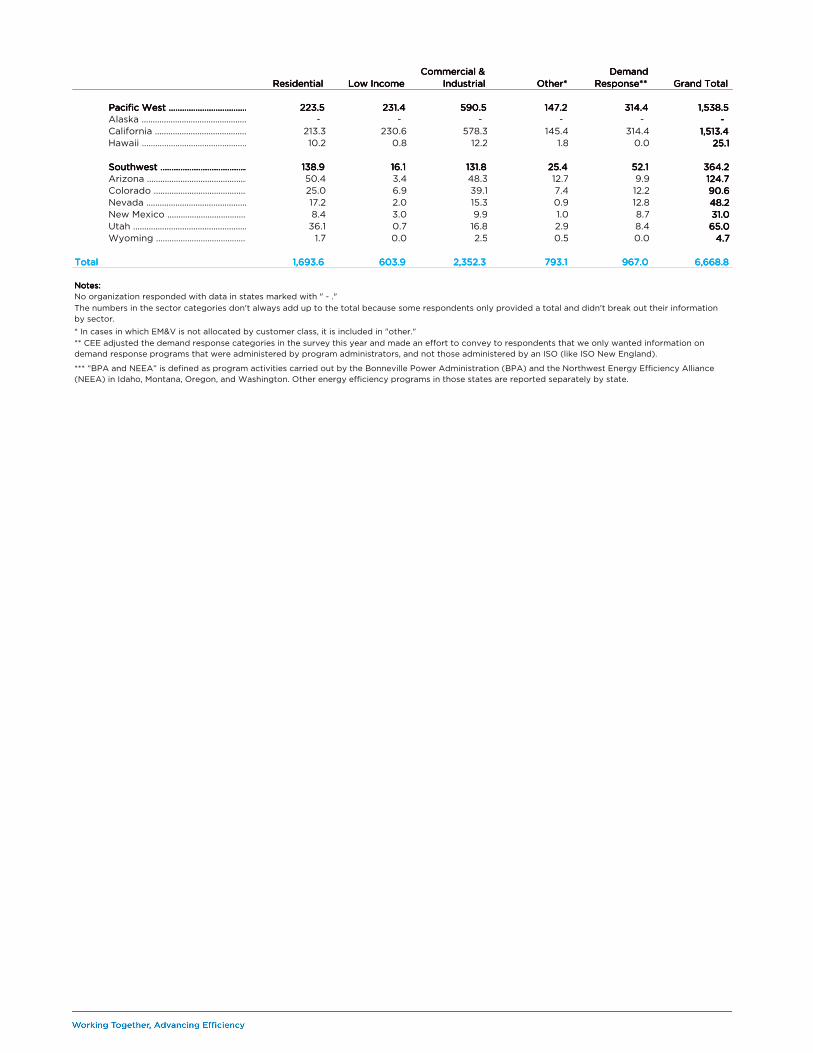
No organization responded with data in states marked with " - ."
* In cases in which EM&V is not allocated by customer class, it is included in "other."
The numbers in the sector categories don't always add up to the total because some respondents only provided a total and didn't break out their information
by sector.
** CEE adjusted the demand response categories in the survey this year and made an effort to convey to respondents that we only wanted information on
demand response programs that were administered by program administrators, and not those administered by an ISO (like ISO New England).
*** “BPA and NEEA” is defined as program activities carried out by the Bonneville Power Administration (BPA) and the Northwest Energy Efficiency Alliance
(NEEA) in Idaho, Montana, Oregon, and Washington. Other energy efficiency programs in those states are reported separately by state.

ResidentialResidentialResidentialResidential Low IncomeLow IncomeLow IncomeLow Income
Commercial & Commercial & Commercial & Commercial &
IndustrialIndustrialIndustrialIndustrial Other*Other*Other*Other*
Demand Demand Demand Demand
Response**Response**Response**Response** Grand TotalGrand TotalGrand TotalGrand Total
Northeast Northeast Northeast Northeast 450.7450.7450.7450.7 176.4176.4176.4176.4 895.7895.7895.7895.7 179.5179.5179.5179.5 84.384.384.384.3 1,921.21,921.21,921.21,921.2
New England ………………………………New England ………………………………New England ………………………………New England ……………………………… 231.5231.5231.5231.5 69.769.769.769.7 410.1410.1410.1410.1 29.729.729.729.7 0.00.00.00.0 742.3742.3742.3742.3
Connecticut ………………………………. 36.8 17.2 63.3 10.7 0.0 128.1128.1128.1128.1
Maine …………………………………………….… 4.2 0.3 10.1 1.1 0.0 15.615.615.615.6
Massachusetts ……………………………….. 154.3 46.0 274.4 14.6 0.0 489.3489.3489.3489.3
New Hampshire ……………………………. 6.4 2.6 10.4 0.2 0.0 20.820.820.820.8
Rhode Island ……………………………….. 17.0 3.4 28.7 0.6 0.0 49.849.849.849.8
Vermont ……………………………………….. 12.8 0.1 23.3 2.6 0.0 38.738.738.738.7
Mid-Atlantic …………………………………Mid-Atlantic …………………………………Mid-Atlantic …………………………………Mid-Atlantic ………………………………… 219.2219.2219.2219.2 106.6106.6106.6106.6 485.6485.6485.6485.6 149.8149.8149.8149.8 84.384.384.384.3 1,178.91,178.91,178.91,178.9
New Jersey …………………………………… 105.5 28.7 93.1 4.0 20.6 255.4255.4255.4255.4
New York …………………………………….. 68.3 49.5 317.7 131.4 8.7 623.2623.2623.2623.2
Pennsylvania ………………………………. 45.5 28.4 74.8 14.5 55.0 300.4300.4300.4300.4
Midwest Midwest Midwest Midwest 382.5382.5382.5382.5 96.396.396.396.3 317.5317.5317.5317.5 169.9169.9169.9169.9 113.3113.3113.3113.3 1,148.81,148.81,148.81,148.8
Illinois ……………………………………….. 66.9 16.0 28.8 87.7 6.9 206.5206.5206.5206.5
Indiana ………………………………………. 21.2 2.4 9.1 2.6 10.5 45.745.745.745.7
Iowa ……………………………………………….. 51.6 9.3 57.7 6.4 41.2 166.2166.2166.2166.2
Kansas ……………………………………………. 0.0 0.0 0.1 0.3 11.5 11.811.811.811.8
Michigan …………………………………………. 74.9 22.0 57.6 26.4 0.0 187.0187.0187.0187.0
Minnesota …………………………………….. 62.5 8.2 62.4 8.3 18.9 160.3160.3160.3160.3
Missouri ………………………………………… 24.2 1.6 32.8 2.7 9.2 70.570.570.570.5
Nebraska ………………………………………… 2.1 0.0 3.3 1.7 4.0 11.211.211.211.2
North Dakota …………………………………. 0.2 0.0 0.0 0.0 0.6 0.70.70.70.7
Ohio ………………………………………………. 52.7 35.7 42.3 16.5 9.3 219.9219.9219.9219.9
South Dakota ………………………………. 1.1 0.0 0.4 0.1 0.2 1.71.71.71.7
Wisconsin ……………………………………. 24.9 1.0 23.0 17.3 1.1 67.367.367.367.3
South South South South 347.8347.8347.8347.8 63.063.063.063.0 186.9186.9186.9186.9 56.656.656.656.6 379.8379.8379.8379.8 1,057.41,057.41,057.41,057.4
South Central ………………………………South Central ………………………………South Central ………………………………South Central ……………………………… 109.0109.0109.0109.0 46.746.746.746.7 101.7101.7101.7101.7 28.528.528.528.5 78.378.378.378.3 364.2364.2364.2364.2
Alabama ……………………………………… 4.4 0.0 1.5 2.3 31.6 39.739.739.739.7
Arkansas ……………………………………… 8.8 1.8 12.0 0.5 5.0 28.028.028.028.0
Kentucky …………………………………………. 10.3 3.0 6.0 5.5 10.5 35.435.435.435.4
Louisiana ……………………………………….. 1.4 0.3 1.7 0.5 0.0 3.83.83.83.8
Mississippi ……………………………………….. 5.3 0.0 2.9 2.3 4.4 15.015.015.015.0
Oklahoma ………………………………………… 20.3 8.9 7.3 0.5 3.6 40.640.640.640.6
Tennessee ……………………………………….. 14.5 0.0 14.9 14.7 15.1 59.259.259.259.2
Texas ……………………………………………….. 43.9 32.8 55.3 2.4 8.1 142.4142.4142.4142.4
South Atlantic …………………………………South Atlantic …………………………………South Atlantic …………………………………South Atlantic ………………………………… 238.8238.8238.8238.8 16.216.216.216.2 85.285.285.285.2 28.128.128.128.1 301.5301.5301.5301.5 693.2693.2693.2693.2
Delaware …………………………………… - - - - - - - - -
District of Columbia …………………… - - - - - - - - -
Florida ……………………………………………… 141.8 2.1 29.3 15.9 196.3 397.2397.2397.2397.2
Georgia ……………………………………………… 14.4 2.0 6.9 0.8 17.1 41.241.241.241.2
Maryland …………………………………………… 33.5 9.3 31.8 3.2 51.2 140.4140.4140.4140.4
North Carolina …………………………………. 35.1 1.9 12.9 5.3 30.3 85.685.685.685.6
South Carolina ………………………………….. 10.1 0.5 3.3 1.4 6.3 21.621.621.621.6
Virginia ………………………………………………. 2.3 0.4 0.1 1.3 0.2 4.44.44.44.4
West Virginia ………………………………….. 1.6 0.1 0.8 0.3 0.0 2.82.82.82.8
WestWestWestWest 512.7512.7512.7512.7 268.3268.3268.3268.3 952.2952.2952.2952.2 387.1387.1387.1387.1 389.6389.6389.6389.6 2,541.32,541.32,541.32,541.3
Pacific Northwest ……………………….Pacific Northwest ……………………….Pacific Northwest ……………………….Pacific Northwest ………………………. 150.4150.4150.4150.4 20.820.820.820.8 229.9229.9229.9229.9 214.5214.5214.5214.5 23.123.123.123.1 638.6638.6638.6638.6
Idaho …………………………………………….….. 9.6 3.1 19.1 3.7 19.8 55.355.355.355.3
Montana ………………………………………… 7.0 1.0 5.4 0.6 0.0 13.913.913.913.9
Oregon …………………………………………… 49.7 1.8 70.6 2.4 0.5 125.0125.0125.0125.0
Washington …………………………………… 75.2 11.8 100.7 6.8 0.3 194.8194.8194.8194.8
BPA and NEEA*** ………………………………… 8.9 3.0 34.1 201.0 2.6 249.6249.6249.6249.6
Table 3. U.S. Electric and Gas Program Expenditures by State, 2011 (Millions USD)Table 3. U.S. Electric and Gas Program Expenditures by State, 2011 (Millions USD)Table 3. U.S. Electric and Gas Program Expenditures by State, 2011 (Millions USD)Table 3. U.S. Electric and Gas Program Expenditures by State, 2011 (Millions USD)
ResidentialResidentialResidentialResidential Low IncomeLow IncomeLow IncomeLow Income
Commercial & Commercial & Commercial & Commercial &
IndustrialIndustrialIndustrialIndustrial Other*Other*Other*Other*
Demand Demand Demand Demand
Response**Response**Response**Response** Grand TotalGrand TotalGrand TotalGrand Total
Pacific West ………………………………………..Pacific West ………………………………………..Pacific West ………………………………………..Pacific West ……………………………………….. 223.5223.5223.5223.5 231.4231.4231.4231.4 590.5590.5590.5590.5 147.2147.2147.2147.2 314.4314.4314.4314.4 1,538.51,538.51,538.51,538.5
Alaska ………………………………………………… - - - - - - - - -
California …………………………………………… 213.3 230.6 578.3 145.4 314.4 1,513.41,513.41,513.41,513.4
Hawaii …………………………………………………. 10.2 0.8 12.2 1.8 0.0 25.125.125.125.1
Southwest …………………………………………Southwest …………………………………………Southwest …………………………………………Southwest ………………………………………… 138.9138.9138.9138.9 16.116.116.116.1 131.8131.8131.8131.8 25.425.425.425.4 52.152.152.152.1 364.2364.2364.2364.2
Arizona ………………………………………………… 50.4 3.4 48.3 12.7 9.9 124.7124.7124.7124.7
Colorado ……………………………………………. 25.0 6.9 39.1 7.4 12.2 90.690.690.690.6
Nevada ………………………………………………. 17.2 2.0 15.3 0.9 12.8 48.248.248.248.2
New Mexico ………………………………………… 8.4 3.0 9.9 1.0 8.7 31.031.031.031.0
Utah ………………………………………………………. 36.1 0.7 16.8 2.9 8.4 65.065.065.065.0
Wyoming ……………………………………………… 1.7 0.0 2.5 0.5 0.0 4.74.74.74.7
Total Total Total Total 1,693.61,693.61,693.61,693.6 603.9603.9603.9603.9 2,352.32,352.32,352.32,352.3 793.1793.1793.1793.1 967.0967.0967.0967.0 6,668.86,668.86,668.86,668.8
Notes:Notes:Notes:Notes:
No organization responded with data in states marked with " - ."
* In cases in which EM&V is not allocated by customer class, it is included in "other."
** CEE adjusted the demand response categories in the survey this year and made an effort to convey to respondents that we only wanted information on
demand response programs that were administered by program administrators, and not those administered by an ISO (like ISO New England).
The numbers in the sector categories don't always add up to the total because some respondents only provided a total and didn't break out their information
by sector.
*** “BPA and NEEA” is defined as program activities carried out by the Bonneville Power Administration (BPA) and the Northwest Energy Efficiency Alliance
(NEEA) in Idaho, Montana, Oregon, and Washington. Other energy efficiency programs in those states are reported separately by state.

ResidentialResidentialResidentialResidential
Low Low Low Low
IncomeIncomeIncomeIncome C&IC&IC&IC&I Other*Other*Other*Other*
Total Total Total Total
EfficiencyEfficiencyEfficiencyEfficiency
Direct Load Direct Load Direct Load Direct Load
ControlControlControlControl
Curtailable Curtailable Curtailable Curtailable
LoadLoadLoadLoad
Interruptible Interruptible Interruptible Interruptible
LoadLoadLoadLoad
Scheduled Scheduled Scheduled Scheduled
LoadLoadLoadLoad
Other Load Other Load Other Load Other Load
ResponseResponseResponseResponse
Total Load Total Load Total Load Total Load
Response **Response **Response **Response **
Time of Use Time of Use Time of Use Time of Use
PricingPricingPricingPricing
Critical Peak Critical Peak Critical Peak Critical Peak
PricingPricingPricingPricing
Real Time Real Time Real Time Real Time
PricingPricingPricingPricing
Other Other Other Other
PricingPricingPricingPricing
Total Price Total Price Total Price Total Price
Response **Response **Response **Response ** Grand TotalGrand TotalGrand TotalGrand Total
Northeast Northeast Northeast Northeast 338.9338.9338.9338.9 132.0132.0132.0132.0 1,019.21,019.21,019.21,019.2 186.5186.5186.5186.5 1,986.51,986.51,986.51,986.5 54.654.654.654.6 17.417.417.417.4 26.926.926.926.9 0.00.00.00.0 0.00.00.00.0 98.998.998.998.9 0.00.00.00.0 0.00.00.00.0 0.00.00.00.0 0.00.00.00.0 0.00.00.00.0 2,108.62,108.62,108.62,108.6
New England ………………………………New England ………………………………New England ………………………………New England ……………………………… 208.0208.0208.0208.0 74.474.474.474.4 406.2406.2406.2406.2 38.838.838.838.8 728.8728.8728.8728.8 0.00.00.00.0 0.00.00.00.0 0.00.00.00.0 0.00.00.00.0 0.00.00.00.0 0.00.00.00.0 0.00.00.00.0 0.00.00.00.0 0.00.00.00.0 0.00.00.00.0 0.00.00.00.0 728.8728.8728.8728.8
Connecticut ………………………………. 31.2 11.8 48.4 12.0 103.3 0.0 0.0 0.0 0.0 0.0 0.0 0.0 0.0 0.0 0.0 0.0 103.3
Maine …………………………………………….… 4.4 5.3 9.1 3.4 22.3 0.0 0.0 0.0 0.0 0.0 0.0 0.0 0.0 0.0 0.0 0.0 22.3
Massachusetts ………………………………..136.0 48.7 281.2 18.3 484.3 0.0 0.0 0.0 0.0 0.0 0.0 0.0 0.0 0.0 0.0 0.0 484.3
New Hampshire ……………………………. 6.0 2.7 9.3 0.2 19.5 0.0 0.0 0.0 0.0 0.0 0.0 0.0 0.0 0.0 0.0 0.0 19.5
Rhode Island ……………………………….. 20.5 5.9 34.0 1.1 61.4 0.0 0.0 0.0 0.0 0.0 0.0 0.0 0.0 0.0 0.0 0.0 61.4
Vermont ……………………………………….. 10.0 0.1 24.2 3.8 38.0 0.0 0.0 0.0 0.0 0.0 0.0 0.0 0.0 0.0 0.0 0.0 38.0
Mid-Atlantic …………………………………Mid-Atlantic …………………………………Mid-Atlantic …………………………………Mid-Atlantic ………………………………… 130.8130.8130.8130.8 57.657.657.657.6 613.0613.0613.0613.0 147.7147.7147.7147.7 1,257.71,257.71,257.71,257.7 54.654.654.654.6 17.417.417.417.4 26.926.926.926.9 0.00.00.00.0 0.00.00.00.0 98.998.998.998.9 0.00.00.00.0 0.00.00.00.0 0.00.00.00.0 0.00.00.00.0 0.00.00.00.0 1,379.81,379.81,379.81,379.8
New Jersey …………………………………… 62.9 14.3 221.2 18.1 320.1 20.0 0.0 0.0 0.0 0.0 20.0 0.0 0.0 0.0 0.0 0.0 343.5
New York …………………………………….. 29.8 26.4 297.6 115.1 680.6 3.9 10.4 0.0 0.0 0.0 14.3 0.0 0.0 0.0 0.0 0.0 697.5
Pennsylvania ………………………………. 38.2 16.9 94.3 14.6 257.0 30.8 6.9 26.9 0.0 0.0 64.6 0.0 0.0 0.0 0.0 0.0 338.8
MidwestMidwestMidwestMidwest 287.7287.7287.7287.7 45.445.445.445.4 319.3319.3319.3319.3 177.6177.6177.6177.6 904.1904.1904.1904.1 49.449.449.449.4 16.616.616.616.6 84.484.484.484.4 0.00.00.00.0 0.00.00.00.0 150.4150.4150.4150.4 0.00.00.00.0 0.00.00.00.0 1.51.51.51.5 0.00.00.00.0 1.61.61.61.6 1,069.41,069.41,069.41,069.4
Illinois ……………………………………….. 57.9 13.1 31.8 105.9 208.6 4.2 0.6 0.0 0.0 0.0 4.8 0.0 0.0 1.5 0.0 1.5 215.9
Indiana ………………………………………. 29.8 5.1 27.1 0.7 62.7 10.0 0.2 44.8 0.0 0.0 55.0 0.0 0.0 0.0 0.0 0.0 117.7
Iowa ……………………………………………….. 30.0 1.8 53.4 5.4 90.6 8.4 10.4 25.3 0.0 0.0 44.1 0.0 0.0 0.0 0.0 0.0 134.7
Kansas ……………………………………………. 0.0 0.0 0.2 0.3 0.5 6.4 0.0 6.5 0.0 0.0 13.0 0.0 0.0 0.0 0.0 0.0 13.5
Michigan ………………………………………….48.4 8.1 61.5 26.6 152.3 0.0 0.0 0.0 0.0 0.0 0.0 0.0 0.0 0.0 0.0 0.0 152.3
Minnesota …………………………………….. 36.8 4.2 48.9 4.1 94.0 11.4 0.1 7.8 0.0 0.0 19.3 0.0 0.0 0.0 0.0 0.0 113.3
Missouri ………………………………………… 13.4 0.8 11.3 0.9 26.3 2.8 3.9 0.0 0.0 0.0 6.7 0.0 0.0 0.0 0.0 0.0 33.0
Nebraska ………………………………………… 1.6 0.0 3.6 1.1 6.2 4.7 1.0 0.0 0.0 0.0 5.7 0.0 0.0 0.0 0.0 0.0 11.9
North Dakota………………………………….. 0.0 0.0 0.0 0.0 0.0 0.6 0.3 0.0 0.0 0.0 0.8 0.0 0.0 0.0 0.0 0.0 0.8
Ohio ………………………………………………. 45.6 12.3 60.8 15.5 200.7 0.0 0.0 0.0 0.0 0.0 0.0 0.0 0.0 0.0 0.0 0.0 212.9
South Dakota ………………………………. 0.4 0.0 0.5 0.1 1.0 0.2 0.0 0.0 0.0 0.0 0.2 0.0 0.0 0.0 0.0 0.0 1.2
Wisconsin ……………………………………. 23.9 0.0 20.3 17.0 61.2 0.8 0.0 0.0 0.0 0.0 0.9 0.0 0.0 0.0 0.0 0.1 62.1
South South South South 329.3329.3329.3329.3 67.167.167.167.1 254.1254.1254.1254.1 67.767.767.767.7 762.5762.5762.5762.5 223.8223.8223.8223.8 53.953.953.953.9 89.389.389.389.3 0.00.00.00.0 19.619.619.619.6 386.6386.6386.6386.6 0.00.00.00.0 6.16.16.16.1 5.35.35.35.3 0.00.00.00.0 11.411.411.411.4 1,195.51,195.51,195.51,195.5
South Central ………………………………South Central ………………………………South Central ………………………………South Central ……………………………… 127.0127.0127.0127.0 46.546.546.546.5 133.6133.6133.6133.6 40.840.840.840.8 347.9347.9347.9347.9 18.618.618.618.6 49.149.149.149.1 39.839.839.839.8 0.00.00.00.0 0.00.00.00.0 107.4107.4107.4107.4 0.00.00.00.0 0.00.00.00.0 0.00.00.00.0 0.00.00.00.0 0.00.00.00.0 458.2458.2458.2458.2
Alabama ……………………………………… 4.8 0.0 2.0 3.3 10.1 0.3 7.6 37.7 0.0 0.0 45.7 0.0 0.0 0.0 0.0 0.0 55.7
Arkansas ……………………………………… 20.6 2.2 23.8 2.5 49.2 7.8 0.0 0.0 0.0 0.0 7.8 0.0 0.0 0.0 0.0 0.0 57.4
Kentucky …………………………………………. 14.9 5.0 9.0 7.4 36.4 8.6 3.9 0.0 0.0 0.0 12.5 0.0 0.0 0.0 0.0 0.0 50.8
Mississippi ……………………………………….. 1.6 0.4 1.6 0.0 3.7 0.0 0.0 0.0 0.0 0.0 0.0 0.0 0.0 0.0 0.0 0.0 3.7
Louisiana…………………………. 4.7 0.0 3.9 3.3 11.9 0.0 2.5 2.1 0.0 0.0 4.6 0.0 0.0 0.0 0.0 0.0 16.5
Oklahoma …………………………… 12.7 9.5 11.7 0.3 34.1 0.0 0.0 0.0 0.0 0.0 0.0 0.0 0.0 0.0 0.0 0.0 34.1
Tennessee ……………………………………….. 17.3 0.0 19.5 21.5 58.2 0.0 22.1 0.0 0.0 0.0 22.1 0.0 0.0 0.0 0.0 0.0 80.3
Texas ………………………………………………..50.4 29.4 62.0 2.5 144.4 1.8 13.0 0.0 0.0 0.0 14.7 0.0 0.0 0.0 0.0 0.0 159.7
South Atlantic …………………………………South Atlantic …………………………………South Atlantic …………………………………South Atlantic …………………………………202.3202.3202.3202.3 20.520.520.520.5 120.5120.5120.5120.5 26.826.826.826.8 414.6414.6414.6414.6 205.2205.2205.2205.2 4.94.94.94.9 49.549.549.549.5 0.00.00.00.0 19.619.619.619.6 279.1279.1279.1279.1 0.00.00.00.0 6.16.16.16.1 5.35.35.35.3 0.00.00.00.0 11.411.411.411.4 737.3737.3737.3737.3
Delaware …………………………………… - - - - - - - - - - - - - - - - -
District of Columbia …………………… - - - - - - - - - - - - - - - - -
Florida ………………………………………………114.8 4.0 42.2 18.0 200.0 146.2 0.7 38.5 0.0 19.6 204.9 0.0 6.1 0.0 0.0 6.1 411.0
Georgia ………………………………………………17.6 2.0 9.4 0.8 29.9 2.0 0.3 11.1 0.0 0.0 13.4 0.0 0.0 5.3 0.0 5.3 48.5
Maryland ……………………………………………24.8 9.3 35.7 2.6 94.0 44.0 0.3 0.0 0.0 0.0 44.3 0.0 0.0 0.0 0.0 0.0 138.3
North Carolina ………………………………….32.8 3.3 22.2 3.4 61.7 11.3 2.8 0.0 0.0 0.0 14.1 0.0 0.0 0.0 0.0 0.0 98.3
South Carolina …………………………………..9.9 1.0 7.5 0.5 19.0 1.8 0.4 0.0 0.0 0.0 2.2 0.0 0.0 0.0 0.0 0.0 30.8
Virginia ……………………………………………….0.1 0.0 0.0 0.1 0.2 0.0 0.3 0.0 0.0 0.0 0.3 0.0 0.0 0.0 0.0 0.0 0.6
West Virginia…………………………………….. 2.1 1.0 3.6 1.4 9.9 0.0 0.0 0.0 0.0 0.0 0.0 0.0 0.0 0.0 0.0 0.0 9.9
WestWestWestWest 482.5482.5482.5482.5 176.4176.4176.4176.4 987.2987.2987.2987.2 364.4364.4364.4364.4 2,046.32,046.32,046.32,046.3 118.6118.6118.6118.6 33.033.033.033.0 21.121.121.121.1 0.10.10.10.1 44.644.644.644.6 217.5217.5217.5217.5 0.00.00.00.0 2.42.42.42.4 0.20.20.20.2 4.44.44.44.4 7.07.07.07.0 2,517.42,517.42,517.42,517.4
Pacific Northwest ……………………….Pacific Northwest ……………………….Pacific Northwest ……………………….Pacific Northwest ………………………. 135.6135.6135.6135.6 19.019.019.019.0 248.5248.5248.5248.5 158.1158.1158.1158.1 561.2561.2561.2561.2 24.824.824.824.8 5.05.05.05.0 0.00.00.00.0 0.00.00.00.0 2.22.22.22.2 32.132.132.132.1 0.00.00.00.0 0.00.00.00.0 0.00.00.00.0 0.00.00.00.0 0.00.00.00.0 593.3593.3593.3593.3
Idaho …………………………………………….….. 7.1 3.3 20.0 2.3 32.7 24.1 3.6 0.0 0.0 0.0 27.6 0.0 0.0 0.0 0.0 0.0 60.3
Montana ………………………………………… 4.5 0.7 6.5 2.1 13.8 0.0 0.1 0.0 0.0 0.0 0.1 0.0 0.0 0.0 0.0 0.0 13.8
Oregon …………………………………………… 37.4 0.1 80.6 2.5 120.6 0.8 0.2 0.0 0.0 0.0 1.0 0.0 0.0 0.0 0.0 0.0 121.6
Washington …………………………………… 79.5 9.9 119.7 19.8 228.8 0.0 1.2 0.0 0.0 0.0 1.2 0.0 0.0 0.0 0.0 0.0 230.0
BPA and NEEA*** …………………………………7.2 5.0 21.7 131.4 165.4 0.0 0.0 0.0 0.0 2.2 2.2 0.0 0.0 0.0 0.0 0.0 167.6
Table 4. U.S. Electric Program Budgets by State, 2012 (Millions USD) Table 4. U.S. Electric Program Budgets by State, 2012 (Millions USD) Table 4. U.S. Electric Program Budgets by State, 2012 (Millions USD) Table 4. U.S. Electric Program Budgets by State, 2012 (Millions USD)
ResidentialResidentialResidentialResidential
Low Low Low Low
IncomeIncomeIncomeIncome C&IC&IC&IC&I Other*Other*Other*Other*
Total Total Total Total
EfficiencyEfficiencyEfficiencyEfficiency
Direct Load Direct Load Direct Load Direct Load
ControlControlControlControl
Curtailable Curtailable Curtailable Curtailable
LoadLoadLoadLoad
Interruptible Interruptible Interruptible Interruptible
LoadLoadLoadLoad
Scheduled Scheduled Scheduled Scheduled
LoadLoadLoadLoad
Other Load Other Load Other Load Other Load
ResponseResponseResponseResponse
Total Load Total Load Total Load Total Load
Response **Response **Response **Response **
Time of Use Time of Use Time of Use Time of Use
PricingPricingPricingPricing
Critical Peak Critical Peak Critical Peak Critical Peak
PricingPricingPricingPricing
Real Time Real Time Real Time Real Time
PricingPricingPricingPricing
Other Other Other Other
PricingPricingPricingPricing
Total Price Total Price Total Price Total Price
Response **Response **Response **Response ** Grand TotalGrand TotalGrand TotalGrand Total
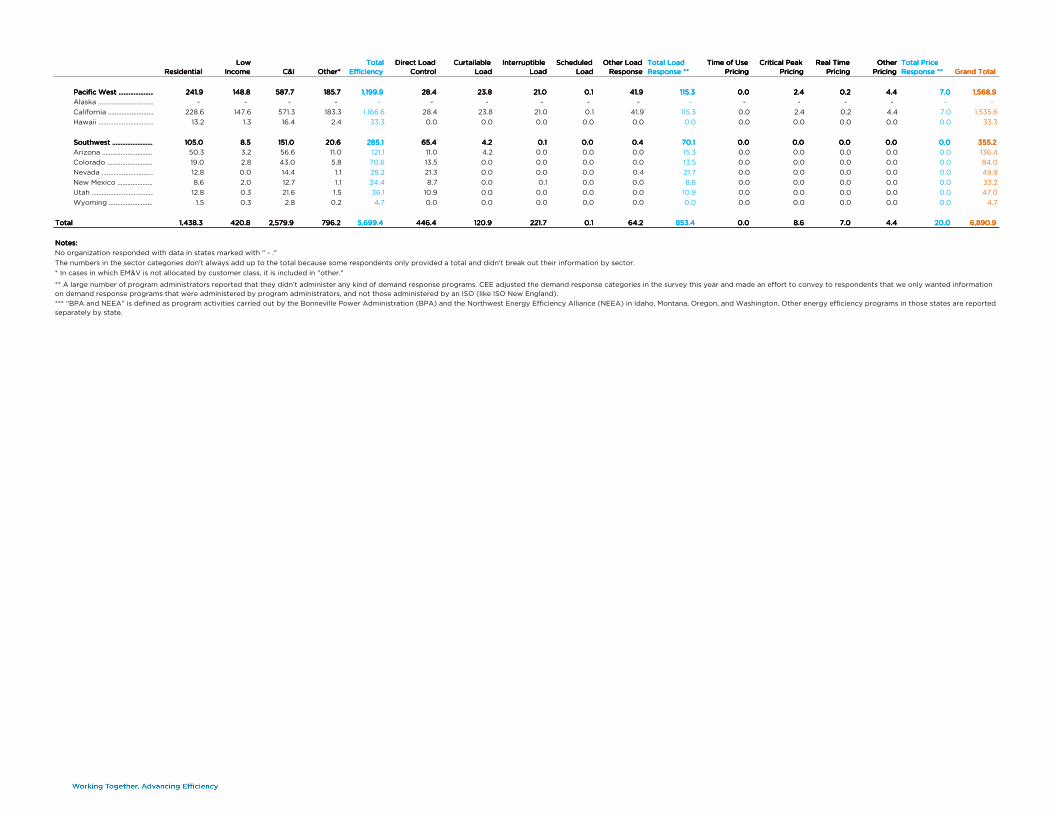
Pacific West ………………………………………..Pacific West ………………………………………..Pacific West ………………………………………..Pacific West ………………………………………..241.9241.9241.9241.9 148.8148.8148.8148.8 587.7587.7587.7587.7 185.7185.7185.7185.7 1,199.91,199.91,199.91,199.9 28.428.428.428.4 23.823.823.823.8 21.021.021.021.0 0.10.10.10.1 41.941.941.941.9 115.3115.3115.3115.3 0.00.00.00.0 2.42.42.42.4 0.20.20.20.2 4.44.44.44.4 7.07.07.07.0 1,568.91,568.91,568.91,568.9
Alaska …………………………………. - - - - - - - - - - - - - - - - -
California ……………………………………………228.6 147.6 571.3 183.3 1,166.6 28.4 23.8 21.0 0.1 41.9 115.3 0.0 2.4 0.2 4.4 7.0 1,535.6
Hawaii ………………………………………………….13.2 1.3 16.4 2.4 33.3 0.0 0.0 0.0 0.0 0.0 0.0 0.0 0.0 0.0 0.0 0.0 33.3
Southwest …………………………………………Southwest …………………………………………Southwest …………………………………………Southwest …………………………………………105.0105.0105.0105.0 8.58.58.58.5 151.0151.0151.0151.0 20.620.620.620.6 285.1285.1285.1285.1 65.465.465.465.4 4.24.24.24.2 0.10.10.10.1 0.00.00.00.0 0.40.40.40.4 70.170.170.170.1 0.00.00.00.0 0.00.00.00.0 0.00.00.00.0 0.00.00.00.0 0.00.00.00.0 355.2355.2355.2355.2
Arizona …………………………………………………50.3 3.2 56.6 11.0 121.1 11.0 4.2 0.0 0.0 0.0 15.3 0.0 0.0 0.0 0.0 0.0 136.4
Colorado …………………………………………….19.0 2.8 43.0 5.8 70.6 13.5 0.0 0.0 0.0 0.0 13.5 0.0 0.0 0.0 0.0 0.0 84.0
Nevada ……………………………………………….12.8 0.0 14.4 1.1 28.2 21.3 0.0 0.0 0.0 0.4 21.7 0.0 0.0 0.0 0.0 0.0 49.9
New Mexico …………………………………………8.6 2.0 12.7 1.1 24.4 8.7 0.0 0.1 0.0 0.0 8.8 0.0 0.0 0.0 0.0 0.0 33.2
Utah ……………………………………………………….12.8 0.3 21.6 1.5 36.1 10.9 0.0 0.0 0.0 0.0 10.9 0.0 0.0 0.0 0.0 0.0 47.0
Wyoming ………………………………………………1.5 0.3 2.8 0.2 4.7 0.0 0.0 0.0 0.0 0.0 0.0 0.0 0.0 0.0 0.0 0.0 4.7
Total Total Total Total 1,438.31,438.31,438.31,438.3 420.8420.8420.8420.8 2,579.92,579.92,579.92,579.9 796.2796.2796.2796.2 5,699.45,699.45,699.45,699.4 446.4446.4446.4446.4 120.9120.9120.9120.9 221.7221.7221.7221.7 0.10.10.10.1 64.264.264.264.2 853.4853.4853.4853.4 0.00.00.00.0 8.68.68.68.6 7.07.07.07.0 4.44.44.44.4 20.020.020.020.0 6,890.96,890.96,890.96,890.9
Notes:Notes:Notes:Notes:
No organization responded with data in states marked with " - ."
The numbers in the sector categories don't always add up to the total because some respondents only provided a total and didn't break out their information by sector.
* In cases in which EM&V is not allocated by customer class, it is included in "other."
** A large number of program administrators reported that they didn’t administer any kind of demand response programs. CEE adjusted the demand response categories in the survey this year and made an effort to convey to respondents that we only wanted information
on demand response programs that were administered by program administrators, and not those administered by an ISO (like ISO New England).
*** “BPA and NEEA” is defined as program activities carried out by the Bonneville Power Administration (BPA) and the Northwest Energy Efficiency Alliance (NEEA) in Idaho, Montana, Oregon, and Washington. Other energy efficiency programs in those states are reported
separately by state.

ResidentialResidentialResidentialResidential
Low Low Low Low
IncomeIncomeIncomeIncome C&IC&IC&IC&I Other*Other*Other*Other*
Total Total Total Total
EfficiencyEfficiencyEfficiencyEfficiency
Direct Load Direct Load Direct Load Direct Load
ControlControlControlControl
Curtailable Curtailable Curtailable Curtailable
LoadLoadLoadLoad
Interruptible Interruptible Interruptible Interruptible
LoadLoadLoadLoad
Scheduled Scheduled Scheduled Scheduled
LoadLoadLoadLoad
Other Load Other Load Other Load Other Load
ResponseResponseResponseResponse
Total Load Total Load Total Load Total Load
Response **Response **Response **Response **
Time of Use Time of Use Time of Use Time of Use
PricingPricingPricingPricing
Critical Peak Critical Peak Critical Peak Critical Peak
PricingPricingPricingPricing
Real Time Real Time Real Time Real Time
PricingPricingPricingPricing Other PricingOther PricingOther PricingOther Pricing
Total Price Total Price Total Price Total Price
Response **Response **Response **Response ** Grand TotalGrand TotalGrand TotalGrand Total
Northeast Northeast Northeast Northeast 297.8297.8297.8297.8 108.5108.5108.5108.5 830.1830.1830.1830.1 163.3163.3163.3163.3 1,534.41,534.41,534.41,534.4 49.049.049.049.0 7.27.27.27.2 5.35.35.35.3 0.00.00.00.0 0.00.00.00.0 61.561.561.561.5 0.00.00.00.0 0.00.00.00.0 0.00.00.00.0 0.00.00.00.0 0.00.00.00.0 1,618.71,618.71,618.71,618.7
New England ………………………………New England ………………………………New England ………………………………New England ……………………………… 169.2169.2169.2169.2 45.145.145.145.1 376.2376.2376.2376.2 26.026.026.026.0 617.7617.7617.7617.7 0.00.00.00.0 0.00.00.00.0 0.00.00.00.0 0.00.00.00.0 0.00.00.00.0 0.00.00.00.0 0.0 0.0 0.0 0.0 0.00.00.00.0 617.7617.7617.7617.7
Connecticut ………………………………. 30.6 12.2 55.9 10.1 108.7 0.0 0.0 0.0 0.0 0.0 0.0 0.0 0.0 0.0 0.0 0.0 108.7
Maine …………………………………………….… 3.8 0.2 9.8 1.1 14.9 0.0 0.0 0.0 0.0 0.0 0.0 0.0 0.0 0.0 0.0 0.0 14.9
Massachusetts ………………………………..102.5 27.5 251.9 11.6 393.5 0.0 0.0 0.0 0.0 0.0 0.0 0.0 0.0 0.0 0.0 0.0 393.5
New Hampshire ……………………………. 5.8 2.3 9.1 0.2 18.6 0.0 0.0 0.0 0.0 0.0 0.0 0.0 0.0 0.0 0.0 0.0 18.6
Rhode Island ……………………………….. 15.0 2.9 26.9 0.5 45.2 0.0 0.0 0.0 0.0 0.0 0.0 0.0 0.0 0.0 0.0 0.0 45.2
Vermont ……………………………………….. 11.6 0.1 22.6 2.6 36.9 0.0 0.0 0.0 0.0 0.0 0.0 0.0 0.0 0.0 0.0 0.0 36.9
Mid-Atlantic …………………………………Mid-Atlantic …………………………………Mid-Atlantic …………………………………Mid-Atlantic ………………………………… 128.6128.6128.6128.6 63.463.463.463.4 453.9453.9453.9453.9 137.4137.4137.4137.4 916.7916.7916.7916.7 49.049.049.049.0 7.27.27.27.2 5.35.35.35.3 0.00.00.00.0 0.00.00.00.0 61.561.561.561.5 0.00.00.00.0 0.00.00.00.0 0.00.00.00.0 0.00.00.00.0 0.00.00.00.0 1,001.01,001.01,001.01,001.0
New Jersey …………………………………… 44.2 11.7 78.9 2.6 141.0 17.2 0.0 0.0 0.0 0.0 17.2 0.0 0.0 0.0 0.0 0.0 161.6
New York …………………………………….. 41.9 34.8 300.2 120.9 545.5 3.5 3.2 0.0 0.0 0.0 6.6 0.0 0.0 0.0 0.0 0.0 554.2
Pennsylvania ………………………………. 42.5 16.9 74.8 13.8 230.2 28.4 4.0 5.3 0.0 0.0 37.7 0.0 0.0 0.0 0.0 0.0 285.2
MidwestMidwestMidwestMidwest 239.5239.5239.5239.5 41.541.541.541.5 267.3267.3267.3267.3 134.9134.9134.9134.9 752.7752.7752.7752.7 39.739.739.739.7 19.519.519.519.5 42.842.842.842.8 0.00.00.00.0 0.00.00.00.0 102.0102.0102.0102.0 0.00.00.00.0 0.10.10.10.1 1.11.11.11.1 0.00.00.00.0 1.21.21.21.2 866.0866.0866.0866.0
Illinois ……………………………………….. 46.6 12.6 19.3 74.9 153.5 4.3 0.7 0.0 0.0 0.0 4.9 0.0 0.0 1.1 0.0 1.1 160.4
Indiana ………………………………………. 13.5 1.3 7.5 0.1 22.4 5.8 0.2 4.5 0.0 0.0 10.5 0.0 0.0 0.0 0.0 0.0 33.0
Iowa ……………………………………………….. 27.4 1.5 48.6 4.2 81.7 6.6 10.3 24.4 0.0 0.0 41.2 0.0 0.0 0.0 0.0 0.0 123.0
Kansas ……………………………………………. 0.0 0.0 0.1 0.3 0.4 5.0 0.0 6.4 0.0 0.0 11.5 0.0 0.0 0.0 0.0 0.0 11.8
Michigan ………………………………………….36.4 7.2 46.1 17.9 113.6 0.0 0.0 0.0 0.0 0.0 0.0 0.0 0.0 0.0 0.0 0.0 113.6
Minnesota …………………………………….. 41.4 4.0 51.0 4.7 101.1 11.4 0.1 7.4 0.0 0.0 18.9 0.0 0.0 0.0 0.0 0.0 120.1
Missouri ………………………………………… 20.6 0.5 32.3 2.4 55.7 2.3 6.8 0.0 0.0 0.0 9.2 0.0 0.0 0.0 0.0 0.0 64.9
Nebraska ………………………………………… 2.1 0.0 3.3 1.7 7.1 2.7 1.4 0.0 0.0 0.0 4.0 0.0 0.0 0.0 0.0 0.0 11.2
North Dakota 0.0 0.0 0.0 0.0 0.0 0.6 0.0 0.0 0.0 0.0 0.6 0.0 0.0 0.0 0.0 0.0 0.6
Ohio ………………………………………………. 33.1 14.5 41.4 15.2 167.4 0.0 0.0 0.0 0.0 0.0 0.0 0.0 0.0 0.0 0.0 0.0 176.7
South Dakota ………………………………. 0.1 0.0 0.2 0.0 0.4 0.2 0.0 0.0 0.0 0.0 0.2 0.0 0.0 0.0 0.0 0.0 0.5
Wisconsin ……………………………………. 18.3 0.0 17.5 13.5 49.3 0.9 0.1 0.0 0.0 0.0 1.0 0.0 0.1 0.0 0.0 0.1 50.4
South South South South 316.3316.3316.3316.3 56.456.456.456.4 183.8183.8183.8183.8 53.053.053.053.0 632.7632.7632.7632.7 212.5212.5212.5212.5 34.234.234.234.2 74.174.174.174.1 0.00.00.00.0 17.917.917.917.9 338.6338.6338.6338.6 0.10.10.10.1 7.07.07.07.0 5.25.25.25.2 0.00.00.00.0 12.312.312.312.3 1,012.51,012.51,012.51,012.5
South Central ………………………………South Central ………………………………South Central ………………………………South Central ……………………………… 99.699.699.699.6 44.444.444.444.4 99.199.199.199.1 27.927.927.927.9 271.0271.0271.0271.0 13.713.713.713.7 31.331.331.331.3 28.328.328.328.3 0.00.00.00.0 0.00.00.00.0 73.373.373.373.3 0.00.00.00.0 0.00.00.00.0 0.00.00.00.0 0.00.00.00.0 0.00.00.00.0 349.3349.3349.3349.3
Alabama ……………………………………… 4.4 0.0 1.5 2.3 8.2 0.1 5.2 26.3 0.0 0.0 31.6 0.0 0.0 0.0 0.0 0.0 39.7
Arkansas ……………………………………… 6.7 1.8 9.9 0.3 18.6 4.7 0.0 0.0 0.0 0.0 4.7 0.0 0.0 0.0 0.0 0.0 23.6
Kentucky …………………………………………. 9.0 2.5 6.0 5.5 23.1 7.1 2.9 0.0 0.0 0.0 10.0 0.0 0.0 0.0 0.0 0.0 33.6
Louisiana………………………………………….. 1.4 0.3 1.7 0.5 3.8 0.0 0.0 0.0 0.0 0.0 0.0 0.0 0.0 0.0 0.0 0.0 3.8
Mississippi ……………………………………….. 5.3 0.0 2.9 2.3 10.5 0.0 2.4 2.1 0.0 0.0 4.4 0.0 0.0 0.0 0.0 0.0 15.0
Oklahoma …………………………………………15.9 8.9 6.9 0.4 32.1 0.0 0.0 0.0 0.0 0.0 0.0 0.0 0.0 0.0 0.0 0.0 35.6
Tennessee ……………………………………….. 14.5 0.0 14.9 14.7 44.1 0.0 15.1 0.0 0.0 0.0 15.1 0.0 0.0 0.0 0.0 0.0 59.2
Texas ………………………………………………..42.4 30.9 55.2 2.0 130.6 1.8 5.8 0.0 0.0 0.0 7.5 0.0 0.0 0.0 0.0 0.0 138.7
South Atlantic …………………………………South Atlantic …………………………………South Atlantic …………………………………South Atlantic …………………………………216.6216.6216.6216.6 12.012.012.012.0 84.784.784.784.7 25.125.125.125.1 361.8361.8361.8361.8 198.8198.8198.8198.8 2.92.92.92.9 45.745.745.745.7 0.00.00.00.0 17.917.917.917.9 265.3265.3265.3265.3 0.10.10.10.1 7.07.07.07.0 5.25.25.25.2 0.00.00.00.0 12.312.312.312.3 663.3663.3663.3663.3
Delaware …………………………………… - - - - - - - - - - - - - - - - - - - -
District of Columbia …………………… - - - - - - - - - - - - - - - - - - - -
Florida ………………………………………………129.6 2.1 28.9 14.2 186.6 134.8 0.7 35.2 0.0 17.9 188.5 0.1 7.0 0.0 0.0 7.1 382.9
Georgia ………………………………………………14.4 2.0 6.9 0.8 24.1 1.2 0.2 10.6 0.0 0.0 12.0 0.0 0.0 5.2 0.0 5.2 41.2
Maryland ……………………………………………27.1 5.7 31.8 3.2 79.2 51.0 0.2 0.0 0.0 0.0 51.2 0.0 0.0 0.0 0.0 0.0 130.4
North Carolina ………………………………….34.0 1.9 12.9 5.2 54.0 10.2 1.4 0.0 0.0 0.0 11.6 0.0 0.0 0.0 0.0 0.0 84.3
South Carolina …………………………………..9.9 0.4 3.3 1.4 14.9 1.6 0.2 0.0 0.0 0.0 1.8 0.0 0.0 0.0 0.0 0.0 21.3
Virginia ………………………………………………. 0.1 0.0 0.0 0.1 0.2 0.0 0.2 0.0 0.0 0.0 0.2 0.0 0.0 0.0 0.0 0.0 0.4
West Virginia……………………………………. 1.6 0.1 0.8 0.3 2.8 0.0 0.0 0.0 0.0 0.0 0.0 0.0 0.0 0.0 0.0 0.0 2.8
WestWestWestWest 406.5406.5406.5406.5 189.0189.0189.0189.0 846.1846.1846.1846.1 351.4351.4351.4351.4 1,824.51,824.51,824.51,824.5 93.993.993.993.9 29.829.829.829.8 20.720.720.720.7 0.00.00.00.0 26.026.026.026.0 170.4170.4170.4170.4 0.00.00.00.0 17.917.917.917.9 0.10.10.10.1 9.29.29.29.2 27.327.327.327.3 2,214.12,214.12,214.12,214.1
Pacific Northwest ……………………….Pacific Northwest ……………………….Pacific Northwest ……………………….Pacific Northwest ………………………. 123.9123.9123.9123.9 16.916.916.916.9 208.0208.0208.0208.0 211.5211.5211.5211.5 560.3560.3560.3560.3 18.218.218.218.2 2.32.32.32.3 0.00.00.00.0 0.00.00.00.0 2.62.62.62.6 23.123.123.123.1 0.0 0.0 0.0 0.0 0.00.00.00.0 583.4583.4583.4583.4
Idaho …………………………………………….….. 8.7 2.9 18.7 3.1 33.4 17.9 2.0 0.0 0.0 0.0 19.8 0.0 0.0 0.0 0.0 0.0 53.3
Montana ………………………………………… 4.1 1.0 5.4 0.6 11.0 0.0 0.0 0.0 0.0 0.0 0.0 0.0 0.0 0.0 0.0 0.0 11.0
Oregon …………………………………………… 37.0 0.0 61.0 2.1 100.0 0.4 0.1 0.0 0.0 0.0 0.5 0.0 0.0 0.0 0.0 0.0 100.5
Washington …………………………………… 65.3 10.0 88.8 4.7 168.8 0.0 0.3 0.0 0.0 0.0 0.3 0.0 0.0 0.0 0.0 0.0 169.0
BPA and NEEA*** …………………………………8.9 3.0 34.1 201.0 247.1 0.0 0.0 0.0 0.0 2.6 2.6 0.0 0.0 0.0 0.0 0.0 249.6
Table 5. U.S. Electric Program Expenditures by State, 2011 (Millions USD)Table 5. U.S. Electric Program Expenditures by State, 2011 (Millions USD)Table 5. U.S. Electric Program Expenditures by State, 2011 (Millions USD)Table 5. U.S. Electric Program Expenditures by State, 2011 (Millions USD)

ResidentialResidentialResidentialResidential
Low Low Low Low
IncomeIncomeIncomeIncome C&IC&IC&IC&I Other*Other*Other*Other*
Total Total Total Total
EfficiencyEfficiencyEfficiencyEfficiency
Direct Load Direct Load Direct Load Direct Load
ControlControlControlControl
Curtailable Curtailable Curtailable Curtailable
LoadLoadLoadLoad
Interruptible Interruptible Interruptible Interruptible
LoadLoadLoadLoad
Scheduled Scheduled Scheduled Scheduled
LoadLoadLoadLoad
Other Load Other Load Other Load Other Load
ResponseResponseResponseResponse
Total Load Total Load Total Load Total Load
Response **Response **Response **Response **
Time of Use Time of Use Time of Use Time of Use
PricingPricingPricingPricing
Critical Peak Critical Peak Critical Peak Critical Peak
PricingPricingPricingPricing
Real Time Real Time Real Time Real Time
PricingPricingPricingPricing Other PricingOther PricingOther PricingOther Pricing
Total Price Total Price Total Price Total Price
Response **Response **Response **Response ** Grand TotalGrand TotalGrand TotalGrand Total
Pacific West ………………………………………..Pacific West ………………………………………..Pacific West ………………………………………..Pacific West ………………………………………..179.0179.0179.0179.0 163.1163.1163.1163.1 512.1512.1512.1512.1 119.0119.0119.0119.0 1,004.71,004.71,004.71,004.7 26.526.526.526.5 24.724.724.724.7 20.720.720.720.7 0.00.00.00.0 23.423.423.423.4 95.295.295.295.2 0.00.00.00.0 17.917.917.917.9 0.10.10.10.1 9.29.29.29.2 27.327.327.327.3 1,319.11,319.11,319.11,319.1
Alaska …………………………………. - - - - - - - - - - - - - - - - -
California ……………………………………………168.8 162.3 499.9 117.2 979.6 26.5 24.7 20.7 0.0 23.4 95.2 0.0 17.9 0.1 9.2 27.3 1,294.0
Hawaii ………………………………………………….10.2 0.8 12.2 1.8 25.1 0.0 0.0 0.0 0.0 0.0 0.0 0.0 0.0 0.0 0.0 0.0 25.1
Southwest …………………………………………Southwest …………………………………………Southwest …………………………………………Southwest …………………………………………103.5103.5103.5103.5 9.09.09.09.0 126.0126.0126.0126.0 20.920.920.920.9 259.4259.4259.4259.4 49.249.249.249.2 2.82.82.82.8 0.00.00.00.0 0.00.00.00.0 0.10.10.10.1 52.152.152.152.1 0.00.00.00.0 0.00.00.00.0 0.00.00.00.0 0.00.00.00.0 0.00.00.00.0 311.5311.5311.5311.5
Arizona …………………………………………………48.2 3.0 47.8 12.5 111.5 7.1 2.8 0.0 0.0 0.0 9.9 0.0 0.0 0.0 0.0 0.0 121.4
Colorado …………………………………………….14.5 2.3 36.6 4.9 58.3 12.2 0.0 0.0 0.0 0.0 12.2 0.0 0.0 0.0 0.0 0.0 70.5
Nevada ……………………………………………….14.5 1.8 14.9 0.6 31.7 12.8 0.0 0.0 0.0 0.1 12.8 0.0 0.0 0.0 0.0 0.0 44.6
New Mexico …………………………………………7.4 1.6 9.2 0.9 19.1 8.7 0.0 0.0 0.0 0.0 8.7 0.0 0.0 0.0 0.0 0.0 27.8
Utah ……………………………………………………….17.4 0.2 15.1 1.5 34.3 8.4 0.0 0.0 0.0 0.0 8.4 0.0 0.0 0.0 0.0 0.0 42.7
Wyoming ………………………………………………1.5 0.0 2.5 0.5 4.5 0.0 0.0 0.0 0.0 0.0 0.0 0.0 0.0 0.0 0.0 0.0 4.5
Total Total Total Total 1,260.11,260.11,260.11,260.1 395.4395.4395.4395.4 2,127.22,127.22,127.22,127.2 702.7702.7702.7702.7 4,744.34,744.34,744.34,744.3 395.1395.1395.1395.1 90.690.690.690.6 142.9142.9142.9142.9 0.00.00.00.0 43.943.943.943.9 672.5672.5672.5672.5 0.10.10.10.1 25.025.025.025.0 6.46.46.46.4 9.29.29.29.2 40.740.740.740.7 5,711.35,711.35,711.35,711.3
Notes:Notes:Notes:Notes:
No organization responded with data in states marked with " - ."
The numbers in the sector categories don't always add up to the total because some respondents only provided a total and didn't break out their information by sector.
* In cases in which EM&V is not allocated by customer class, it is included in "other."
** A large number of program administrators reported that they didn’t administer any kind of demand response programs. CEE adjusted the demand response categories in the survey this year and made an effort to convey to respondents that we only wanted information on demand response
programs that were administered by program administrators, and not those administered by an ISO (like ISO New England).
*** “BPA and NEEA” is defined as program activities carried out by the Bonneville Power Administration (BPA) and the Northwest Energy Efficiency Alliance (NEEA) in Idaho, Montana, Oregon, and Washington. Other energy efficiency programs in those states are reported separately by state.
ResidentialResidentialResidentialResidential Low IncomeLow IncomeLow IncomeLow Income
Commercial Commercial Commercial Commercial
& Industrial& Industrial& Industrial& Industrial Other*Other*Other*Other*
Total Total Total Total
EfficiencyEfficiencyEfficiencyEfficiency
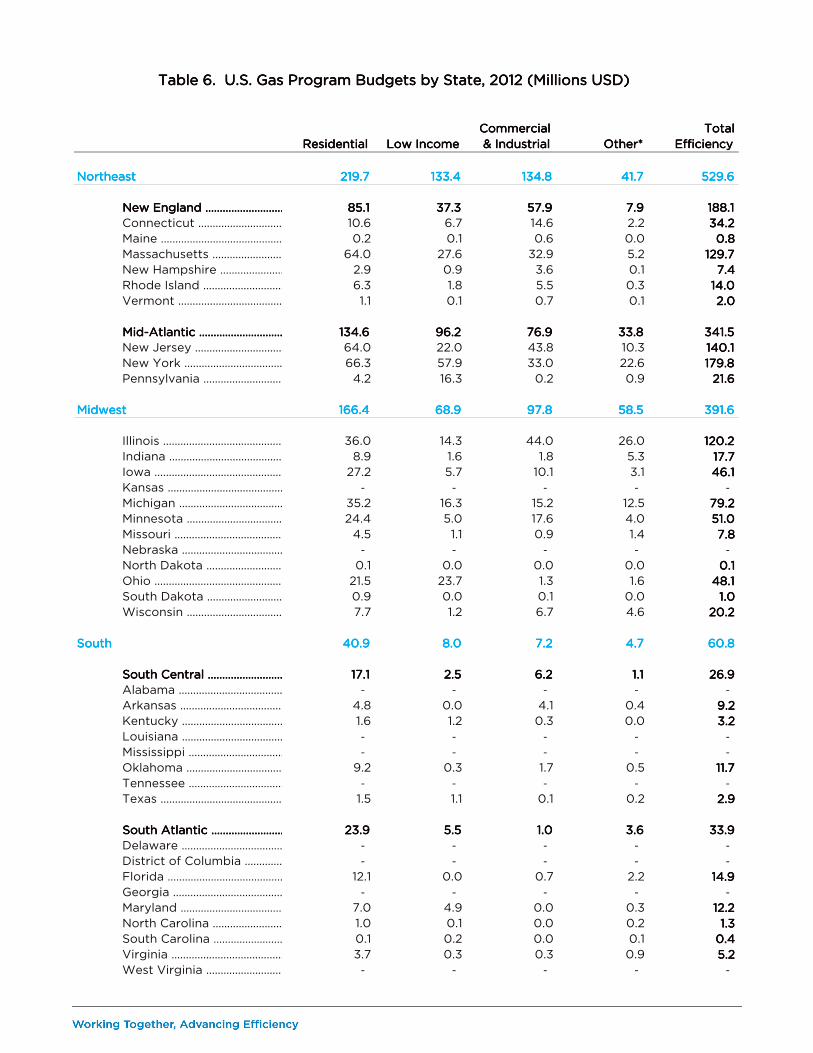
Northeast Northeast Northeast Northeast 219.7219.7219.7219.7 133.4133.4133.4133.4 134.8134.8134.8134.8 41.741.741.741.7 529.6529.6529.6529.6
New England ………………………………New England ………………………………New England ………………………………New England ……………………………… 85.185.185.185.1 37.337.337.337.3 57.957.957.957.9 7.97.97.97.9 188.1188.1188.1188.1
Connecticut ………………………………. 10.6 6.7 14.6 2.2 34.234.234.234.2
Maine …………………………………………….… 0.2 0.1 0.6 0.0 0.80.80.80.8
Massachusetts ……………………………….. 64.0 27.6 32.9 5.2 129.7129.7129.7129.7
New Hampshire ……………………………. 2.9 0.9 3.6 0.1 7.47.47.47.4
Rhode Island ……………………………….. 6.3 1.8 5.5 0.3 14.014.014.014.0
Vermont ……………………………………….. 1.1 0.1 0.7 0.1 2.02.02.02.0
Mid-Atlantic …………………………………Mid-Atlantic …………………………………Mid-Atlantic …………………………………Mid-Atlantic ………………………………… 134.6134.6134.6134.6 96.296.296.296.2 76.976.976.976.9 33.833.833.833.8 341.5341.5341.5341.5
New Jersey …………………………………… 64.0 22.0 43.8 10.3 140.1140.1140.1140.1
New York …………………………………….. 66.3 57.9 33.0 22.6 179.8179.8179.8179.8
Pennsylvania ………………………………. 4.2 16.3 0.2 0.9 21.621.621.621.6
Midwest Midwest Midwest Midwest 166.4166.4166.4166.4 68.968.968.968.9 97.897.897.897.8 58.558.558.558.5 391.6391.6391.6391.6
Illinois ……………………………………………...….. 36.0 14.3 44.0 26.0 120.2120.2120.2120.2
Indiana ………………………………………. 8.9 1.6 1.8 5.3 17.717.717.717.7
Iowa ……………………………………………….. 27.2 5.7 10.1 3.1 46.146.146.146.1
Kansas ……………………………………………. - - - - -
Michigan …………………………………………. 35.2 16.3 15.2 12.5 79.279.279.279.2
Minnesota …………………………………….. 24.4 5.0 17.6 4.0 51.051.051.051.0
Missouri ………………………………………… 4.5 1.1 0.9 1.4 7.87.87.87.8
Nebraska ………………………………………… - - - - -
North Dakota …………………………………. 0.1 0.0 0.0 0.0 0.10.10.10.1
Ohio ………………………………………………. 21.5 23.7 1.3 1.6 48.148.148.148.1
South Dakota ………………………………. 0.9 0.0 0.1 0.0 1.01.01.01.0
Wisconsin ……………………………………. 7.7 1.2 6.7 4.6 20.220.220.220.2
South South South South 40.940.940.940.9 8.08.08.08.0 7.27.27.27.2 4.74.74.74.7 60.860.860.860.8
South Central ………………………………South Central ………………………………South Central ………………………………South Central ……………………………… 17.117.117.117.1 2.52.52.52.5 6.26.26.26.2 1.11.11.11.1 26.926.926.926.9
Alabama ……………………………………… - - - - -
Arkansas ……………………………………… 4.8 0.0 4.1 0.4 9.29.29.29.2
Kentucky …………………………………………. 1.6 1.2 0.3 0.0 3.23.23.23.2
Louisiana ……………………………………….. - - - - -
Mississippi ……………………………………….. - - - - -
Oklahoma ………………………………………… 9.2 0.3 1.7 0.5 11.711.711.711.7
Tennessee ……………………………………….. - - - - -
Texas ……………………………………………….. 1.5 1.1 0.1 0.2 2.92.92.92.9
South Atlantic …………………………………South Atlantic …………………………………South Atlantic …………………………………South Atlantic ………………………………… 23.923.923.923.9 5.55.55.55.5 1.01.01.01.0 3.63.63.63.6 33.933.933.933.9
Delaware ………………………………………….. - - - - -
District of Columbia …………………….. - - - - -
Florida ……………………………………………… 12.1 0.0 0.7 2.2 14.914.914.914.9
Georgia ……………………………………………… - - - - -
Maryland …………………………………………… 7.0 4.9 0.0 0.3 12.212.212.212.2
North Carolina …………………………………. 1.0 0.1 0.0 0.2 1.31.31.31.3
South Carolina ………………………………….. 0.1 0.2 0.0 0.1 0.40.40.40.4
Virginia ………………………………………………. 3.7 0.3 0.3 0.9 5.25.25.25.2
West Virginia ………………………………….. - - - - -
Table 6. U.S. Gas Program Budgets by State, 2012 (Millions USD)Table 6. U.S. Gas Program Budgets by State, 2012 (Millions USD)Table 6. U.S. Gas Program Budgets by State, 2012 (Millions USD)Table 6. U.S. Gas Program Budgets by State, 2012 (Millions USD)

ResidentialResidentialResidentialResidential Low IncomeLow IncomeLow IncomeLow Income
Commercial Commercial Commercial Commercial
& Industrial& Industrial& Industrial& Industrial Other*Other*Other*Other*
Total Total Total Total
EfficiencyEfficiencyEfficiencyEfficiency
West West West West 119.2119.2119.2119.2 75.175.175.175.1 123.0123.0123.0123.0 67.367.367.367.3 384.6384.6384.6384.6
Pacific Northwest ……………………….Pacific Northwest ……………………….Pacific Northwest ……………………….Pacific Northwest ………………………. 25.925.925.925.9 6.06.06.06.0 20.620.620.620.6 6.46.46.46.4 58.958.958.958.9
Idaho …………………………………………….….. 0.7 0.2 0.6 0.2 1.91.91.91.9
Montana ………………………………………… 0.2 2.1 0.4 0.0 2.72.72.72.7
Oregon …………………………………………… 16.4 2.2 12.3 0.5 31.431.431.431.4
Washington …………………………………… 8.6 1.4 7.3 5.6 23.023.023.023.0
Pacific West ………………………………………..Pacific West ………………………………………..Pacific West ………………………………………..Pacific West ……………………………………….. 56.656.656.656.6 61.261.261.261.2 91.791.791.791.7 54.254.254.254.2 263.7263.7263.7263.7
Alaska ………………………………………………… - - - - -
California …………………………………………… 56.6 61.2 91.7 54.2 263.7263.7263.7263.7
Hawaii …………………………………………………. - - - - -
Southwest …………………………………………Southwest …………………………………………Southwest …………………………………………Southwest ………………………………………… 36.736.736.736.7 7.97.97.97.9 10.610.610.610.6 6.76.76.76.7 62.062.062.062.0
Arizona ………………………………………………… 3.2 0.9 2.7 0.0 6.86.86.86.8
Colorado ……………………………………………. 7.4 4.2 2.2 2.3 16.116.116.116.1
Nevada ………………………………………………. 2.9 0.3 1.2 2.1 6.56.56.56.5
New Mexico ………………………………………… 0.9 1.4 1.0 0.1 3.43.43.43.4
Utah ………………………………………………………. 21.8 1.2 3.2 2.1 28.328.328.328.3
Wyoming ……………………………………………… 0.5 0.0 0.4 0.1 0.90.90.90.9
Total Total Total Total 546.2546.2546.2546.2 285.4285.4285.4285.4 362.8362.8362.8362.8 172.2172.2172.2172.2 1,366.61,366.61,366.61,366.6
Notes:Notes:Notes:Notes:
No organizations responded with data in states marked with " - ."
* In cases in which EM&V is not allocated by customer class, it is included in "other."

ResidentialResidentialResidentialResidential Low IncomeLow IncomeLow IncomeLow Income
Commercial Commercial Commercial Commercial
& Industrial& Industrial& Industrial& Industrial Other*Other*Other*Other*
Total Total Total Total
EfficiencyEfficiencyEfficiencyEfficiency
Northeast Northeast Northeast Northeast 152.9152.9152.9152.9 67.967.967.967.9 65.665.665.665.6 16.216.216.216.2 302.6302.6302.6302.6
New England ………………………………New England ………………………………New England ………………………………New England ……………………………… 62.362.362.362.3 24.624.624.624.6 33.933.933.933.9 3.83.83.83.8 124.6124.6124.6124.6
Connecticut ………………………………. 6.3 5.1 7.4 0.6 19.419.419.419.4
Maine …………………………………………….… 0.4 0.1 0.3 0.0 0.80.80.80.8
Massachusetts ……………………………….. 51.8 18.6 22.5 3.0 95.895.895.895.8
New Hampshire ……………………………. 0.6 0.3 1.3 0.1 2.22.22.22.2
Rhode Island ……………………………….. 2.1 0.5 1.8 0.1 4.54.54.54.5
Vermont ……………………………………….. 1.2 0.0 0.6 0.0 1.91.91.91.9
Mid-Atlantic …………………………………Mid-Atlantic …………………………………Mid-Atlantic …………………………………Mid-Atlantic ………………………………… 90.690.690.690.6 43.343.343.343.3 31.731.731.731.7 12.412.412.412.4 178.0178.0178.0178.0
New Jersey …………………………………… 61.2 17.0 14.2 1.3 93.893.893.893.8
New York …………………………………….. 26.4 14.7 17.5 10.4 69.069.069.069.0
Pennsylvania ………………………………. 3.0 11.5 0.0 0.6 15.215.215.215.2
Midwest Midwest Midwest Midwest 142.9142.9142.9142.9 54.854.854.854.8 50.250.250.250.2 34.934.934.934.9 282.8282.8282.8282.8
Illinois ……………………………………………...….. 20.3 3.4 9.5 12.8 46.146.146.146.1
Indiana ………………………………………. 7.6 1.1 1.6 2.5 12.812.812.812.8
Iowa ……………………………………………….. 24.2 7.9 9.1 2.1 43.343.343.343.3
Kansas ……………………………………………. - - - - -
Michigan …………………………………………. 38.6 14.9 11.5 8.5 73.473.473.473.4
Minnesota …………………………………….. 21.1 4.1 11.4 3.6 40.340.340.340.3
Missouri ………………………………………… 3.7 1.1 0.6 0.4 5.65.65.65.6
Nebraska ………………………………………… - - - - -
North Dakota …………………………………. 0.2 0.0 0.0 0.0 0.20.20.20.2
Ohio ………………………………………………. 19.7 21.3 0.9 1.3 43.243.243.243.2
South Dakota ………………………………. 1.0 0.0 0.1 0.0 1.21.21.21.2
Wisconsin ……………………………………. 6.6 1.0 5.5 3.8 16.916.916.916.9
South South South South 31.631.631.631.6 6.66.66.66.6 3.13.13.13.1 3.73.73.73.7 44.944.944.944.9
South Central ………………………………South Central ………………………………South Central ………………………………South Central ……………………………… 9.49.49.49.4 2.42.42.42.4 2.62.62.62.6 0.60.60.60.6 14.914.914.914.9
Alabama ……………………………………… - - - - -
Arkansas ……………………………………… 2.2 0.0 2.1 0.2 4.54.54.54.5
Kentucky …………………………………………. 1.3 0.5 0.0 0.0 1.81.81.81.8
Louisiana ……………………………………….. - - - - -
Mississippi ……………………………………….. - - - - -
Oklahoma ………………………………………… 4.5 0.0 0.4 0.1 5.05.05.05.0
Tennessee ……………………………………….. - - - - -
Texas ……………………………………………….. 1.4 1.9 0.1 0.3 3.73.73.73.7
South Atlantic …………………………………South Atlantic …………………………………South Atlantic …………………………………South Atlantic ………………………………… 22.222.222.222.2 4.24.24.24.2 0.50.50.50.5 3.03.03.03.0 29.929.929.929.9
Delaware ………………………………………….. - - - - -
District of Columbia …………………….. - - - - -
Florida ……………………………………………… 12.2 0.0 0.4 1.6 14.314.314.314.3
Georgia ……………………………………………… - - - - -
Maryland …………………………………………… 6.4 3.6 0.0 0.0 10.010.010.010.0
North Carolina …………………………………. 1.1 0.0 0.0 0.1 1.31.31.31.3
South Carolina ………………………………….. 0.2 0.1 0.0 0.0 0.30.30.30.3
Virginia ………………………………………………. 2.2 0.4 0.1 1.2 4.04.04.04.0
West Virginia ………………………………….. - - - - -
Table 7. U.S. Gas Program Expenditures by State, 2011 (Millions USD)Table 7. U.S. Gas Program Expenditures by State, 2011 (Millions USD)Table 7. U.S. Gas Program Expenditures by State, 2011 (Millions USD)Table 7. U.S. Gas Program Expenditures by State, 2011 (Millions USD)

ResidentialResidentialResidentialResidential Low IncomeLow IncomeLow IncomeLow Income
Commercial Commercial Commercial Commercial
& Industrial& Industrial& Industrial& Industrial Other*Other*Other*Other*
Total Total Total Total
EfficiencyEfficiencyEfficiencyEfficiency
West West West West 106.2106.2106.2106.2 79.379.379.379.3 106.1106.1106.1106.1 35.735.735.735.7 327.3327.3327.3327.3
Pacific Northwest ……………………….Pacific Northwest ……………………….Pacific Northwest ……………………….Pacific Northwest ………………………. 26.426.426.426.4 3.93.93.93.9 21.921.921.921.9 3.03.03.03.0 55.255.255.255.2
Idaho …………………………………………….….. 0.9 0.2 0.4 0.5 2.02.02.02.0
Montana ………………………………………… 2.9 0.0 0.0 0.0 2.92.92.92.9
Oregon …………………………………………… 12.7 1.8 9.6 0.4 24.524.524.524.5
Washington …………………………………… 10.0 1.9 11.9 2.1 25.825.825.825.8
Pacific West ………………………………………..Pacific West ………………………………………..Pacific West ………………………………………..Pacific West ……………………………………….. 44.544.544.544.5 68.368.368.368.3 78.478.478.478.4 28.228.228.228.2 219.3219.3219.3219.3
Alaska ………………………………………………… - - - - -
California …………………………………………… 44.5 68.3 78.4 28.2 219.3219.3219.3219.3
Hawaii …………………………………………………. - - - - -
Southwest …………………………………………Southwest …………………………………………Southwest …………………………………………Southwest ………………………………………… 35.335.335.335.3 7.27.27.27.2 5.75.75.75.7 4.54.54.54.5 52.852.852.852.8
Arizona ………………………………………………… 2.3 0.4 0.5 0.2 3.33.33.33.3
Colorado ……………………………………………. 10.5 4.6 2.5 2.5 20.120.120.120.1
Nevada ………………………………………………. 2.8 0.2 0.4 0.3 3.63.63.63.6
New Mexico ………………………………………… 1.0 1.4 0.6 0.1 3.13.13.13.1
Utah ………………………………………………………. 18.7 0.5 1.7 1.4 22.322.322.322.3
Wyoming ……………………………………………… 0.2 0.0 0.0 0.0 0.20.20.20.2
Total Total Total Total 433.6433.6433.6433.6 208.5208.5208.5208.5 225.0225.0225.0225.0 90.490.490.490.4 957.6957.6957.6957.6
Notes:Notes:Notes:Notes:
No organizations responded with data in states marked with " - ."
* In cases in which EM&V is not allocated by customer class, it is included in "other."

2007200720072007 2008200820082008 2009200920092009 2010201020102010 2011201120112011 2012201220122012
Alberta …………………………………………...…………………………. 0.2 1.8 - - - -
British Columbia ………………………………...……...……………. 75.2 114.9 - 207.1 239.1 239.3
Manitoba ……………………………………..…………..……….… 58.1 57.3 61.4 65.0 - 39.1
New Brunswick* ……………………………………….……… 26.8 24.4 17.5 - - -
Newfoundland and Labrador ………...…………..……………….. 0.6 - 1.7 1.2 - 5.2
Nova Scotia ………………………..…...………………….………. - - - 21.5 - 43.6
Ontario ……………………………………...…………………...………….. 193.5 315.8 - 393.1 437.6 486.5
Prince Edward Island ……………………...…………….………….. - - - - - -
Québec ……………………………..…………………………..……..…… 226.2 252.0 258.2 238.0 - 197.4
Saskatchewan …………………………….…………………..……… 1.6 1.8 - - 27.1 26.9
Additional Canadian Gas Budgets**………………….Additional Canadian Gas Budgets**………………….Additional Canadian Gas Budgets**………………….Additional Canadian Gas Budgets**…………………. - - - - - - - - - - - - - - - - 61.761.761.761.7 30.630.630.630.6
Additional Aggregated Budgets***………………….Additional Aggregated Budgets***………………….Additional Aggregated Budgets***………………….Additional Aggregated Budgets***…………………. - - - - - - - - 426.0426.0426.0426.0 14.414.414.414.4 377.7377.7377.7377.7 - - - -
TotalTotalTotalTotal 582.1582.1582.1582.1 767.9767.9767.9767.9 765.0765.0765.0765.0 940.2940.2940.2940.2 1,143.21,143.21,143.21,143.2 1,068.71,068.71,068.71,068.7
2007200720072007 2008200820082008 2009200920092009 2010201020102010 2011201120112011 2012201220122012
Alberta …………………………………………...…………………………. 0.2 1.9 - - - -
British Columbia ………………………………...……...……………. 75.2 122.9 - 217.0 230.6 240.4
Manitoba ……………………………………..…………..……….… 58.1 61.3 65.8 68.1 - 39.3
New Brunswick* ……………………………………….……… 26.8 26.1 18.8 - - -
Newfoundland and Labrador ………...…………..……………….. 0.6 - 1.8 1.2 - 5.2
Nova Scotia ………………………..…...………………….………. - - - 22.6 - 43.8
Ontario ……………………………………...…………………...………….. 193.5 337.9 - 411.9 422.0 488.7
Prince Edward Island ……………………...…………….………….. - - - - - -
Québec ……………………………..…………………………..……..…… 226.2 269.7 276.5 249.4 - 198.3
Saskatchewan …………………………….…………………..……… 1.6 1.9 - - 26.1 27.1
Additional Canadian Gas Budgets**……………Additional Canadian Gas Budgets**……………Additional Canadian Gas Budgets**……………Additional Canadian Gas Budgets**…………… - - - - - - - - - - - - - - - - 59.559.559.559.5 30.730.730.730.7
Additional Aggregated Budgets***………….Additional Aggregated Budgets***………….Additional Aggregated Budgets***………….Additional Aggregated Budgets***…………. - - - - - - - - 456.3456.3456.3456.3 15.015.015.015.0 364.2364.2364.2364.2 - - - -
TotalTotalTotalTotal 582.1582.1582.1582.1 821.7821.7821.7821.7 819.1819.1819.1819.1 985.1985.1985.1985.1 1,102.41,102.41,102.41,102.4 1,073.61,073.61,073.61,073.6
Notes:Notes:Notes:Notes:
*** Total budgets in cases where only one program administrator responded with data in a province
* Efficiency programs are not funded by ratepayers.
** Total gas budgets from respondents that did not grant permission to release their data at the provincial level.
Between 2009 and 2011, CEE aggregated provincial level data in cases where we received information from only one program administrator in a
province. Provinces marked with this symbol " - " indicate either (1) no organization responded with data in this province or (2) only one organization
responded with data in this province. CEE aggregates these totals in "Additional Aggregated Budgets".
Table 8. Canadian Electric and Gas Program Budgets by Province, Including Demand Response, 2007 - Table 8. Canadian Electric and Gas Program Budgets by Province, Including Demand Response, 2007 - Table 8. Canadian Electric and Gas Program Budgets by Province, Including Demand Response, 2007 - Table 8. Canadian Electric and Gas Program Budgets by Province, Including Demand Response, 2007 -
2012 (Millions USD)2012 (Millions USD)2012 (Millions USD)2012 (Millions USD)
Canadian Electric and Gas Program Budgets by Province, Including Demand Response, 2007 - 2012 Canadian Electric and Gas Program Budgets by Province, Including Demand Response, 2007 - 2012 Canadian Electric and Gas Program Budgets by Province, Including Demand Response, 2007 - 2012 Canadian Electric and Gas Program Budgets by Province, Including Demand Response, 2007 - 2012
(Millions CAD)(Millions CAD)(Millions CAD)(Millions CAD)

ResidentialResidentialResidentialResidential Low IncomeLow IncomeLow IncomeLow Income
Commercial & Commercial & Commercial & Commercial &
IndustrialIndustrialIndustrialIndustrial Other*Other*Other*Other*
Demand Demand Demand Demand
ResponseResponseResponseResponse Grand TotalGrand TotalGrand TotalGrand Total
Alberta …………………………………………...…………………………. - - - - - - - - -
British Columbia ………………………………...……...……………. 40.7 12.6 137.7 48.3 0.0 239.3239.3239.3239.3
Manitoba ……………………………………..…………..……….… 6.7 1.1 20.2 5.4 5.7 39.139.139.139.1
New Brunswick ……………………………………….……… - - - - - - - - -
Newfoundland and Labrador ………...…………..……………….. 3.0 0.0 1.0 0.9 0.3 5.25.25.25.2
Nova Scotia ………………………..…...………………….………. 14.5 4.3 19.8 5.0 0.0 43.643.643.643.6
Ontario ……………………………………...…………………...………….. 2.5 5.8 11.6 9.9 115.0 486.5486.5486.5486.5
Prince Edward Island ……………………...…………….………….. - - - - - - - - -
Québec ……………………………..…………………………..……..…… 57.3 9.4 114.6 16.1 0.0 197.4197.4197.4197.4
Saskatchewan …………………………….…………………..……… 10.3 3.6 6.6 0.4 6.0 26.926.926.926.9
Additional Canadian Gas Budgets**……………..Additional Canadian Gas Budgets**……………..Additional Canadian Gas Budgets**……………..Additional Canadian Gas Budgets**…………….. 2.72.72.72.7 6.16.16.16.1 12.312.312.312.3 9.69.69.69.6 0.00.00.00.0 30.630.630.630.6
Total Total Total Total 137.7137.7137.7137.7 42.942.942.942.9 323.8323.8323.8323.8 95.595.595.595.5 127.1127.1127.1127.1 1,068.71,068.71,068.71,068.7
ResidentialResidentialResidentialResidential Low IncomeLow IncomeLow IncomeLow Income
Commercial & Commercial & Commercial & Commercial &
IndustrialIndustrialIndustrialIndustrial Other*Other*Other*Other*
Demand Demand Demand Demand
ResponseResponseResponseResponse Grand TotalGrand TotalGrand TotalGrand Total
Alberta …………………………………………...…………………………. - - - - - - - - -
British Columbia ………………………………...……...……………. 40.9 12.6 138.4 48.5 0.0 240.4240.4240.4240.4
Manitoba ……………………………………..…………..……….… 6.7 1.1 20.3 5.5 5.8 39.339.339.339.3
New Brunswick ……………………………………….……… - - - - - - - - -
Newfoundland and Labrador ………...…………..……………….. 3.0 0.0 1.0 0.9 0.3 5.25.25.25.2
Nova Scotia ………………………..…...………………….………. 14.5 4.4 19.9 5.0 0.0 43.843.843.843.8
Ontario ……………………………………...…………………...………….. 2.6 5.8 11.6 9.9 115.5 488.7488.7488.7488.7
Prince Edward Island ……………………...…………….………….. - - - - - - - - -
Québec ……………………………..…………………………..……..…… 57.6 9.4 115.1 16.1 0.0 198.3198.3198.3198.3
Saskatchewan …………………………….…………………..……… 10.3 3.7 6.7 0.4 6.0 27.127.127.127.1
Additional Canadian Gas Budgets**…………………Additional Canadian Gas Budgets**…………………Additional Canadian Gas Budgets**…………………Additional Canadian Gas Budgets**………………… 2.72.72.72.7 6.16.16.16.1 12.312.312.312.3 9.69.69.69.6 0.00.00.00.0 30.730.730.730.7
Total Total Total Total 138.3138.3138.3138.3 43.143.143.143.1 325.3325.3325.3325.3 96.096.096.096.0 127.6127.6127.6127.6 1,073.61,073.61,073.61,073.6
Notes:Notes:Notes:Notes:
No organization responded with data in years marked with " - ."
* In cases in which EM&V is not allocated by customer class, it is included in "other."
** Total of gas budgets from respondents that did not grant permission to release their data at the provincial level.
Table 9. Canadian Electric and Gas Program Budgets by Province, 2012 (Millions USD)Table 9. Canadian Electric and Gas Program Budgets by Province, 2012 (Millions USD)Table 9. Canadian Electric and Gas Program Budgets by Province, 2012 (Millions USD)Table 9. Canadian Electric and Gas Program Budgets by Province, 2012 (Millions USD)
Canadian Electric and Gas Program Budgets by Province, 2012 (Millions CAD)Canadian Electric and Gas Program Budgets by Province, 2012 (Millions CAD)Canadian Electric and Gas Program Budgets by Province, 2012 (Millions CAD)Canadian Electric and Gas Program Budgets by Province, 2012 (Millions CAD)
The numbers in the sector categories don't always add up to the total because some respondents only provided a total and didn't break out their information by
sector.

ResidentialResidentialResidentialResidential Low IncomeLow IncomeLow IncomeLow Income
Commercial & Commercial & Commercial & Commercial &
IndustrialIndustrialIndustrialIndustrial Other*Other*Other*Other*
Demand Demand Demand Demand
ResponseResponseResponseResponse Grand TotalGrand TotalGrand TotalGrand Total
Alberta …………………………………………...…………………………. - - - - - - - - -
British Columbia ………………………………...……...……………. 28.6 4.9 119.7 44.0 0.0 197.3197.3197.3197.3
Manitoba ……………………………………..…………..……….… 9.3 5.9 21.3 4.6 5.4 46.546.546.546.5
New Brunswick ……………………………………….………………………… - - - - - - - - -
Newfoundland and Labrador ………...…………..……………….. 3.5 0.0 0.3 1.0 0.3 5.15.15.15.1
Nova Scotia ………………………..…...………………….………. 10.1 5.0 18.1 0.0 0.0 33.233.233.233.2
Ontario ……………………………………...…………………...………….. 2.7 3.8 12.9 8.6 165.9 426.5426.5426.5426.5
Prince Edward Island ……………………...…………….………….. - - - - - - - - -
Québec ……………………………..…………………………..……..…… 54.2 5.2 114.0 12.0 0.0 185.4185.4185.4185.4
Saskatchewan …………………………….…………………..……… 4.9 0.1 5.5 3.8 6.0 20.320.320.320.3
Additional Canadian Gas Expenditures**……………..Additional Canadian Gas Expenditures**……………..Additional Canadian Gas Expenditures**……………..Additional Canadian Gas Expenditures**…………….. 4.64.64.64.6 2.72.72.72.7 12.112.112.112.1 8.08.08.08.0 0.00.00.00.0 27.427.427.427.4
Total Total Total Total 117.8117.8117.8117.8 27.627.627.627.6 304.1304.1304.1304.1 82.082.082.082.0 177.7177.7177.7177.7 941.6941.6941.6941.6
ResidentialResidentialResidentialResidential Low IncomeLow IncomeLow IncomeLow Income
Commercial & Commercial & Commercial & Commercial &
IndustrialIndustrialIndustrialIndustrial Other*Other*Other*Other*
Demand Demand Demand Demand
ResponseResponseResponseResponse Grand TotalGrand TotalGrand TotalGrand Total
Alberta …………………………………………...…………………………. - - - - - - - - -
British Columbia ………………………………...……...……………. 28.3 4.9 118.4 43.5 0.0 195.1195.1195.1195.1
Manitoba ……………………………………..…………..……….… 9.2 5.8 21.1 4.5 5.3 45.945.945.945.9
New Brunswick ……………………………………….………………………………………. - - - - - - - - -
Newfoundland and Labrador ………...…………..……………….. 3.5 0.0 0.3 1.0 0.3 5.15.15.15.1
Nova Scotia ………………………..…...………………….………. 9.9 5.0 17.9 0.0 0.0 32.932.932.932.9
Ontario ……………………………………...…………………...………….. 2.7 3.8 12.8 8.6 164.1 421.8421.8421.8421.8
Prince Edward Island ……………………...…………….………….. - - - - - - - - -
Québec ……………………………..…………………………..……..…… 53.6 5.1 112.7 11.9 0.0 183.4183.4183.4183.4
Saskatchewan …………………………….…………………..……… 4.9 0.1 5.4 3.7 6.0 20.120.120.120.1
Additional Canadian Gas Expenditures**……………….Additional Canadian Gas Expenditures**……………….Additional Canadian Gas Expenditures**……………….Additional Canadian Gas Expenditures**………………. 4.54.54.54.5 2.62.62.62.6 12.012.012.012.0 7.97.97.97.9 0.00.00.00.0 27.127.127.127.1
Total Total Total Total 116.5116.5116.5116.5 27.327.327.327.3 300.7300.7300.7300.7 81.181.181.181.1 175.8175.8175.8175.8 931.4931.4931.4931.4
Notes:Notes:Notes:Notes:
No organization responded with data in years marked with " - ."
* In cases in which EM&V is not allocated by customer class, it is included in "other."
** Total of gas expenditures from respondents that did not grant permission to release their data at the provincial level.
The numbers in the sector categories don't always add up to the total because some respondents only provided a total and didn't break out their information by
sector.
Table 10. Canadian Electric and Gas Program Expenditures by Province, 2011 (Millions USD)Table 10. Canadian Electric and Gas Program Expenditures by Province, 2011 (Millions USD)Table 10. Canadian Electric and Gas Program Expenditures by Province, 2011 (Millions USD)Table 10. Canadian Electric and Gas Program Expenditures by Province, 2011 (Millions USD)
Canadian Electric and Gas Program Expenditures by Province, 2011 (Millions CAD)Canadian Electric and Gas Program Expenditures by Province, 2011 (Millions CAD)Canadian Electric and Gas Program Expenditures by Province, 2011 (Millions CAD)Canadian Electric and Gas Program Expenditures by Province, 2011 (Millions CAD)
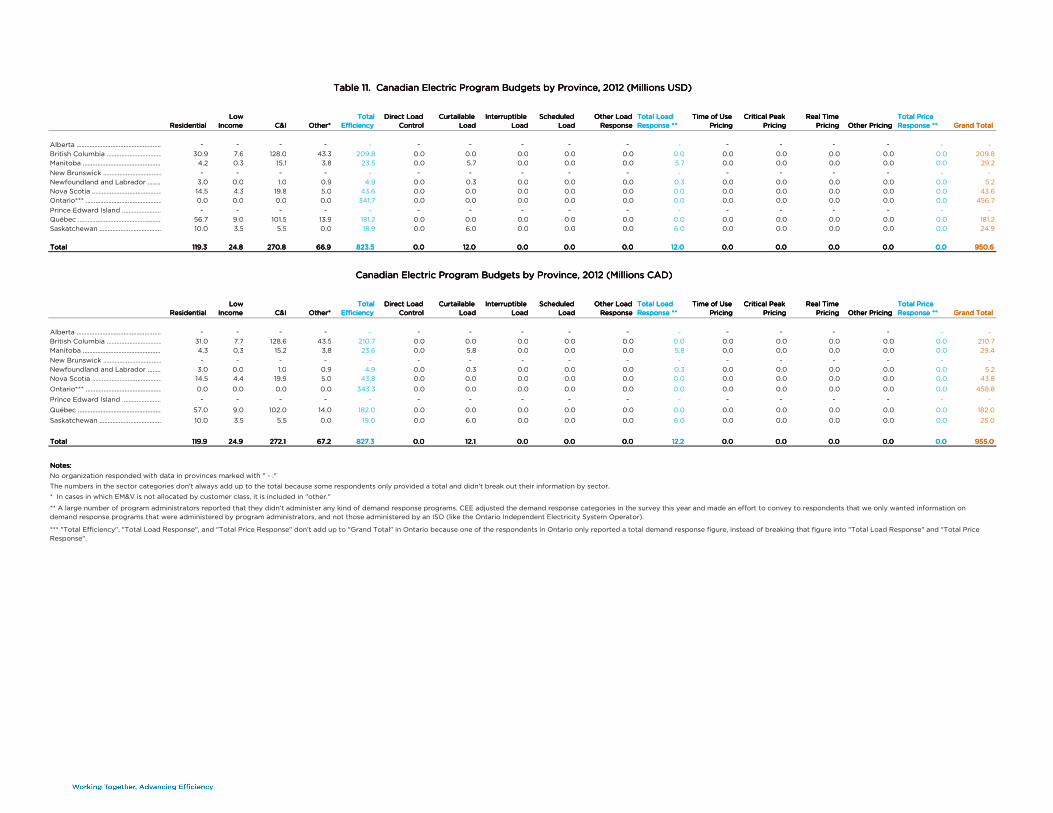
ResidentialResidentialResidentialResidential
Low Low Low Low
IncomeIncomeIncomeIncome C&IC&IC&IC&I Other*Other*Other*Other*
Total Total Total Total
EfficiencyEfficiencyEfficiencyEfficiency
Direct Load Direct Load Direct Load Direct Load
ControlControlControlControl
Curtailable Curtailable Curtailable Curtailable
LoadLoadLoadLoad
Interruptible Interruptible Interruptible Interruptible
LoadLoadLoadLoad
Scheduled Scheduled Scheduled Scheduled
LoadLoadLoadLoad
Other Load Other Load Other Load Other Load
ResponseResponseResponseResponse
Total Load Total Load Total Load Total Load
Response **Response **Response **Response **
Time of Use Time of Use Time of Use Time of Use
PricingPricingPricingPricing
Critical Peak Critical Peak Critical Peak Critical Peak
PricingPricingPricingPricing
Real Time Real Time Real Time Real Time
PricingPricingPricingPricing Other PricingOther PricingOther PricingOther Pricing
Total Price Total Price Total Price Total Price
Response **Response **Response **Response ** Grand TotalGrand TotalGrand TotalGrand Total
Alberta …………………………………………...…………………………. - - - - - - - - - - - - - - - - -
British Columbia ………………………………...……...…………….30.9 7.6 128.0 43.3 209.8 0.0 0.0 0.0 0.0 0.0 0.0 0.0 0.0 0.0 0.0 0.0 209.8
Manitoba ……………………………………..…………..……….…4.2 0.3 15.1 3.8 23.5 0.0 5.7 0.0 0.0 0.0 5.7 0.0 0.0 0.0 0.0 0.0 29.2
New Brunswick ……………………………………….……… - - - - - - - - - - - - - - - - -
Newfoundland and Labrador ………...…………..………………..3.0 0.0 1.0 0.9 4.9 0.0 0.3 0.0 0.0 0.0 0.3 0.0 0.0 0.0 0.0 0.0 5.2
Nova Scotia ………………………..…...………………….……….14.5 4.3 19.8 5.0 43.6 0.0 0.0 0.0 0.0 0.0 0.0 0.0 0.0 0.0 0.0 0.0 43.6
Ontario*** ……………………………………...…………………...…………..0.0 0.0 0.0 0.0 341.7 0.0 0.0 0.0 0.0 0.0 0.0 0.0 0.0 0.0 0.0 0.0 456.7
Prince Edward Island ……………………...…………….………….. - - - - - - - - - - - - - - - - -
Québec ……………………………..…………………………..……..……56.7 9.0 101.5 13.9 181.2 0.0 0.0 0.0 0.0 0.0 0.0 0.0 0.0 0.0 0.0 0.0 181.2
Saskatchewan …………………………….…………………..………10.0 3.5 5.5 0.0 18.9 0.0 6.0 0.0 0.0 0.0 6.0 0.0 0.0 0.0 0.0 0.0 24.9
Total Total Total Total 119.3119.3119.3119.3 24.824.824.824.8 270.8270.8270.8270.8 66.966.966.966.9 823.5823.5823.5823.5 0.00.00.00.0 12.012.012.012.0 0.00.00.00.0 0.00.00.00.0 0.00.00.00.0 12.012.012.012.0 0.00.00.00.0 0.00.00.00.0 0.00.00.00.0 0.00.00.00.0 0.00.00.00.0 950.6950.6950.6950.6
ResidentialResidentialResidentialResidential
Low Low Low Low
IncomeIncomeIncomeIncome C&IC&IC&IC&I Other*Other*Other*Other*
Total Total Total Total
EfficiencyEfficiencyEfficiencyEfficiency
Direct Load Direct Load Direct Load Direct Load
ControlControlControlControl
Curtailable Curtailable Curtailable Curtailable
LoadLoadLoadLoad
Interruptible Interruptible Interruptible Interruptible
LoadLoadLoadLoad
Scheduled Scheduled Scheduled Scheduled
LoadLoadLoadLoad
Other Load Other Load Other Load Other Load
ResponseResponseResponseResponse
Total Load Total Load Total Load Total Load
Response **Response **Response **Response **
Time of Use Time of Use Time of Use Time of Use
PricingPricingPricingPricing
Critical Peak Critical Peak Critical Peak Critical Peak
PricingPricingPricingPricing
Real Time Real Time Real Time Real Time
PricingPricingPricingPricing Other PricingOther PricingOther PricingOther Pricing
Total Price Total Price Total Price Total Price
Response **Response **Response **Response ** Grand TotalGrand TotalGrand TotalGrand Total
Alberta …………………………………………...…………………………. - - - - - - - - - - - - - - - - -
British Columbia ………………………………...……...…………….31.0 7.7 128.6 43.5 210.7 0.0 0.0 0.0 0.0 0.0 0.0 0.0 0.0 0.0 0.0 0.0 210.7
Manitoba ……………………………………..…………..……….…4.3 0.3 15.2 3.8 23.6 0.0 5.8 0.0 0.0 0.0 5.8 0.0 0.0 0.0 0.0 0.0 29.4
New Brunswick ……………………………………….……… - - - - - - - - - - - - - - - - -
Newfoundland and Labrador ………...…………..………………..3.0 0.0 1.0 0.9 4.9 0.0 0.3 0.0 0.0 0.0 0.3 0.0 0.0 0.0 0.0 0.0 5.2
Nova Scotia ………………………..…...………………….……….14.5 4.4 19.9 5.0 43.8 0.0 0.0 0.0 0.0 0.0 0.0 0.0 0.0 0.0 0.0 0.0 43.8
Ontario*** ……………………………………...…………………...…………..0.0 0.0 0.0 0.0 343.3 0.0 0.0 0.0 0.0 0.0 0.0 0.0 0.0 0.0 0.0 0.0 458.8
Prince Edward Island ……………………...…………….………….. - - - - - - - - - - - - - - - - -
Québec ……………………………..…………………………..……..……57.0 9.0 102.0 14.0 182.0 0.0 0.0 0.0 0.0 0.0 0.0 0.0 0.0 0.0 0.0 0.0 182.0
Saskatchewan …………………………….…………………..………10.0 3.5 5.5 0.0 19.0 0.0 6.0 0.0 0.0 0.0 6.0 0.0 0.0 0.0 0.0 0.0 25.0
Total Total Total Total 119.9119.9119.9119.9 24.924.924.924.9 272.1272.1272.1272.1 67.267.267.267.2 827.3827.3827.3827.3 0.00.00.00.0 12.112.112.112.1 0.00.00.00.0 0.00.00.00.0 0.00.00.00.0 12.212.212.212.2 0.00.00.00.0 0.00.00.00.0 0.00.00.00.0 0.00.00.00.0 0.00.00.00.0 955.0955.0955.0955.0
Notes:Notes:Notes:Notes:
No organization responded with data in provinces marked with " - ."
The numbers in the sector categories don't always add up to the total because some respondents only provided a total and didn't break out their information by sector.
* In cases in which EM&V is not allocated by customer class, it is included in "other."
** A large number of program administrators reported that they didn’t administer any kind of demand response programs. CEE adjusted the demand response categories in the survey this year and made an effort to convey to respondents that we only wanted information on
demand response programs that were administered by program administrators, and not those administered by an ISO (like the Ontario Independent Electricity System Operator).
*** "Total Efficiency", "Total Load Response", and "Total Price Response" don't add up to "Grand Total" in Ontario because one of the respondents in Ontario only reported a total demand response figure, instead of breaking that figure into "Total Load Response" and "Total Price
Response".
Table 11. Canadian Electric Program Budgets by Province, 2012 (Millions USD)Table 11. Canadian Electric Program Budgets by Province, 2012 (Millions USD)Table 11. Canadian Electric Program Budgets by Province, 2012 (Millions USD)Table 11. Canadian Electric Program Budgets by Province, 2012 (Millions USD)
Canadian Electric Program Budgets by Province, 2012 (Millions CAD)Canadian Electric Program Budgets by Province, 2012 (Millions CAD)Canadian Electric Program Budgets by Province, 2012 (Millions CAD)Canadian Electric Program Budgets by Province, 2012 (Millions CAD)
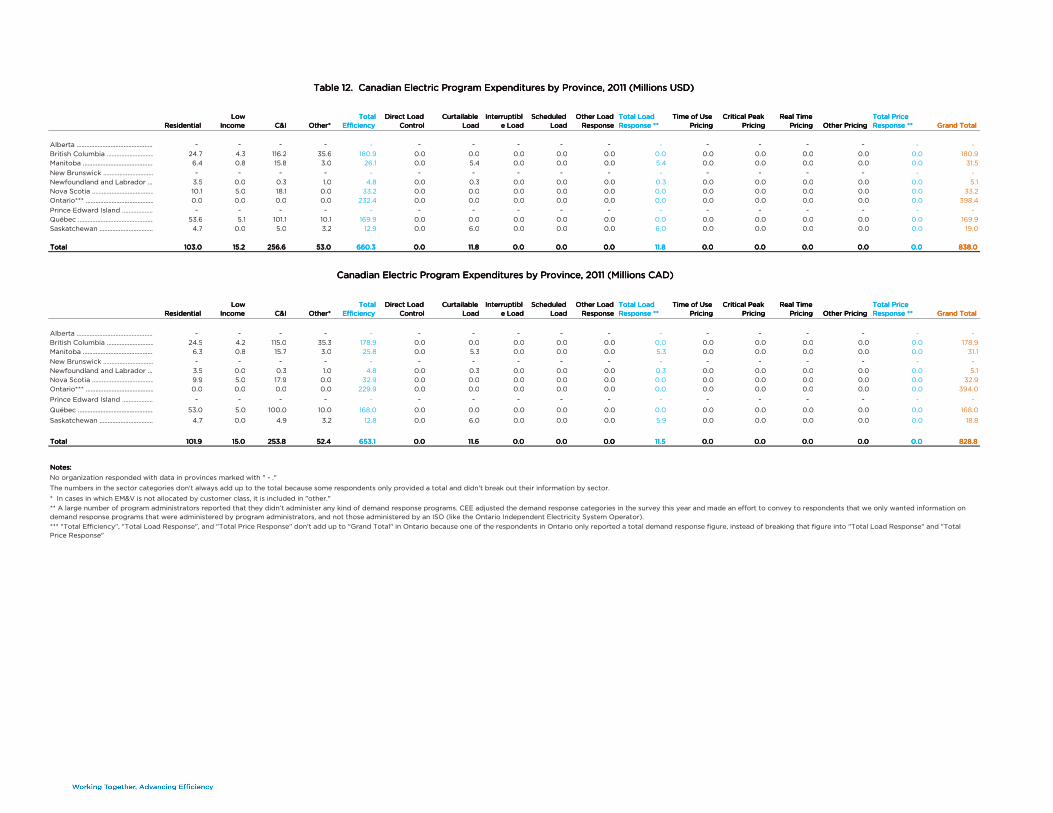
ResidentialResidentialResidentialResidential
Low Low Low Low
IncomeIncomeIncomeIncome C&IC&IC&IC&I Other*Other*Other*Other*
Total Total Total Total
EfficiencyEfficiencyEfficiencyEfficiency
Direct Load Direct Load Direct Load Direct Load
ControlControlControlControl
Curtailable Curtailable Curtailable Curtailable
LoadLoadLoadLoad
InterruptiblInterruptiblInterruptiblInterruptibl
e Loade Loade Loade Load
Scheduled Scheduled Scheduled Scheduled
LoadLoadLoadLoad
Other Load Other Load Other Load Other Load
ResponseResponseResponseResponse
Total Load Total Load Total Load Total Load
Response **Response **Response **Response **
Time of Use Time of Use Time of Use Time of Use
PricingPricingPricingPricing
Critical Peak Critical Peak Critical Peak Critical Peak
PricingPricingPricingPricing
Real Time Real Time Real Time Real Time
PricingPricingPricingPricing Other PricingOther PricingOther PricingOther Pricing
Total Price Total Price Total Price Total Price
Response **Response **Response **Response ** Grand TotalGrand TotalGrand TotalGrand Total
Alberta …………………………………………...…………………………. - - - - - - - - - - - - - - - - -
British Columbia ………………………………...……...…………….24.7 4.3 116.2 35.6 180.9 0.0 0.0 0.0 0.0 0.0 0.0 0.0 0.0 0.0 0.0 0.0 180.9
Manitoba ……………………………………..…………..……….…6.4 0.8 15.8 3.0 26.1 0.0 5.4 0.0 0.0 0.0 5.4 0.0 0.0 0.0 0.0 0.0 31.5
New Brunswick ……………………………………….……… - - - - - - - - - - - - - - - - -
Newfoundland and Labrador ………...…………..………………..3.5 0.0 0.3 1.0 4.8 0.0 0.3 0.0 0.0 0.0 0.3 0.0 0.0 0.0 0.0 0.0 5.1
Nova Scotia ………………………..…...………………….……….10.1 5.0 18.1 0.0 33.2 0.0 0.0 0.0 0.0 0.0 0.0 0.0 0.0 0.0 0.0 0.0 33.2
Ontario*** ……………………………………...…………………...…………..0.0 0.0 0.0 0.0 232.4 0.0 0.0 0.0 0.0 0.0 0.0 0.0 0.0 0.0 0.0 0.0 398.4
Prince Edward Island ……………………...…………….………….. - - - - - - - - - - - - - - - - -
Québec ……………………………..…………………………..……..……53.6 5.1 101.1 10.1 169.9 0.0 0.0 0.0 0.0 0.0 0.0 0.0 0.0 0.0 0.0 0.0 169.9
Saskatchewan …………………………….…………………..………4.7 0.0 5.0 3.2 12.9 0.0 6.0 0.0 0.0 0.0 6.0 0.0 0.0 0.0 0.0 0.0 19.0
Total Total Total Total 103.0103.0103.0103.0 15.215.215.215.2 256.6256.6256.6256.6 53.053.053.053.0 660.3660.3660.3660.3 0.00.00.00.0 11.811.811.811.8 0.00.00.00.0 0.00.00.00.0 0.00.00.00.0 11.811.811.811.8 0.00.00.00.0 0.00.00.00.0 0.00.00.00.0 0.00.00.00.0 0.00.00.00.0 838.0838.0838.0838.0
ResidentialResidentialResidentialResidential
Low Low Low Low
IncomeIncomeIncomeIncome C&IC&IC&IC&I Other*Other*Other*Other*
Total Total Total Total
EfficiencyEfficiencyEfficiencyEfficiency
Direct Load Direct Load Direct Load Direct Load
ControlControlControlControl
Curtailable Curtailable Curtailable Curtailable
LoadLoadLoadLoad
InterruptiblInterruptiblInterruptiblInterruptibl
e Loade Loade Loade Load
Scheduled Scheduled Scheduled Scheduled
LoadLoadLoadLoad
Other Load Other Load Other Load Other Load
ResponseResponseResponseResponse
Total Load Total Load Total Load Total Load
Response **Response **Response **Response **
Time of Use Time of Use Time of Use Time of Use
PricingPricingPricingPricing
Critical Peak Critical Peak Critical Peak Critical Peak
PricingPricingPricingPricing
Real Time Real Time Real Time Real Time
PricingPricingPricingPricing Other PricingOther PricingOther PricingOther Pricing
Total Price Total Price Total Price Total Price
Response **Response **Response **Response ** Grand TotalGrand TotalGrand TotalGrand Total
Alberta …………………………………………...…………………………. - - - - - - - - - - - - - - - - -
British Columbia ………………………………...……...…………….24.5 4.2 115.0 35.3 178.9 0.0 0.0 0.0 0.0 0.0 0.0 0.0 0.0 0.0 0.0 0.0 178.9
Manitoba ……………………………………..…………..……….…6.3 0.8 15.7 3.0 25.8 0.0 5.3 0.0 0.0 0.0 5.3 0.0 0.0 0.0 0.0 0.0 31.1
New Brunswick ……………………………………….……… - - - - - - - - - - - - - - - - -
Newfoundland and Labrador ………...…………..………………..3.5 0.0 0.3 1.0 4.8 0.0 0.3 0.0 0.0 0.0 0.3 0.0 0.0 0.0 0.0 0.0 5.1
Nova Scotia ………………………..…...………………….……….9.9 5.0 17.9 0.0 32.9 0.0 0.0 0.0 0.0 0.0 0.0 0.0 0.0 0.0 0.0 0.0 32.9
Ontario*** ……………………………………...…………………...…………..0.0 0.0 0.0 0.0 229.9 0.0 0.0 0.0 0.0 0.0 0.0 0.0 0.0 0.0 0.0 0.0 394.0
Prince Edward Island ……………………...…………….………….. - - - - - - - - - - - - - - - - -
Québec ……………………………..…………………………..……..……53.0 5.0 100.0 10.0 168.0 0.0 0.0 0.0 0.0 0.0 0.0 0.0 0.0 0.0 0.0 0.0 168.0
Saskatchewan …………………………….…………………..………4.7 0.0 4.9 3.2 12.8 0.0 6.0 0.0 0.0 0.0 5.9 0.0 0.0 0.0 0.0 0.0 18.8
Total Total Total Total 101.9101.9101.9101.9 15.015.015.015.0 253.8253.8253.8253.8 52.452.452.452.4 653.1653.1653.1653.1 0.00.00.00.0 11.611.611.611.6 0.00.00.00.0 0.00.00.00.0 0.00.00.00.0 11.511.511.511.5 0.00.00.00.0 0.00.00.00.0 0.00.00.00.0 0.00.00.00.0 0.00.00.00.0 828.8828.8828.8828.8
Notes:Notes:Notes:Notes:
No organization responded with data in provinces marked with " - ."
The numbers in the sector categories don't always add up to the total because some respondents only provided a total and didn't break out their information by sector.
* In cases in which EM&V is not allocated by customer class, it is included in "other."
** A large number of program administrators reported that they didn’t administer any kind of demand response programs. CEE adjusted the demand response categories in the survey this year and made an effort to convey to respondents that we only wanted information on
demand response programs that were administered by program administrators, and not those administered by an ISO (like the Ontario Independent Electricity System Operator).
*** "Total Efficiency", "Total Load Response", and "Total Price Response" don't add up to "Grand Total" in Ontario because one of the respondents in Ontario only reported a total demand response figure, instead of breaking that figure into "Total Load Response" and "Total
Price Response"
Table 12. Canadian Electric Program Expenditures by Province, 2011 (Millions USD)Table 12. Canadian Electric Program Expenditures by Province, 2011 (Millions USD)Table 12. Canadian Electric Program Expenditures by Province, 2011 (Millions USD)Table 12. Canadian Electric Program Expenditures by Province, 2011 (Millions USD)
Canadian Electric Program Expenditures by Province, 2011 (Millions CAD)Canadian Electric Program Expenditures by Province, 2011 (Millions CAD)Canadian Electric Program Expenditures by Province, 2011 (Millions CAD)Canadian Electric Program Expenditures by Province, 2011 (Millions CAD)

ResidentialResidentialResidentialResidential Low IncomeLow IncomeLow IncomeLow Income C & IC & IC & IC & I Other*Other*Other*Other* Grand TotalGrand TotalGrand TotalGrand Total
Alberta …………………………………………...…………………………. - - - - - - - -
British Columbia ………………………………...……...……………. 9.8 4.9 9.8 5.0 29.629.629.629.6
Manitoba ……………………………………..…………..……….… 2.4 0.8 5.1 1.6 9.99.99.99.9
New Brunswick ……………………………………….……… - - - - - - - -
Newfoundland and Labrador ………...…………..……………….. - - - - - - - -
Nova Scotia ………………………..…...………………….………. - - - - - - - -
Ontario ……………………………………...…………………...………….. 2.5 5.8 11.6 9.9 29.829.829.829.8
Prince Edward Island ……………………...…………….………….. - - - - - - - -
Québec ……………………………..…………………………..……..…… 0.6 0.4 13.1 2.1 16.216.216.216.2
Saskatchewan …………………………….…………………..……… 0.3 0.1 1.2 0.4 2.02.02.02.0
Additional Canadian Gas Budgets**……………..Additional Canadian Gas Budgets**……………..Additional Canadian Gas Budgets**……………..Additional Canadian Gas Budgets**…………….. 2.72.72.72.7 6.16.16.16.1 12.312.312.312.3 9.69.69.69.6 30.630.630.630.6
Total Total Total Total 18.418.418.418.4 18.118.118.118.1 52.952.952.952.9 28.628.628.628.6 118.1118.1118.1118.1
ResidentialResidentialResidentialResidential Low IncomeLow IncomeLow IncomeLow Income C & IC & IC & IC & I Other*Other*Other*Other* Grand TotalGrand TotalGrand TotalGrand Total
Alberta …………………………………………...…………………………. - - - - - - - -
British Columbia ………………………………...……...……………. 9.9 5.0 9.8 5.0 29.729.729.729.7
Manitoba ……………………………………..…………..……….… 2.5 0.8 5.1 1.6 9.99.99.99.9
New Brunswick ……………………………………….……… - - - - - - - -
Newfoundland and Labrador ………...…………..……………….. - - - - - - - -
Nova Scotia ………………………..…...………………….………. - - - - - - - -
Ontario ……………………………………...…………………...………….. 2.6 5.8 11.6 9.9 29.929.929.929.9
Prince Edward Island ……………………...…………….………….. - - - - - - - -
Québec ……………………………..…………………………..……..…… 0.6 0.4 13.1 2.1 16.316.316.316.3
Saskatchewan …………………………….…………………..……… 0.3 0.2 1.2 0.4 2.12.12.12.1
Additional Canadian Gas Budgets**………………Additional Canadian Gas Budgets**………………Additional Canadian Gas Budgets**………………Additional Canadian Gas Budgets**……………… 2.72.72.72.7 6.16.16.16.1 12.312.312.312.3 9.69.69.69.6 30.730.730.730.7
Total Total Total Total 18.518.518.518.5 18.218.218.218.2 53.253.253.253.2 28.728.728.728.7 118.6118.6118.6118.6
Notes:Notes:Notes:Notes:
No organization responded with data in provinces marked with " - ."
* In cases in which EM&V is not allocated by customer class, it is included in "other."
Table 13. Canadian Gas Program Budgets by Province, 2012 (Millions USD)Table 13. Canadian Gas Program Budgets by Province, 2012 (Millions USD)Table 13. Canadian Gas Program Budgets by Province, 2012 (Millions USD)Table 13. Canadian Gas Program Budgets by Province, 2012 (Millions USD)
Canadian Gas Program Budgets by Province, 2012 (Millions CAD)Canadian Gas Program Budgets by Province, 2012 (Millions CAD)Canadian Gas Program Budgets by Province, 2012 (Millions CAD)Canadian Gas Program Budgets by Province, 2012 (Millions CAD)
** Total of gas budgets from respondents that did not grant permission to release their data at the provincial level.
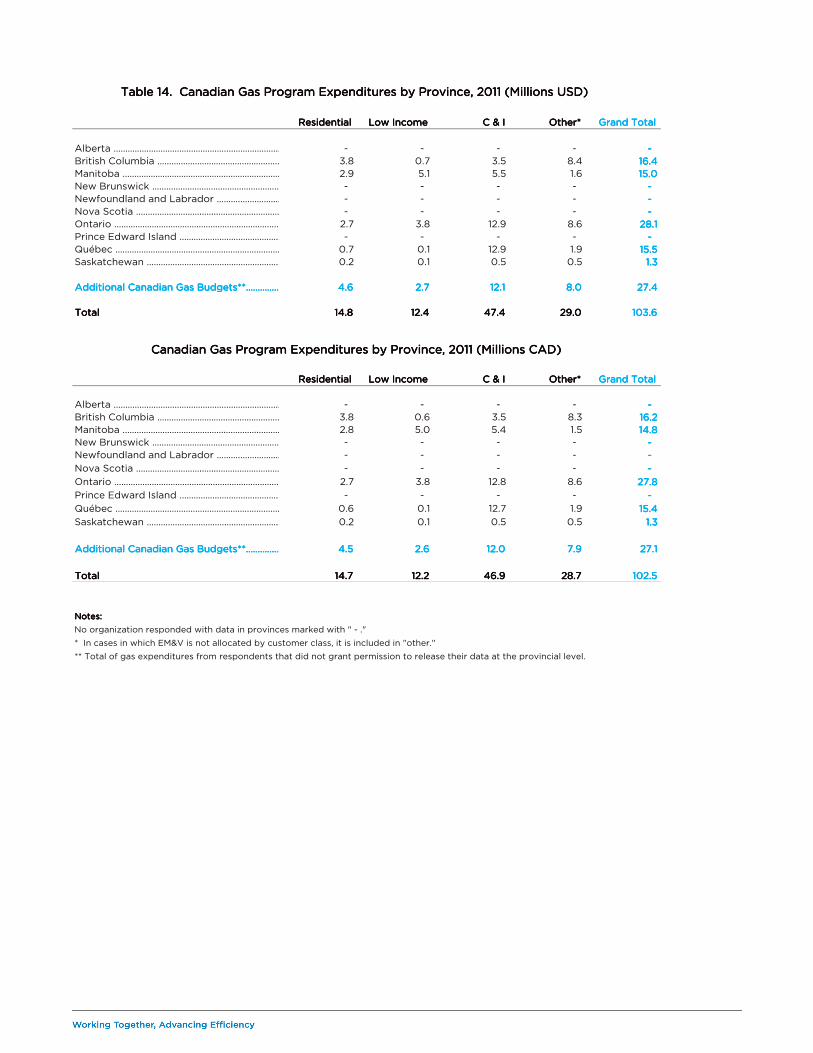
ResidentialResidentialResidentialResidential Low IncomeLow IncomeLow IncomeLow Income C & IC & IC & IC & I Other*Other*Other*Other* Grand TotalGrand TotalGrand TotalGrand Total
Alberta …………………………………………...…………………………. - - - - - - - -
British Columbia ………………………………...……...……………. 3.8 0.7 3.5 8.4 16.416.416.416.4
Manitoba ……………………………………..…………..……….… 2.9 5.1 5.5 1.6 15.015.015.015.0
New Brunswick ……………………………………….……… - - - - - - - -
Newfoundland and Labrador ………...…………..……………….. - - - - - - - -
Nova Scotia ………………………..…...………………….………. - - - - - - - -
Ontario ……………………………………...…………………...………….. 2.7 3.8 12.9 8.6 28.128.128.128.1
Prince Edward Island ……………………...…………….………….. - - - - - - - -
Québec ……………………………..…………………………..……..…… 0.7 0.1 12.9 1.9 15.515.515.515.5
Saskatchewan …………………………….…………………..……… 0.2 0.1 0.5 0.5 1.31.31.31.3
Additional Canadian Gas Budgets**………………..Additional Canadian Gas Budgets**………………..Additional Canadian Gas Budgets**………………..Additional Canadian Gas Budgets**……………….. 4.64.64.64.6 2.72.72.72.7 12.112.112.112.1 8.08.08.08.0 27.427.427.427.4
Total Total Total Total 14.814.814.814.8 12.412.412.412.4 47.447.447.447.4 29.029.029.029.0 103.6103.6103.6103.6
ResidentialResidentialResidentialResidential Low IncomeLow IncomeLow IncomeLow Income C & I C & I C & I C & I Other*Other*Other*Other* Grand TotalGrand TotalGrand TotalGrand Total
Alberta …………………………………………...…………………………. - - - - - - - -
British Columbia ………………………………...……...……………. 3.8 0.6 3.5 8.3 16.216.216.216.2
Manitoba ……………………………………..…………..……….… 2.8 5.0 5.4 1.5 14.814.814.814.8
New Brunswick ……………………………………….……… - - - - - - - -
Newfoundland and Labrador ………...…………..……………….. - - - - - - - -
Nova Scotia ………………………..…...………………….………. - - - - - - - -
Ontario ……………………………………...…………………...………….. 2.7 3.8 12.8 8.6 27.827.827.827.8
Prince Edward Island ……………………...…………….………….. - - - - - - - -
Québec ……………………………..…………………………..……..…… 0.6 0.1 12.7 1.9 15.415.415.415.4
Saskatchewan …………………………….…………………..……… 0.2 0.1 0.5 0.5 1.31.31.31.3
Additional Canadian Gas Budgets**…………………..Additional Canadian Gas Budgets**…………………..Additional Canadian Gas Budgets**…………………..Additional Canadian Gas Budgets**………………….. 4.54.54.54.5 2.62.62.62.6 12.012.012.012.0 7.97.97.97.9 27.127.127.127.1
Total Total Total Total 14.714.714.714.7 12.212.212.212.2 46.946.946.946.9 28.728.728.728.7 102.5102.5102.5102.5
Notes:Notes:Notes:Notes:
No organization responded with data in provinces marked with " - ."
* In cases in which EM&V is not allocated by customer class, it is included in "other."
Table 14. Canadian Gas Program Expenditures by Province, 2011 (Millions USD)Table 14. Canadian Gas Program Expenditures by Province, 2011 (Millions USD)Table 14. Canadian Gas Program Expenditures by Province, 2011 (Millions USD)Table 14. Canadian Gas Program Expenditures by Province, 2011 (Millions USD)
Canadian Gas Program Expenditures by Province, 2011 (Millions CAD)Canadian Gas Program Expenditures by Province, 2011 (Millions CAD)Canadian Gas Program Expenditures by Province, 2011 (Millions CAD)Canadian Gas Program Expenditures by Province, 2011 (Millions CAD)
** Total of gas expenditures from respondents that did not grant permission to release their data at the provincial level.