BRAND SWITCHING BEHAVIOUR AMONG MILLENNIAL …
61
1 BRAND SWITCHING BEHAVIOUR AMONG MILLENNIAL CONSUMERS OF FAST FOOD BRANDS IN DUBLIN, IRELAND. Masters thesis submitted in fulfilment of the requirement for the MSc. In Marketing Jolomi Elete National College of Ireland. August, 2018.
Transcript of BRAND SWITCHING BEHAVIOUR AMONG MILLENNIAL …

1
BRAND SWITCHING BEHAVIOUR AMONG MILLENNIAL CONSUMERS OF FAST
FOOD BRANDS IN DUBLIN, IRELAND.
Masters thesis submitted in fulfilment of the requirement for the MSc. In Marketing
Jolomi Elete
National College of Ireland.
August, 2018.

2
ABSTRACT
Brand switching behaviour is a concept that has received much attention in recent years owing to its
potential to drain a company's profitability and overall performance. Many studies have been carried
out to examine the factors prompting consumers to exit one product or service usage for another such
as in mobile telecommunications usage and tangible product usage, none has looked into the factors
engendering brand switching behaviour in the context of fast food restaurant in Dublin, Ireland. Thus,
this study investigates the factors most likely to result in a desire to switch fast food restaurant
patronage. The study is a quantitative research enquiry in which a total of one hundred and fifty fast
food restaurant consumers were surveyed by means of a structured questionnaire and the findings
revealed that consumers were prone to switching fast food brands if they perceive that certain aspects
of the overall service delivery process fell below their expectation. Among these are the food quality,
service quality, price, sales promotion which all had a significant effect on brand switching behaviour
while consumers were less likely to switch fast food brand on the basis of a strong and well-known
brand name in the quick service restaurant industry.
Key Words: Brand switching, food quality, service quality, price, sales promotion, brand name.

3
Submission of Thesis and Dissertation
National College of Ireland
Research Students Declaration Form
(Thesis/Author Declaration Form)
Name: Jolomi Elete
Student Number: X17129788
Degree for which thesis is submitted: MSc. Marketing
Material submitted for award
(a) I declare that the work has been composed by myself.
(b) I declare that all verbatim extracts contained in the thesis have been
distinguished by quotation marks and the sources of information specifically
acknowledged.
(c) My thesis will be included in electronic format in the College
Institutional Repository TRAP (thesis reports and projects)
(d) Either *I declare that no material contained in the thesis has been used in
any other submission for an academic award.
Or *I declare that the following material contained in the thesis formed part of
a submission for the award of
________________________________________________________________
(State the award and the awarding body and list the material below)
Signature of research student: Jolomi Elete
Date: 29/08/2018

4
Submission of Thesis to Norma Smurfit Library, National College of Ireland
Student name: Jolomi Elete Student number: X17129788
School: Business Course: MSc. Marketing
Degree to be awarded: MSc. In Marketing
Title of Thesis: Brand Switching Behaviour Among Millennial Consumers of Fast food Brands in Dublin,
Ireland.
One hard bound copy of your thesis will be lodged in the Norma Smurfit Library and will be available for
consultation. The electronic copy will be accessible in TRAP (http://trap.ncirl.ie/), the National College of Ireland’s
Institutional Repository. In accordance with normal academic library practice all theses lodged in the National
College of Ireland Institutional Repository (TRAP) are made available on open access.
I agree to a hard bound copy of my thesis being available for consultation in the library. I also agree to an electronic
copy of my thesis being made publicly available on the National College of Ireland’s Institutional Repository TRAP.
Signature of Candidate: Jolomi Elete
For completion by the School:
The aforementioned thesis was received by__________________________ Date:_______________
This signed form must be appended to all hard bound and electronic copies of your thesis submitted to your school

5
ACKNOWLEDGEMENT
The researcher would like to express his gratitude to the supervisor of this research piece Aine
McManus for the guidance she provided in the course of completing this research project especially
during the development of the questionnaire items for the study.
I also want to thank all the lecturers of the marketing department for working tirelessly to ensure I
had the requisite knowledge in the field of marketing to complete this research work.
My classmates cannot go without mention especially my group members for their contributions in
group assignments and projects which prepared me for this research work and their encouraging
support towards the completion of the master's degree program.

6
DEDICATION
This research work is dedicated to Eyitemi Elete, Tari Yvonne Elete and my wife for their support
and confidence in my ability to complete the Master of Science degree in marketing. I also dedicate
this research project to as many family and friends that supported me along this challenging yet
rewarding journey.

7
Table of Contents
Page no.
Abstract……………………………………………………………………………………………..2
Declaration………………………………………………………………………………………….3
Submission Form……………………………………………………………………………….......4
Acknowledgement………………………………………………………………………………….5
Dedication…………………………………………………………………………………………..6
1.0. Introduction/ Background of the study……………………………………………………........9
1.1. The irish fast food industry as the research context……………………………………….…..10
1.2. Statement of the research problem……………………………………………………….……12
1.3. Objective of the study………………………………………………………………………….13
1.4. Research questions…………………………………………………………………………….13
1.5. Research hypothesis…………………………………………………………………………....13
1.6. Significance of the study……………………………………………………………………....14
1.7. Scope of the study……………………………………………………………………………..15
1.8. Limitations of the study……………………………………………………………………….15
2.0. Literature review/ introduction………………………………………………………………...16
2.1. The conceptual framework…………………………………………………………………….16
2.2. The concept of brand switching………………………………………………………………..17
2.3. Barriers to brand switching…………………………………………………………………….19
2.3.1. Switching cost………………………………………………………………………………..19
2.3.2. Inertia………………………………………………………………………………………...20
2.3.3 Relational investment…………………………………………………………………………21
2.3.4. Availability of alternative……………………………………………………………………22
2.4. Difference between multi-brand loyalty and brand switching…………………………………23
2.5. Factors informing customers decision to switch fast food restaurant's services……………….24
2.5.1. Food quality…………………………………………………………………………….........25
2.5.2. Service quality………………………………………………………………………………..25
2.5.2.1. Reliability…………………………………………………………………………………..26
2.5.2.2. Responsiveness…………………………………………………………………………….27

8
2.5.2.3. Assurance………………………………………………………………………………….27
2.5.2.4. Empathy…………………………………………………………………………………...27
2.5.2.5. Tangibles………………………………………………………………………………….28
2.5.3 Price…………………………………………………………………………………………..28
2.5.4 Sales Promotion………………………………………………………………………………29
2.5. Brand name…………………………………………………………………………………... 29
3.0. Methodology introduction…………………………………………………………………….31
3.1. Research design……………………………………………………………………………….31
3.2. The population………………………………………………………………………...............32
3.3. The sample size for the study…………………………………………………………………32
3.4. Sampling technique……………………………………………………………………………33
3.5. The research instrument……………………………………………………………………….33
3.6. Validation of research instrument…………………………………………………………….34
3.7. Method of data collection……………………………………………………………………..34
3.8. Method of data analysis……………………………………………………………………….34
3.9. Reliability test…………………………………………………………………………………35
4.0. Data presentation……………………………………………………………………………...37
4.1. Data analysis…………………………………………………………………………………..39
4.2. Test of hypothesis……………………………………………………………………………..43
4.3. Discussion of findings…………………………………………………………………………46
5.0. Conclusion……………………….…………………………………………………………….48
5.1. Recommendation………………………………………………………………………………49
5.2. Area for future research……………………………………………………………………….50
References………………………………………………………………………………………….51
Appendix…………………………………………………………………………………………...58

9
CHAPTER ONE
INTRODUCTION
1.0 BACKGROUND OF THE STUDY
The digital age has witnessed an increase in advertising messages with marketers devising new ways
to reach their target market and spurring them to purchase their brands. With so many media
advertising flying through the faces of consumers on a daily basis from traditional, digital and
alternative media channels, it becomes difficult for consumers to become loyal to one particular brand
and this, more often than not, will result in switching behaviours. Pollay (2000) made reference to
advocates for the tobacco industry as well as the tobacco industry lawyers and experts who hold the
view that advertising cigarettes has no effect except for generating brand loyalty or resulting in brand
switching behaviour. Terblanche-Smit, Preez, and Der Spuy, (2014) in a study conducted in the
Alcohol industry found out that stakeholders in the alcoholic beverage industry equally holds a view
that advertising results in brand switching behaviour among consumers.
The above held belief points to the fact that advertising plays a huge role in brand switching behaviour
be it a product or a service as it has the potential to change consumers perception of a brand leading
them to try out other brands. Owing to the effect brand switching may have on the performance of an
organisation in terms of revenue, brand loyalty and brand equity, it remains an important area of
study in the field of marketing. Brand switching may come at a cost to a firm's overall performance
and Al-Kwifi and Ahmed (2015) pointed out the potential downside of switching brands and it
include a decline in the market share of a company, thriving on an unstable and unpredictable
consumer segment which will in turn affect the brand equity of the firm as well as its reputation in
the market. They further asserted that switching which is synonymous with defection can reduce a
company's profitability in the sense that these lost customers may be difficult to replace as Tepeci
(1999) rightly stated that it is cheaper to retain and serve existing customers than prospecting and
acquiring new ones and even though it is necessary to replace lost customers, the cost of acquiring
new customers is often very high and these can include the cost involved in all marketing efforts
aimed at attracting new customers such as advertising and sales promotion cost. Based on the negative
effect brand switching may have on the performance of an organisation, this study seeks to investigate
the factors (food quality, service quality, price, sales promotion, and brand name) resulting in brand
switching behaviour among Irish consumers of fast food in the hope that operators and managers of
fast food outlets will be able to leverage the findings from the study to improve their service offering

10
to ensure minimal defection and maintain a high service standard as well as offer superior services
to customers to ensure customers are satisfied.
Many studies have been conducted in the area of brand switching behaviour both within the areas of
products and services. Lam, Ahearne, Hu, and Schillewaert, (2010) carried out a study on brand
switching behaviour when a brand launches a new product into the market, using the launch of the
Iphone in Spain as the research context; Al-Kwifi, Ahmed, and Yahmout, (2014) carried out a study
on high technology product switching behaviour with focus on medical imaging products. Notable
studies in the area of service switching include the study conducted on switching behaviour of mobile
users carried out by Ranganathan, Seo, and Babad (2006); in a similar service offering, Quoquab,
Mohd. Yasin, and Abu Dardak, (2014) conducted a qualitative study on multi-brand loyalty a term
closely related to brand switching but is different in the sense that brand switching involves
completely exiting the product or service usage of a company in preference for another company's
product or service; Ranganathan et al. (2006) referred to brand switching as a situation where
customers migrate from the usage of one provider to another. Other authors such as Gray,
D'Alessandro, Johnson, and Carter, (2017), Bhattacherjee, Limayem, and Cheung, (2012), Grace,
and O'cass (2001), Blut, Beatty, Evanschitzky, and Brock (2014), Zhang Cheung, and Lee (2012) all
researched into brand switching within the context of services. However, no study has looked into
the factors which may give rise to switching amongst consumers of fast food in Ireland owing to the
fact that many fast food outlets exist in the country such as McDonald's, Burger king, KFC, Subway,
Supermacs etc and the potential to switch amongst these various brands is high. It is on this note the
researcher sets out to investigate the factors which may incite consumers to switch fast food brands.
First, a general overview and trend of the fast food industry in Ireland is discussed, second, a review
and critical analysis of relevant literature on the area of brand switching is discussed, next, the
research methodology is discussed followed by the data collection and analysis.
1.1 THE IRISH FAST FOOD INDUSTRY AS THE RESEARCH CONTEXT
Food it appears, is big business in Ireland (O'Donovan, Qunlan, and Barry, 2012), food production
represents the largest indigenous sector in the country (Henchion, 2000); owing to this, the fast food
industry continues to grow with the likes of McDonald's, Starbucks, Subway and KFC being the top-
four most valuable brands in the world in 2017 (Statista.com). Hence, it is plausible to regard the fast
food industry as not only a prominent industry but a profitable one too as visiting a fast food outlet
has become part of everyday life of consumers not just in Ireland alone but globally. The growth in
the industry can be attributed to the busy lifestyle of consumers who are constrained by time and

11
consequently, eats out of home. The Irishtimes (2014) reports that the per capital spend on fast food
in 2012 by Irish consumers was €322 and total spend in 2012 was €1.44 billion an amount expected
to increase in 2017. This has increased by 19% in 2017, although the income per head spent dropped
to €264, the income spent on fast food is forecasted to witness an increase going forward reports the
Irishmirror. For this reason, in different counties in Ireland, fast food outlets are conspicuous, selling
chips, chicken, burger, kebab, snacks, ice-cream and many different beverages. It is safe to say
therefore that fast food consumption will continue to increase owing to changes in the lifestyle of
consumers. Saghaian and Mohammadi (2018) noted that societies in general and urban areas in
particular experience changes in nutrition, communication, health and transportation which directly
affects lifestyle and eating habits. Although, research into the fast food industry has shown that fast
food consumption puts human health at risk, Afolabi, Oyawoye, Sanni, and Onabanjo (2013) reports
that the consumption of fast food is increasing mostly among young adults. Based on this, it is
expected that fast food consumers will prefer one fast food brand to another and where they perceive
that the value offered by one fast food brand is inferior to another, they most likely will switch to one
which offer a superior value and satisfies their needs. Consequently, fast food restaurants must ensure
that they provide satisfactory services to their customers and also meet customers expectations. This
is because a satisfied customer is a happy customer and such customer will continue to forge a
relationship with the brand and as well would become an advocate for the brand through positive
word of mouth or electronic word of mouth such as online reviews and this could mean increased
profitability, increased market share and achieving a steady business growth for the organisation. As
Min and Min (2013) stated, customer retention is very key to a fast food company's profitability and
there is no better way to achieve this than keeping your customers satisfied. Central to keeping them
satisfied according to Min and Min (2013) is adapting to the customers constantly evolving needs
and preferences. Some of these needs and preferences which may result in brand switching may
include the ability to use technological devices to quickly order for food, pay for and receive the food
from the convenience of their home. This the researcher considers to fall under the purview of service
quality. Previous studies have also examined the health implication of fast food consumption,
Saghaian and Mohammadi (2018) stated that the risk of having a heart heart-attack is likely to
increase from fast food consumption due to the fact that such foods are high in salt and still, others
have high calorie content such as food containing a lot of sugar and carbonated drinks which
potentially could double the negative consequence associated with fast food consumption. This again,
the researcher considers to fall within the scope of food quality. Price, which is the amount paid for
a product or service is also a factor being considered as resulting in switching behaviour. Grewal,
Krishman, Baker, and Borin, (1998) stated that consumers view prices as a key indicator of the quality

12
of a product because they believe that market prices for products and services are determined by the
interplay between the forces of demand and supply. Muratore (2016) made reference to adult price
perception, a cognitive process in which consumers ascribe value to a product or service based on its
price. In most instances, a higher price signifies a better quality whereas, a lower price signifies a low
or an inferior quality. Price consciousness according to Muratore (2016) is another way adult view
price. A price conscious consumer seeks out low-priced goods and services to purchase. Yoon and
Tran (2011) reports that customers who are loyal to a brand tends to be insensitive to price while in
contrast, non-loyal customers, a category to which switchers can be grouped into are very sensitive
to price. Timothy and Luis, (2009) demonstrated empirically that sales promotion especially price
promotion had a positive effect in shooting up sales of fast food restaurants as well as increasing
the overall market share of a fast food brand. However, in a highly competitive marketing
environment where companies have homogenous offerings and can easily copy each other's
promotional strategy in an attempt to retain its customer base, it could be argued that there will
emerge a minimal number of customers lost due to the promotional strategies adopted by firms in
such market that are equally offering the same value to customers. still, the researcher postulates that
sales promotional strategy has the potency to give rise to brand switching behaviour among
consumers of fast food brands. Grewal el al. (1998) viewed Brand name as an important cue used by
consumers to judge the quality of a product or service. According to Hillenbrand, Alcauter,
Cervantes, and Barrios, (2013), the first point of interaction a consumer have with a product is centred
on the product or brand name and it has the potency to change the consumer's perception about a
product or service and as well influence their purchase decision. Although this may be true for luxury
brands, the same cannot be said of fast food brands. Based on this, the researcher postulates that brand
name has no relationship with consumers intent to switch among fast food consumers.
1.2. STATEMENT OF RESEARCH PROBLEM
In a fiercely competitive marketing environment such as Ireland and in particular Dublin, the survival
and performance of any business organisation is dependent on the pool of customers it has and is able
to retain to sustain optimal profitability and as mentioned earlier, meeting customers expectation is
central to their being satisfied. Ireland continues to experience increasing growth of quick-serve/ fast
food restaurants according to Bord Bia (Irsih Food Channel Insight, 2017) which gives rise to
competition for revenue maximization and market share among key players in the fast food industry.
Interestingly, getting consumers to become loyal to ones' brand and moving non-loyal consumers up
the loyalty ladder to a point where they become advocates for your brand is crucial to maximising
revenue in the long-run. Contrastingly, brand switching seems to undermine profit maximization and

13
many studies have looked into the negative effect of brand switching as well as the factors which
may result in brand switching behaviour in various context, however, no study has examined brand
switching in the context of fast food restaurant and the factors which could lead customers to drop
one fast food brand for another fast food restaurant. In response to this, this research study seeks to
investigate the factors giving rise to switching behaviour among fast food brands and what it is that
can be done to mitigate the switching of fast food brands.
1.3 OBJECTIVE OF THE STUDY
The overall objective of this research study is to investigate the factors that give rise to brand
switching among fast food brands and what can be done to prevent such consumer behaviour. The
specific objectives the researcher seek to achieve from undertaking this study include:
1. to examine whether consumers truly switch among different fast food brands,
2. to investigate the factors leading to switching among these brands,
3. to examine the impact of food quality on brand switching,
4. to ascertain the effect of service quality on brand switching using the service quality dimension
of reliability, responsiveness, assurance, empathy and tangibles,
5. to ascertain the role of sales promotion on brand switching behaviour,
6. to examine whether price has any relationship with brand switching,
7. to uncover the effect brand name has on the likelihood to switch fast food brand.
1.4 RESEARCH QUESTION
This research study will address the following questions:
1. are fast food consumers prone to switching brands?
2. What role does food quality play in the propensity to switch brand?
3. Does perceived service quality increase the likelihood to switch brands?
4. Do sales promotional activities lure consumers to switch fast food brands?
5. Is there a positive relationship between price and brand switching?
6. Does a strong and popular brand name result in brand switching?
1.5 RESEARCH HYPOTHESIS
The research hypothesis follows similar fashion as those tested by Quoquab et al. (2014) in their
qualitative research study on multi-brand loyalty in which five hypotheses were proposed and tested

14
within the context of mobile phone services providers. Although, the research under study focuses
on a similar services business to that of Quoquab et al. (2014), the hypothesis put forward by the
researcher suits a food services business and it is different from those used by Quoquab et al. (2014).
Therefore, the researcher proposes the below five hypotheses stated in the null form;
𝐻01 There is no significant positive relationship between brand name and brand switching.
𝐻02: There is no significant relationship between food quality and brand switching.
𝐻03: There is no significant relationship between service quality and brand switching.
𝐻04: There is no significant positive relationship between sales promotional strategies and brand
switching.
𝐻05: There is no significant positive relationship between price and brand switching.
1.6 SIGNIFICANCE OF THE STUDY
There exists ample research into the fast food industry with most looking into the health implication
associated with fast food consumption such as the study conducted by Afolabi et al. (2013), De
Vogli,, Kouvonen, Gimeno, (2014), the frequency of fast food consumption (Saghaian and
Mohammadi, 2018) and a study similar to this study conducted in Bangladesh by Islam and Ullah,
(2010); however, no study has researched into the fast food industry in Ireland particular in the ever
busy city of Dublin and within the context of brand switching amongst the increasing number of fast
food restaurants present in the city. Hence, this study seeks to identify the factors which may propel
a consumer to switch patronage of fast food brands as it has been stated as a matter of fact that brand
switching erodes profitability (Al-Kwifi and Ahmed, 2015, Bedi, 2015).
This research study will fill a knowledge gap in the academic world as to why consumers defect from
one brand to another and a having a good understanding of the rationale behind brand switching
behaviour of consumers within the fast food industry will enable operators and marketing managers
of fast food brands to ameliorate the factors resulting in the likelihood to switch brand so as to satisfy
and retain existing customers while at the same time attracting new customers to the brand with an
underlying effect of increased profitability. This the researcher hopes to achieve by revealing the
degree of brand switching within the fast food industry in Dublin, as well as examining the effect of

15
food quality, service quality, price, sales promotional activities and brand name on brand switching
behaviour.
1.7 SCOPE OF THE STUDY
This study proposes to examine the factors leading to brand switching behaviour among fast food
consumers in the city of Dublin. The choice of Dublin as the geographical location of the study arises
from the fact that it is a busy county and host many fast food restaurants which are situated close to
one another and the proximity and ease with which primary data could be obtained also informed the
decision to carry out the study in Dublin. Fast food restaurant customers will be surveyed randomly
and the researcher hope to use the proposed drivers (food quality, service quality, price, sales
promotion, brand name) as an indicator of consumers readiness to switch among fast food brands.
1.8 LIMITATION OF THE STUDY
This study is limited by the fact that it is restricted to county Dublin in Ireland and it employs a
quantitative approach rather than a qualitative approach or a mixed method approach to gather
primary data for the completion of the research work. The use of quantitative research method poses
a limitation in the sense that it does not allow the researcher to probe deeper and elicit rich data from
consumers.
16
CHAPTER TWO
LITERATURE REVIEW
2.0 INTRODUCTION
Generally, businesses exist for the purpose of maximising profit and ensuring that customers are
satisfied with their offering is key to maintaining optimum performance. Wu and Shang (2013) stated
that customer satisfaction has become an important goal business strive to achieve as it transcends to
increased business benefits. In addition, Torres and Kline (2006) holds the view that the degree of
engagement a very satisfied customer has with a brand would increase and such customer will
become loyal to the brand and in addition, will be less likely to switch among competing brands. In
contrast to customer satisfaction and brand loyalty, brand switching arises when a customer is
dissatisfied with a company's offering and it drains or reduces a company's profitability. The tendency
to switch brand is often prevalent in the fast food chain business due to the availability of attractive
alternatives and consumers sensitivity to operational deficiencies. Srivastava (2015) sums this
consumer switching behaviour in the context of fast food by stating that studies on customer loyalty
have shown that consumers of fast food are not truly loyal to fast food brands or products because
they function in a relationship that has low switching cost. Hence, this chapter hopes to discuss
existing literatures on brand switching and its implication for businesses and it also explore existing
literatures on the fast food industry to bring to light what is known and have been studied in these
areas. It is divided into three sections; the first section provides a conceptual framework of brand
switching and discusses the concept of brand switching and how it differs from sole brand loyalty
and multi-brand loyalty. It also discusses brand switching within the context of a tangible product
business and services business.; the second section discusses the propositions put forward by the
researcher as necessitating the need to switch fast food brand and the last section discusses the
implications of brand switching on the operations of fast food businesses.
2.1 THE CONCEPTUAL FRAMEWORK
The researcher develops a conceptual framework to act as a guide as we explore the factors which
gives rise to a desire to switch fast food brands. According to Punch (2005), the conceptual
framework is a graphical or narrative representation of the key concepts and variables in a research
study and their presupposed relationship with each other. It incorporates both the dependent variable
(Brand switching behaviour) which is dependent on the independent variable (food quality, service
quality, price, sales promotion and brand name). The model would be tested using a self-administered
questionnaire to elicit information from respondents. A total of one hundred and fifty questionnaires

17
are administered to help investigate if there exist any relationship between brand switching and the
proposed independent variables being examined. It is expected that the findings from this study will
enable marketeers and sales people especially those in the hospitality as well as food and beverage
industry to understand the drivers of the intentions to switch fast food brands.
DEPENDENT VARIABLE
INDEPENDENT VARIABLES
2.2 THE CONCEPT OF BRAND SWITCHING
Many authors have defined switching in various context especially with cognisance to the area of
study being researched upon. More specifically, switching behaviour has been studied within the
context of a physical product business, service business or from a psychological perspective.
Quoquab et al. (2014) in their study on brand switching of mobile phone services defined switching
as "dropping the existing service provider's service once and replacing it with another at the time of
purchasing the SIM card". Within this context, switching is meant to mean that a consumer exits a
provider's telecommunications service usage in preference to another service provider with the intent
of not patronising the services of the original service provider. Lei, Yuwei, Zhansheng, and Dewall
(2017) in their study on social exclusion and consumer switching behaviour defined consumer
switching a term which could be regarded as synonymous to brand switching, as voluntarily moving
from an incumbent's offering to a new offering. Al-kwifi and Ahmed (2015) cited Ping (1993) who
conceptualised brand switching as discontinuing a relationship with one brand and forging a
relationship with a new and more attractive brand. Brand switching has also been referred to as giving
Functional Utility
Maximization
Switching behaviour
Process-driven
consumer switching
behaviour
Social Mobility
switching
behaviour
Brand Switching
Behaviour
Food
Quality
Service
Quality Price Sales
Promotion Brand
Name

18
up utility of a pre-existing relationship with a brand (Wathne, Biong, and Heide, 2001, p. 54). All the
above definitions points to a single idea of severing ties with a brand and moving on to building a
relationship with a new brand. It is left to wonder what gives rise to the predisposition to switch
brand. Further research in the area of brand switching has shown that consumers switch brands be it
a product or service brand for different reasons. One of such reasons is the Utility-driven and process-
driven motives which Lei et al. (2017) discussed in their study. Similarly, Lam et al. (2010) posits
that social mobility in addition to functional utility maximization were key perspectives from which
consumers could exhibit switching behaviour.
The Utility-Driven Perspective: derived from classical economic theory of expected utility (Lei et al.,
2017) which defines utility as the amount of satisfaction a consumer derives from a product or service
(Zhao and Freiheit, 2017), this perspective holds the view that consumers are increasingly likely to
switch brand if they perceive that a new product or service would bring them greater benefits/ utility
than the incumbent product/service Lam et al. (2010). Usually, it is based on the previous experience
the consumer may have had with the current product or service which may have been found to be
unpleasant and unsatisfactory, thus making switching justifiable (Lei et al., 2017). By implication,
the product or service features and attributes as well as the perceived benefits to be derived could
serve as a yardstick to switch brand. However, it can be argued that consumers may switch brand for
other reasons other than the satisfaction to be derived from a product/service. For example, a
consumer may decide to switch to a new fast food brand because a member of the family or a friend
patronises that brand, or it may be out of sheer dislike for the product or service, or on the grounds
of cultural reasons. Based on the premise of this argument, Lei et al., (2017) proposed the process-
driven motive for brand switching.
The Process-Driven Perspective: According to Lei et al., (2017), this perspective suggests that brand
switching is a psychological process providing psychological benefits to the consumer. Consumers
are not very concerned about the benefits of the switching decision but tend to demonstrate flexibility
in the choices they make.
Brand Switching as Social Mobility: Lam et al., (2010) view this perspective as a shift away from
the functional utility maximisation perspective and holds the view that consumers switch brands as a
way of expressing themselves. It hinges on the social identity theory and takes into cognisance the
sociopsychological factors that motivates a consumer to switch brand. In essence, it means that in an
attempt for consumers to achieve their ideal self or move away from their actual self to the ideal or
ought self, they would switch brands. Although, this school of thought may play a huge role in the

19
aspect of luxury products and services, it may not be a very influential factor in consumers disposition
to switch fast food brands. Hence, this study focuses on the functional utility dimension of brand
switching which examines the perceived benefits consumers consider before making the decision to
defect to a new brand.
2.3 BARRIERS TO BTRAND SWITCHING
Besides these contexts within which switching may occur, researchers have also examined some
barriers to brand switching in an attempt to enable firms retain their customer base and ward off any
intent to switch to a new product or service provider. Han, Kim and Sunghyup (2011) postulates that
switching barriers are multi-dimensional and the barriers to switching vary from one industry to
another. In other words, the barriers to switching in banking or financial services business may be
different to that of a food services business. However, Han et al., (2011) stated that researchers
generally agree to the fact that switching cost, relational investment and availability and attractiveness
of alternative serve as barriers to switching. Other researcher such as Gray, D’Alessandro, Johnson,
and Carter, (2017) and Lee and Neale (2012), in addition to switching cost, believe that Inertia also
pose a barrier to brand switching. These barriers and how they might impact on a fast food business
are brieflyb discussed below.
2.3.1 SWITCHING COST
Switching cost according to Gray, D’Alessandro, Johnson, and Carter, (2017) is defined as a one-
time cost which a customer will incur in an attempt to switch from one product supplier or service
provider to another. Similarly, Wathne et al. (2001) also viewed switching cost as "the perceived cost
of switching to a new supplier of a product or a service and it is meant to discourage a customer from
exploring the offering of alternative suppliers. Referring to previous research studies, Lee and Neale
(2012) stated that switching cost are penalties or inconveniences of some sort meant designed by
service providers to hold on to consumers. Colgate and Lang (2001) viewed switching cost as " the
cost of changing to a new service provider which include monetary, time and psychological cost.
Switching cost has been dubbed to be an effective way to discourage consumers from switching to a
new brand but it has its advantages and drawbacks. From the perspective of the incumbent firm, it
may be beneficial in maintaining and growing its market share with a direct impact on increased
profitability and firm's overall performance, it may also be damaging to the company in the long-run
because disgruntled customers could engage in negative word of mouth and would most likely not
refer any potential customers to the firm. This argument is in line with the view of previous research

20
which Lee and Neale (2012) stated that customers who are trapped to the services of an incumbent
service provider may respond angrily by means of harmful word of mouth behaviour which could
potentially damage the brand equity of the company. Furthermore, due to the lack of flexibility in
switching, consumers would beware of firms having rigorous processes of exiting the service of these
companies. The customer may also incur the cost of search and evaluation of alternative supplier of
a product or services as well as the opportunity cost which may result from the lost synergy the
customer has with the incumbent company or brand (Wathne et al., 2001).
Ironically, the switching cost for fast food business is very low as consumers do not forge any
complex relationships with fast food brands. Quinlan et al. (1991) argues that the majority of the
anonymous fast food restaurant consumers have a low switching cost because of the existence of
many suppliers of the service and inability to distinguish among their value propositions. However,
these fast food brands use sales promotional strategies such as loyalty cards, coupons, gift card and
other deals that come at a reduced price to try to hold on to their customers. An example is Starbucks
loyalty card program in which consumers earn "stars" and are upgraded to different and a higher
loyalty level which entitles them to free tea or coffee refill or free drinks and coupons. However,
other firms could easily and quickly copy the loyalty program used by other firms and may even add
additional rewards and benefits in an attempt to lure customers away from the current brand they
patronise. Hence, it could be argued that in the context of fast food brands, switching may be
prevalent as the cost of switching may be minimal considering the benefits consumers stand to gain
by switching to a new fast food brand.
2.3.2 INERTIA
Han, Kim, and Kim (2011) viewed inertia as a repeat purchase behaviour that results from laziness,
inactiveness or passiveness of the consumer who often times view switching as too cumbersome
requiring much investment of time and effort. Gray et al. (2017) defined customer inertia as a
repeated buying behaviour in which a customer out of habit, buys the same brand every time because
less effort is needed to make the purchase. They further stated that irrespective of the negative
perception of a brand, customers would still buy that same brand as they do not put much thought
into the purchase. It has been a subject of debate as to whether inertia discourages switching even
though previous studies believe it serves as a barrier to switching as expressed by Han et al., (2011)
who stated that there is a consensual agreement by researchers that Inertia inhibits switching and
represents a psychological barrier to switching. However, firms cannot rely on inertia as a means to

21
hold on to its customers as it is considered to be a risky strategy and owing to its unsteady nature. In
essence, a customer who once made purchases out of inertia may decide to alter the way they make
their purchase decisions, and this may affect the performance of the company. Although, inertia is
still viewed as a barrier to switching to date, it could also be argued that inertia provides a ground for
switching. For example, a consumer who is loyal to a brand whose store location is inaccessible or
requires a long-distance drive would switch to a near-by shop that sells similar product.
Because of the risky nature of inertia as a barrier to switching, researchers have often times
distinguished between low inertia and high inertia consumers. Han et al., (2011), Gray et al. (2017),
and Lee and Neale (2012) all drew a distinction between low and high inertia consumers. Lee and
Neale (2012) stated that low inertia consumers may be prone to search for and compare deals and the
likelihood of switching is very high whereas high inertia consumers maintain the status quo and do
not consider switching brands. Similarly, findings by Han et al., (2011) revealed that customers with
high inertia who perceive searching and switching brands to be a burden, are more likely to stick to
and remain loyal to a particular brand whereas, customers with low inertia, are more likely to switch
brands as soon as they find a better alternative and more beneficial alternative. Gray et al. (2017)
equally acknowledge the differences in the intent to switch brands between low and high inertia
consumers and called on service providers to monitor low inertia customers to ascertain the extent of
their relationship with the brand as they are not bound by inertia forces and can exit the service at
any time.
2.3.3 RELATIONAL INVESTMENT
Commonly found in the relationship marketing literatures, It has been suggested that certain level of
relationships a consumer has with a product or service provider serve as a barrier to switching from
the incumbent provider to a new provider (Wathne et al., 2001). According to Colgate and Lang
(2001), consumers may be unlikely to switch brands because of the time invested in building and
maintaining a relationship with a brand as they are certain benefits emanating from such relationships
such as confidence, social and special treatment received from an incumbent product or service
provider. Colgate and Lang (2001) Cited Berry and Parasuraman (1991), who suggested that a high
degree of relationship-specific investment between a customer and a service provider increases the
cost of switching to a new provider as the customer stand to lose the benefits accruing from the
already established relationship-specific investments which may not be available and enjoyed from
a new service provider.

22
Although, consumers could easily forge a relationship with service personnel in a fast food restaurant,
as well as becoming emotionally attached to the physical environment and the internal decoration
and setting of the restaurant, this may not be enough to hold consumers captive to continue
patronising the fast food brand. While relationship investment may have a very strong influence
preventing switching in other service setting such as medical services and banking services, it is
believed that it plays little role as a barrier to brand switching in fast food businesses.
2.3.4 AVAILABILITY AND ATTRACTIVENESS OF ALTERNATIVES
According to Jones, Mothersbaugh, and Beatty (2000), attractiveness of alternative is the degree to
which attractive competitive brands are available in the market place with a potential to influence the
consumer to switch brand. Gray et al. (2017) defined attractiveness of alternatives as the inability of
the consumer to differentiate among features and benefits of the various available competitive
supplier of a product or service. Customers may continue to patronise a brand where they perceive
that there is little or not a good enough alternative, thus making switching impossible. In line with
this, Colgate and Lang (2001) stated that the unavailability and unattractiveness of alternative does
not necessarily mean the consumers are loyal as they continue to purchase from a given supplier
repeatedly. According to Jones, Mothersbaugh, and Beatty (2000), when there exist fewer alternative,
the likelihood to switch is low and vice versa. Ironically, Dublin is home to many fast food restaurants
including international and indigenous fast food brands which rationally thinking, will result in a high
degree of competition as each of the outlets will seek to capture a larger share of the market through
aggressive marketing campaign as popularly seen in various ambient media vehicle such as a burger
advert appearing on Dublin bus and trams, stairways, bus and Luas stations, rubbish bins, coupled
with traditional advertising on Television, Radio, bill-boards, posters etc. and digital and social media
Advertising such as intrusive advertising, mobile advertising, Facebook advertising, blogs etc with
all of this media vehicles promising consumers high quality services, top notch experience and tasty
menu. Based on the above analysis, one could succinctly state that this barrier to switching has little
role to play in the context of fast food business, although it is possible to see consumers trying out
other fast food menu to find which one offers the best value for money, they tend to be more loyal to
one brand irrespective of patronising other brands at various times. This purchase behaviour of trying
out other brands and returning to continue in a relationship with one's preferred brand has been termed
Multi-brand loyalty. Hence the following section seeks to critically analyse the difference between
the concepts of Multi-brand loyalty and brand switching.
23
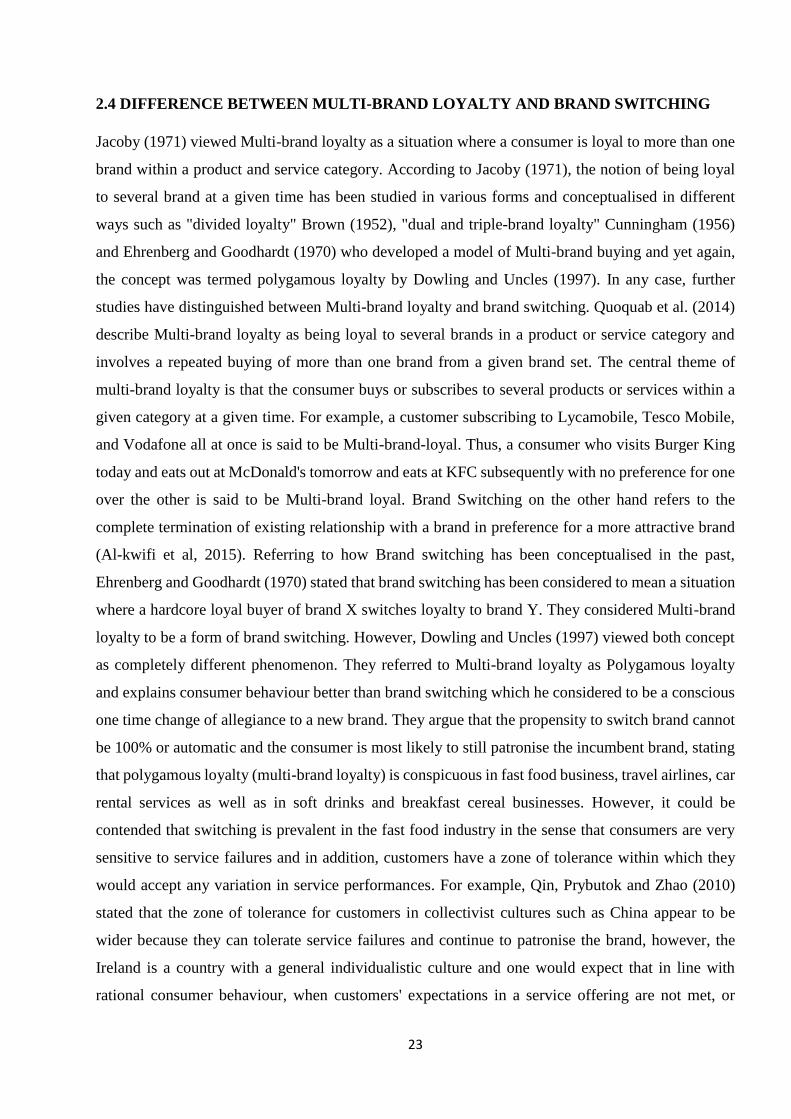
2.4 DIFFERENCE BETWEEN MULTI-BRAND LOYALTY AND BRAND SWITCHING
Jacoby (1971) viewed Multi-brand loyalty as a situation where a consumer is loyal to more than one
brand within a product and service category. According to Jacoby (1971), the notion of being loyal
to several brand at a given time has been studied in various forms and conceptualised in different
ways such as "divided loyalty" Brown (1952), "dual and triple-brand loyalty" Cunningham (1956)
and Ehrenberg and Goodhardt (1970) who developed a model of Multi-brand buying and yet again,
the concept was termed polygamous loyalty by Dowling and Uncles (1997). In any case, further
studies have distinguished between Multi-brand loyalty and brand switching. Quoquab et al. (2014)
describe Multi-brand loyalty as being loyal to several brands in a product or service category and
involves a repeated buying of more than one brand from a given brand set. The central theme of
multi-brand loyalty is that the consumer buys or subscribes to several products or services within a
given category at a given time. For example, a customer subscribing to Lycamobile, Tesco Mobile,
and Vodafone all at once is said to be Multi-brand-loyal. Thus, a consumer who visits Burger King
today and eats out at McDonald's tomorrow and eats at KFC subsequently with no preference for one
over the other is said to be Multi-brand loyal. Brand Switching on the other hand refers to the
complete termination of existing relationship with a brand in preference for a more attractive brand
(Al-kwifi et al, 2015). Referring to how Brand switching has been conceptualised in the past,
Ehrenberg and Goodhardt (1970) stated that brand switching has been considered to mean a situation
where a hardcore loyal buyer of brand X switches loyalty to brand Y. They considered Multi-brand
loyalty to be a form of brand switching. However, Dowling and Uncles (1997) viewed both concept
as completely different phenomenon. They referred to Multi-brand loyalty as Polygamous loyalty
and explains consumer behaviour better than brand switching which he considered to be a conscious
one time change of allegiance to a new brand. They argue that the propensity to switch brand cannot
be 100% or automatic and the consumer is most likely to still patronise the incumbent brand, stating
that polygamous loyalty (multi-brand loyalty) is conspicuous in fast food business, travel airlines, car
rental services as well as in soft drinks and breakfast cereal businesses. However, it could be
contended that switching is prevalent in the fast food industry in the sense that consumers are very
sensitive to service failures and in addition, customers have a zone of tolerance within which they
would accept any variation in service performances. For example, Qin, Prybutok and Zhao (2010)
stated that the zone of tolerance for customers in collectivist cultures such as China appear to be
wider because they can tolerate service failures and continue to patronise the brand, however, the
Ireland is a country with a general individualistic culture and one would expect that in line with
rational consumer behaviour, when customers' expectations in a service offering are not met, or

24
performance falls below expectations, the probability of them switching to a new service provider
who could meet their expectation is very high. This is also true for a fast food business. customers
will switch brands for various reasons in the context of a fast food restaurant such as incidents of
food poisoning, uncaring and unfriendly front-line staff, high price, untidiness of the physical
environment or Servicescape where the food service is being rendered (Wilson, Zeithaml, Bitner and
Gremler, 2012). In line with the above viewpoint, Mittal and Lassar, (1998) found in their study that
dissatisfaction results in brand switching, as well as Al-Kwifi et al. (2015) who agreed that
dissatisfaction to an extent, could explain some consumer brand switching behaviour whereas
satisfaction does not guarantee a 100% loyalty, and the likelihood of switching is still mildly existent.
Given the above analysis of the difference between Multi-brand loyalty and brand switching, the
researcher isolates five factors which could potentially give rise to dissatisfaction and thus, result in
a conscious decision to switch brands. These are presented and discussed in the following section.
2.5 FACTORS INFORMING CUSTOMERS DECISION TO SWITCH FAST FOOD
RESTAURANT'S SERVICES.
Brand switching behaviour has been an important area of research as it undermines brand loyalty
(which is an asset to an organisation) and has a negative impact on the company's revenue. Due to its
unfavourable impact in the general performance of an organisation, brand switching behaviour has
been of vital importance to marketers (Yuwei, Lingjing and Rucker, 2014, p. 183). Marketers have
been faced with the question of what factors drive consumers to stay in a relationship with a brand
otherwise termed brand loyalty, and what factors drives the consumer to abandon or terminate a
relationship with a brand (Yuwei, Lingjing and Rucker, 2014, p. 183). According to Yuwei et al.
(2014), an understanding of the factors that facilitates a desire to switch brand could help firms ward
off any operational functions that could serve as a ground for consumers to switch to other competing
brands and as a result, ensuring a high level of customer retention. As noted by Yuwei et al. (2014),
previous studies on brand switching behaviour believes that the marketing mix elements such as
product features/benefits, price discounts, retail promotion and advertising are a potential ground for
switching, however, researchers exploring the area of brand switching have acknowledged that
internal and psychological factors could also give rise to brand switching. Raju (1980) carried out a
study on "Optimum Stimulation level", a psychological antecedent to brand switching, and his
findings revealed that optimum stimulation level which relates to an individual's response to
environmental stimuli is positively correlated to a consumer's desire to switch brands, adopt a new
product and seek information out of curiosity.

25
However, for the purpose of this research study, the researcher isolates four (4) elements of the
marketing mix (Food quality, service quality, price, sales promotion) and one psychological element
(brand name) as the parameters which underpins this study. These are discussed below.
2.5.1 FOOD QUALITY
Consumers generally seek out products or services of high quality, food quality and safety are two
key elements consumers take into consideration when making a purchase decision of food items
Wendy and Frewer (2008). Consumers have different definition of food quality and safety. Generally,
food quality has been defined as one that has a great taste, it is fresh and natural and organic, and it
is a good product while safety connotes a risk free to consume and harmless food (Wendy and Frewer,
2008). Thus, a good quality food has a great taste and is free from risk of consumption such as food
poisoning. Thus, when food quality falls below customers expectations on several occasions, the
desire to switch could be ignited. Zolfagharian, Hasan and Iyer (2017) cited Anton et al. (2001) and
Kaur et al. (2012) who provided empirical evidence that customer switching may occur when the
service received by a customer falls below his/her expectation. Food quality also relates to the
nutritional value of the menu on offer and could also be a potential ground for switching when
consumers perceive that the food could put their health at risk. It is believed that most fast food are
unhealthy and contain a lot of harmful contents as shown by Cant, Machado, and Gopaul, (2014) who
stated that most of the foods sold by fast food outlets have low nutritional benefits but sadly are high
in fat, calories, salt and sugar and thus, pose a threat to human health with obesity being the likely
outcome. However, with the increasing number of consumers thronging to fast food restaurants on a
daily basis, it is difficult to tell whether or not consumers care less about food quality or if it does
truly serve as a basis to switch brand as the researcher postulates.
2.5.2 SERVICE QUALITY
Because services are intangible offerings, consumers tend to judge the quality of the services they
receive based on the service quality dimensions as propounded by Parasuraman, Zeithaml and Berry
(1988). Although, certain services business has some tangible cues by which consumers could judge
the quality of the service such as the menus on sale in a fast food restaurant, the layout of the eating
areas as well as the internal decoration and design, consumers also use the service quality dimensions
to judge the services they receive. These dimensions include; Reliability, Responsiveness, Assurance,

26
Empathy and Tangibles. Min and Min (2011) in their study adopted the determinant of fast food
restaurant service quality used by Min and Galle (1996), Kara et al. (1997) and Tsai et al. (2007)
which includes; the food taste, price competitiveness, service response and recovery time, neatness
of the restaurant, the location of the fast food restaurant, the facilities and equipment, courtesy of the
employees and the availability of healthy menus. This study though, uses the service quality
dimensions (Reliability, Responsiveness, Assurance, Empathy, and Tangibles) and other parameters
such as food quality, price, sales promotion and brand name which is the only new determinant of
brand switching incorporated into the study and is considered a psychological factor in which
consumers want to be associated with a brand that has a high reputation in the industry.
Findings of the study of Qin et al. (2010) also revealed that perceived value, food quality and service
quality were positively correlated with customer satisfaction in the fast food chain business in China,
and the dimensions of service quality crucial to Chinese consumers of fast foods were reliability,
responsiveness and tangibility, although service recovery which helps to address service failure and
customer complaint seem to be the most appealing antecedent to Customer satisfaction among
Chinese consumers of fast foods. In contrast to Chinese consumers of fast food, study by Nguyen,
Nisar, Knox, and Prabhakar (2018) revealed that for the UK fast food industry, the service quality
dimensions held by UK fast food consumers to be key to satisfaction were Responsiveness,
Assurance and Tangibility. It is safe to conclude therefore, that the differences in the perception of
service quality by Chinese and UK consumers of fast food is a clear indication that what is held as
satisfactory and unsatisfactory service quality varies from country to country. In a similar fashion to
the above-mentioned studies, this study seeks to investigate if the five dimensions of service quality
does serve as a potential ground for switching fast food brands when consumers perceive these
dimensions to fall below expectations within the context of fast food consumers in Ireland and Dublin
as the region of focus. In line with this, the meaning of the five dimensions of service quality are
given below;
2.5.2.1 RELIABILITY: The reliability dimension of service quality according to Wilson et al.
(2012) simply means that the service firm should deliver on the promise made to customer in their
integrated marketing communications messages. Furthermore, they referred to reliability as being
able to accurately and dependably deliver the services as promised to consumers. Consistent with the
finding of Qin et al. (2010) that reliability is one of the important dimensions of service quality,
Wilson et al. (2012) equally stated that reliability has been shown repeatedly to be a key criterion by
which consumers judge and perceive service quality. Often, the advertising messages of fast food
restaurants appearing on various media channels such as on billboards, magazines, TV etc. depicts

27
images of very rich, attractive and colourful menus but in reality, when bought, it appears to look
quite different from the one in the advertising messages. Consumers may begin to think that the food
is not fresh enough and the company is not delivering on its promise to provide them with inviting
and sumptuous menus. Consumers may decide to try out other fast food restaurants that would deliver
as promised. To ensure that the services is reliable, firm's must try to fail-proof the service and ensure
they get it right the first time and be consistent in the delivery of the promised service.
2.5.2.2 RESPONSIVENESS: This dimension refers to the willingness of service employees to
provide assistance and help to customers (Zeithaml, Bitner and Gremler 2009). The responsiveness
dimension of service quality demands that the firm or the front-line staff in fast food restaurant
businesses be quick to handle customer request, answer questions, handle and solve complaints and
problems encountered by customers in the Servicescape with undivided attention (Zeithaml et al.,
2009). Although perceived as a potential ground for switching by the researcher, this study seeks to
find out if the general attitude with which the service employees attend to customers may or may not
drive them to switch fast food restaurant.
2.5.2.3 ASSURANCE: Assurance deals with making the customer comfortable, full of trust and
confidence. It inspires a sense of security. Think of assurance as performing the service in way that
leaves the customer with the feeling that the service is top-notch and fail safe based on the knowledge
and experience of the service firm. Nguyen et al. (2018) referred to assurance as the competence and
politeness of service employees and their ability to inspire confidence and trust. Wilson et al. (2012)
referred to assurance as employee's knowledge about the offering of the firm and the courtesy
employed by the service employee when dealing with customers as well as the ability of the
employees of the firm to rouse trust and confidence from the customers. Within a fast food restaurant
context, Assurance could mean employees having an updated knowledge of the services and the meal
on offer as well as the cost nutritional content
2.5.2.4 EMPATHY: According to Wilson et al. (2012) empathy refers to the provision of a caring
personalised attention to the customers. A customer-centric organisation view customer as special
and have deferring needs which necessitates them to give customer customised attention so as to be
able to understand the customer better and provide services that will address their needs. Empathy
could also be thought of as the ability to understand and share the feelings of another. For example,
a hungry customer would like to have the ordered meal served on time and a discerning employee
with empathy would rush to make the order ready on time while not compromising on quality.

28
Although, Wilson et al. (2012) suggests that for small service firms, knowing and calling customers
by their name and developing a relationship with the customers could go a long way to show that the
customers are unique and special. However, this may be difficult to achieve in a fast food restaurant
business due to the large number of customers being handled on a daily basis with most of them not
telling you their names. But there are other ways one could show empathy by engaging in
conversation with the customer asking about their day, what they would like to eat and drink. Where
empathy lacks, customers may defect and so the study will also examine whether lack of empathy
could give rise to switching decision.
2.5.2.5 TANGIBLES: Parasuraman et al. (1988) referred to tangibles as those things which the
consumers can see and serve as reference point with which the service is judged such as the physical
facilities, the equipment as well as the staff appearance. Zeithaml et al. (2009) maintained that
tangibles signify quality to the consumer. For example, an untidy fast food restaurant may turn
customers off, where food ordering technology are not regularly updated as new innovations in the
fast food industry are introduced customers may feel they are not meeting up with the standards in
addition, the appearance of the service employee also may affect how customers perceive the service.
Usually, the role script in service business especially in hotel businesses requires the front-line staff
who are the first point of interaction with the service organisation to wear a smile even if they are
unhappy as this make the customer feel welcomed. This may also be true for fast food restaurant
business. Thus, the facilities, equipment and staff appearance may cause the consumer to switch to a
new restaurant.
2.5.3 PRICE
Price has been considered to be a signifier of quality in service businesses (Wilson et al., 2012). As
a result, the higher the price of the food, the possibility that consumers will judge it to be of high
quality. Marketing literature posits that the presentation of sales price shapes the consumer's
judgement of value (Biswas, Bhowmick, Guha, Grewal, 2013). Price has been considered to be a
factor that drives brand switching especially when consumers believe they would be getting the same
quality at a lower price of goods and services, they will most likely switch brand. Wathne et al. (2001)
stated that when consumers perceive that a new supplier offers better economic benefits in terms of
a significant cost saving, they would most likely switch supplier. Price is of vital importance to
consumers who have a tight budget and it may motivate consumers to switch brand even though it

29
has been suggested that it signifies quality; however, price is not sufficiently enough to cause brand
switching (Chaarlas, Rajkumar, Kogila, Lydia, and Noorunnisha, 2012). Shukla (2009) believes that
low price strategy encourages brand switching and Carpenter and Lehmann (1985) parallel this
assumption by stating that a higher switching probability to a competitor's brand exists when the
incumbent product has a high price.
2.5.3 SALES PROMOTIONAL ACTIVITIES
Sales promotional efforts has been viewed as a basis for switching brands. Tsao, Lin, Pitt, and
Campbell (2009) stated that promotional effects drive potential switchers to switch to a new brand.
They further stated that promotional efforts like advertising and price reduction could draw and entice
consumers to switch brand. Gupta (1988) conducted an empirical study to examine the percentage of
consumers sales promotional activities influence to switch brands and the findings revealed that
promotional activities shot up sales, as 84% accounted for brand switching, 14% accounted for
purchase time acceleration (consumers buying the product earlier than they planned) while 2%
bought the product for stockpiling. Again, Van Heerde, Gupta and Wittink (2003) carried out a study
comparing the percentage increase in sales between promoted brands and non-promoted brands and
the finding show that sales increased for promoted brands and 33% net increase resulted from brand
switching. However, a visit to various fast food restaurants around the city centre area of Dublin
revealed that each of these restaurants had one sales promotion program in place to help attract and
hold on to new and old customers alike. Thus, it is hypothesized that Sales promotional activities
have no significant positive relationship with brand switching in fast food restaurant business where
the use of loyalty cards, coupons and other promotional measures are commonly used by each of
these fast food restaurants.
2.5.5 BRAND NAME
Chinomona (2016) drew on the definition of the American marketing association which defined a
brand as a name, a sign, a term, a drawing or a combination of these which helps to identify a
company's goods or services from competitors. A brand name serves as cue with which consumers
often judge the quality of the product or service they intend to purchase. According to Keller, Heckler
and Houston, (1998) brand name which can take the form of people, things, objects places, animals
or could possibly be made up is critical to building brand equity for a product or service. In other
words, a suggestive and stronger brand name could draw consumers to patronise a brand. However,
for fast food restaurants, what is key is the trust the consumer has for a given brand name as being
able to provide high quality foods and better customer service than competitors. Although, it is

30
hypothesized that there is no significant relationship between brand name and brand switching
behaviour, this study hopes to find out if consumers are attached to any fast food brand based on the
brand name and the trust they have for the brand.

31
CHAPTER THREE
METHODOLOGY
3.0 INTRODUCTION
Having identified the research questions and the hypothesis put forward by the researcher based on
the review of existing literature, this chapter will discuss the methodology employed to answer the
research question and to test the hypothesis. This study is a quantitative research study which takes
on the positivism research philosophy rather than the interpretivism research philosophy. According
to Blumberg (2008), the positivism approach holds the view that knowledge is developed when social
reality is investigated through observing objective facts. A fundamental principle in the positivism
approach is that the researcher does not get personally and emotionally involved in the subject of
investigation rather assumes the role of an objective analysts in order to investigate the causalities
that leads to the formation of fundamental laws (Blumberg, 2008). Thus, this chapter will discuss the
methodology used by the researcher to examine the relationship that exist between the dependent
variable and the independent variable in the context of brand switching behaviour among fast food
consumers. It begins by discussing the research design, population, sample technique, research
instrument.
3.1 RESEARCH DESIGN
According to Blumberg (2008), "research design is the plan and the structure of an investigation
formulated so as to obtain answers to the research questions. The plan is the overall scheme or
program of the research. It includes an outline of what the investigator will do from writing
hypotheses and their operational implications to the final analysis of data. A structure represents the
framework, organization, or configuration of … the relations among the variables of a study. The
research design expresses both the structure of the research problem and the plan of investigation
used to obtain empirical evidence on relations of the problem". Punch (2005) stated that the research
design is concerned with the planning and execution of a research work and seek to answer the
questions: following what strategy? Within what framework? from who? and how? Thus, the strategy
for this study is a non-experimental research strategy that adopts the use of a Cross-sectional research
design which according to Blumberg (2008) is carried out once and gives a picture of what the trend
is like at a given point in time. The study is carried out within the framework developed for this study
in the literature review section and hopes to examine how any of the independent variables (food
quality, service quality, price, sales promotional activities and brand name) affects the dependent
variable (brand switching behaviour) from the standpoint of fast food consumers in Dublin. Data for

32
the study will be gathered through the use of the survey technique by means of a structured self-
administered questionnaire which according to Blumberg (2008) is pervasive in modern living as it
is clearly seen in use in the evaluation of hotel services, restaurant services, transportation and car
dealerships. In addition, the fact that the survey technique is widely used in many disciplines,
especially in the field of marketing and management which has embraced the use of survey in
academic research (Baker and Mukherjee (2007) has informed the choice to use the survey technique
for this study.
3.2 THE POPULATION
According to Blumberg (2008), a population represents the collection of all eligible elements which
matches the research area being investigated and from which inferences are made. Punch (2005)
referred to the population as the entire target group which ideally should be the concern of the
research study and of whom the researcher attempts to infer something. Thus, the population for this
study are millennial consumers of fast food menus in Dublin, Ireland. Dublin was chosen as the
geographically location of the study because it is one of the busiest cities in Ireland with various
competing fast food restaurants situated near one another, usually a few yards away in the ever-busy
O'Connell street and various postal districts in county Dublin.
3.3 THE SAMPLE SIZE FOR THE STUDY
According to Mark (1996), "a sample is a portion of the population chosen for the study". In
quantitative research, making inference about a population on the basis of a sample drawn from the
population is a common aspect of research enquiry. This is because you cannot include everyone in
a survey which hopes to draw conclusion on a subject that affects society in general such as fast food
consumption pattern, whereas, it might be possible to survey everyone working in an organisation.
Still, knowing what size of the population to sample remains a mind-boggling issue. Robson (2011)
stated that there is no straightforward answer as to what size of a sample a researcher needs, however,
citing Borg and Gall (1989), one hundred (100) observation is recommended as the sample size for
the major subgrouping in a survey. Hence, the size of the sample for this study is one hundred and
fifty (150) consumers of fast food brands giving the most attention to consumers who eat out in any
of the well-known fast food restaurants in Dublin such as burger king, McDonald's and KFC.

33
3.4 SAMPLING TECHNIQUE
The sampling technique refers to the method employed to collect information from the respondents.
The simple random sampling was chosen for this study in order to avoid sampling bias which could
result when some elements of the population have a minimal chance of being included in the sample.
The choice of the simple random sampling technique stems from the fact that it is a type of probability
sample and according to Robson (2011), in probability sampling, elements of the population have a
known or equal chance of inclusion in the sample and as a result, statistical inferences could be made
based on the responses given by the participants whereas in non-probability sampling, it is impossible
to make such statistical inferences. Mark (1996) referred to the simple random sampling as a
fundamental type of probability sampling which is desirable and feasible to a greater degree. Hence
the researcher finds it suitable to use the simple random probability sampling technique.
3.5 THE RESEARCH INSTRUMENT
The research instrument to be used in this study is a self-administered questionnaire which gives
respondents the freedom to conveniently provide answers to the questionnaire items at a time most
appropriate for them and in a convenient and relaxed mood. Mark (1996) defined a questionnaire as
"a set of questions or items in written form that is self-administered". Survey Questionnaire has
become widely used in various industries in the world as stated by Blumberg (2008). The
questionnaire was designed in such a way as to collect both facts and attitudes that could result in
brand switching behaviour using closed questions in a Likert scale format developed by Rensis Likert
and used for analysing attitudes, beliefs or characteristics (Thomas, 2013 pp. 213). The respondents
were made to indicate their level of agreement and disagreement on a five-point Likert scale with
respect to their beliefs and attitude towards food quality, service quality, sales promotion, price and
brand name.
Because the human attention span has dwindled to 8 seconds, and the need not to bore respondents
with too many questions leading to the possible return of uncompleted questionnaires, the
questionnaire was divided into three sections: the first section introduced the subject under
investigation, the second section contained questions related to the demographic characteristics of
the respondents such as gender, age, educational level, marital status, ethnicity and the third section
ask questions about their beliefs, attitude and perceptions about fast food restaurant's operations.

34
3.6 VALIDATION OF RESEARCH INSTRUMENT
Before the questionnaire was administered using Survey monkey, it was first scrutinized by the
supervisor of this research work to ensure that the questions being asked corresponds or seek to
answer the research questions put forward by the researcher.
3.7 METHOD OF DATA COLLECTION
The method of data collection used for this research study is a primary data collection method aided
by the development of questionnaires using survey monkey and the researcher set out to the ever-
busy O'Connell street where it was easy to ask customers exiting burger king, KFC, McDonald's and
others to take the survey on a tablet device, guaranteeing the anonymity of the respondents as well as
confidentiality of the information provided. The weblink to the survey was also shared with
colleagues at work and classmates who attested to dinning in a fast food restaurant.
3.8 METHOD OF DATA ANALYSIS
Descriptive statistics was used to analyse the demographic characteristics of the respondents while
the questions which seeks to investigate the brand switching behaviour of the respondents were
analysed using multiple regression analysis. The choice to use multiple regression analysis based on
the fact that it is a widely used statistical tool in testing hypothesis with one dependent variable and
two or more independent variables. Mason and Perreault (1991) stated that multiple regression
analysis continue to be one of the most used statistical methods in academic and statistical research.
Its acceptability as an effective statistical procedure results from its ability to be applied to various
types of data and research problems, ease of interpreting the results, robustness to violations of the
underlying assumptions and its general availability (Mason and Perreault, 1991 pp. 268). According
to Mason and Perreault (1991), the purpose of using multiple regression analysis in marketing is two-
fold; the first purpose is to make predictions when a researcher hopes to ascertain the linear
combination of a set of independent variables (predictors) which provides an estimate of the impact
they have on the dependent variable across a set of observations. The second purpose is to arrive at a
conclusion of the significance of each of the predictor variables used in the study. Punch (2005)
equally acknowledge the importance of the multiple regression analysis by stating that multiple
regression analysis design is suitable in analysing most quantitative research problems. Still, Hazra
and Gogtay (2017) stated that multiple linear regression analysis fits well in situations where there
exist multiple independent variables which are used to make predictions on a single dependent
variable. It is against this backdrop the researcher opted to use the multiple linear regression analysis

35
as the method of analysis for the study in preference to other methods of data analysis because the
study comprises five (5) independent variables and one dependent variable.
3.9 RELIABILITY TEST
Mark (1996) defined reliability as the "extent to which a measuring instrument is stable and
consistent. According to Mark (1996), the reliability test ensures that the research instrument does
not yield differing results when administered repeatedly. Thomas (2013) equally acknowledge the
importance of reliability stating that as an idea drawn from psychometrics, the concept of reliability
hinges on the ability of a research instrument to produce identical results on different occasions. For
the research instrument to be reliable, it must also be consistent, and the Cronbach's alpha score helps
measure the internal consistency of the research instrument with an acceptable value of α ≥ 0.7.
The text of reliability and alpha score are given in the table below.
MODEL SPECIATION
BRS = f (FDQ, SVQ, PRC, SAP, BRN)
BRS = β0 + β1 FDQ + β2 SVQ + β3 PRC + β4 SAP + β5 BRN + U
Where:
FDQ = food quality
SVQ = service quality
PRC = price
SAP = sales promotion
BRN = brand name
BRS = Brand Switching

36
RELIABILITY TEST RESULTS
Item Obs Sign Item-test
correlation
Item-rest
correlation
Average
inter-item
covariance
Alpha
sap 25 + 0.7921 0.6696 .3161867 0.7466
fdq 25 + 0.7583 0.6254 .3316974 0.7577
svq 25 + 0.7281 0.5897 .3462843 0.7665
prc 25 + 0.7886 0.6860 .3349395 0.7480
brs 25 + 0.8393 0.7522 .3119236 0.7310
brn 25 + 0.4276 0.1713 .4581718 0.8679
Test scale .3498672 0.8034
From the above table, the Cronbach's Alpha value are greater than 0.7 (α ≥ 0.7) which shows not only
the reliability but also the consistency of the research scale.
Having found the measurement scales to be reliable, chapter four of this study will present the results
(test the hypotheses) and discuss the findings from the study.

37
CHAPTER FOUR
DATA PRESENTATION, ANALYSIS AND DISCUSION OF RESULTS
4.0 DATA PRESENTATION
This chapter presents the information gathered from the respondents in the field survey aided by the
administration of questionnaires to customers of fast food brands in Dublin, Ireland in order to
examine the relationship and effect between five independent variables (Food quality, service quality,
price, sales promotion and brand name) and a sole dependent variable (brand switching)
The data presented and analysed in this study is categorized into three parts; the first is the descriptive
analysis of respondent's profile with percentage weighting attached. The second is the correlation and
regression analysis of the research questions and their respective variables. The third is the testing of
hypotheses formulated for the study.
Out of 168 questionnaires administered to the respondents, 150 (one hundred and fifty) were useable.
Therefore, the analysis in this chapter is based on the usable sample size of 150.
Table 1. DEMOGRAPHIC PROFILE OF RESPONDENTS
Gender Frequency Percentage (%)
Male 72 48
Female 78 52
TOTAL 150 100
Age Ranges Frequency Percentage (%)
18-25 years 36 24
26-35years 84 56
36-45years 27 18
Above 46 years 3 2

38
TOTAL 150 100
Marital Status Frequency Percentage (%)
Single 70 47
Married 50 33
In a relationship 27 18
Divorced 3 2
TOTAL 150 100
Educational Level Frequency Percentage (%)
Some high school 3 2
High school diploma 10 7
Some College/ University 9 6
College/ University degree 86 57
Post graduate school/ degree 42 28
TOTAL 150 100
Ethnicity Frequency Percentage (%)
European 38 25
African 73 49
North and South American 9 6
Asian 28 19
Others 2 1
Source: Analysis of Field Survey, 2018.
From Table 1 above, 72(48%) were male and 78(52%) were females. This indicates that the female
was more in number than the male respondents.
The age distribution of respondents which was spread across various age ranges/brackets shows that
the highest concentration of respondents fell within the age bracket of 26 to 35 years 84(56%), This
is followed by respondents within 18-25years 36(24%) of respondents, followed by respondents
within 36-45years 27(18%) of respondents and lastly are those respondents in the age bracket of

39
46years and above 3(2%) of respondents. The marital status of the respondents, it was observed that
50(33%) of the respondents were married, while 70(47%) were single, those in a relationship were
27(18%), while divorced respondents was 3(2%).
Interestingly in the demographic distribution is that majority of the respondents were Africans living
in Ireland at 73(49%); this might be due to the fact that the researcher could easily access respondents
from the African descent. Also, college/ university degree students were the most surveyed in the
study because they were readily available to talk to and were more interested to take the survey both
online and offline.
4.1 DATA ANALYSIS
This section is concerned with analysing the primary data sourced from the field survey in order to
determine the pattern of responses using simple percentage depicted and regression analysis approach
to examine the relationship that existed among variables.
Table 2: Respondent’s pattern
S/N
Statement
(Food Quality)
Scale
SA
5
A
4
U
3
D
2
SD
1
1. The caloric content of the food served
can make me switch to a new fast food
brand.
75
(50)
65
(43.3)
_ 7
(4.7)
3
(2)
2. I like to eat in a fast food restaurant that
offers tastier menu and would find one
irrespective of the cost of the food.
85
(56.7)
60
(40)
_ 5
(3.3)
_
3. The ingredient used in preparing the
food is of great concern to me
90
(60)
55
(36.8)
1
(0.6)
3
(2)
1
(0.6)
4. I may switch to another fast food
restaurant if there is inconsistency in the
standard of the food prepared everyday
75
(50)
65
(43.3)
_ 7
(4.7)
3
(2)
S/N Statement Scale

40
(Service Quality) SA
5
A
4
U
3
D
2
SD
1
5. I will switch to a new fast food
brand if the firm does not meet its
promise to offer high quality foods
and beverages
90
(60)
55
(36.8)
_ 5
(3.3)
_
6. If complaints about food served are
not swiftly handled, I would
consider switching to a new brand.
100
(66.7)
45
(30)
1
(0.6)
3
(2)
1
(0.6)
7. I will try out another fast food if the
employees do not have adequate
knowledge about the restaurant's
menu to answer my questions.
75
(50)
65
(43.3)
_ 7
(4.7)
3
(2)
8. I am likely to switch brand if the
front-line staff of the restaurant are
not friendly and courteous.
75
(50)
65
(43.3)
_ 7
(4.7)
3
(2)
S/N
Statement
(Price)
Scale
SA
5
A
4
U
3
D
2
SD
1
9. If the price of the food does not meet
the standard I expect, I wouldn’t eat
there again
75
(50)
65
(43.3)
_ 7
(4.7)
3
(2)
10. I dislike cheap fast foods because it
signifies low quality
85
(56.7)
60
(40)
_ 5
(3.3)
_
11. I am a price conscious consumer and
constantly seek out low cost fast foods
90
(60)
55
(36.8)
1
(0.6)
3
(2)
1
(0.6)
12. An increase in the price of a restaurant
menu can make me switch to an
alternative fast food restaurant
75
(50)
65
(43.3)
_ 7
(4.7)
3
(2)
S/N
Statement
(Sales Promotion)
Scale
SA
5
A
4
U
3
D
2
SD
1
13. Generally, I like patronizing fast foods
that offers rewards such as coupons,
loyalty card, mega deals and other
freebies and wouldn't mind switching
to a fast food offering these benefits.
90
(60)
55
(36.8)
_ 5
(3.3)
_
14. I would switch to a fast food brand
offering better discounts on its menus
100
(66.7)
45
(30)
1
(0.6)
3
(2)
1
(0.6)
15. If a restaurant offers prizes to be won
on the basis of repeated patronage, I
would buy from them.
75
(50)
65
(43.3)
_ 7
(4.7)
3
(2)

41
16. A bundle deal in a fast food restaurant
such as "buy any 4 for €2" would
attract me to make a purchase
75
(50)
65
(43.3)
_ 7
(4.7)
3
(2)
S/N
Statement
(Brand Name)
Scale
SA
5
A
4
U
3
D
2
SD
1
17. I care less about fast food brand name
and wouldn’t switch to a fast food with
a strong and well-known brand name.
40
(26.7)
30
(20)
25
(16.7)
45
(30)
10
(6.6)
18. The good reputation of a fast food brand
in the global market, can make me
become a customer.
45
(30)
30
(20)
20
(13.3)
40
(26.7)
15
(10)
19. I consider myself a loyal customer to a
fast food brand
40
(26.7)
30
(20)
25
(16.7)
45
(30)
10
(6.6)
20. I rather prefer to eat in a fast food with
a well-known and trusted brand name
45
(30)
30
(20)
20
(13.3)
40
(26.7)
15
(10)
S/N Statement (Brand Switching) SA A U D SD
21 I view myself as a potential switcher to get the
best value of my money
90
(60)
55
(36.8)
_ 5
(3.3)
_
22 Brand switching is an avenue for me to dump
epileptic services
100
(66.7)
45
(30)
1
(0.6)
3
(2)
1
(0.6)
23 I would still consider switching even if there
exist a high switching cost in a fast food
restaurant
75
(50)
65
(43.3)
_ 7
(4.7)
3
(2)
24 The potential cost-savings of brand switching
motivates me to switch fast food brand.
75
(50)
65
(43.3)
_ 7
(4.7)
3
(2)
Source: Analysis of field survey, 2018
The above Table 2 indicated the respondents' opinion towards the questions asked with respect to the
dependent variable and the independent variables.
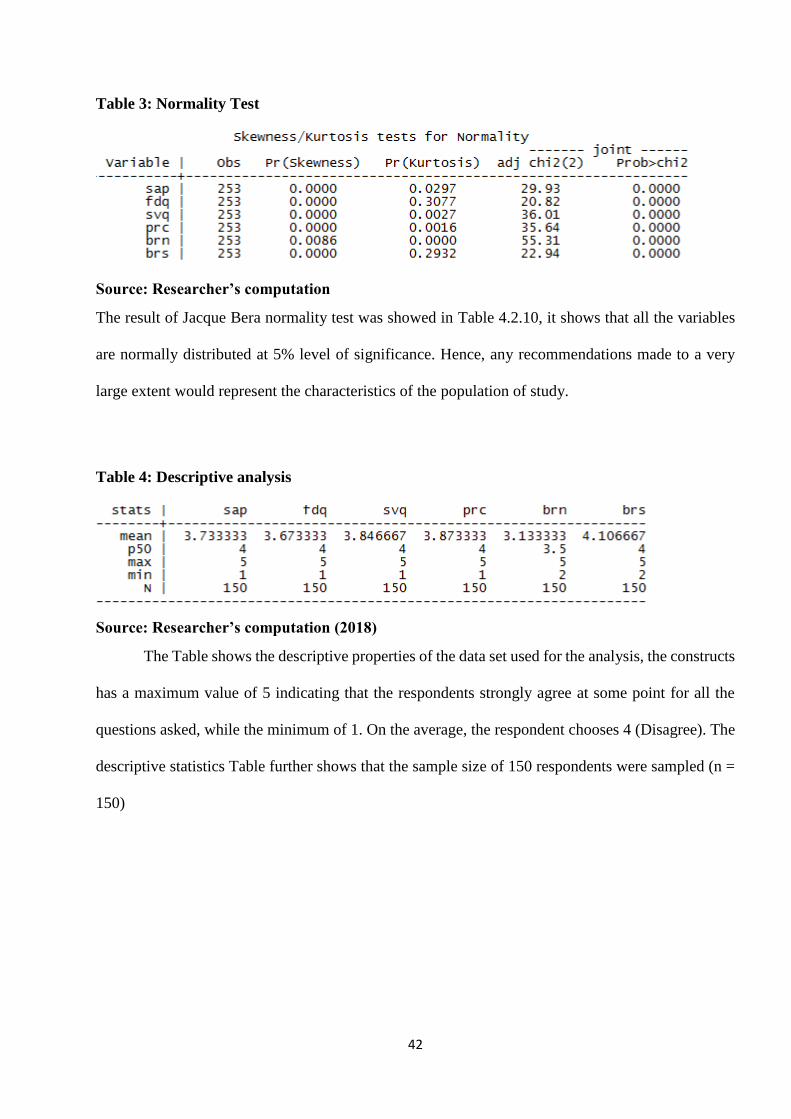
42
Table 3: Normality Test
Source: Researcher’s computation
The result of Jacque Bera normality test was showed in Table 4.2.10, it shows that all the variables
are normally distributed at 5% level of significance. Hence, any recommendations made to a very
large extent would represent the characteristics of the population of study.
Table 4: Descriptive analysis
Source: Researcher’s computation (2018)
The Table shows the descriptive properties of the data set used for the analysis, the constructs
has a maximum value of 5 indicating that the respondents strongly agree at some point for all the
questions asked, while the minimum of 1. On the average, the respondent chooses 4 (Disagree). The
descriptive statistics Table further shows that the sample size of 150 respondents were sampled (n =
150)
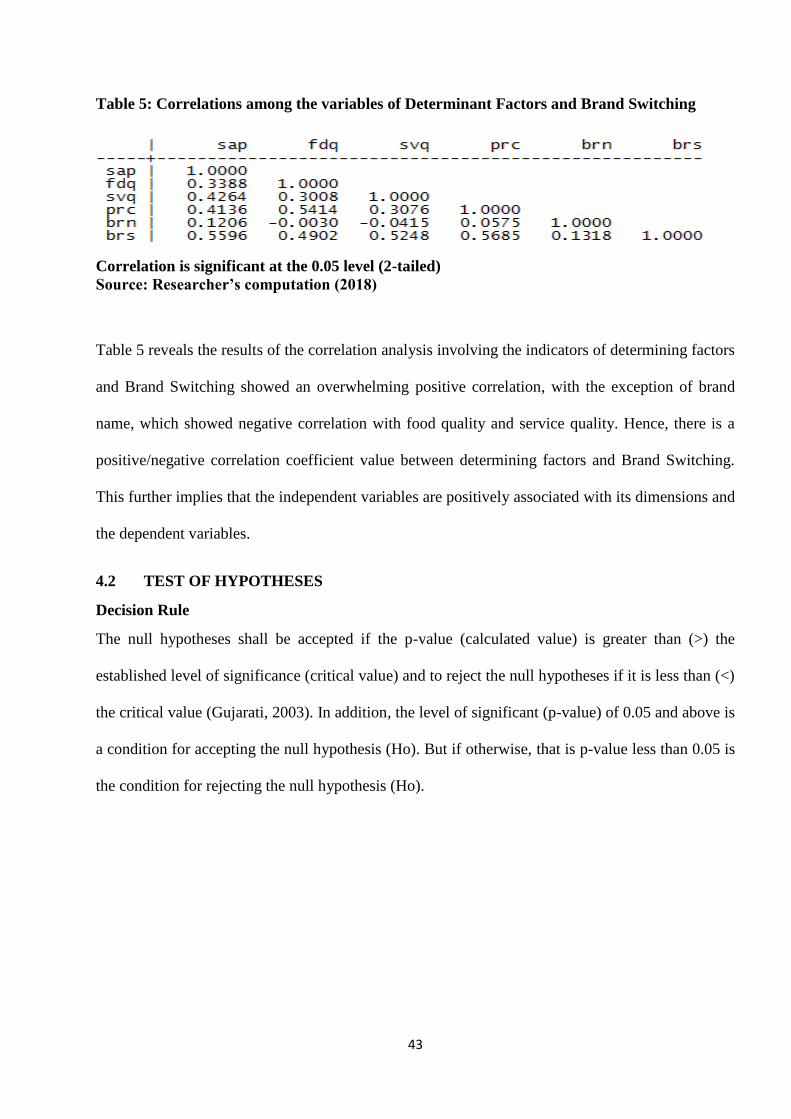
43
Table 5: Correlations among the variables of Determinant Factors and Brand Switching
Correlation is significant at the 0.05 level (2-tailed)
Source: Researcher’s computation (2018)
Table 5 reveals the results of the correlation analysis involving the indicators of determining factors
and Brand Switching showed an overwhelming positive correlation, with the exception of brand
name, which showed negative correlation with food quality and service quality. Hence, there is a
positive/negative correlation coefficient value between determining factors and Brand Switching.
This further implies that the independent variables are positively associated with its dimensions and
the dependent variables.
4.2 TEST OF HYPOTHESES
Decision Rule
The null hypotheses shall be accepted if the p-value (calculated value) is greater than (>) the
established level of significance (critical value) and to reject the null hypotheses if it is less than (<)
the critical value (Gujarati, 2003). In addition, the level of significant (p-value) of 0.05 and above is
a condition for accepting the null hypothesis (Ho). But if otherwise, that is p-value less than 0.05 is
the condition for rejecting the null hypothesis (Ho).
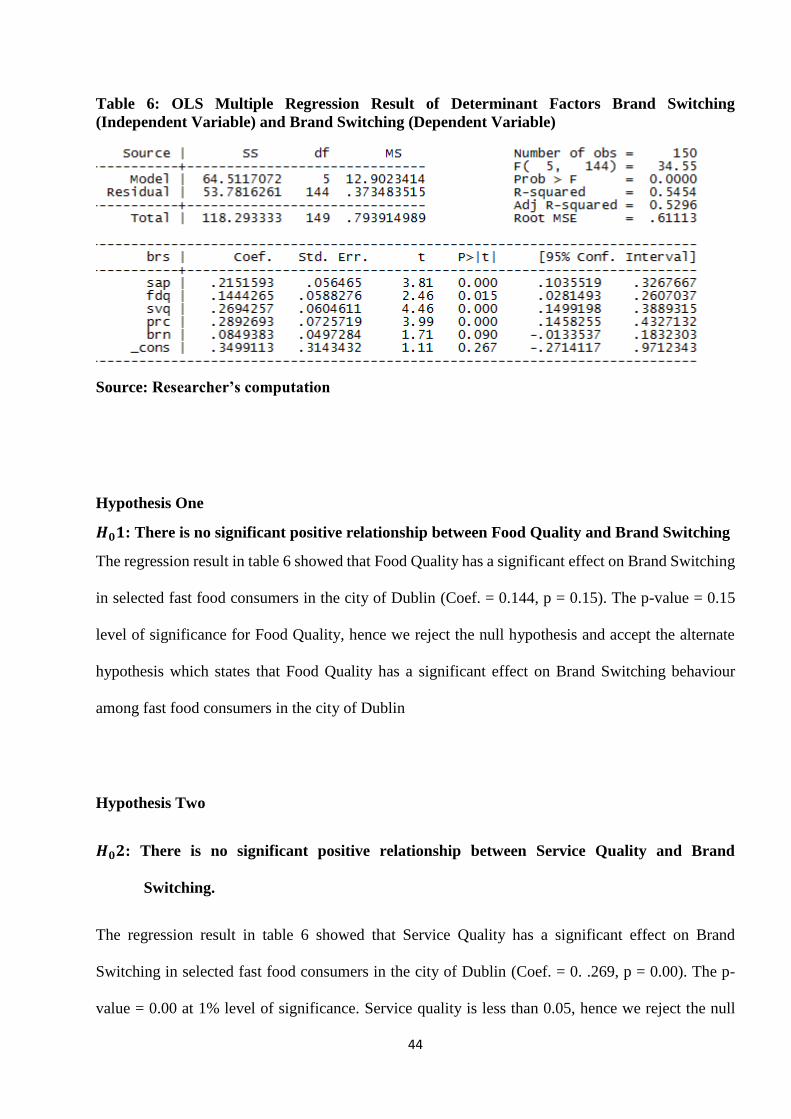
44
Table 6: OLS Multiple Regression Result of Determinant Factors Brand Switching
(Independent Variable) and Brand Switching (Dependent Variable)
Source: Researcher’s computation
Hypothesis One
𝑯𝟎𝟏: There is no significant positive relationship between Food Quality and Brand Switching
The regression result in table 6 showed that Food Quality has a significant effect on Brand Switching
in selected fast food consumers in the city of Dublin (Coef. = 0.144, p = 0.15). The p-value = 0.15
level of significance for Food Quality, hence we reject the null hypothesis and accept the alternate
hypothesis which states that Food Quality has a significant effect on Brand Switching behaviour
among fast food consumers in the city of Dublin
Hypothesis Two
𝑯𝟎𝟐: There is no significant positive relationship between Service Quality and Brand
Switching.
The regression result in table 6 showed that Service Quality has a significant effect on Brand
Switching in selected fast food consumers in the city of Dublin (Coef. = 0. .269, p = 0.00). The p-
value = 0.00 at 1% level of significance. Service quality is less than 0.05, hence we reject the null

45
hypothesis and accept the alternate hypothesis which states that Service Quality has a significant
effect on brand switching behaviour among fast food consumers in the city of Dublin
Hypothesis Three
𝑯𝟎𝟑: There is no significant positive relationship between Price and brand switching
The regression result in table 4.11 showed Price has a significant effect on Brand Switching in
selected fast food consumers in the city of Dublin (Coef. = 0. .289, p = 0.00). The p-value = 0.00 at
1% level of significant for Prices, hence we reject the null hypothesis and accept the alternate, which
state that Prices has a significant effect on brand switching behaviour among fast food consumers in
the city of Dublin.
Hypothesis Four
𝑯𝟎𝟒: There is no significant positive relationship between Sales Promotion and Brand
Switching.
The regression result in table 6 showed Sales Promotion has a significant effect on Brand Switching
in selected fast food consumers in the city of Dublin (Coef. = 0. .215, p = 0.000). The p-value 0.00
at 1% level of significant for Sales Promotion, hence we reject the null hypothesis and accept the
alternate hypothesis, which states that Sales Promotion has a significant effect on Brand Switching
in selected fast food consumers in the city of Dublin (Coef. = 0.215, p < 0.05).
Hypothesis Five
𝑯𝟎𝟓: There is no significant positive relationship between Brand Name and Brand Switching
The regression result in table 6 showed Brand Name has no significant effect on Brand Switching in
selected fast food consumers in the city of Dublin (Coef. = 0.084, p = 0.09). The p-value for brand
name (0.09, p < 0.05) is greater than 0.05, hence we accept the null hypothesis and reject the alternate,
which state that Brand Name has no significant effect on Brand Switching in selected fast food
consumers in the city of Dublin (Coef. = 0.084, p < 0.09).

46
4.3 DISCUSSION OF FINDINGS
Food Quality has a significant effect on Brand Switching in selected fast food consumers in the city
of Dublin (Coef. = 0.144, p = 0.015). The test of hypothesis shows that Food Quality has a significant
effect on Brand Switching in selected fast food consumers in the city of Dublin. This finding shows
that fast food consumers are increasingly concerned with the quality of what they consume and the
resultant health implication. While a high food quality can result in customer satisfaction, if
customers perceive a fast food brand menu to be of low quality, the tendency is that they might want
to try out other fast food brands and this could lead to brand switching. This finding corresponds to
the findings of Rashid, Abdullah, Yusuf, and Shaari, (2016) who similarly used multiple regression
analysis in their study and found that food quality was a very strong variable which has a positive
influence on customer satisfaction of generation Y consumers, although the study relates to students
in Malaysian public university.
It was found in the regression result in table 6 that Service Quality has a significant effect on Brand
Switching (Coef. = 0.269, p = 0.00). The test of hypothesis further shows that Service Quality has a
significant positive effect on Brand Switching. Each of the questions asked under the service quality
pertains to several dimensions of service quality (reliability, responsiveness, assurance and empathy).
Thus, if a fast food brand does not live up to its promise, does not assist or help customers, and does
not inspire trust and confidence, brand switching is likely to be a way to drop patronage of the fast
food brand. Again, Qin et al. (2010) found service quality to positively influence customer
satisfaction. Logically, if service quality could give rise to customer satisfaction, it could also result
in dissatisfaction and customer dissatisfaction could be a trigger to the desire to switch brands.
The regression result output in table 6 showed that brand name has no significant effect on Brand
Switching (Coef. = 0.084, p = 0.09). Since the p-value is greater than 0.05, we accept the null
hypothesis. Thus, fast food consumers in Dublin do not think highly of fast food brand names and
this is contrary to the viewpoint of Grewal el al. (1998) that brand name is an important cue by which
customers judge the quality of a product/ brand. While this may be true for luxury automobile and
clothing brands such as Mercedes Benz and BMW, Gucci, Channel, Burberry, it is not a point of
reference for fast food brands.

47
The p-value 0.000 at 1% level of significant for Price is less than 0.05, hence we reject the null
hypothesis and accept the alternate hypothesis, implying that there is significant relationship between
Prices and Brand Switching. Consumers equate price to quality and expects that the quality of the
food they are paying for matches the price to be paid; when this is not the case, the likelihood of
switching sets in.
Sales promotional strategies has a significant effect on Brand Switching. It was found that there is
significant positive relationship between Sales Promotion and Brand Switching. This is in accordance
with Gupta (1988) who repeatedly found out that consumers not only respond positively to sales
promotional programs, but it also motivates them to switch brands.

48
CHAPTER FIVE
CONCLUSION AND RECOMMENDATION
5.0 CONCLUSION
Based on the theoretical framework developed for this study to examine the factors that could
potentially engender brand switching behaviour among fast food consumers in the city of Dublin,
Ireland, the researcher has been able to investigate these factors in order to give fast food restaurant
operators a fine knowledge of the underlying causes of brand switching. Brand switching behaviour
has been studied in various services businesses such as airlines, hotels, telecommunications network
and its negative impact on the overall performance of a business operation is well recognised.
However, in the context of a fast food restaurant business, the findings from this study has revealed
that food quality, service quality, price and sales promotion all showed a significant positive
relationship with brand switching as against brand name which reports no significant relationship
with brand switching. The findings showed that:
Firstly, of great concern to the consumer is the quality of the food. Consumers want tasty, healthy
foods and are willing to pay a price they deem equivalent to the quality of the food they are served.
Based on this, fast food restaurants must try to provide consumers with tastier, healthier and fresh
foods. The ingredients used or contained in the food is also of interest to the customer, hence, fast
food restaurants should provide customers with the content used in the food preparation to keep them
informed of any food allergy they might have as a way to undermine brand switching among fast
food consumers.
Secondly, of vital importance to fast food consumers is service quality as this gives the customers a
perception of what to expect in the actual delivery of the service or service encounter. Customers
often have an expected level of service they hope to receive and when this falls below their
expectation they become dissatisfied and some may complain to the service provider to ensure that
services are provided up to the expected standards while others may respond differently by quietly

49
exiting the service and patronising other service providers. Thus, it is recommended that fast food
restaurants train their staff to provide adequate and superior services in order to differentiate itself
from other similar fast food service providers. Staff should be friendly, attentive and quick to resolve
customer complaints while rendering quick and seamless service to customers.
Thirdly, although fast food consumers in Dublin appears to be price conscious, they are willing to
pay a high price for a meal that is equivalent to the price. However, Fast food restaurant operators
should therefore provide pocket friendly menus that would not be seen as a rip-off and at the same
time not compromising on quality.
Fourthly, sales promotion showed a significant positive relationship with brand switching with a
strong p-value showing a strong evidence that invalidate the null hypothesis. Thus, fast food
consumers could easily be swayed by sales promotional activities. Operators and managers of fast
food restaurants should strive to come up with sales promotion strategy that would set it apart from
those employed by their competitors to prevent customers from switching.
Lastly, brand name which showed no significant relationship with brand switching is of little interest
to consumers, be it a local or international fast food brand; what consumers are interested in is quality
and affordable foods. Thus, irrespective of the name chosen for your brand, consumers will be willing
to dine in your restaurant if you offer quality and affordable menus.
2.6 RECOMMENDATION
Having identified the factors that triggers the desire to switch from one fast food restaurant to another,
it is recommended that fast food managers and operators provide consumers with satisfactory services
mostly in the provision of fresh and tasty foods at an affordable price and seek ways to continue to
improve in their service delivery process through engaging customers in the co-creation of value such
as asking consumers about how they can improve their services to help serve them better. Also, net
promoters score can be used to find out what customers think about the services of fast food
restaurant. It is also recommended that fast food restaurant train their staff especially the front-line
staff to offer high quality service mostly in the area of interacting with customers so as to forge a
relationship with customers while leaving them with a positive impression about the brand.

50
2.7 AREA FOR FUTURE RESEARCH
This study was restricted to the city of Dublin and used a quantitative approach in investigating the
causes of brand switching behaviour of fast food restaurant consumers. This research can be repeated
using a qualitative inquiry into what factors could give rise to brand switching among fast food
consumers. It could also be conducted in a broader geographical setting especially in areas with
limited alternatives so as to ascertain if the results replicate the findings from this study.

51
REFERNCES
Afolabi, W, Oyawoye, O, Sanni, S, and Onabanjo, O. (2013) 'Proximate and Cholesterol Composition
of Selected Fast Foods Sold in Nigeria'. Nigerian Food Journal, 31, pp. 70-76.
Al-Kwifi, O. and Ahmed, Z.U. (2015) 'An intellectual journey into the historical evolution of
marketing research in brand switching behaviour - past, present and future'. Journal of Management
History, 21(2), pp. 172-193.
Al-Kwifi, S., Ahmed, Z.U. and Yammout, D. (2014) 'Brand switching of high-technology capital
products: how product features dictate the switching decision'. The Journal of Product and Brand
Management, 23(4), pp. 322-332.
Baker, H.K. and Mukherjee, T.K. (2007) 'Survey research in finance: views from journal editors'.
International Journal of Managerial Finance, 3(1), pp. 11-25.
Banwari, M. and Walfried, M. L. (1998) 'Why do customers switch? The dynamics of satisfaction
versus loyalty'. Journal of Services Marketing, Vol. 12 Issue: 3, pp.177-194.
Barnard, N. and Ehrenberg, A. (1997) 'Advertising: Strongly persuasive or nudging?'. Journal of
Advertising Research, 37, 1, pp. 21-31.
Bedi, M. (2015) 'Antecedents of mobile number portability in indian Telecommunication sector'.
Journal of Services Research, 15(1), pp. 33-56.
Bhattacherjee, A., Limayem, M. and Cheung, C.M.K. (2012) 'User switching of information
technology: A theoretical synthesis and empirical test'. Information & Management, 49(7-8), pp. 327.
Biswas, A., Bhowmick, S. Guha, A. and Grewal, D. (2013) 'Consumer evaluations of sale prices:
Role of the subtraction principle'. Journal of Marketing, 77, 4, pp. 49-66.
Blumberg, B. (2008) 'Business research methods'. n.p.: New York: McGraw-Hill Higher Education;
London : McGraw-Hill [distributor], 2008.
Blut, M. Beatty, S.E., Evanschitzky, H. and Brock, C. (2014) 'The Impact of Service Characteristics
on the Switching Costs-Customer Loyalty Link'. Journal of Retailing, 90(2), pp. 275-290.
Cant, M.C., Machado, R. and Gopaul, M. (2014) 'Are customers satisfied with healthier food options
at South African fast-food outlets?'. The International Business & Economics Research Journal
(Online), 13(6), pp. 1199-n/a.

52
Carpenter, G. and Lehmann, D. (1985) 'A Model of Marketing Mix, Brand Switching, and
Competition'. Journal of Marketing Research (JMR), 22, 3, p. 318.
Chaarlas, L.J., MC, Rajkumar, R., MC, Kogila, N, MFM, MP, Lydia, J, MFM, MP and Noorunnisha,
A., MC, (2012) 'Service related issues faced by clients - The major cause behind brand switching in
cellular phone service industry'. Arabian Journal of Business and Management Review (Oman
Chapter), 1(8), pp. 33-46.
Chinomona, R. (2016) 'Brand communication, brand image and brand trust as antecedents of brand
loyalty in Gauteng Province of South Africa'. African Journal of Economic and Management Studies,
7(1), pp. 124-139.
Colgate, M. and Lang, B. (2001) 'Switching barriers in consumer markets: an investiga-
tion of the financial services industry'. Journal of Consumer Marketing, 18 (4),
332–347.
De Vogli, R., Kouvonen, A. and Gimeno, D. (2014) 'The influence of market deregulation on fast
food consumption and body mass index: a cross-national time series analysis'. Bulletin Of The World
Health Organization, 92, 2, pp. 9-107A.
Dowling, G. and Uncles, M. (1997) 'Do customer loyalty programs really work?'. Sloan Management
Review, 38, 4, pp. 71-82.
Ehrenberg, A. and Goodhardt, G. (1970) 'A model of multi-brand buying'. Journal Of Marketing
Research (JMR), 7, 1, pp. 77-84.
Grace, D. and O'cass, A. (2001) 'Attributions of service switching: A study of consumers' and
providers' perceptions of child-care service delivery'. The Journal of Services Marketing, 15(4), pp.
300-321.
Gray, D., D’Alessandro, S., Johnson, L. and Carter, L. (2017) 'Inertia in services: causes and
consequences for switching'. Journal of Services Marketing, 31, 6, pp. 485-498.
Grewal, D., Krishnan, R., Baker, J. and Borin, N. (1998) 'The effect of store name, brand name and
price discounts on consumers' evaluations and purchase intentions'. Journal of Retailing, 74(3), pp.
331-352.
Gupta, S. (1988) 'Impact of sales promotions on when, what, and how much to buy'. Journal of
Marketing Research (JMR), 25, 4, pp. 342-355

53
Gupta, S., Van Heerde, H. and Wittink, D. (2003) 'Is 75% of the sales promotion bump due to brand
switching? No, only 33% is'. Journal of Marketing Research (JMR), 40, 4, pp. 481-491.
Han, H., Kim, W. and Sunghyup, S.H. (2011) 'Switching intention model development: Role of
service performances, customer satisfaction, and switching barriers in the hotel industry'.
International Journal of Hospitality Management - INT J HOSP MANAG. 30. 619-629.
10.1016/j.ijhm.2010.11.006.
Han, H., Kim, Y. and Kim, E. (2011) 'Cognitive, affective, conative, and action loyalty: Testing the
impact of inertia'. International Journal of Hospitality Management - INT J HOSP MANAG. 30.
1008-1019. 10.1016/j.ijhm.2011.03.006.
Hazra, A. and Gogtay, N. (2017) 'Biostatistics Series Module 10: Brief Overview of Multivariate
Methods'. Indian Journal of Dermatology, 62, 4, pp. 358-366.
Henchion, M. (2000) 'Transport costs in the Irish food industry: Backloading issues'. Ibar, 21(1), pp.
85-102.
Hillenbrand, P., Alcauter, S., Cervantes, J. and Barrios, F. (2013) 'Better branding: brand names can
influence consumer choice'. The Journal of Product and Brand Management, 22(4), pp. 300-308.
Islam, N. and Ullah, G.M.S. (2010) 'Factors affecting consumers' preferences on fast food items in
Bangladesh'. Journal of Applied Business Research, 26(4), pp. 131-146.
Jacoby, J. (1971) 'A model of multi-brand loyalty'. Journal of Advertising Research, 11, 3, pp. 25-
31.
Jones, M., Mothersbaugh, D. and Beatty, S. (2000) 'Switching barriers and repurchase intentions in
services'. Journal of Retailing, 76, 2, p. 259.
Kara, A., Kaynak, E. and Kucukemiroglu, O. (1997) 'Marketing strategies for fast-food restaurants:
a customer view'. British Food Journal, Vol. 99 No. 9, pp. 318-24.
Keller, K., Heckler, S. and Houston, M. (1998) 'The effects of brand name suggestiveness on
advertising recall'. Journal of Marketing, 62, 1, pp. 48-57.
Lam, S., Ahearne, M., Hu, Y. and Schillewaert, N. (2010) 'Resistance to brand switching when a
radically new brand is introduced: A Social Identity Theory Perspective'. Journal of Marketing, 74,
6, pp. 128-146.

54
Lee, R. and Neale, L. (2012) 'Interactions and consequences of inertia and switching costs'. Journal
of Services Marketing, 26, 5, pp. 365-374.
Lei, S., Yuwei, J., ZHANSHENG, C. and Dewall, C. (2017) 'Social exclusion and consumer
switching behaviour: A Control Restoration Mechanism'. Journal of Consumer Research, 44, 1, pp.
99-117.
Mark, R. (1996) 'Research made simple: A handbook for social workers'. n.p: London: SAGE; 1996.
Mason, C. and Perreault Jr., W. (1991) 'Collinearity, power, and interpretation of multiple regression
analysis'. Journal of Marketing Research (JMR), 28, 3, pp. 268-280.
Min, H. and Galle, W.P. (1996), 'Competitive benchmarking of fast food restaurants using the
analytic hierarchy process and competitive gap analysis'. Operations Management Review, Vol. 11
Nos 2/3, pp. 57-72.
Min, H. and Min H. (2013) 'Cross-cultural competitive benchmarking of fast-food restaurant
services'. Benchmarking, 20(2), pp. 212-232.
Min, H. and Min, H. (2011) 'Benchmarking the service quality of fast-food restaurant franchises in
the USA'. Benchmarking, 18(2), pp. 282-300.
Muratore, I. (2016) 'Teens as impulsive buyers: what is the role of price? International Journal of
Retail & Distribution Management, 44(11), pp. 1166-1180.
Nguyen, Q., Nisar, T.M., Knox, D. and Prabhakar, G.P. (2018) 'Understanding customer satisfaction
in the UK quick service restaurant industry'. British Food Journal, 120(6), pp. 1207-1222.
O'Donovan, I., Quinlan, T. and Barry, T. (2012) 'From farm to fork'. British Food Journal, 114(4),
pp. 500-515.
Parasuraman, A., Zeithaml, V. and Berry, L. (1988) 'SERVQUAL: a multiple-item scale for
measuring consumer perceptions of service quality'. Journal of Retailing, 1, p. 12.
Pollay, R.W. (2000). 'Targeting youth and concerned smokers: evidence from Canadian tobacco
industry documents'. Tobacco control, 9(2), pp. 136.
Punch, KF. (2005) 'Introduction to social research: 'Quantitative and Qualitative Approaches'. n.p.:
London: SAGE; 2005.,

55
Qin, H., Prybutok, V.R. and Zhao, Q. (2010) 'Perceived service quality in fast-food restaurants:
empirical evidence from China'. The International Journal of Quality & Reliability Management,
27(4), pp. 424-437.
Quinlan, M., Zemke, R., Snider, J., Nemeroff, D., Reinemund, S., Ayling, R., Singh, K., Perkins, J.,
Antonini, J. and Loeb, W. (1991) 'How does service drive the service company?'. Harvard Business
Review, 69, 6, p. 146.
Quoquab, F., Mohd. Yasin, N. and Abu Dardak, R. (2014) 'A qualitative inquiry of multi-brand
loyalty: Some propositions and implications for mobile phone service providers'. Asia Pacific Journal
of Marketing and Logistics, 2, p. 250.
Raju, PS. (1980), 'Optimum stimulation level: Its relationship to personality, demographics, and
exploratory behaviour'. Journal of Consumer Research, 7, 3, pp. 272-282.
Ranganathan, C., Seo, D. and Babad, Y. (2006) 'Switching behavior of mobile users: do users'
relational investments and demographics matter?'. European Journal of Information Systems, 15(3),
pp. 269-276.
Rashid, I.M.A., Abdullah, M.F.S., Yusuf, B.N.M. and Shaari, M.S. (2016) 'Impact of service and
food quality on customer satisfaction among generation Y for the fast food restaurant in Malaysia'.
International Journal of Information, Business and Management, 8(1), pp. 51-66.
Robson, C. (2011) 'Real world research: A resource for users of social research methods in applied
settings'. n.p.: Oxford: Wiley; 2011.
Saghaian, S. and Mohammadi, H. (2018) 'Factors affecting frequency of fast food consumption'.
Journal of Food Distribution Research, 49, 1, pp. 22-29.
Shukla, P. (2009) 'Impact of contextual factors, brand loyalty and brand switching on purchase
decisions'. The Journal of Consumer Marketing, 26(5), pp. 348-357.
Srivastava, R.K. (2015) 'How differing demographic factors impact consumers' loyalty towards
national or international fast food chains'. British Food Journal, 117(4), pp. 1354-1376.
Tepeci, M. (1999) 'Increasing brand loyalty in the hospitality industry'. International Journal of
Contemporary Hospitality Management, 11(5), pp. 223-229.

56
Terblanche-Smit, M., Preez, R.D. and Der Spuy, T.V. (2014) 'Measuring the impact of branded
alcohol advertising and price on brand versus segment consumption. The International Business &
Economics Research Journal (Online), 13(6), pp. 1515-n/a.
Thomas, G. (2013) 'How to do your research project: A guide for students in education and applied
social sciences'. n.p.: Losndon: SAGE: 2013.
Timothy J. R. and Luis, P. (2009) 'Promotion and fast food demand'. American Journal of
Agricultural Economics, 1, p. 168.
Torres, E.N. and Kline, S. (2006) 'From satisfaction to delight: a model for the hotel industry'.
International Journal of Contemporary Hospitality Management, 18(4), pp. 290-301.
Tsai, M., Shih, K. and Chen, J.C.H. (2007), 'A comparison of the service quality of fast food chain
franchises'. International Journal of Services and Standards, Vol. 3 No. 2, pp. 222-38.
Tsao, H., Lin, P., Pitt, L. and Campbell, C. (2009) 'The impact of loyalty and promotion effects on
retention rate'. Journal of The Operational Research Society, 5, p. 646.
Wathne, K., Biong, H. and Heide, J. (2001) 'Choice of supplier in embedded markets: relationship
and marketing program effects'. Journal of Marketing, 65, 2, pp. 54-66.
Wendy, V.R. and Frrwer, L.J. (2008) 'Consumer perceptions of food quality and safety and their
relation to traceability'. British Food Journal, 110(10), pp. 1034-1046.
Wilson, AM., Zeithaml, V.A., Bitner, M.J. and Gremler D.D. (2012) 'Services marketing: Integrating
customer focus across the firm'. n.p: London: McGraw-Hill Higher Education, c2012.
WU, Y. and Shang, S.S.C. (2013) 'Do happier customers generate more profits? An analysis of
customer contribution in a bank'. Asia Pacific Management Review, 18(4).
Yoon, K. and Tran, T.V. (2011) 'revisiting the relationship between consumer loyalty and price
sensitivity: The modersting role of deal-proness'. Journal of Marketing Theory and Practice, 19(3),
pp. 293-306.
Yuwei, J., Lingjing, Z. and Rucker, D. (2014) 'Power and action orientation: Power as a catalyst for
consumer switching behavior'. Journal of Consumer Research, 41, 1, pp. 183-196.
Zeithaml, V., Bitner, M., and Gremler, D. 2009, Services marketing: Integrating Customer Focus
Across The Firm, n.p.: Boston, [Mass.] ; London : McGraw-Hill, 2009.
57
Zhang, K.Z.K., Cheung, C.M.K. and Lee, M.K.O. (2012) 'Online service switching behaviour: the
case of blog service providers'. Journal of electronic commerce research, 13(3), pp. 184-197.
Zhao, L. and Freiheit, T. (2017) 'Estimating good design attributes from generalized drivers to
provide early assistance to design requirements analysis'. Journal of Engineering, Design and
Technology, 15(03), pp. 317-340.
Zolfagharian, M., Hasan, F. and Iyer, P. (2017) 'Employee, branch, and brand switching: the role of
linguistic choice, use and adaptation'. The Journal of Services Marketing, 31(4), pp. 452-470.
https://www.bordbia.ie/industry/events/SpeakerPresentations/2017/IrishFoodserviceDirectory/2017
%20Irish%20Foodservice%20Channel%20Insights.pdf
https://www.irishmirror.ie/news/irish-news/irish-people-spend-over-250-12531159
https://www.irishtimes.com/life-and-style/people/ireland-s-growing-appetite-for-fast-food-
1.1741807
https://www.statista.com/statistics/273057/value-of-the-most-valuable-fast-food-brands-worldwide/

58
APPENDIX
APPENDIX SECTION 1 – SURVEY CONSENT TO PARTICIPATE LETTER
This survey takes approximately 3 minutes to complete and it is being carried out as part of the
fulfilment of the requirement for the completion and award of a Master of Science degree in
marketing and you have been selected to participate in the completion of this survey with a
guarantee that the responses will be used for the intended purpose and the anonymity of the
respondents is 100% guaranteed. Please tick the boxes as reflected by your honest evaluation and
perception of the overall service delivery process of a fast food restaurant.
Thanks in advance for your participation.

59
APPENDIX SECTION 2-SURVEY DEMOGRAPHIC
1. GENDER?
Male [ ]
Female [ ]
2. Age?
18-25 years [ ]
36-45 years [ ]
36-45 years [ ]
46 years and above [ ]
3. Marital status?
Single [ ]
Married [ ]
In a relationship [ ]
Divorced [ ]
4. Highest level of education?
High school [ ]
High school diploma [ ]
Some College/ University [ ]
College/ University degree [ ]
Post graduate school/ degree [ ]
5. Ethnicity?
European [ ]
African [ ]
North or South American [ ]
Asian [ ]
Other [ ]

60
APPENDIX SECTION 3- PERCPETION OF FAST FOOD RESTAURANT SERVICES
Note-All answer choices follow the Likert scale format of Strongly Agree, Agree, Undecided,
Disagree and strongly disagree.
6. The caloric content of the food served can make me switch to a new fast food brand
7. I like to eat in a fast food restaurant that offers tastier menu and would find one irrespective of
the cost of the food.
8. The ingredient used in preparing the food is of great concern to me
9. I may switch to another fast food restaurant if there is inconsistency in the standard of the food
prepared everyday
10. I will switch to a new fast food brand if the firm does not meet its promise to offer high quality
foods and beverages
11. If complaints about food served are not swiftly handled, I would consider switching to a new
brand.
12. I will try out another fast food if the employees do not have adequate knowledge about the
restaurant's menu to answer my questions.
13. I am likely to switch brand if the front-line staff of the restaurant are not friendly and courteous.
14. The staff attitude, the food preparation and ordering technology could make me patronize another
fast food brand
15. If the price of the food does not meet the standard I expect, I wouldn’t eat there again

61
16. I dislike cheap fast foods because it signifies low quality
17. I am a price conscious consumer and constantly seek out low cost fast foods
18. An increase in the price of a restaurant menu can make me switch to an alternative fast food
restaurant
19. Generally, I like patronizing fast foods that offers rewards such as coupons, loyalty card, mega deals and
other freebies and wouldn't mind switching to a fast food offering these benefits.
20. I would switch to a fast food brand offering better discounts on its menus
21. If a restaurant offers prizes to be won on the basis of repeated patronage, I would buy from them.
22. A bundle deal in a fast food restaurant such as "buy any 4 for €2" would attract me to make a purchase
23. I care less about fast food brand name and wouldn’t switch to a fast food with a strong and well-known
brand name.
24. The good reputation of a fast food brand in the global market, can make me become a customer.
25. I consider myself a loyal customer to a fast food brand
26. I rather prefer to eat in a fast food with a well-known and trusted brand name
27. I view myself as a potential switcher to get the best value of my money
28. Brand switching is an avenue for me to dump epileptic services
29. I would still consider switching even if there exist a high switching cost in a fast food restaurant
30. The potential cost-savings of brand switching motivates me to switch fast food brand.