Brand Preference of Packed Milk Comparative Study on Rural ...2)7/Version-2/D0272023035.pdf1.1.Dairy...
13
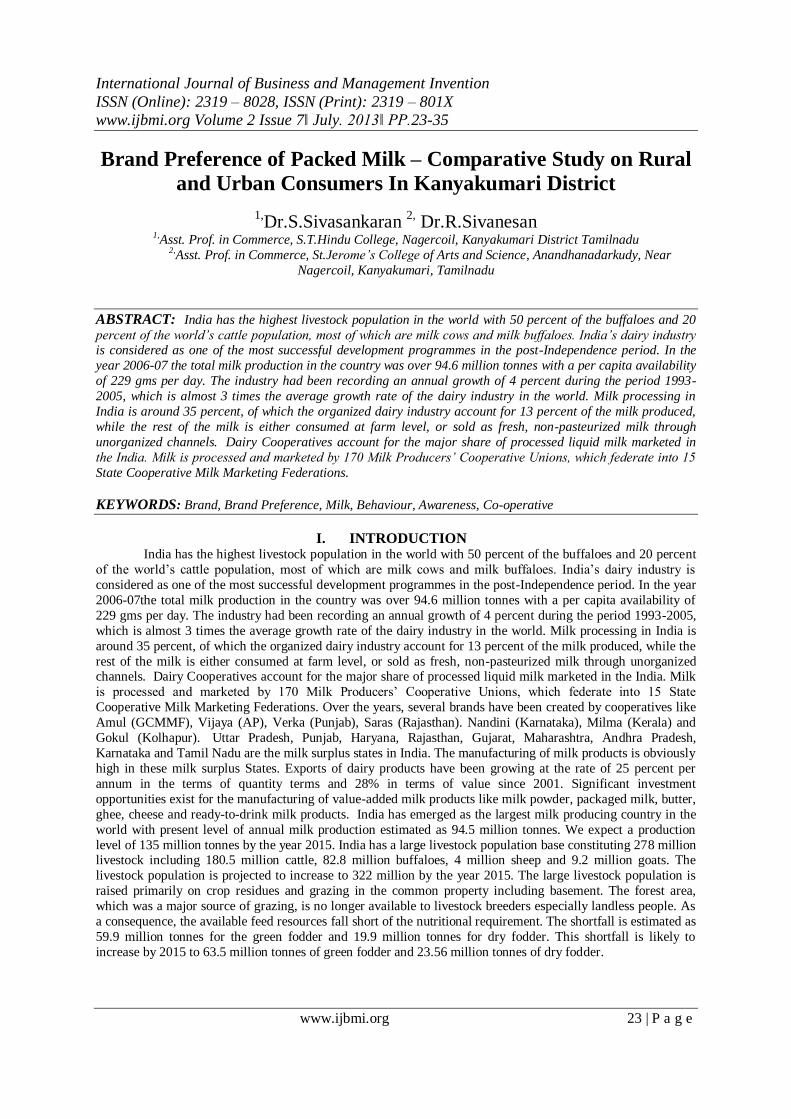
International Journal of Business and Management Invention ISSN (Online): 2319 – 8028, ISSN (Print): 2319 – 801X www.ijbmi.org Volume 2 Issue 7ǁ July. 2013ǁ PP.23-35 www.ijbmi.org 23 | P a g e Brand Preference of Packed Milk – Comparative Study on Rural and Urban Consumers In Kanyakumari District 1, Dr.S.Sivasankaran 2, Dr.R.Sivanesan 1, Asst. Prof. in Commerce, S.T.Hindu College, Nagercoil, Kanyakumari District Tamilnadu 2, Asst. Prof. in Commerce, St.Jerome’s College of Arts and Science, Anandhanadarkudy, Near Nagercoil, Kanyakumari, Tamilnadu ABSTRACT: India has the highest livestock population in the world with 50 percent of the buffaloes and 20 percent of the world’s cattle population, most of which are milk cows and milk buffaloes. India’s dairy industry is considered as one of the most successful development programmes in the post-Independence period. In the year 2006-07 the total milk production in the country was over 94.6 million tonnes with a per capita availability of 229 gms per day. The industry had been recording an annual growth of 4 percent during the period 1993- 2005, which is almost 3 times the average growth rate of the dairy industry in the world. Milk processing in India is around 35 percent, of which the organized dairy industry account for 13 percent of the milk produced, while the rest of the milk is either consumed at farm level, or sold as fresh, non-pasteurized milk through unorganized channels. Dairy Cooperatives account for the major share of processed liquid milk marketed in the India. Milk is processed and marketed by 170 Milk Producers’ Cooperative Unions, which federate into 15 State Cooperative Milk Marketing Federations. KEYWORDS: Brand, Brand Preference, Milk, Behaviour, Awareness, Co-operative I. INTRODUCTION India has the highest livestock population in the world with 50 percent of the buffaloes and 20 percent of the world’s cattle population, most of which are milk cows and milk buffaloes. India’s dairy industry is considered as one of the most successful development programmes in the post-Independence period. In the year 2006-07the total milk production in the country was over 94.6 million tonnes with a per capita availability of 229 gms per day. The industry had been recording an annual growth of 4 percent during the period 1993-2005, which is almost 3 times the average growth rate of the dairy industry in the world. Milk processing in India is around 35 percent, of which the organized dairy industry account for 13 percent of the milk produced, while the rest of the milk is either consumed at farm level, or sold as fresh, non-pasteurized milk through unorganized channels. Dairy Cooperatives account for the major share of processed liquid milk marketed in the India. Milk is processed and marketed by 170 Milk Producers’ Cooperative Unions, which federate into 15 State Cooperative Milk Marketing Federations. Over the years, several brands have been created by cooperatives like Amul (GCMMF), Vijaya (AP), Verka (Punjab), Saras (Rajasthan). Nandini (Karnataka), Milma (Kerala) and Gokul (Kolhapur). Uttar Pradesh, Punjab, Haryana, Rajasthan, Gujarat, Maharashtra, Andhra Pradesh, Karnataka and Tamil Nadu are the milk surplus states in India. The manufacturing of milk products is obviously high in these milk surplus States. Exports of dairy products have been growing at the rate of 25 percent per annum in the terms of quantity terms and 28% in terms of value since 2001. Significant investment opportunities exist for the manufacturing of value-added milk products like milk powder, packaged milk, butter, ghee, cheese and ready-to-drink milk products. India has emerged as the largest milk producing country in the world with present level of annual milk production estimated as 94.5 million tonnes. We expect a production level of 135 million tonnes by the year 2015. India has a large livestock population base constituting 278 million livestock including 180.5 million cattle, 82.8 million buffaloes, 4 million sheep and 9.2 million goats. The livestock population is projected to increase to 322 million by the year 2015. The large livestock population is raised primarily on crop residues and grazing in the common property including basement. The forest area, which was a major source of grazing, is no longer available to livestock breeders especially landless people. As a consequence, the available feed resources fall short of the nutritional requirement. The shortfall is estimated as 59.9 million tonnes for the green fodder and 19.9 million tonnes for dry fodder. This shortfall is likely to increase by 2015 to 63.5 million tonnes of green fodder and 23.56 million tonnes of dry fodder.
Transcript of Brand Preference of Packed Milk Comparative Study on Rural ...2)7/Version-2/D0272023035.pdf1.1.Dairy...
International Journal of Business and Management Invention
ISSN (Online): 2319 – 8028, ISSN (Print): 2319 – 801X
www.ijbmi.org Volume 2 Issue 7ǁ July. 2013ǁ PP.23-35
www.ijbmi.org 23 | P a g e
Brand Preference of Packed Milk – Comparative Study on Rural
and Urban Consumers In Kanyakumari District
1,Dr.S.Sivasankaran
2, Dr.R.Sivanesan
1,Asst. Prof. in Commerce, S.T.Hindu College, Nagercoil, Kanyakumari District Tamilnadu 2,Asst. Prof. in Commerce, St.Jerome’s College of Arts and Science, Anandhanadarkudy, Near
Nagercoil, Kanyakumari, Tamilnadu
ABSTRACT: India has the highest livestock population in the world with 50 percent of the buffaloes and 20
percent of the world’s cattle population, most of which are milk cows and milk buffaloes. India’s dairy industry is considered as one of the most successful development programmes in the post-Independence period. In the
year 2006-07 the total milk production in the country was over 94.6 million tonnes with a per capita availability
of 229 gms per day. The industry had been recording an annual growth of 4 percent during the period 1993-
2005, which is almost 3 times the average growth rate of the dairy industry in the world. Milk processing in
India is around 35 percent, of which the organized dairy industry account for 13 percent of the milk produced,
while the rest of the milk is either consumed at farm level, or sold as fresh, non-pasteurized milk through
unorganized channels. Dairy Cooperatives account for the major share of processed liquid milk marketed in
the India. Milk is processed and marketed by 170 Milk Producers’ Cooperative Unions, which federate into 15
State Cooperative Milk Marketing Federations.
KEYWORDS: Brand, Brand Preference, Milk, Behaviour, Awareness, Co-operative
I. INTRODUCTION India has the highest livestock population in the world with 50 percent of the buffaloes and 20 percent
of the world’s cattle population, most of which are milk cows and milk buffaloes. India’s dairy industry is
considered as one of the most successful development programmes in the post-Independence period. In the year
2006-07the total milk production in the country was over 94.6 million tonnes with a per capita availability of
229 gms per day. The industry had been recording an annual growth of 4 percent during the period 1993-2005,
which is almost 3 times the average growth rate of the dairy industry in the world. Milk processing in India is
around 35 percent, of which the organized dairy industry account for 13 percent of the milk produced, while the
rest of the milk is either consumed at farm level, or sold as fresh, non-pasteurized milk through unorganized channels. Dairy Cooperatives account for the major share of processed liquid milk marketed in the India. Milk
is processed and marketed by 170 Milk Producers’ Cooperative Unions, which federate into 15 State
Cooperative Milk Marketing Federations. Over the years, several brands have been created by cooperatives like
Amul (GCMMF), Vijaya (AP), Verka (Punjab), Saras (Rajasthan). Nandini (Karnataka), Milma (Kerala) and
Gokul (Kolhapur). Uttar Pradesh, Punjab, Haryana, Rajasthan, Gujarat, Maharashtra, Andhra Pradesh,
Karnataka and Tamil Nadu are the milk surplus states in India. The manufacturing of milk products is obviously
high in these milk surplus States. Exports of dairy products have been growing at the rate of 25 percent per
annum in the terms of quantity terms and 28% in terms of value since 2001. Significant investment
opportunities exist for the manufacturing of value-added milk products like milk powder, packaged milk, butter,
ghee, cheese and ready-to-drink milk products. India has emerged as the largest milk producing country in the
world with present level of annual milk production estimated as 94.5 million tonnes. We expect a production
level of 135 million tonnes by the year 2015. India has a large livestock population base constituting 278 million livestock including 180.5 million cattle, 82.8 million buffaloes, 4 million sheep and 9.2 million goats. The
livestock population is projected to increase to 322 million by the year 2015. The large livestock population is
raised primarily on crop residues and grazing in the common property including basement. The forest area,
which was a major source of grazing, is no longer available to livestock breeders especially landless people. As
a consequence, the available feed resources fall short of the nutritional requirement. The shortfall is estimated as
59.9 million tonnes for the green fodder and 19.9 million tonnes for dry fodder. This shortfall is likely to
increase by 2015 to 63.5 million tonnes of green fodder and 23.56 million tonnes of dry fodder.

Brand Preference Of Packed Milk...
www.ijbmi.org 24 | P a g e
1.1.Dairy industry in Tamilnadu
Dairy sector has assumed much significance by generating income not only to the rural but also to the urban and semi-urban population in the state especially to women folk by providing self-employment
opportunity. Milk and milk products provide essential nutrition to all walks of life. It provides livelihood to
millions of small and marginal farmers in the state. Tamilnadu is an agricultural oriented State and majority of
the farmers owns cattle. Dairying provides the main source of income next to agriculture. In a tropical country
like India, agriculture may fail sometimes, due to monsoon failure but dairying never fails and gives them
regular, steady income.
II. STATEMENT OF THE PROBLEM Milk producers in India is characterised by low yielding non-descript cows and buffaloes. Millions of small producers with little or no land holdings, use of crop residues and natural herbage with or without costly
concentrates as cattle feed. The average milk productivity of a cow in India is very low. Increase in animal
productivity is to be achieved through upgrading of breeds and better feeding and grazing practices. While
efforts have been steadily made to increase the milk productivity and the efficiency of the dairy processing
industry. Increase in milk production is expected to be primary through the increase in milk productivity rather
than the number animals. Today, almost all the people are consuming milk and milk products. Brand
preferences of the rural and urban consumers are differ. Some buyers are totally brand loyal, buying only one
brand in a product group. Most of the buyers switch over to other brands. The present study has been taken to
find out the “Brand Preference of Packed Milk among Rural and Urban Consumers”.
III. OBJECTIVES OF THE STUDY The main objectives of the present study is as follows
To study the factors influencing brand preference of milk among rural and urban consumers.
To analyse the problems faced by rural and urban consumers in the usage of different branks of milk.
To find out the reasons for switchover from one brand to other brand of milk.
IV. METHODOLOGY This study based on both primary and secondary data. The data which is collected in a fresh manner
and which is not available is termed as primary data. For the purpose of collecting primary data with regard to
the brand loyalty of milk among rural and urban consumers, the researcher has carefully designed an interview
schedule. The prevailing data is termed as the secondary data. Secondary data were collected from books,
journals, magazines, newspapers and published articles from leading journals.
V. SAMPLE DESIGN Since the objective of the study is to find out the brand loyalty of milk among rural and urban
consumers, the researcher has adopted convenient sampling technique for data collection. The Kanyakumari
District consists of 108 villages ( that is rural areas) and 60 towns (that is urban areas). The researcher has taken 300 samples for the present study, which comprises of 150 respondents from the rural areas and 150
respondents from urban areas. For the present study the researcher select seven popular branded milk in
Kanyakumari District (Aavin, Arokya, Nanjil, Komatha, Chkra, Vijay and Tasteme)
VI. FRAMEWORK OF ANALYSIS The collected data were processed with the help of appropriate statistical tools in order to fulfil the
objectives of the study. The collected data were carefully classified and tabulated. For the present study the
researcher used percentile analysis, Likert Scaling Technique and Garrett Ranking Technique.
VII. ANALYSIS OF THE STUDY This part analyse the brand loyalty of milk among rural and urban consumers in Kanyakumari District
in various aspects.
7.1.Age of the Respondents
The age of the consumer is one of the important demographic characteristics of the consumers which
influence more on their consumption pattern and brand loyalty. The distributions of respondents based on their
age are shown in Table 1.
Brand Preference Of Packed Milk...
www.ijbmi.org 25 | P a g e
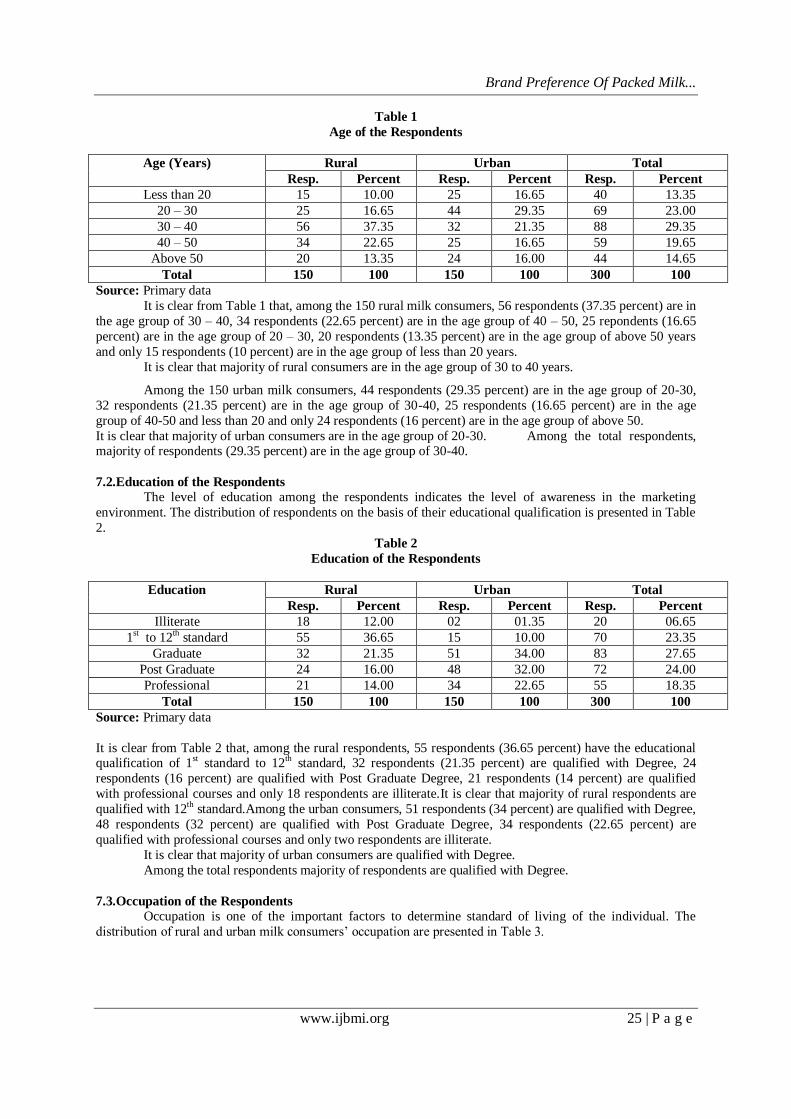
Table 1
Age of the Respondents
Age (Years) Rural Urban Total
Resp. Percent Resp. Percent Resp. Percent
Less than 20 15 10.00 25 16.65 40 13.35
20 – 30 25 16.65 44 29.35 69 23.00
30 – 40 56 37.35 32 21.35 88 29.35
40 – 50 34 22.65 25 16.65 59 19.65
Above 50 20 13.35 24 16.00 44 14.65
Total 150 100 150 100 300 100
Source: Primary data
It is clear from Table 1 that, among the 150 rural milk consumers, 56 respondents (37.35 percent) are in
the age group of 30 – 40, 34 respondents (22.65 percent) are in the age group of 40 – 50, 25 repondents (16.65
percent) are in the age group of 20 – 30, 20 respondents (13.35 percent) are in the age group of above 50 years
and only 15 respondents (10 percent) are in the age group of less than 20 years.
It is clear that majority of rural consumers are in the age group of 30 to 40 years.
Among the 150 urban milk consumers, 44 respondents (29.35 percent) are in the age group of 20-30,
32 respondents (21.35 percent) are in the age group of 30-40, 25 respondents (16.65 percent) are in the age
group of 40-50 and less than 20 and only 24 respondents (16 percent) are in the age group of above 50.
It is clear that majority of urban consumers are in the age group of 20-30. Among the total respondents, majority of respondents (29.35 percent) are in the age group of 30-40.
7.2.Education of the Respondents
The level of education among the respondents indicates the level of awareness in the marketing
environment. The distribution of respondents on the basis of their educational qualification is presented in Table
2.
Table 2
Education of the Respondents
Education Rural Urban Total
Resp. Percent Resp. Percent Resp. Percent
Illiterate 18 12.00 02 01.35 20 06.65
1st to 12th standard 55 36.65 15 10.00 70 23.35
Graduate 32 21.35 51 34.00 83 27.65
Post Graduate 24 16.00 48 32.00 72 24.00
Professional 21 14.00 34 22.65 55 18.35
Total 150 100 150 100 300 100
Source: Primary data
It is clear from Table 2 that, among the rural respondents, 55 respondents (36.65 percent) have the educational qualification of 1st standard to 12th standard, 32 respondents (21.35 percent) are qualified with Degree, 24
respondents (16 percent) are qualified with Post Graduate Degree, 21 respondents (14 percent) are qualified
with professional courses and only 18 respondents are illiterate.It is clear that majority of rural respondents are
qualified with 12th standard.Among the urban consumers, 51 respondents (34 percent) are qualified with Degree,
48 respondents (32 percent) are qualified with Post Graduate Degree, 34 respondents (22.65 percent) are
qualified with professional courses and only two respondents are illiterate.
It is clear that majority of urban consumers are qualified with Degree.
Among the total respondents majority of respondents are qualified with Degree.
7.3.Occupation of the Respondents
Occupation is one of the important factors to determine standard of living of the individual. The
distribution of rural and urban milk consumers’ occupation are presented in Table 3.
Brand Preference Of Packed Milk...
www.ijbmi.org 26 | P a g e
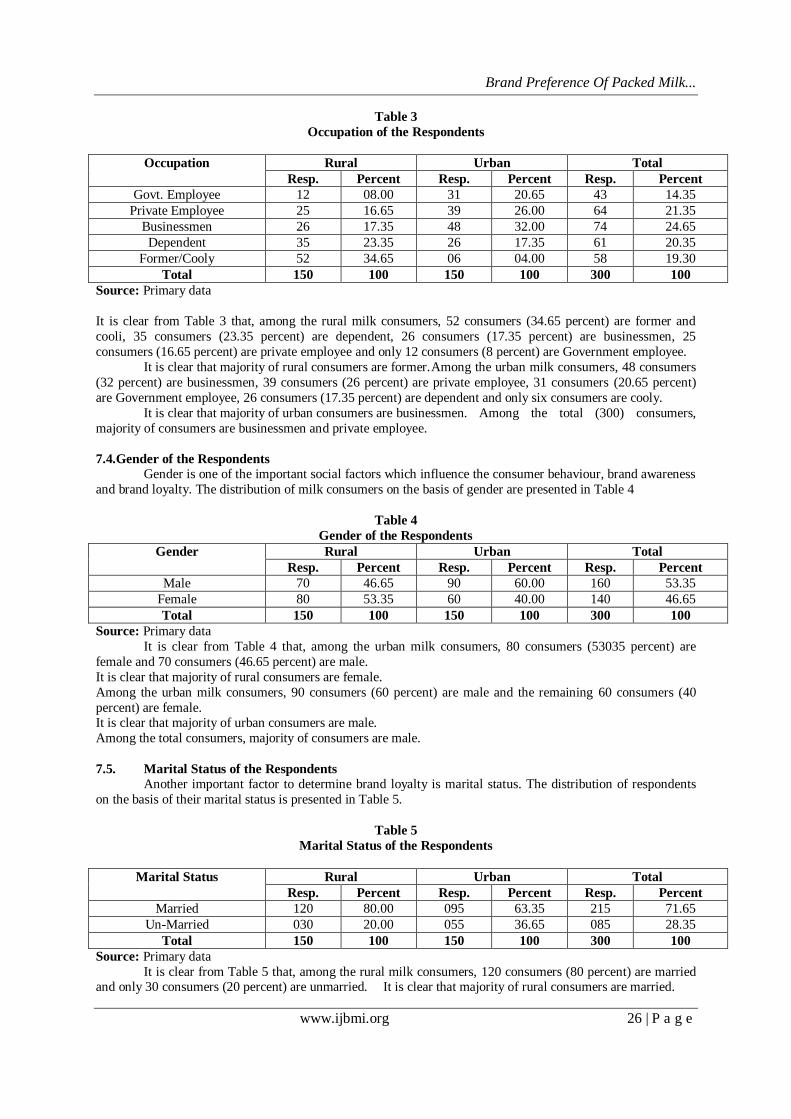
Table 3
Occupation of the Respondents
Occupation Rural Urban Total
Resp. Percent Resp. Percent Resp. Percent
Govt. Employee 12 08.00 31 20.65 43 14.35
Private Employee 25 16.65 39 26.00 64 21.35
Businessmen 26 17.35 48 32.00 74 24.65
Dependent 35 23.35 26 17.35 61 20.35
Former/Cooly 52 34.65 06 04.00 58 19.30
Total 150 100 150 100 300 100
Source: Primary data
It is clear from Table 3 that, among the rural milk consumers, 52 consumers (34.65 percent) are former and
cooli, 35 consumers (23.35 percent) are dependent, 26 consumers (17.35 percent) are businessmen, 25
consumers (16.65 percent) are private employee and only 12 consumers (8 percent) are Government employee.
It is clear that majority of rural consumers are former. Among the urban milk consumers, 48 consumers
(32 percent) are businessmen, 39 consumers (26 percent) are private employee, 31 consumers (20.65 percent)
are Government employee, 26 consumers (17.35 percent) are dependent and only six consumers are cooly.
It is clear that majority of urban consumers are businessmen. Among the total (300) consumers,
majority of consumers are businessmen and private employee.
7.4.Gender of the Respondents
Gender is one of the important social factors which influence the consumer behaviour, brand awareness
and brand loyalty. The distribution of milk consumers on the basis of gender are presented in Table 4
Table 4
Gender of the Respondents
Gender Rural Urban Total
Resp. Percent Resp. Percent Resp. Percent
Male 70 46.65 90 60.00 160 53.35
Female 80 53.35 60 40.00 140 46.65
Total 150 100 150 100 300 100
Source: Primary data
It is clear from Table 4 that, among the urban milk consumers, 80 consumers (53035 percent) are
female and 70 consumers (46.65 percent) are male.
It is clear that majority of rural consumers are female.
Among the urban milk consumers, 90 consumers (60 percent) are male and the remaining 60 consumers (40
percent) are female. It is clear that majority of urban consumers are male.
Among the total consumers, majority of consumers are male.
7.5. Marital Status of the Respondents
Another important factor to determine brand loyalty is marital status. The distribution of respondents
on the basis of their marital status is presented in Table 5.
Table 5
Marital Status of the Respondents
Marital Status Rural Urban Total
Resp. Percent Resp. Percent Resp. Percent
Married 120 80.00 095 63.35 215 71.65
Un-Married 030 20.00 055 36.65 085 28.35
Total 150 100 150 100 300 100
Source: Primary data
It is clear from Table 5 that, among the rural milk consumers, 120 consumers (80 percent) are married and only 30 consumers (20 percent) are unmarried. It is clear that majority of rural consumers are married.

Brand Preference Of Packed Milk...
www.ijbmi.org 27 | P a g e
Among the urban milk consumers, 95 consumers (63.35 percent) are married and 55 consumers (36.65
percent) are unmarried. It is clear that majority of urban consumers are married.
Among the total consumers, majority of milk consumers are married.
7.6.Monthly Income of the Respondents
Monthly income is one of the important factor to determine brand of the products. The distribution of
respondents on the basis of their monthly income is as follows
Table 6
Monthly Income of the Respondents
Income Rural Urban Total
Resp. Percent Resp. Percent Resp. Percent
Below Rs.3000 55 36.65 08 05.35 63 21.00
Rs.3000 to Rs.6000 32 21.35 20 13.35 52 17.35
Rs.6000 to Rs.9000 24 16.00 33 22.00 57 19.00
Rs.9000 to Rs.12000 21 14.00 41 27.30 62 20.65
Above Rs.12000 18 12.00 48 32.00 66 22.00
Total 150 100 150 100 300 100
Source: Primary data
It is clear from Table 6 that, among the rural milk consumers, 55 consumers (36.65 percent) earned below Rs.3000, 32 consumers (21.35 percent) earned Rs.3000 to Rs.6000, 24 consumers (16 percent) earned
Rs.6000 to Rs.9000, 21 consumers (14 percent) earned Rs.9000 to Rs.12000 and only 18 consumers (12
percent) earned above Rs.12000. It is clear that majority of rural consumers earned below Rs.3000.Among
the urban milk consumers, 48 consumers (32 percent) earned above Rs.12000, 41 consumers (27.30 percent)
earned Rs.9000 to Rs.12000, 33 consumers (22 percent) earned RS.6000 to Rs.9000, 20 consumers (13.35
percent) earnted Rs.3000 to Rs.6000 and only eight consumers earned below Rs.3000. It is clear that majority
of urban consumers earned above Rs.12000.
Among the total consumers majority of consumers are earned above Rs.12000.
7.3.Brand Choice of the Respondents
The researcher wants to know if the consumers prefer a branded milk used in theiry daily life and this is presented in Table 7
Table 7
Brand Choice of the Respondents
Brand Name Rural Urban Total
Resp. Percent Resp. Percent Resp. Percent
Aavin 16 10.65 80 53.35 96 32.00
Arokya 35 23.35 30 20.00 65 21.65
Nanjil 62 41.35 20 13.35 82 27.35
Tasteme 07 04.65 05 03.30 12 04.00
Chakra 08 05.35 04 02.65 12 04.00
Komatha 12 08.00 08 05.35 20 06.65
Vijay 10 06.65 03 02.00 13 04.35
Total 150 100 150 100 300 100
Source: Primary data
It is clear from Table 7 describes about the brand of milk currently used by the respondents. Among the
rural consumers, 62 consumers (41.35 percent) are using Nanjil brand, 35 consumers (23.35 percent) are using
Arokya brand, 16 consumers (10.65 percent) using Aavin brand,12 consumers (8 percent) are using Komatha
brand, 10 consumers (6.65 percent) are using Vijay brand, 8 conumers (5.35 percent) using Chakra brand and
only seven consumers are using tastme brand. It is clear that majority of rural consumers are using Nanjil
brand. Among the urban consumers, 80 consumers (53.35 percent) are using Aavin brand, 30 consumers (20
percent) are using Arokya brand, 20 consumers (13.35 percent) are using Nanjil brand, eight consumers (5.35 percent) are using Komatha brand and only four consumers (2.65 percent) are using Chakra brand.
Brand Preference Of Packed Milk...
www.ijbmi.org 28 | P a g e
It is clear that majority of urban consumers are using Aavin brand. Among the total consumers majority of
consumers are using Aavin brand.
7.3.Opinion about Package of different brands of Milk
One of the important factors of brand preference and brand loyalty is attractive package which may
effectively influence consumers in buying the same brand of milk again and again. To understand the opinion
about package of milk among the rural and urban consumers the researcher used the Likert Scaling Technique.
The rural consumers opinion about the package of different brand of milk is presented in the Table 8
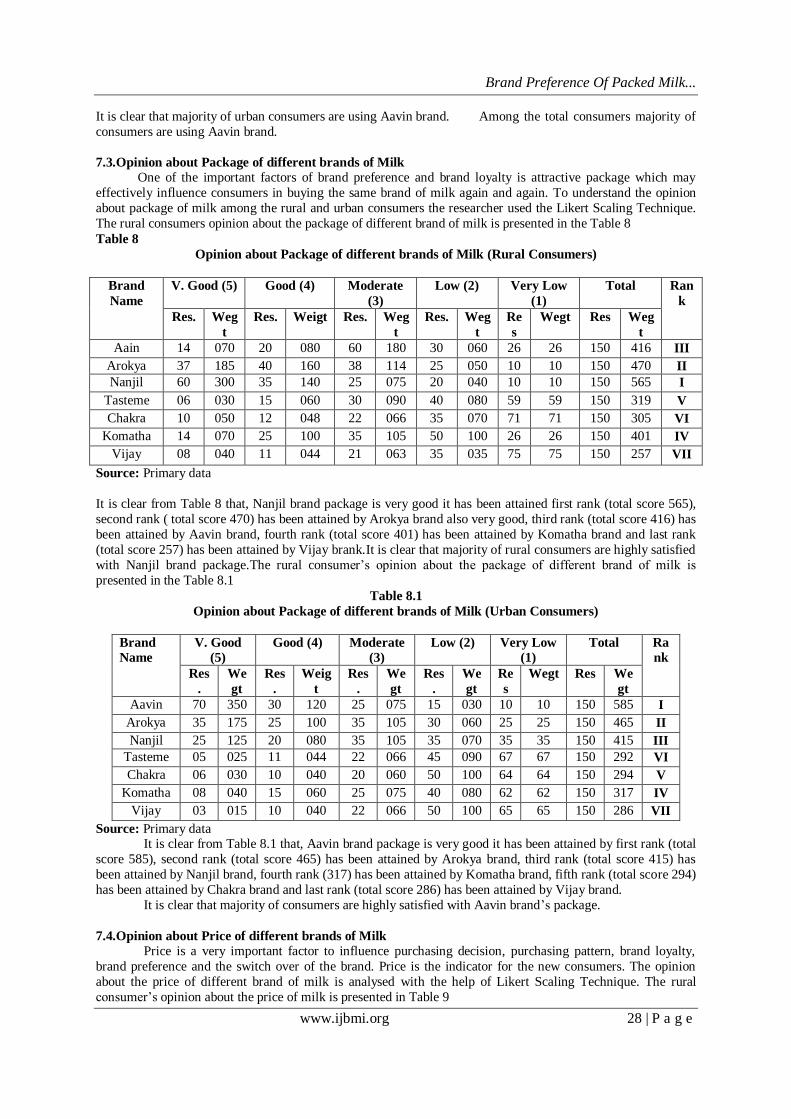
Table 8
Opinion about Package of different brands of Milk (Rural Consumers)
Brand
Name
V. Good (5) Good (4) Moderate
(3)
Low (2) Very Low
(1)
Total Ran
k
Res. Weg
t
Res. Weigt Res. Weg
t
Res. Weg
t
Re
s
Wegt Res Weg
t
Aain 14 070 20 080 60 180 30 060 26 26 150 416 III
Arokya 37 185 40 160 38 114 25 050 10 10 150 470 II
Nanjil 60 300 35 140 25 075 20 040 10 10 150 565 I
Tasteme 06 030 15 060 30 090 40 080 59 59 150 319 V
Chakra 10 050 12 048 22 066 35 070 71 71 150 305 VI
Komatha 14 070 25 100 35 105 50 100 26 26 150 401 IV
Vijay 08 040 11 044 21 063 35 035 75 75 150 257 VII
Source: Primary data
It is clear from Table 8 that, Nanjil brand package is very good it has been attained first rank (total score 565),
second rank ( total score 470) has been attained by Arokya brand also very good, third rank (total score 416) has
been attained by Aavin brand, fourth rank (total score 401) has been attained by Komatha brand and last rank
(total score 257) has been attained by Vijay brank.It is clear that majority of rural consumers are highly satisfied
with Nanjil brand package.The rural consumer’s opinion about the package of different brand of milk is
presented in the Table 8.1
Table 8.1
Opinion about Package of different brands of Milk (Urban Consumers)
Brand
Name
V. Good
(5)
Good (4) Moderate
(3)
Low (2) Very Low
(1)
Total Ra
nk
Res
.
We
gt
Res
.
Weig
t
Res
.
We
gt
Res
.
We
gt
Re
s
Wegt Res We
gt
Aavin 70 350 30 120 25 075 15 030 10 10 150 585 I
Arokya 35 175 25 100 35 105 30 060 25 25 150 465 II
Nanjil 25 125 20 080 35 105 35 070 35 35 150 415 III
Tasteme 05 025 11 044 22 066 45 090 67 67 150 292 VI
Chakra 06 030 10 040 20 060 50 100 64 64 150 294 V
Komatha 08 040 15 060 25 075 40 080 62 62 150 317 IV
Vijay 03 015 10 040 22 066 50 100 65 65 150 286 VII
Source: Primary data It is clear from Table 8.1 that, Aavin brand package is very good it has been attained by first rank (total
score 585), second rank (total score 465) has been attained by Arokya brand, third rank (total score 415) has
been attained by Nanjil brand, fourth rank (317) has been attained by Komatha brand, fifth rank (total score 294)
has been attained by Chakra brand and last rank (total score 286) has been attained by Vijay brand.
It is clear that majority of consumers are highly satisfied with Aavin brand’s package.
7.4.Opinion about Price of different brands of Milk Price is a very important factor to influence purchasing decision, purchasing pattern, brand loyalty,
brand preference and the switch over of the brand. Price is the indicator for the new consumers. The opinion
about the price of different brand of milk is analysed with the help of Likert Scaling Technique. The rural
consumer’s opinion about the price of milk is presented in Table 9

Brand Preference Of Packed Milk...
www.ijbmi.org 29 | P a g e
Table 9
Opinion about Price of different brands of Milk (Rural Consumers)
Brand
Name
Very High
(5)
High (4) Moderate
(3)
Low (2) Very Low
(1)
Total Ran
k
Res. We
gt
Res. Weig
t
Res. We
gt
Res. We
gt
Res We
gt
Res We
gt
Aavin 15 075 20 080 40 120 40 80 35 35 150 390 III
Arokya 40 200 15 060 20 060 35 70 40 40 150 430 I
Nanjil 10 050 15 060 30 090 40 80 55 55 150 335 VII
Tasteme 15 075 25 100 30 090 40 80 40 40 150 385 IV
Chakra 18 090 20 080 30 090 42 84 40 40 150 384 V
Komatha 20 100 20 080 20 060 40 80 50 50 150 370 VI
Vijay 22 110 18 072 42 126 38 76 30 30 150 414 II
Source: Primary data
It is clear from Table 9 that, first rank (total score 430) has been attained by Arokya brand so the rural
consumers feel that price is very high, second rank (total score 414) has been attained by Vijay brand, third rank
(total score 390) has been attained by Aavin brand, fourth rank (total rank 385) has been attained by Tastme
brand, fifth rank (total score 384) has been attained by Chakra brand and last rank (total score 335) has been
attained by Nanjil brand so majority of rural consumers feels that Nanjil brand price is very low.It is clear that
Arokya brand price is very high.. The urban consumer’s opinion about the price of milk is presented in Table
9.1
Table 9.1
Opinion about Price of different brands of Milk (Urban Consumers)
Brand
Name
Very High
(5)
High (4) Moderate
(3)
Low (2) Very
Low (1)
Total Ra
nk
Res
.
We
gt
Res
.
Weig
t
Res
.
We
gt
Res
.
We
gt
R
es
We
gt
Res We
gt
Aavin 08 040 15 060 55 165 40 080 32 32 150 377 VII
Arokya 25 125 30 120 45 135 30 060 20 20 150 460 I
Nanjil 12 060 18 072 50 150 38 076 32 32 150 390 VI
Tasteme 18 090 22 088 40 120 40 080 30 30 150 408 IV
Chakra 19 095 24 096 42 126 38 076 33 33 150 426 III
Komatha 16 080 20 080 40 120 50 100 24 24 150 404 V
Vijay 20 100 22 088 44 132 46 092 18 18 150 430 II
Source: Primary data
It is clear from Table 9.1 that, first rank (total score 460) has been attained by Arokya brand, so the urban
consumers feels that price is very high, second rank (total score 430) has been attained by Vijay brand, third
rank (total score 426) has been attained by Chakra brand, fourth rank (total score 408) has been attained by Tastme brand, fifth rank (total score 404) has been attained by Komatha brand, sixth rank (total score 390) has
been attained by Nanjil brand and last rank (total score 377) has been attained by Aavin brand, so the majority
of urban consumers feels that price is very low.It is clear that Arokya brand price is very high.
7.5.Opinion about Taste of different brands of Milk
Another important factor to brand preference and brand loyalty is the taste of milk. Good taste indicates
more sales and more brand preference. To know the taste of various brand of milk the researcher used five point
scaling technique. The rural consumers’ opinion about taste of different brand of milk is presented in the Table
10
Brand Preference Of Packed Milk...
www.ijbmi.org 30 | P a g e
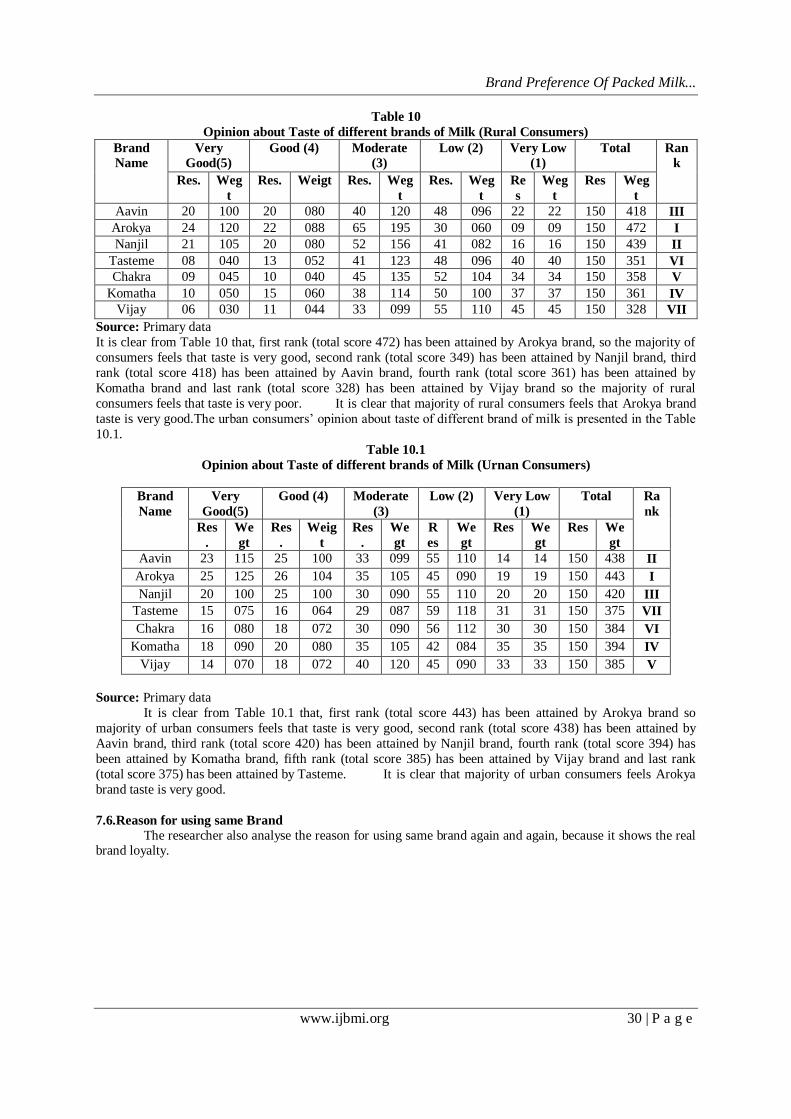
Table 10
Opinion about Taste of different brands of Milk (Rural Consumers)
Brand
Name
Very
Good(5)
Good (4) Moderate
(3)
Low (2) Very Low
(1)
Total Ran
k
Res. Weg
t
Res. Weigt Res. Weg
t
Res. Weg
t
Re
s
Weg
t
Res Weg
t
Aavin 20 100 20 080 40 120 48 096 22 22 150 418 III
Arokya 24 120 22 088 65 195 30 060 09 09 150 472 I
Nanjil 21 105 20 080 52 156 41 082 16 16 150 439 II
Tasteme 08 040 13 052 41 123 48 096 40 40 150 351 VI
Chakra 09 045 10 040 45 135 52 104 34 34 150 358 V
Komatha 10 050 15 060 38 114 50 100 37 37 150 361 IV
Vijay 06 030 11 044 33 099 55 110 45 45 150 328 VII
Source: Primary data
It is clear from Table 10 that, first rank (total score 472) has been attained by Arokya brand, so the majority of
consumers feels that taste is very good, second rank (total score 349) has been attained by Nanjil brand, third
rank (total score 418) has been attained by Aavin brand, fourth rank (total score 361) has been attained by
Komatha brand and last rank (total score 328) has been attained by Vijay brand so the majority of rural
consumers feels that taste is very poor. It is clear that majority of rural consumers feels that Arokya brand
taste is very good.The urban consumers’ opinion about taste of different brand of milk is presented in the Table
10.1.
Table 10.1
Opinion about Taste of different brands of Milk (Urnan Consumers)
Brand
Name
Very
Good(5)
Good (4) Moderate
(3)
Low (2) Very Low
(1)
Total Ra
nk
Res
.
We
gt
Res
.
Weig
t
Res
.
We
gt
R
es
We
gt
Res We
gt
Res We
gt
Aavin 23 115 25 100 33 099 55 110 14 14 150 438 II
Arokya 25 125 26 104 35 105 45 090 19 19 150 443 I
Nanjil 20 100 25 100 30 090 55 110 20 20 150 420 III
Tasteme 15 075 16 064 29 087 59 118 31 31 150 375 VII
Chakra 16 080 18 072 30 090 56 112 30 30 150 384 VI
Komatha 18 090 20 080 35 105 42 084 35 35 150 394 IV
Vijay 14 070 18 072 40 120 45 090 33 33 150 385 V
Source: Primary data
It is clear from Table 10.1 that, first rank (total score 443) has been attained by Arokya brand so
majority of urban consumers feels that taste is very good, second rank (total score 438) has been attained by
Aavin brand, third rank (total score 420) has been attained by Nanjil brand, fourth rank (total score 394) has
been attained by Komatha brand, fifth rank (total score 385) has been attained by Vijay brand and last rank
(total score 375) has been attained by Tasteme. It is clear that majority of urban consumers feels Arokya
brand taste is very good.
7.6.Reason for using same Brand
The researcher also analyse the reason for using same brand again and again, because it shows the real brand loyalty.

Brand Preference Of Packed Milk...
www.ijbmi.org 31 | P a g e
Table 11
Reason for using same Brand
Reason Rural Urban Total
Resp. Percent Resp. Percent Resp. Percent
Liked by all family members 20 13.35 25 16.65 45 15.00
Ideal price 48 32.00 30 20.00 78 26.00
High quality 35 23.35 35 23.35 70 23.35
Easy Availability 40 26.65 50 33.35 90 30.00
Good Package 07 04.65 10 06.65 17 05.65
Total 150 100 150 100 300 100
Source: Primary data
It is clear from Table 11 that, among the rural respondents, 48 consumers (32 percent) are using the
same brand for the reason of ideal price, 40 consumers (26.65 percent) are using the same brand for the reason
of easy availability, 35 consumers (23.35 percent) are using high quality, 20 consumers (13.35 percent) are
using the same brand for the reason of liked by all family members and only seven consumers (4.65 percent) are
using same brand for the reason of good package.It is clear that majority of rural respondents are using the same
brand for the reason of ideal price. Among the urban respondents, 50 consumers (33.35 percent) are using the
same brand reason for easy availability, 35 consumers (23.35 percent) are using the same brand reason of high
quality, 30 consumers (20 percent) are using the same brand reason of ideal price and only 10 consumers (6.65
percent) are using same brand reason of good package.It is clear that majority of urban consumers are using the
same brand reason of easy availability. Among the total respondents, majority of consumers are using the same brand reason of easy availability.
7.7.Opinion about purchase of same brand in future
Purchasers may buy the same brand in the future, due to its good performance and satisfaction.
Sometimes it may be a contrary one due to the poor performance or the entry of a new producer into the market.
The opinion about purchase of same brand in future is presented in Table 12
Table 12
Opinion about purchase of same brand in future
Brand
Name
Rural Urban Total
Yes No Yes No Yes No
No. Perc. No. Perc. No. Perc. No. Perc. No. Perc. No. Perc.
Aavin 16 13.35 00 00.00 75 69.50 05 11.90 91 39.90 05 06.95
Arokya 30 25.00 05 16.65 10 09.25 20 47.60 40 17.50 25 34.75
Nanjil 62 51.65 00 00.00 16 14.80 04 09.50 78 34.25 04 05.55
Tastme 00 00.00 07 23.35 00 00.00 05 11.90 00 00.00 12 16.65
Chakra 02 01.65 06 20.00 00 00.00 04 09.50 02 00.90 10 13.85
Komatha 10 08.35 02 06.65 07 06.45 01 02.45 17 07.45 03 04.15
Vijay 00 00.00 10 33.35 00 00.00 03 07.15 00 00.00 13 18.10
Total 120 100 30 100 108 100 42 100 228 100 72 100
Source: Primary data It is clear from Table 12 that, out of 150 rural consumers, 120 consumers opined that they would
purchase the same brand in future and the remaining 30 consumers would not purchase the same brand in future.
Out of 150 urban consumers, 108 consumers’ opined that they would purchase the same brand in future
and the remaining 42 consumers would not purchase the same brand in future.
Among the total consumers majority of consumers would purchase the same brand in future.
7.8.Difficulties faced by the consumers at the time of using Milk
The researcher also analyse the problems faced by the consumers at the time of using of milk. For this
purpose the researcher used Garrett Ranking Technique. The problem faced by the rural consumers at the time
of using milk is presented in the Table 13.
Brand Preference Of Packed Milk...
www.ijbmi.org 32 | P a g e
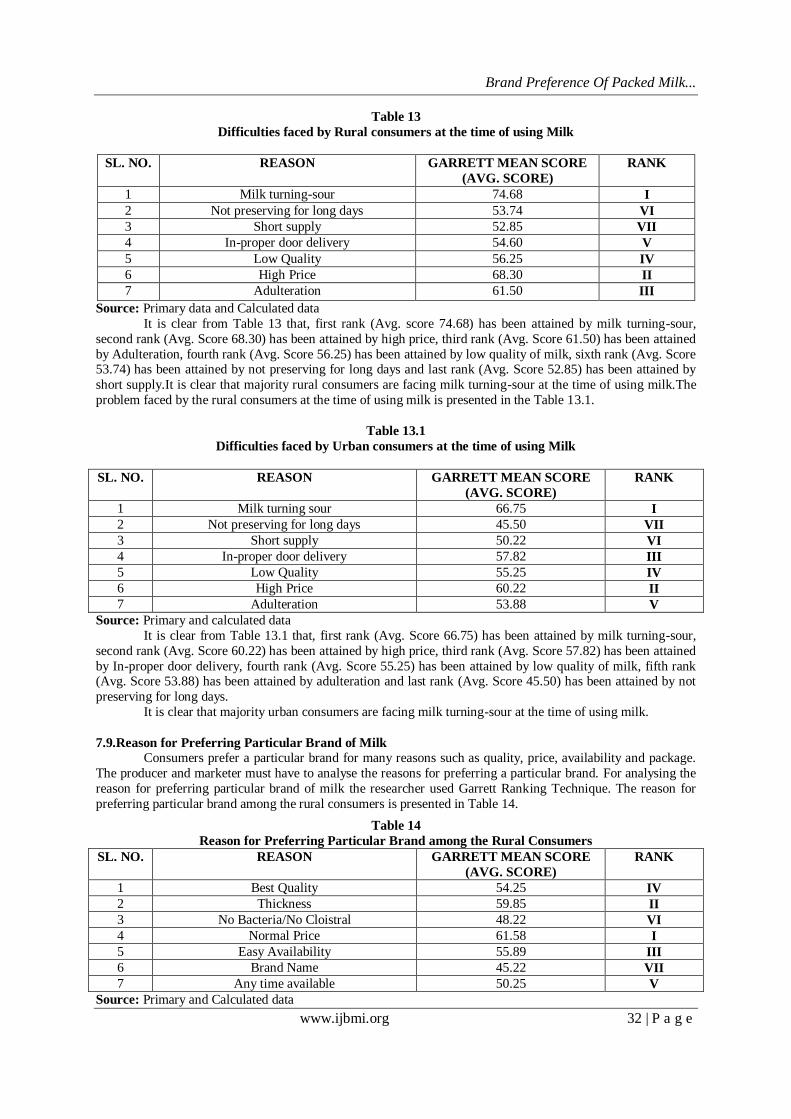
Table 13
Difficulties faced by Rural consumers at the time of using Milk
SL. NO. REASON GARRETT MEAN SCORE
(AVG. SCORE)
RANK
1 Milk turning-sour 74.68 I
2 Not preserving for long days 53.74 VI
3 Short supply 52.85 VII
4 In-proper door delivery 54.60 V
5 Low Quality 56.25 IV
6 High Price 68.30 II
7 Adulteration 61.50 III
Source: Primary data and Calculated data
It is clear from Table 13 that, first rank (Avg. score 74.68) has been attained by milk turning-sour,
second rank (Avg. Score 68.30) has been attained by high price, third rank (Avg. Score 61.50) has been attained
by Adulteration, fourth rank (Avg. Score 56.25) has been attained by low quality of milk, sixth rank (Avg. Score 53.74) has been attained by not preserving for long days and last rank (Avg. Score 52.85) has been attained by
short supply.It is clear that majority rural consumers are facing milk turning-sour at the time of using milk.The
problem faced by the rural consumers at the time of using milk is presented in the Table 13.1.
Table 13.1
Difficulties faced by Urban consumers at the time of using Milk
SL. NO. REASON GARRETT MEAN SCORE
(AVG. SCORE)
RANK
1 Milk turning sour 66.75 I
2 Not preserving for long days 45.50 VII
3 Short supply 50.22 VI
4 In-proper door delivery 57.82 III
5 Low Quality 55.25 IV
6 High Price 60.22 II
7 Adulteration 53.88 V
Source: Primary and calculated data
It is clear from Table 13.1 that, first rank (Avg. Score 66.75) has been attained by milk turning-sour,
second rank (Avg. Score 60.22) has been attained by high price, third rank (Avg. Score 57.82) has been attained
by In-proper door delivery, fourth rank (Avg. Score 55.25) has been attained by low quality of milk, fifth rank (Avg. Score 53.88) has been attained by adulteration and last rank (Avg. Score 45.50) has been attained by not
preserving for long days.
It is clear that majority urban consumers are facing milk turning-sour at the time of using milk.
7.9.Reason for Preferring Particular Brand of Milk
Consumers prefer a particular brand for many reasons such as quality, price, availability and package.
The producer and marketer must have to analyse the reasons for preferring a particular brand. For analysing the
reason for preferring particular brand of milk the researcher used Garrett Ranking Technique. The reason for
preferring particular brand among the rural consumers is presented in Table 14.
Table 14
Reason for Preferring Particular Brand among the Rural Consumers
SL. NO. REASON GARRETT MEAN SCORE
(AVG. SCORE)
RANK
1 Best Quality 54.25 IV
2 Thickness 59.85 II
3 No Bacteria/No Cloistral 48.22 VI
4 Normal Price 61.58 I
5 Easy Availability 55.89 III
6 Brand Name 45.22 VII
7 Any time available 50.25 V
Source: Primary and Calculated data
Brand Preference Of Packed Milk...
www.ijbmi.org 33 | P a g e
It is clear from Table 14 that, first rank (Avg. Score 61.58) has been attained by normal price of milk,
second rank (Avg. Score 59.85) has been attained by thickness of milk, third rank (Avg. Score 55.89) has been attained by easy availability of milk, fourth rank (Avg. Score 54.25) has been attained by best quality of milk
and last rank (Avg. Score 45.22) has been attained by brand name. It is clear that majority of rural
consumers prefer the particular brand reason for normal price.The reason for preferring particular brand among
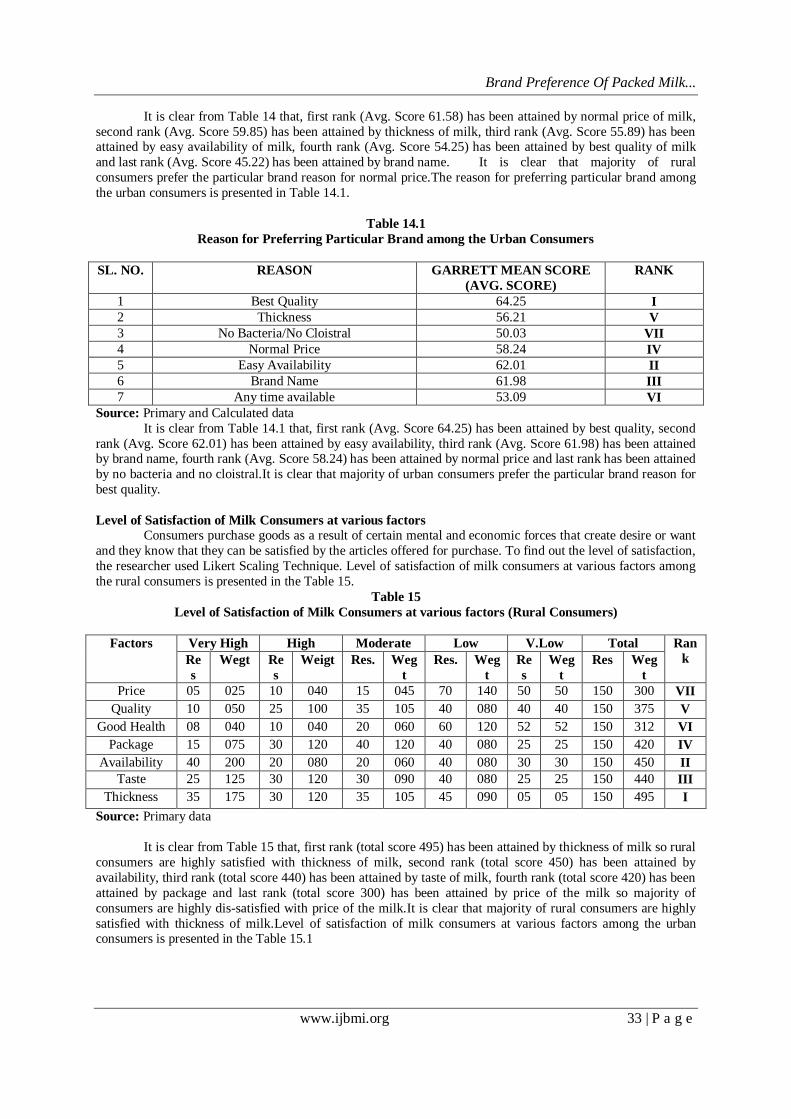
the urban consumers is presented in Table 14.1.
Table 14.1
Reason for Preferring Particular Brand among the Urban Consumers
SL. NO. REASON GARRETT MEAN SCORE
(AVG. SCORE)
RANK
1 Best Quality 64.25 I
2 Thickness 56.21 V
3 No Bacteria/No Cloistral 50.03 VII
4 Normal Price 58.24 IV
5 Easy Availability 62.01 II
6 Brand Name 61.98 III
7 Any time available 53.09 VI
Source: Primary and Calculated data
It is clear from Table 14.1 that, first rank (Avg. Score 64.25) has been attained by best quality, second
rank (Avg. Score 62.01) has been attained by easy availability, third rank (Avg. Score 61.98) has been attained by brand name, fourth rank (Avg. Score 58.24) has been attained by normal price and last rank has been attained
by no bacteria and no cloistral.It is clear that majority of urban consumers prefer the particular brand reason for
best quality.
Level of Satisfaction of Milk Consumers at various factors Consumers purchase goods as a result of certain mental and economic forces that create desire or want
and they know that they can be satisfied by the articles offered for purchase. To find out the level of satisfaction,
the researcher used Likert Scaling Technique. Level of satisfaction of milk consumers at various factors among
the rural consumers is presented in the Table 15.
Table 15
Level of Satisfaction of Milk Consumers at various factors (Rural Consumers)
Factors Very High High Moderate Low V.Low Total Ran
k Re
s
Wegt Re
s
Weigt Res. Weg
t
Res. Weg
t
Re
s
Weg
t
Res Weg
t
Price 05 025 10 040 15 045 70 140 50 50 150 300 VII
Quality 10 050 25 100 35 105 40 080 40 40 150 375 V
Good Health 08 040 10 040 20 060 60 120 52 52 150 312 VI
Package 15 075 30 120 40 120 40 080 25 25 150 420 IV
Availability 40 200 20 080 20 060 40 080 30 30 150 450 II
Taste 25 125 30 120 30 090 40 080 25 25 150 440 III
Thickness 35 175 30 120 35 105 45 090 05 05 150 495 I
Source: Primary data
It is clear from Table 15 that, first rank (total score 495) has been attained by thickness of milk so rural
consumers are highly satisfied with thickness of milk, second rank (total score 450) has been attained by
availability, third rank (total score 440) has been attained by taste of milk, fourth rank (total score 420) has been
attained by package and last rank (total score 300) has been attained by price of the milk so majority of
consumers are highly dis-satisfied with price of the milk.It is clear that majority of rural consumers are highly
satisfied with thickness of milk.Level of satisfaction of milk consumers at various factors among the urban consumers is presented in the Table 15.1

Brand Preference Of Packed Milk...
www.ijbmi.org 34 | P a g e
Table 15.1
Level of Satisfaction of Milk Consumers at various factors (Urban Consumers)
Factors Very High High Moderate Low V.Low Total Ran
k Re
s
Wegt Re
s
Weigt Res. Weg
t
Res. Weg
t
Re
s
Weg
t
Res Weg
t
Price 32 160 28 112 30 090 40 080 20 20 150 462 IV
Quality 40 200 30 120 25 075 30 060 25 25 150 480 II
Good Health 30 150 20 080 20 060 50 100 30 30 150 420 VI
Package 18 090 22 088 26 078 34 068 50 50 150 374 VII
Availability 45 225 35 140 30 090 20 040 20 20 150 515 I
Taste 32 160 28 112 30 090 30 060 30 30 150 452 V
Thickness 35 175 30 120 30 090 25 050 30 30 150 465 III
Source: Primary data It is clear from Table 15.1 that, first rank (total score 515) has been attained by availability of milk,
second rank (total score 480) has been attained by quality of milk, third rank (total score 465) has been attained
by thickness of milk, fourth rank (total score 462) has been attained by price of milk and last rank (total score
374) has been attained by package of milk. It is clear that majority of urban consumers are highly satisfied
with availability of milk.
VIII. SUMMARY OF FINDINGS From this study the researcher records the following important findings.The study reveals that majority
of rural consumers are in the age group of 30 to 40 years and majority of urban consumers are in the age group
of 20-30. The study reveals that majority of rural respondents are qualified with 12th standard and majority of urban consumers are qualified with Degree. The study shows that majority of rural consumers are former and
majority of urban consumers are businessmen. The researcher found that majority of rural and urban consumers
are male and married. The study describes that majority of rural consumers earned below Rs.3000 and majority
of urban consumers earned above Rs.12000. The study shows that majority of rural consumers are using Nanjil
brand and majority of urban consumers are using Aavin brand. Majority of rural consumers are highly satisfied
with Nanjil brand package and majority of urban consumers are highly satisfied with Aavin brand package.
Majority of rural and urban consumers feels that Arokya brand price is very high. Majority of rural and urban
consumers feels that Arokya brand taste is very good. Majority of rural respondents are using the same brand for
the reason of ideal price and majority of urban respondents are using the same brand for the reason of easy
availability. Majority of consumers would purchase the same brand in future. Majority of the rural and urban
consumers are facing milk turning-sour at the time of using milk. Majority of rural consumers prefer the
particular brand reason for normal price and majority of urban consumers prefer the particular brand reason for best quality of milk. Majority of rural consumers are highly satisfied with thickness of milk and majority of
urban consumers are highly satisfied with easy availability of milk.
IX. SUMMARY OF SUGGESTIONS The present study reveals about the brand preference of packed milk among the rural and urban
consumers in kanyakumari District. The researcher grasped up various factors and summed up them. Relevant suggestions to solve the problems of rural and urban consumers are given below: Majority of rural and urban
buyers felt that some branded milk supply was poor in quality. The researcher suggests that the quality of milk
may be improved and modified according to the taste of the consumers. Some respondents opined that buyers
have not identified their brand milk because of the package colour, size and designs as it imitates or resembles
that of other branded milk. The researcher suggest to the manufacturers should concentrate on the package
design and models so as to differentiate from the other brands of milk. Majority of respondents opined that the
branded milk price is too high. The researcher suggests that the companies which produce branded milk should
maintain reasonable price for their brand, it will certainly induce the new customer who belongs to the middle
and the lower classes. Majority of respondents felt that the popular brands are not available in their residential
area. The researcher suggests that the manufacturers can take good measures to distribute their brand in all
places of kanyakumari District (particularly Aavin take necessary steps to distribute their brand to rural areas).
Many respondents felts that many branded milk are not given sufficient advertisement. The results of the study show that the markerters of the branded milk must be efficient and plan their advertising as a strategy to make
and impact on the minds of potential buyers. “Television advertisement” is effective. The researcher observes
that the consumption pattern of milk is completely differ in rural and urban areas and the growth of urbanization
may change the consumption pattern of milk even among the rural consumers.
Brand Preference Of Packed Milk...
www.ijbmi.org 35 | P a g e
The producers have to accept the changing scenario and formulate their marketing strategies to sell
their products. Marketing strategies may be focused on two aspects, namely, physical and promotional aspects. The importance of the twoe aspects is completely different in the rural and urban market. So, it is the right time
to discriminate between the marketing strategies to position the product in two different markets.
X. CONCLUSION The study “Brand Preference of Milk in rural and urban consumer” determines how far the consumers
are satisfied with the overall performance of the branded milk producers. Now the dairy industry is facing tremendous competition and many private companies enter into this field. In order to sustain in the market by
giving better service, a company should always try to find out the satisfaction level of the consumers and should
take all necessary steps and measures to retain the customers
REFERENCES: [1] Acharaya B.K “Marketing and Sales Management”, (1985) Himalaya Publishing House, Mumbai.
[2] Arun Kumar, Meenaksh N”Marketing Management”,(2006) Vikas Publishing house, New Dehi.
[3] David L Louden and Albert J. “Consumer Behaviour concepts and applications” Mc.Graw-Hill Book Company, Singapore.
[4] Milk Procurements and technical inputs manual, National Dairy Development board Anands.
[5] Loison T.M. “Elements of Dairying”
[6] Rajagopal, “Rural Marketing”, Discovery publishing House, New Delhi.
[7] Kubendran V., Vanniarajan T. “Comparative Analysis of Rural and urban consumers on milk consumption” Indian Journal of
Marketing, Dec.,2005.
[8] Jayanthi J “Dairy as an Instrument of women Empowerment” Southern Economist, Vol.45, Aug.15, 2006.
[9] Prashant Mishra and Upinder Dhar, “Factor influencing Brand loyalty: A comparative study of rural and urban consumer”,
Indian Journal of Marketing, Nov,2004
[10] Vinayak Raddy A, “Indian Dairy Scenario: An Analysi” Southern economist, Vol45, Nov.15,2006.
[11] Business today, “Indian understand the importance of Brands”Feb27-2005.
[12] Business world, “Bringing FMG back to growth” July11, 2005.
[13] Business world, “Brand (Manager proofing)”, July 4, 2005.
[14] www.dairyindustry.co.in
[15] www.dairyindustry.org.on
[16] www.milkproducts.in
[17] www.milkproduction.org.in