Brand Mapping Techniques BDMS Prof. S Ramesh Kumar … · "Brand value" proxy for quality, value...
30
Post-Graduate Programme In Software Enterprise Management 2007 Brand Mapping Techniques BDMS Prof. S Ramesh Kumar Pradipto Kolay - 2006044 Aditya Trivedi – 2007002 Himanshu Sahani - 2007023 Rajesh Goli - 2007044
Transcript of Brand Mapping Techniques BDMS Prof. S Ramesh Kumar … · "Brand value" proxy for quality, value...
Post-Graduate Programme
In
Software Enterprise Management
2007
Brand Mapping Techniques
BDMS
Prof. S Ramesh Kumar
Pradipto Kolay - 2006044
Aditya Trivedi – 2007002
Himanshu Sahani - 2007023
Rajesh Goli - 2007044
Overview of project _______________________________________________________ 3
Objective __________________________________________________________________ 3
Category___________________________________________________________________ 3
Overall Category Info _______________________________________________________________ 3
Choice of Category________________________________________________________ 5
Brands & Brand Strategies ____________________________________________________ 5
Sony ____________________________________________________________________________ 5 Samsung _________________________________________________________________________ 5 LG ______________________________________________________________________________ 5
Brand Concept Map_______________________________________________________ 6
Overview __________________________________________________________________ 6
Study methodology __________________________________________________________ 6
Elicitation Stage_____________________________________________________________ 6
Laddering ________________________________________________________________________ 6 Constructs_______________________________________________________________________ 10
Mapping Stage_____________________________________________________________ 12
Aggregation Stage __________________________________________________________ 12
Step 1:__________________________________________________________________________ 13 Step 2:__________________________________________________________________________ 15 Step 3:__________________________________________________________________________ 18 Step 4:__________________________________________________________________________ 20 Step 5:__________________________________________________________________________ 20
Consensus Maps ___________________________________________________________ 21
Sony ___________________________________________________________________________ 21 Samsung ________________________________________________________________________ 22
Analysis________________________________________________________________ 22
Target Segment ____________________________________________________________ 22
Profile of the respondents interviewed: _______________________________________________ 23 Psychographics: __________________________________________________________________ 23
BCM Results and analysis ____________________________________________________ 24
Brand Associations: Positioning decision ______________________________________________ 26
ZMET ____________________________________________________________________ 27
Overview________________________________________________________________________ 27 Potential insights from ZMET _______________________________________________________ 28 Potential usage of ZMET for brand equity _____________________________________________ 28
Strategy for Building Brand Equity _____________________________________________ 28
Recommendation _______________________________________________________ 30
Overview of project
Objective
• The objective of this exercise is to prepare and study the consensus maps of two
brands – one leader, one follower in a category of choice we have taken LCD TV’s
as subject of study leader brand Sony, Follower Brand Samsung
• To recommend to the follower brand strategies based on the study.
Category
We have chosen LCD TV as our category for this project.
Overall Category Info
In India, traditional CRT TV accounted for ~93% of total TV shipped during 2008,
followed by LCD TV with 6.6% and PDP with 0.5% market share. However, LCD TV as a
sub-category is just at the beginning of a real growth curve with Y/Y growth of more
than 100% expected for each of next five years. This growth would be driven by
enhanced purchasing power, the digital broadcast (DTH, IPTV, STB cable) transition as
well as consumer awareness and affordability of flat panel TVs. India's growing upper
middle class is projected to be the greatest source of LCD TV purchasing power. The
market size is expected to explode as more than 23M Indians would enter this
demographic in the next five years. More sporting events like IPL, Commonwealth
games are expected to lead to higher sales.
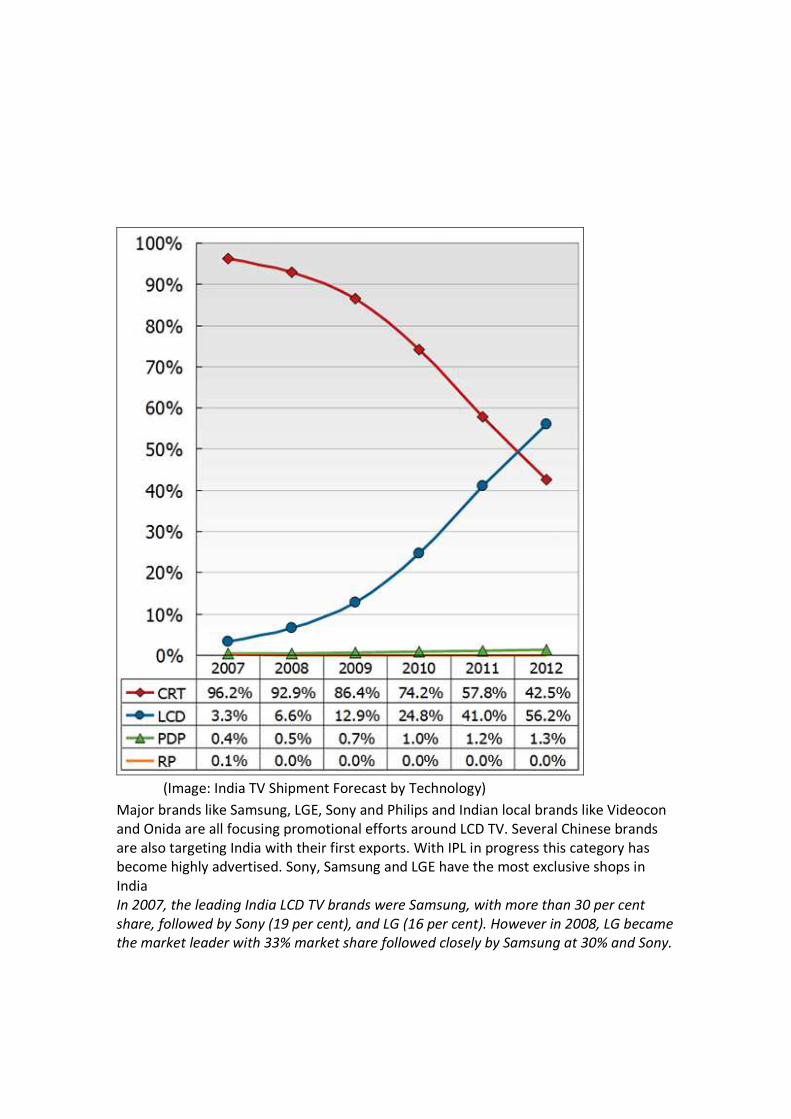
(Image: India TV Shipment Forecast by Technology)
Major brands like Samsung, LGE, Sony and Philips and Indian local brands like Videocon
and Onida are all focusing promotional efforts around LCD TV. Several Chinese brands
are also targeting India with their first exports. With IPL in progress this category has
become highly advertised. Sony, Samsung and LGE have the most exclusive shops in
India
In 2007, the leading India LCD TV brands were Samsung, with more than 30 per cent
share, followed by Sony (19 per cent), and LG (16 per cent). However in 2008, LG became
the market leader with 33% market share followed closely by Samsung at 30% and Sony.
Choice of Category
Brands & Brand Strategies
In 2007, the leading India LCD TV brands were Samsung, with more than 30 per cent
share, followed by Sony (19 per cent), and LG (16 per cent).
Sony
Sony recently launched a new series of Bravia W, V & S television series, in the range of
20-52 inches and is targeting a 40% market share in the LCD category. Sony has a
premium tag to its brand as is evident from our survey, and they see, to maintain it.
Their target customer is one with an annual income of Rs. 5 lakh and above. According
to official statistics, India would have 40 mn such households by 2010.
Sony doesn’t have a manufacturing facility in India and imports the TVs from their global
operations. The prices of LCD TV have fallen and this is allowing Sony to target a
position of market leader. They are planning to invest around Rs. 60 cr towards
marketing activities for the LCD range.Sony strategy is to leverage the organized retail as
well as their exclusive stores to reach out to the customers. Sony offers more than 20
variants with price ranging from Rs. 16,000 to Rs. 20,00,000
Samsung
Samsung is the world largest manufacturer of LCD panels. Samsung commands the
highest market share with a product line up of 22 variants and price ranging from Rs.
18,500 to Rs. 24 lakhs. Samsung has established itself as a value for money brand in the
overall CTV segment and is leveraging its extensive service network to target the
upwardly mobile consumers. Our comparison of the listed retail price for Samsung and
Sony surprisingly shows that Sony is cheaper than Samsung in several variants. Samsung
distributes its product via its channel partners as well as unorganized retail, however,
product distribution & service is centralsed for a city/region.
LG
LG which has the largest market share across all CTV sub category had a sale of more
than Rs. 1000 crore for the LCD TV sub-segment in 2008. LG achieved this high level of
sales via its extensive distribution network and reach across the country. LG prices its
product aggressively against Sony as well as Samsung. Further, LG brand has established
a value for money and superior quality and service association with its mobile handsets
available mostly on the Reliance CDMA network. They have been able to successfully
use this brand association as evident in our study. LG also has the largest number of
owned stores.
Brand Concept Map
Overview
BCM as a tool is used when the consumers understand the product category and the
associations (attributes, consequences and values) are fairly clear to the consumers for
that product category. In absence of this qualitative elicitation technique such as ZMET
needs to be followed. In the category of LCD TV’s we find that the consumer are aware
of the product and associations are fairly clear; not withstanding this we did use a
qualitative elicitation technique called laddering to come up with basic constructs and
associations. Additionally, noteworthy is that the category is a high involvement
category.
Study methodology
Elicitation Stage
The objective of this stage was to identify certain attributes, consequences and values
pertinent to this category which could subsequently be used in a Brand Concept map
study.
To do this we identified three volunteers who recently bought the product in the said
product category and were receptive to elicitation type study.
We adopted the laddering methodology to elicit constructs from respondents;
We chose laddering because Laddering as a methodology allows for an in-depth, one-
on-one interview which can be used to develop an understanding of how consumers in
this case the volunteers are translating the attributes of products they recently
purchased for the mentioned category into meaningful associations with respect to self.
We felt this approach was necessary as the use of ZMET as mandated by the BCM paper
was inappropriate for the structure of the project; hence laddering was used to identify
the mental constructs which the consumers have in their mind.
The respondent chose the attributes which have been mentioned below;
The exercise began with asking the question “What comes to your mind when you think
of an LCD TV?” and then proceeded to the ladder why were these attributes important
to the volunteer while either evaluating It or making the purchase decision.
Laddering
The ladders that we obtained during our interviews are as follows:-
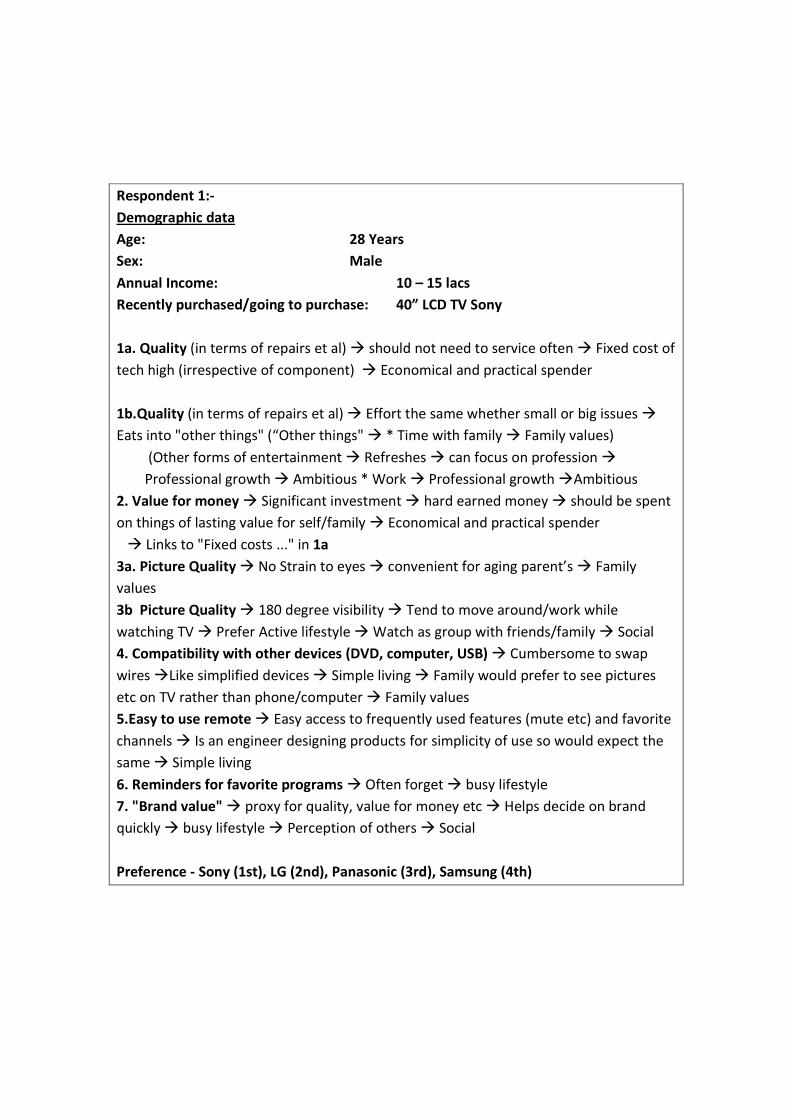
Respondent 1:-
Demographic data
Age: 28 Years
Sex: Male
Annual Income: 10 – 15 lacs
Recently purchased/going to purchase: 40” LCD TV Sony
1a. Quality (in terms of repairs et al) � should not need to service often � Fixed cost of
tech high (irrespective of component) � Economical and practical spender
1b.Quality (in terms of repairs et al) � Effort the same whether small or big issues �
Eats into "other things" (“Other things" � * Time with family � Family values)
(Other forms of entertainment � Refreshes � can focus on profession �
Professional growth � Ambitious * Work � Professional growth �Ambitious
2. Value for money � Significant investment � hard earned money � should be spent
on things of lasting value for self/family � Economical and practical spender
� Links to "Fixed costs ..." in 1a
3a. Picture Quality � No Strain to eyes � convenient for aging parent’s � Family
values
3b Picture Quality � 180 degree visibility � Tend to move around/work while
watching TV � Prefer Active lifestyle � Watch as group with friends/family � Social
4. Compatibility with other devices (DVD, computer, USB) � Cumbersome to swap
wires �Like simplified devices � Simple living � Family would prefer to see pictures
etc on TV rather than phone/computer � Family values
5.Easy to use remote � Easy access to frequently used features (mute etc) and favorite
channels � Is an engineer designing products for simplicity of use so would expect the
same � Simple living
6. Reminders for favorite programs � Often forget � busy lifestyle
7. "Brand value" � proxy for quality, value for money etc � Helps decide on brand
quickly � busy lifestyle � Perception of others � Social
Preference - Sony (1st), LG (2nd), Panasonic (3rd), Samsung (4th)
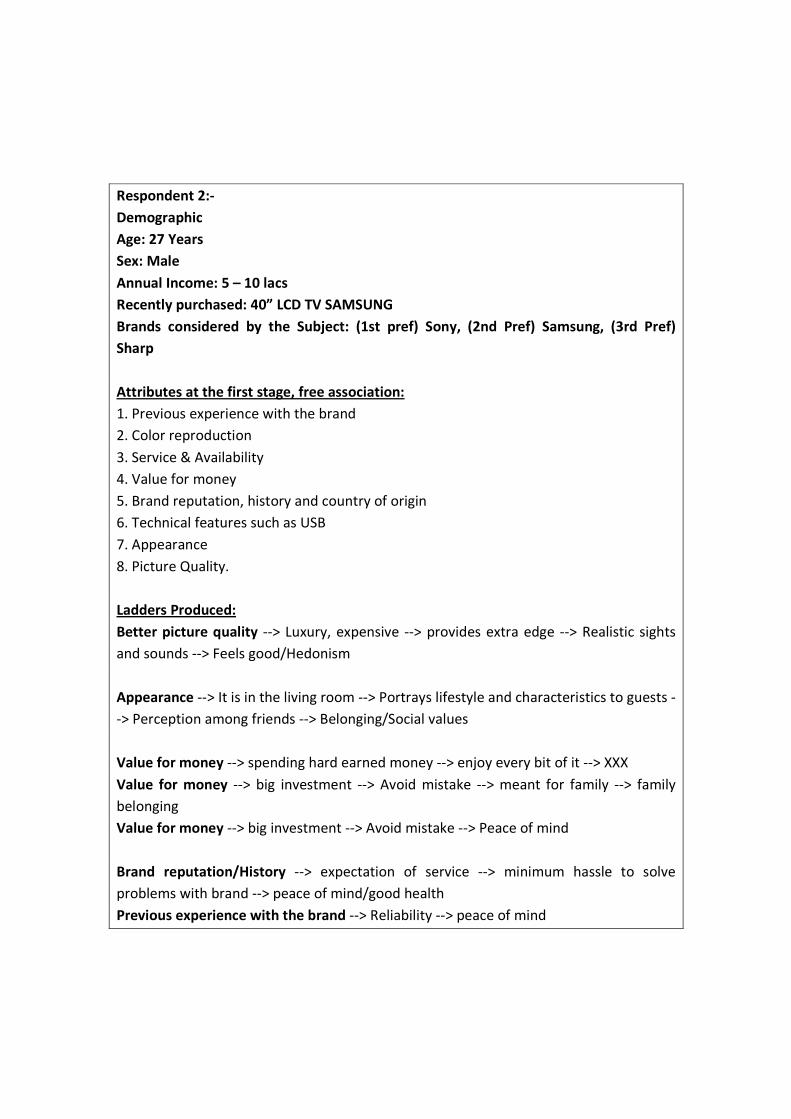
Respondent 2:-
Demographic
Age: 27 Years
Sex: Male
Annual Income: 5 – 10 lacs
Recently purchased: 40” LCD TV SAMSUNG
Brands considered by the Subject: (1st pref) Sony, (2nd Pref) Samsung, (3rd Pref)
Sharp
Attributes at the first stage, free association:
1. Previous experience with the brand
2. Color reproduction
3. Service & Availability
4. Value for money
5. Brand reputation, history and country of origin
6. Technical features such as USB
7. Appearance
8. Picture Quality.
Ladders Produced:
Better picture quality --> Luxury, expensive --> provides extra edge --> Realistic sights
and sounds --> Feels good/Hedonism
Appearance --> It is in the living room --> Portrays lifestyle and characteristics to guests -
-> Perception among friends --> Belonging/Social values
Value for money --> spending hard earned money --> enjoy every bit of it --> XXX
Value for money --> big investment --> Avoid mistake --> meant for family --> family
belonging
Value for money --> big investment --> Avoid mistake --> Peace of mind
Brand reputation/History --> expectation of service --> minimum hassle to solve
problems with brand --> peace of mind/good health
Previous experience with the brand --> Reliability --> peace of mind
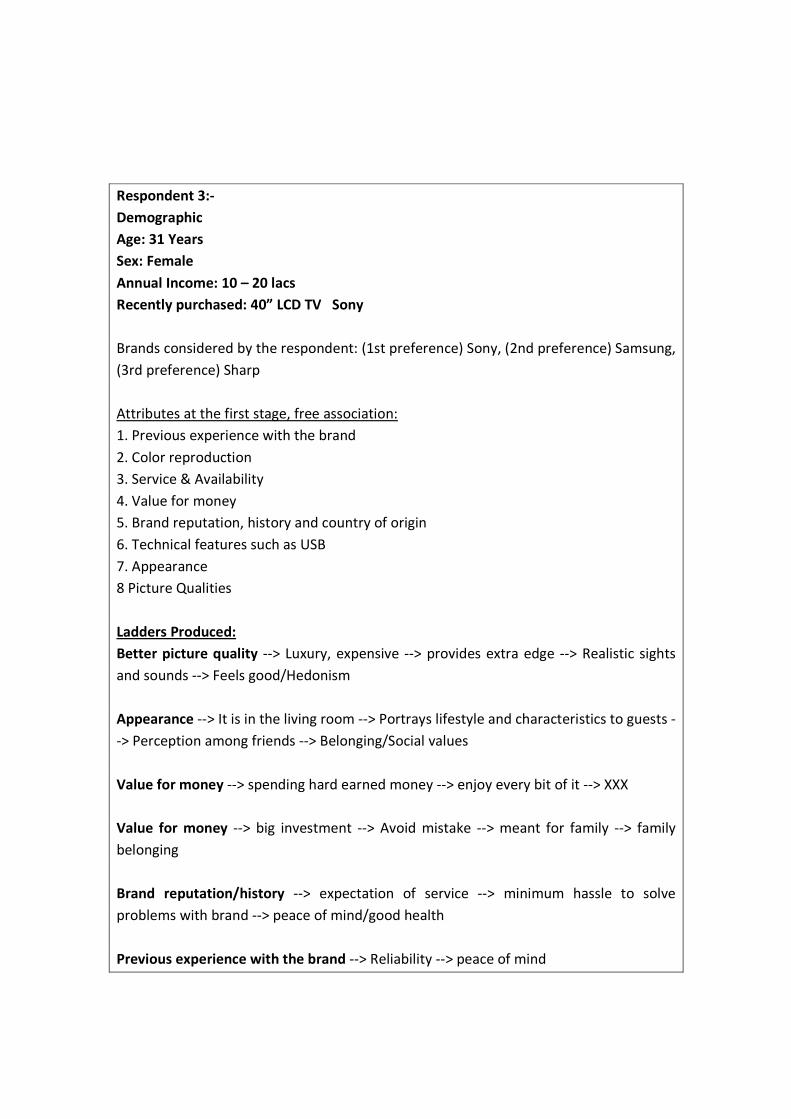
Respondent 3:-
Demographic
Age: 31 Years
Sex: Female
Annual Income: 10 – 20 lacs
Recently purchased: 40” LCD TV Sony
Brands considered by the respondent: (1st preference) Sony, (2nd preference) Samsung,
(3rd preference) Sharp
Attributes at the first stage, free association:
1. Previous experience with the brand
2. Color reproduction
3. Service & Availability
4. Value for money
5. Brand reputation, history and country of origin
6. Technical features such as USB
7. Appearance
8 Picture Qualities
Ladders Produced:
Better picture quality --> Luxury, expensive --> provides extra edge --> Realistic sights
and sounds --> Feels good/Hedonism
Appearance --> It is in the living room --> Portrays lifestyle and characteristics to guests -
-> Perception among friends --> Belonging/Social values
Value for money --> spending hard earned money --> enjoy every bit of it --> XXX
Value for money --> big investment --> Avoid mistake --> meant for family --> family
belonging
Brand reputation/history --> expectation of service --> minimum hassle to solve
problems with brand --> peace of mind/good health
Previous experience with the brand --> Reliability --> peace of mind
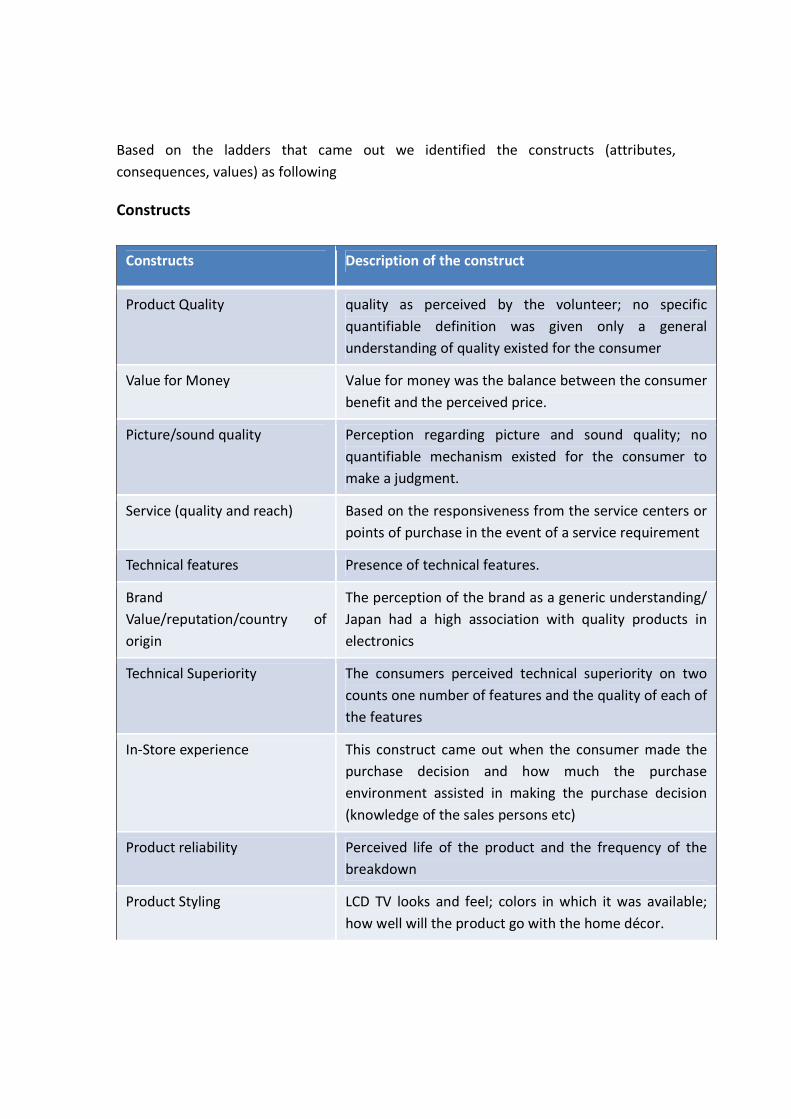
Based on the ladders that came out we identified the constructs (attributes,
consequences, values) as following
Constructs
Constructs Description of the construct
Product Quality quality as perceived by the volunteer; no specific
quantifiable definition was given only a general
understanding of quality existed for the consumer
Value for Money Value for money was the balance between the consumer
benefit and the perceived price.
Picture/sound quality Perception regarding picture and sound quality; no
quantifiable mechanism existed for the consumer to
make a judgment.
Service (quality and reach) Based on the responsiveness from the service centers or
points of purchase in the event of a service requirement
Technical features Presence of technical features.
Brand
Value/reputation/country of
origin
The perception of the brand as a generic understanding/
Japan had a high association with quality products in
electronics
Technical Superiority The consumers perceived technical superiority on two
counts one number of features and the quality of each of
the features
In-Store experience This construct came out when the consumer made the
purchase decision and how much the purchase
environment assisted in making the purchase decision
(knowledge of the sales persons etc)
Product reliability Perceived life of the product and the frequency of the
breakdown
Product Styling LCD TV looks and feel; colors in which it was available;
how well will the product go with the home décor.
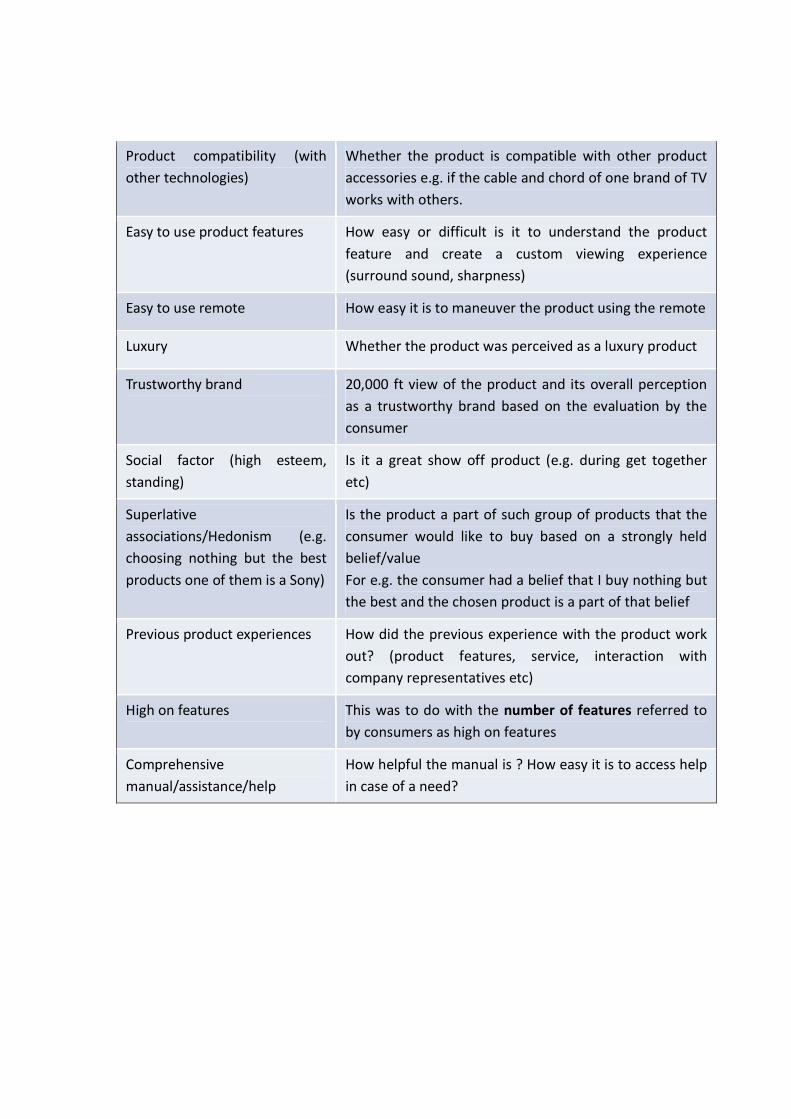
Product compatibility (with
other technologies)
Whether the product is compatible with other product
accessories e.g. if the cable and chord of one brand of TV
works with others.
Easy to use product features How easy or difficult is it to understand the product
feature and create a custom viewing experience
(surround sound, sharpness)
Easy to use remote How easy it is to maneuver the product using the remote
Luxury Whether the product was perceived as a luxury product
Trustworthy brand 20,000 ft view of the product and its overall perception
as a trustworthy brand based on the evaluation by the
consumer
Social factor (high esteem,
standing)
Is it a great show off product (e.g. during get together
etc)
Superlative
associations/Hedonism (e.g.
choosing nothing but the best
products one of them is a Sony)
Is the product a part of such group of products that the
consumer would like to buy based on a strongly held
belief/value
For e.g. the consumer had a belief that I buy nothing but
the best and the chosen product is a part of that belief
Previous product experiences How did the previous experience with the product work
out? (product features, service, interaction with
company representatives etc)
High on features This was to do with the number of features referred to
by consumers as high on features
Comprehensive
manual/assistance/help
How helpful the manual is ? How easy it is to access help
in case of a need?
Mapping Stage
We chose the brands Sony and Samsung based on the analysis of the LCD TV market;
analysis of the LCD TV market brings out the observation that Sony has the highest
Mindshare amongst the consumers; Samsung has the highest market share in the
mentioned category.
From the previous exercise of laddering done we identified important constructs. These
constructs would be useful in the BCM study. Based on these constructs we prepared
cards during preparation of the exercise; briefed the respondents on the motive of the
exercise, explained the BCM methodology and guided them through the mapping
phase; we as a group agreed to use the Volkswagen Beetle map (given in the paper) to
provide a reference to the volunteers.
We provided the respondents with sheets (which are attached with the report) to create
the brand associations during the respective stage of the exercise.
During this stage the interview times were setup with the respondents for them to do
the exercise in their free time; the entire exercise was done in on go for each brand so
as to obtain consistent result once the motive and the mechanism were explained the
entire exercise took 25 – 30 minutes;
The respondents were shown the advertisements of the brands for which they were
requested to create the associations.
The exercise ended with the respondents mentioning their demographic data and other
details.
The results of the exercise are attached with the report in the appendix.
Aggregation Stage
(This exercise is an illustration for SONY the same steps were repeated for Samsung
which are available in appendix)
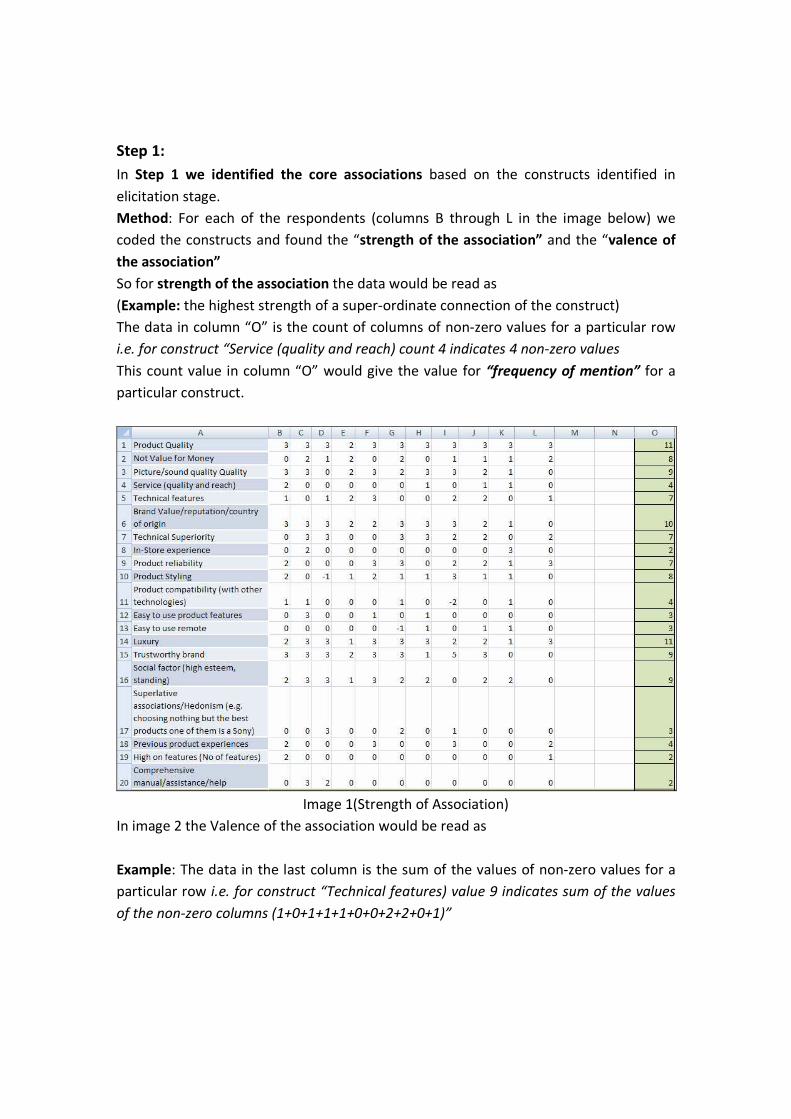
Step 1:
In Step 1 we identified the core associations based on the constructs identified in
elicitation stage.
Method: For each of the respondents (columns B through L in the image below) we
coded the constructs and found the “strength of the association” and the “valence of
the association”
So for strength of the association the data would be read as
(Example: the highest strength of a super-ordinate connection of the construct)
The data in column “O” is the count of columns of non-zero values for a particular row
i.e. for construct “Service (quality and reach) count 4 indicates 4 non-zero values
This count value in column “O” would give the value for “frequency of mention” for a
particular construct.
Image 1(Strength of Association)
In image 2 the Valence of the association would be read as
Example: The data in the last column is the sum of the values of non-zero values for a
particular row i.e. for construct “Technical features) value 9 indicates sum of the values
of the non-zero columns (1+0+1+1+1+0+0+2+2+0+1)”
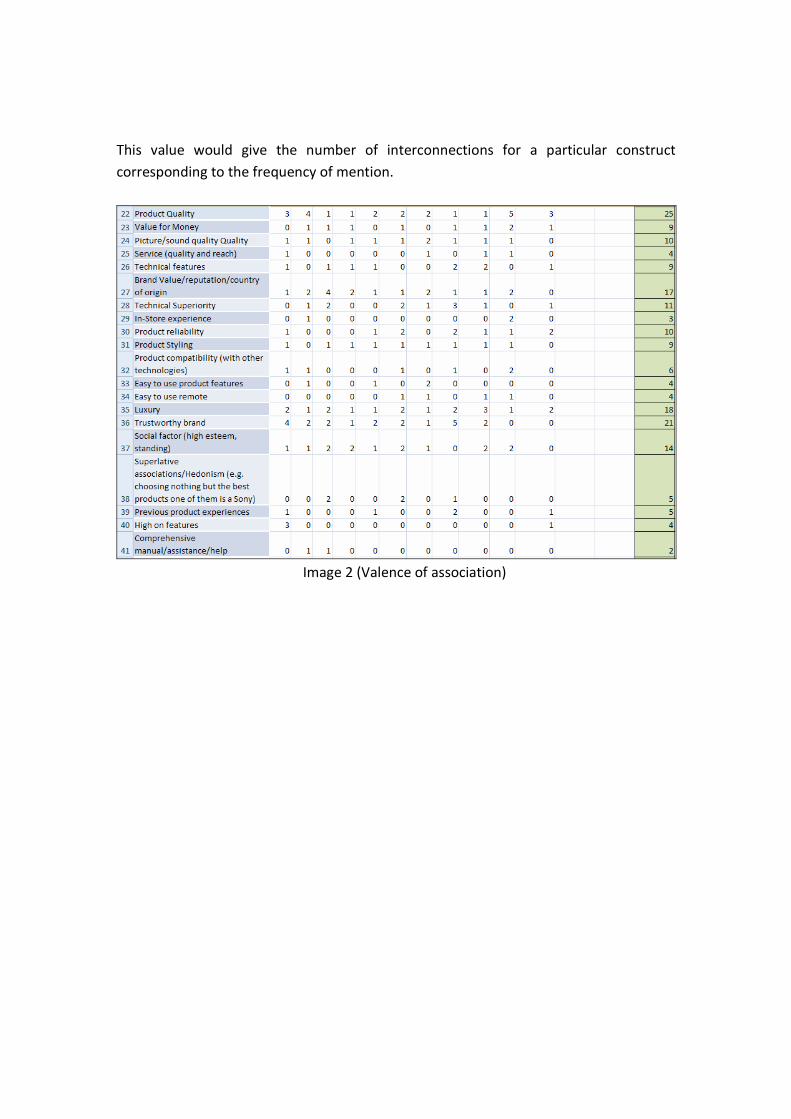
This value would give the number of interconnections for a particular construct
corresponding to the frequency of mention.
Image 2 (Valence of association)
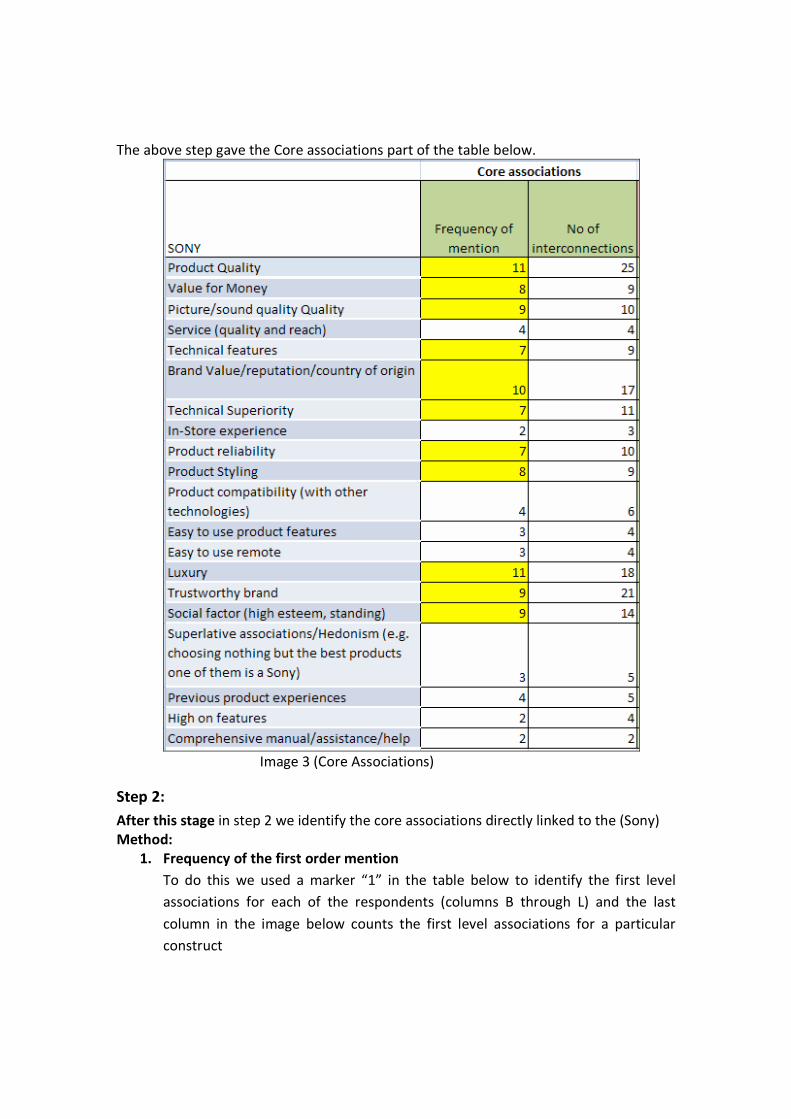
The above step gave the Core associations part of the table below.
Image 3 (Core Associations)
Step 2:
After this stage in step 2 we identify the core associations directly linked to the (Sony)
Method:
1. Frequency of the first order mention
To do this we used a marker “1” in the table below to identify the first level
associations for each of the respondents (columns B through L) and the last
column in the image below counts the first level associations for a particular
construct
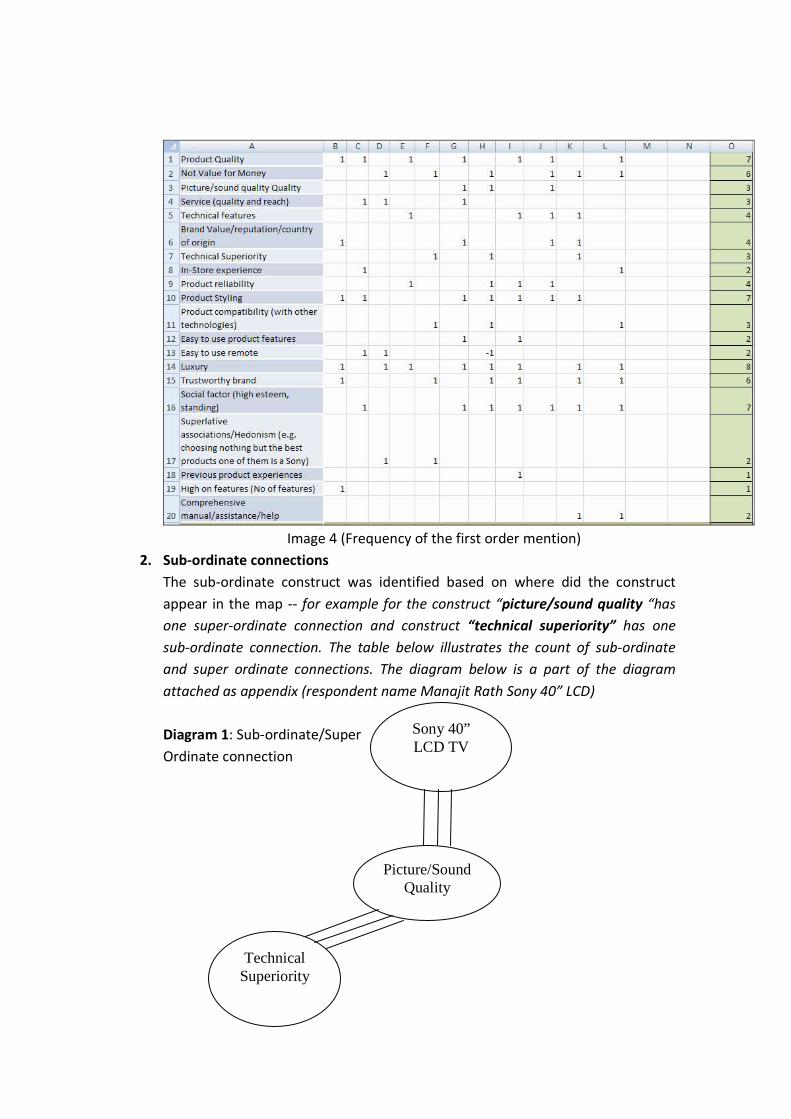
Image 4 (Frequency of the first order mention)
2. Sub-ordinate connections
The sub-ordinate construct was identified based on where did the construct
appear in the map -- for example for the construct “picture/sound quality “has
one super-ordinate connection and construct “technical superiority” has one
sub-ordinate connection. The table below illustrates the count of sub-ordinate
and super ordinate connections. The diagram below is a part of the diagram
attached as appendix (respondent name Manajit Rath Sony 40” LCD)
Diagram 1: Sub-ordinate/Super
Ordinate connection
Picture/Sound Quality
Technical Superiority
Sony 40” LCD TV
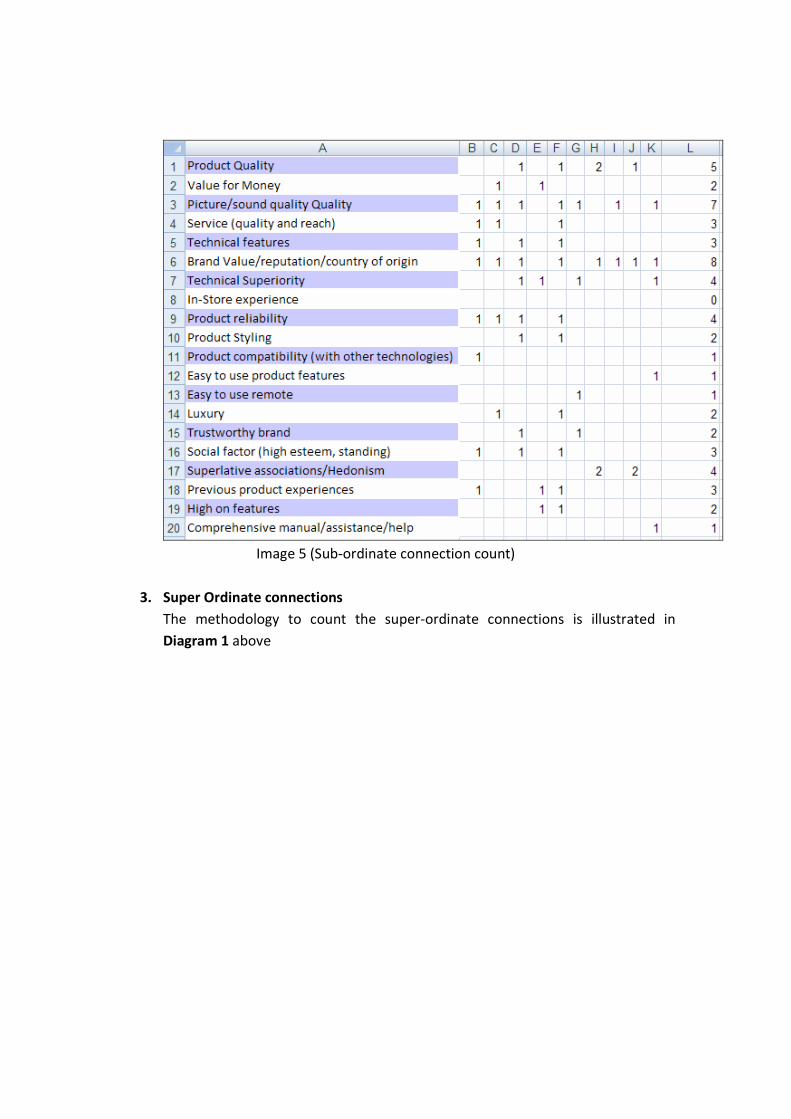
Image 5 (Sub-ordinate connection count)
3. Super Ordinate connections
The methodology to count the super-ordinate connections is illustrated in
Diagram 1 above
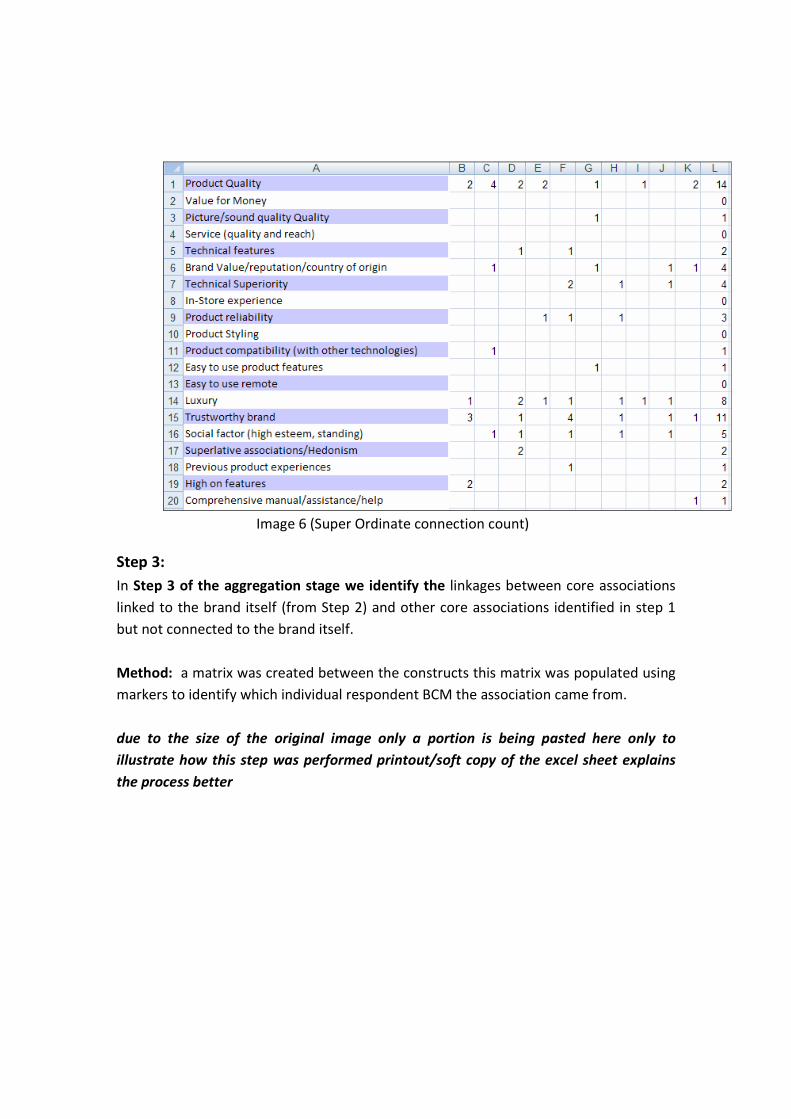
Image 6 (Super Ordinate connection count)
Step 3:
In Step 3 of the aggregation stage we identify the linkages between core associations
linked to the brand itself (from Step 2) and other core associations identified in step 1
but not connected to the brand itself.
Method: a matrix was created between the constructs this matrix was populated using
markers to identify which individual respondent BCM the association came from.
due to the size of the original image only a portion is being pasted here only to
illustrate how this step was performed printout/soft copy of the excel sheet explains
the process better
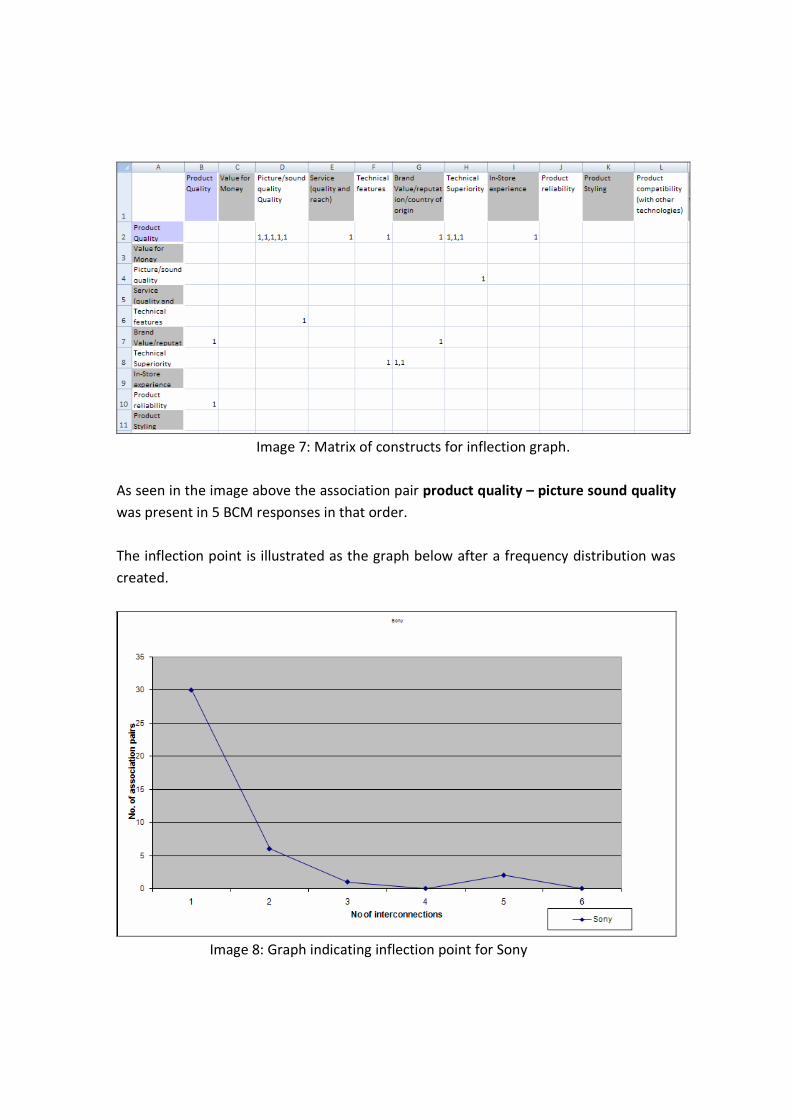
Image 7: Matrix of constructs for inflection graph.
As seen in the image above the association pair product quality – picture sound quality
was present in 5 BCM responses in that order.
The inflection point is illustrated as the graph below after a frequency distribution was
created.
Image 8: Graph indicating inflection point for Sony
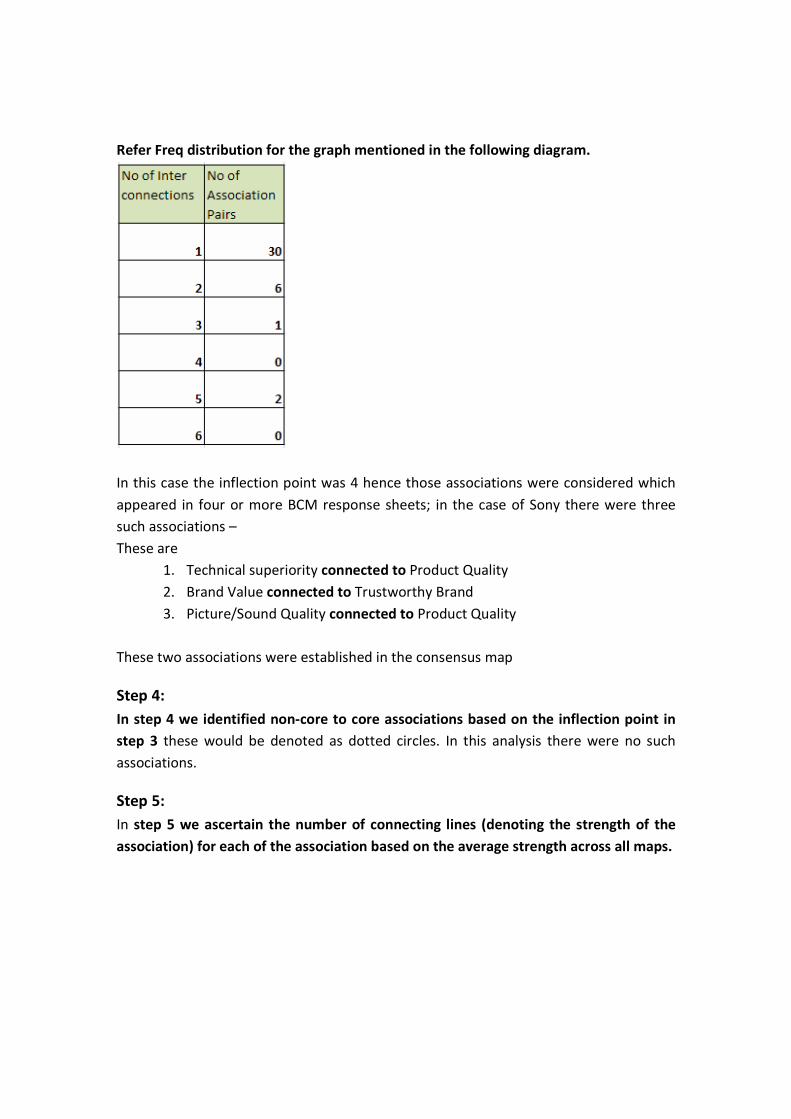
Refer Freq distribution for the graph mentioned in the following diagram.
In this case the inflection point was 4 hence those associations were considered which
appeared in four or more BCM response sheets; in the case of Sony there were three
such associations –
These are
1. Technical superiority connected to Product Quality
2. Brand Value connected to Trustworthy Brand
3. Picture/Sound Quality connected to Product Quality
These two associations were established in the consensus map
Step 4:
In step 4 we identified non-core to core associations based on the inflection point in
step 3 these would be denoted as dotted circles. In this analysis there were no such
associations.
Step 5:
In step 5 we ascertain the number of connecting lines (denoting the strength of the
association) for each of the association based on the average strength across all maps.
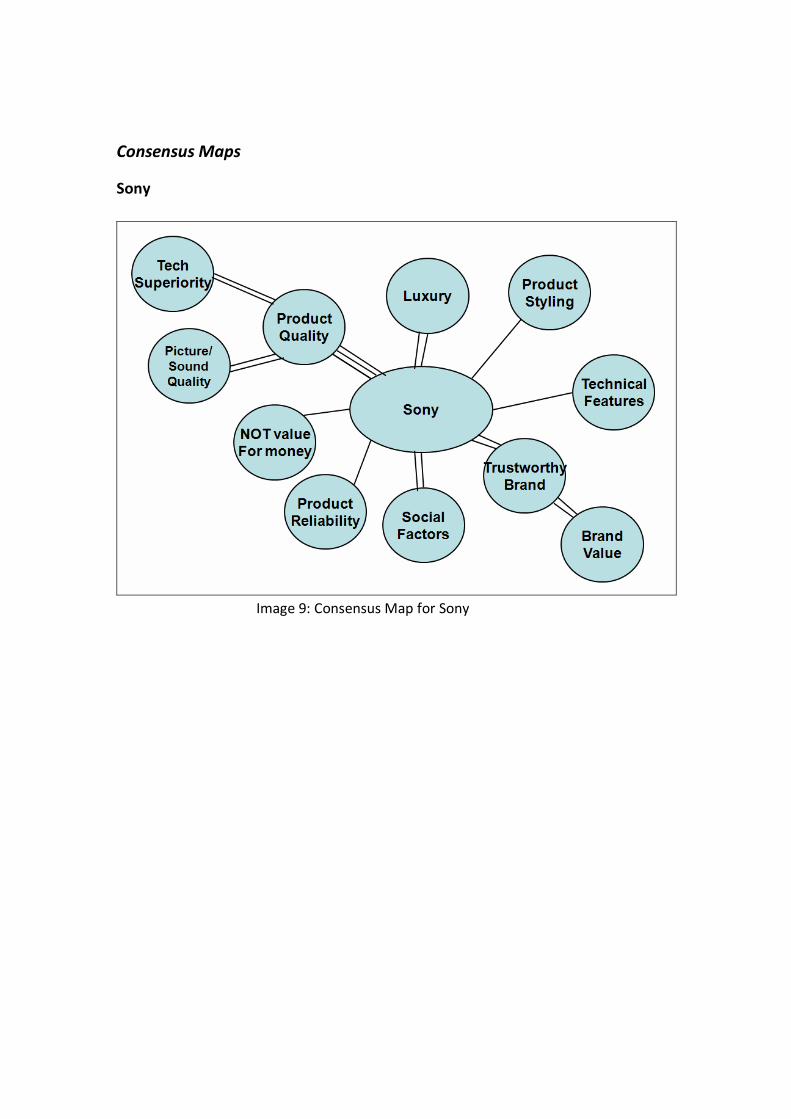
Consensus Maps
Sony
Image 9: Consensus Map for Sony
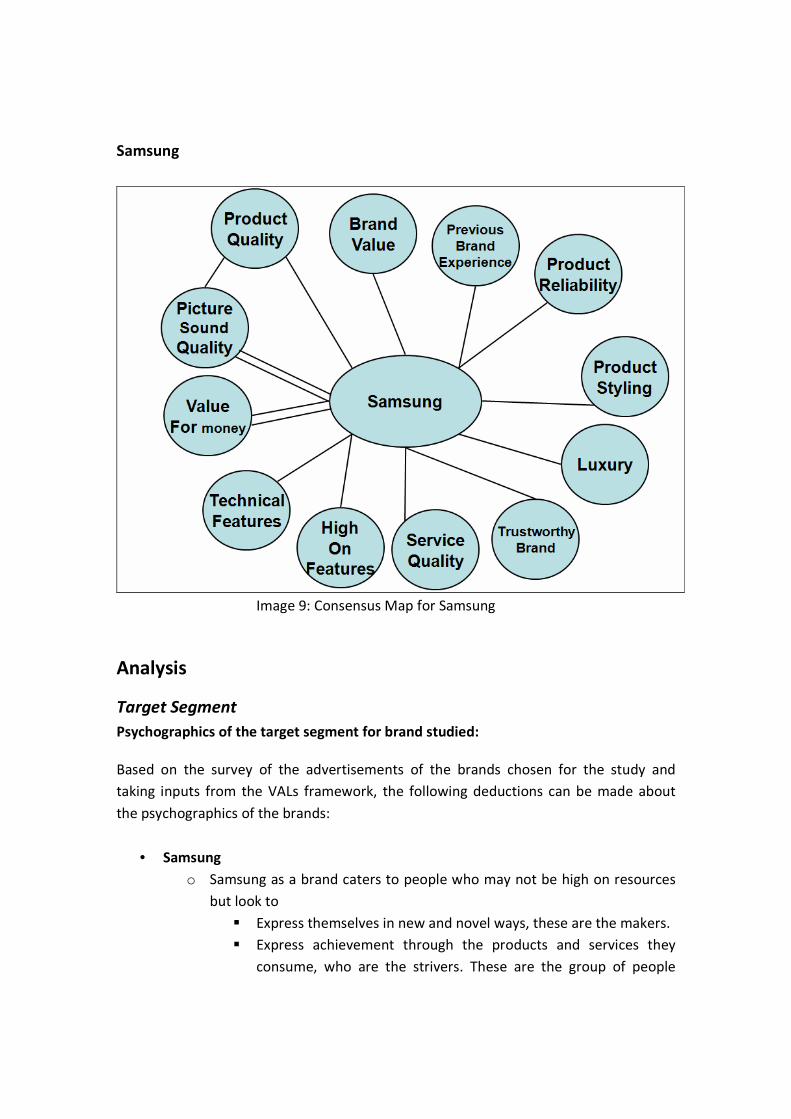
Samsung
Image 9: Consensus Map for Samsung
Analysis
Target Segment
Psychographics of the target segment for brand studied:
Based on the survey of the advertisements of the brands chosen for the study and
taking inputs from the VALs framework, the following deductions can be made about
the psychographics of the brands:
• Samsung
o Samsung as a brand caters to people who may not be high on resources
but look to
� Express themselves in new and novel ways, these are the makers.
� Express achievement through the products and services they
consume, who are the strivers. These are the group of people
who are trying to have the latest and the best, yet may not have
the resources to do so.
• Sony
o Sony as a brand caters to people who are willing to pay a premium to
consume products and services that they desire. They are people who are
motivated to achieve in life and to aspire for and get the best product
there is. Sony, therefore targets Innovators and the Achievers.
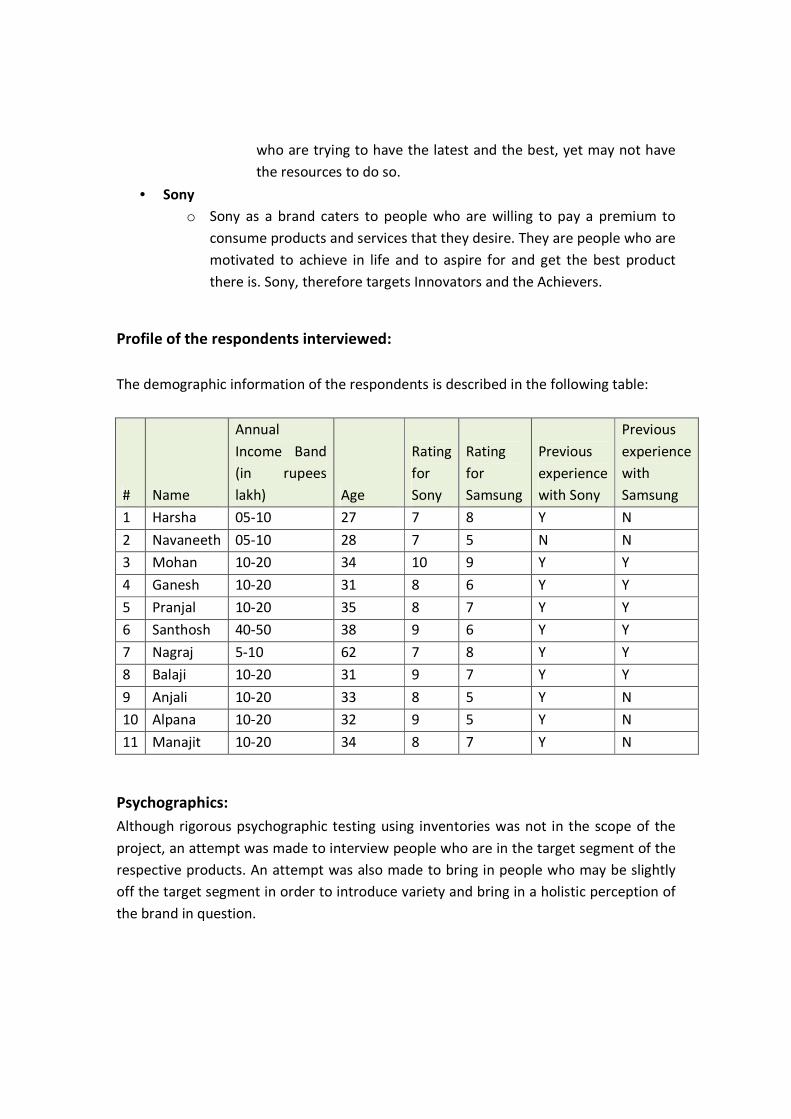
Profile of the respondents interviewed:
The demographic information of the respondents is described in the following table:
# Name
Annual
Income Band
(in rupees
lakh) Age
Rating
for
Sony
Rating
for
Samsung
Previous
experience
with Sony
Previous
experience
with
Samsung
1 Harsha 05-10 27 7 8 Y N
2 Navaneeth 05-10 28 7 5 N N
3 Mohan 10-20 34 10 9 Y Y
4 Ganesh 10-20 31 8 6 Y Y
5 Pranjal 10-20 35 8 7 Y Y
6 Santhosh 40-50 38 9 6 Y Y
7 Nagraj 5-10 62 7 8 Y Y
8 Balaji 10-20 31 9 7 Y Y
9 Anjali 10-20 33 8 5 Y N
10 Alpana 10-20 32 9 5 Y N
11 Manajit 10-20 34 8 7 Y N
Psychographics:
Although rigorous psychographic testing using inventories was not in the scope of the
project, an attempt was made to interview people who are in the target segment of the
respective products. An attempt was also made to bring in people who may be slightly
off the target segment in order to introduce variety and bring in a holistic perception of
the brand in question.
The respondents included people who were achievers and innovators, who clearly
believed that they were successful in life and wanted to consume the best products and
services and had the resources to do so. There were also some in the group who were
strivers and makers. Strivers were those who had an orientation towards achievement,
who considered themselves to be on path towards success, yet may not have had the
resources at their disposal. Makers were those who valued self expression and enjoying
the benefits of new technology while trying to stay value-conscious.
BCM Results and analysis
As noted in “Characteristics of memory associations: A consumer based brand equity
perspective” (H.S.Krishnan), as the number of brand associations increases, the memory
structure for that brand becomes richer but also more complex. A large number of
associations may lead to lowered memory for the brand due to interference with these
associations (Meyer-Levy,1989). As seen in the associations generated as a part of the
BCM exercise, Samsung had a higher number of associations. The next thing we notice is
that there are eight shared associations between Sony and Samsung. As the number of
shared associations’ increases, the brand increasingly becomes associated with standard
product features. Hence unique associations are important to enable the brand to stand
out from the product category.
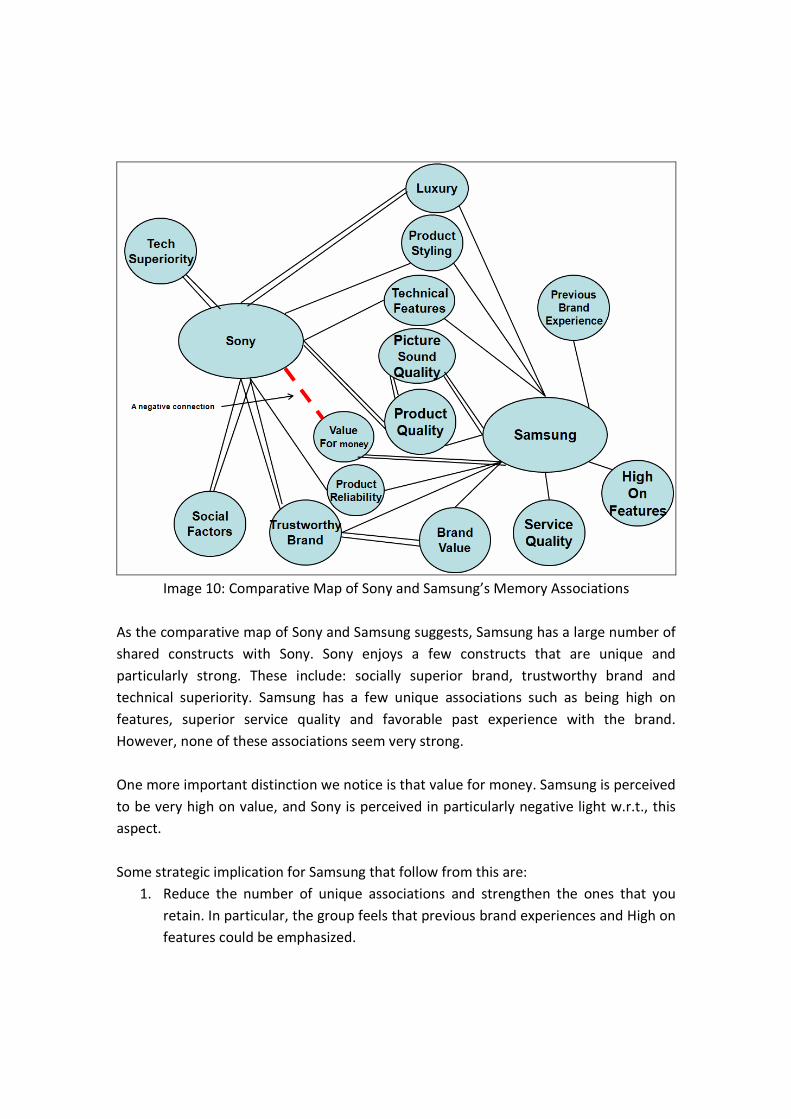
Image 10: Comparative Map of Sony and Samsung’s Memory Associations
As the comparative map of Sony and Samsung suggests, Samsung has a large number of
shared constructs with Sony. Sony enjoys a few constructs that are unique and
particularly strong. These include: socially superior brand, trustworthy brand and
technical superiority. Samsung has a few unique associations such as being high on
features, superior service quality and favorable past experience with the brand.
However, none of these associations seem very strong.
One more important distinction we notice is that value for money. Samsung is perceived
to be very high on value, and Sony is perceived in particularly negative light w.r.t., this
aspect.
Some strategic implication for Samsung that follow from this are:
1. Reduce the number of unique associations and strengthen the ones that you
retain. In particular, the group feels that previous brand experiences and High on
features could be emphasized.
2. Use the perception of superior value for money in all the marketing mix
elements decision Samsung makes as well as in the communication.
Brand Associations: Positioning decision
In the analysis mentioned above during a comparative study between Sony and
Samsung the two most competitive dimensions that come out are
1. Value for money
2. High on Features
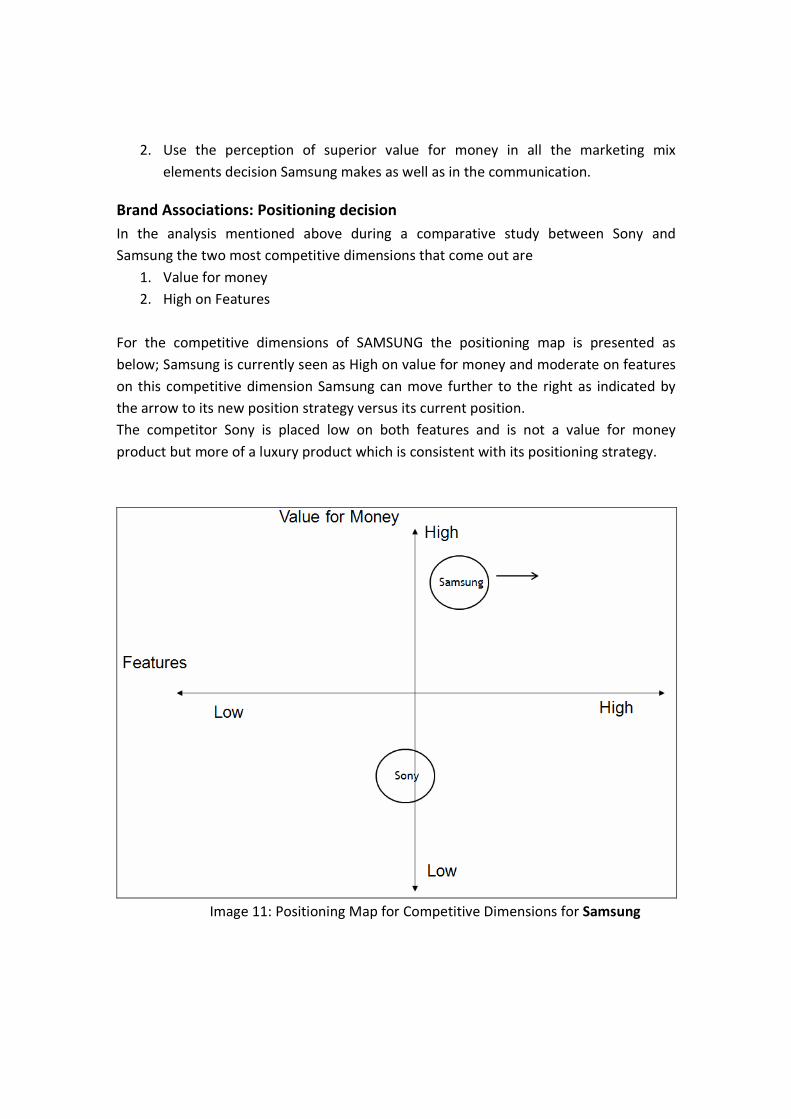
For the competitive dimensions of SAMSUNG the positioning map is presented as
below; Samsung is currently seen as High on value for money and moderate on features
on this competitive dimension Samsung can move further to the right as indicated by
the arrow to its new position strategy versus its current position.
The competitor Sony is placed low on both features and is not a value for money
product but more of a luxury product which is consistent with its positioning strategy.
Image 11: Positioning Map for Competitive Dimensions for Samsung
The Samsung brand has a couple of associations which can be strengthened further for
example high on features or even service quality (as obtained from the comparative
map image 10)
There are other associations which could be strengthened like “trustworthy brand”
which would benefit Samsung; another observation is “country of origin ” association
does not help Samsung too much as Samsung is a Korean origin product and Sony is a
Japanese origin product; traditionally Japan is seen as a source country where high
quality electronic items are produced which is not so for Korea which is more seen as a
electronic component manufacturer.
ZMET
Overview
Zaltman Metaphor Elicitation Technique uses visual and non-visual images gathered
and/or generated by consumers to elicit and probe the metaphors that represent
consumers’ thoughts. It attempts to correct the following marketing fallacies -
• Consumers think in well-reasoned, linear ways as they evaluate products.
• Consumers can plausibly explain their thinking and behavior.
• Consumers’ minds, brains, bodies, and surrounding culture can be studied
independently of one another.
• Consumers’ memories accurately reflect their experience.
• Consumers think primarily in words.
• Consumers can receive "injections" of company messages — and interpret them
correctly.
As a result, the following may occur which may in turn destroy product
Launches –
1. Mistaking descriptive information for real insight.
2. Confusing consumer data with understanding.
3. Focusing on the wrong elements of the consumer experience.
[From How Customers Think - Essential Insights into the Mind of the Market by Gerald
Zaltman]
The ZMET method explores the unconscious mind of the customer by taking into
account that images are and important and intergral part of analysis. Images provide a
clear idea of what consumers really think and feel. An image represents a thought or
feeling consumers and are are referred to as metaphors. A metaphor is the
representation of one thing (a thought, feeling, action) in terms of another thing (a
picture of someone happy, a colour etc).
Potential insights from ZMET
The ZMET method uses a series of research methods to tap into consumers' visual and
other sensory images for brands. These insights would be far deeper and more clear
than the insights of verbal discussions alone which was used in BCM for this study.
While BCM did help identify the core associations, we note that in the case of Samsung,
a large majority have a valence of 1. It is therefore unclear as to which core associations
to focus on. We anticipate that in this study, ZMET would have helped us assign
association strengths (valence) more effectively.
Potential usage of ZMET for brand equity
Marketing strategies based on brand associations ascertained from verbal interviews
alone might be misguided. ZMET can potentially help define the promotion and product
amongst the marketing mix elements.
Since ZMET takes into account mental images associated with a brand, it can be used to
understand personal cognitive responses to any brand- related information better.
Furthermore, it can help to analyze and predict potential personal affective responses to
any brand- related information. Both of these would help frame the promotion strategy
to either change the mental representation of the brand and the kinds of information
that can appear in consumer memory or reinforced existing brand associations in the
minds of the customers.
Additionally, it helps understand personal value and meaning that consumers attach to
the brand's product attributes (e.g., functional, symbolic, or experiential consequences
from the brand's purchase or consumption). This would help define the product
attributes most desired by the target segment.
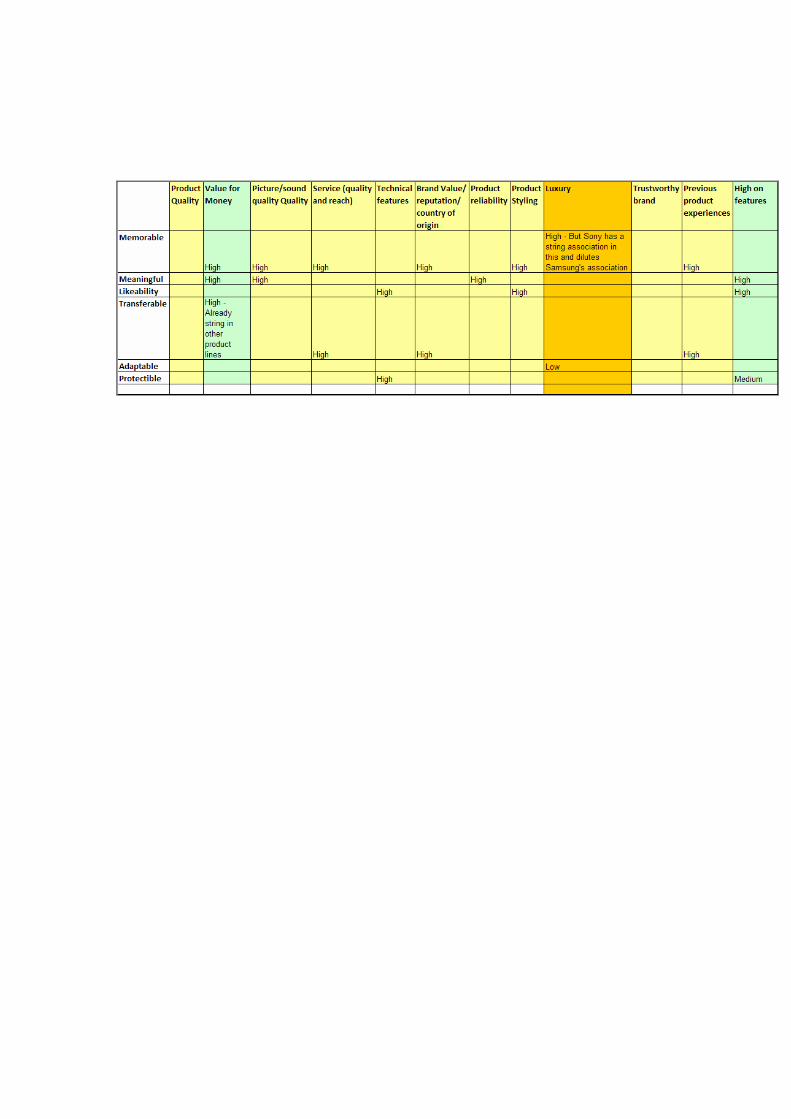
Strategy for Building Brand Equity
The table below shows the brand elements choice criteria model which was used to
identify which of the brand associations from the BCM study should be leveraged,
preserved, de-emphasised. The
Recommendation Based on the analysis using the shared association map, positioning based on
competitive dimensions and comparative analysis with ZMET we recommend the
following.
1. Reduce the number of associations for Samsung as the brand
a. Luxury (affects Samsung negatively as this is a strong Sony
association)
b. Country of Origin (do not emphasize)
2. Increase the strength of the existing associations
a. Value for Money
b. High on features
3. Use the values obtained from laddering to identify and target appropriate
psychographics segments. We feel that these segments are “Strivers” and
“Makers” based on the values for Samsung’s association.
4. Use ZMET in conjunction with BCM to ascertain new constructs and the
strengths of associations more accurately; additionally, ZMET can be used to
analyze and predict cognitive and affective responses to brand information
conveyed by the ads, thereby leading to a better product and positioning
strategy.