Brand Behemoths United States - NYUpages.stern.nyu.edu/.../Lectures/brand_behemoths.pdf · Brand...
88
See page 86 for Analyst Certification and Important Disclosures Citigroup Research is a division of Citigroup Global Markets Inc. (the "Firm"), which does and seeks to do business with companies covered in its research reports. As a result, investors should be aware that the Firm may have a conflict of interest that could affect the objectivity of this report. Investors should consider this report as only a single factor in making their investment decision. Non-US research analysts who have prepared this report, and who may be associated persons of the member or member organization, are not registered/qualified as research analysts with the NYSE and/or NASD, but instead have satisfied the registration/qualification requirements or other research-related standards of a non-US jurisdiction. United States Edward M. Kerschner, CFA 212-816-3532 [email protected] Michael Geraghty 212-816-3534 [email protected] EQUITY RESEARCH: UNITED STATES Thematic Investing March 31, 2006 Brand Behemoths Executing Brand Leadership on a Global Basis ➤ Most brands fail, either in the near term or over the long run. Today, 30,000 new consumer products are launched each year, but more than 90% fail. Of the leading brands in 1923, only 23% remained leaders in the 1990s, while 28% had failed outright. ➤ In this environment, a handful of “brand behemoths” have a track record of successfully leveraging a leadership position in one region or category and extending their franchises into new markets. ➤ Examining more than 3,500 consumer nondurable brands, we identify ten brand behemoths for 2010: Colgate-Palmolive, Danone, Kellogg, Kimberly-Clark, L’Oréal, Nestlé, PepsiCo, Procter & Gamble, Unilever, and Wrigley. ➤ These ten brand behemoths are growing. We estimate they will be the leaders (i.e., No. 1 in market share) in about 50% of the consumer nondurable “brands space” by 2010, with the remaining 50% dispersed among 88 other companies; so these brand behemoths are still far from mature. ➤ There are projected to be 1.2 billion more consumers able to buy packaged goods by 2010 than there were in 2000. ➤ Four key factors that drive brand dominance: 1) a distinct competitive advantage, 2) exposure to regional growth opportunities, 3) “stretching” brands across categories, and 4) a prolonged period of share stability in a market.
Transcript of Brand Behemoths United States - NYUpages.stern.nyu.edu/.../Lectures/brand_behemoths.pdf · Brand...

See page 86 for Analyst Certification and Important Disclosures
Citigroup Research is a division of Citigroup Global Markets Inc. (the "Firm"), which does and seeks to do business with companies covered in its research reports. As a result, investors should be aware that the Firm may have a conflict of interest that could affect the objectivity of this report. Investors should consider this report as only a single factor in making their investment decision. Non-US research analysts who have prepared this report, and who may be associated persons of the member or member organization, are not registered/qualified as research analysts with the NYSE and/or NASD, but instead have satisfied the registration/qualification requirements or other research-related standards of a non-US jurisdiction.
Unit
ed S
tate
s
Edward M. Kerschner, CFA 212-816-3532 [email protected]
Michael Geraghty 212-816-3534 [email protected]
E Q U I T Y R E S E A R C H :
U N I T E D S T A T E S
Thematic Investing March 31, 2006
Brand Behemoths Executing Brand Leadership on a Global Basis
➤ Most brands fail, either in the near term or over the long run. Today, 30,000 new consumer products are launched each year, but more than 90% fail. Of the leading brands in 1923, only 23% remained leaders in the 1990s, while 28% had failed outright.
➤ In this environment, a handful of “brand behemoths” have a track record of successfully leveraging a leadership position in one region or category and extending their franchises into new markets.
➤ Examining more than 3,500 consumer nondurable brands, we identify ten brand behemoths for 2010: Colgate-Palmolive, Danone, Kellogg, Kimberly-Clark, L’Oréal, Nestlé, PepsiCo, Procter & Gamble, Unilever, and Wrigley.
➤ These ten brand behemoths are growing. We estimate they will be the leaders (i.e., No. 1 in market share) in about 50% of the consumer nondurable “brands space” by 2010, with the remaining 50% dispersed among 88 other companies; so these brand behemoths are still far from mature.
➤ There are projected to be 1.2 billion more consumers able to buy packaged goods by 2010 than there were in 2000.
➤ Four key factors that drive brand dominance: 1) a distinct competitive advantage, 2) exposure to regional growth opportunities, 3) “stretching” brands across categories, and 4) a prolonged period of share stability in a market.

Brand Behemoths – March 31, 2006
2
Investment Summary ...................................................................................................................................... 3 Why Brands Matter......................................................................................................................................... 4 Looking for Brand Behemoths.......................................................................................................................... 6 The Origin of Brands ...................................................................................................................................... 8 Wedgwood: An Aspirational Brand ................................................................................................................ 9 19th Century Branding: Quality and Reliability........................................................................................... 11 Professional Brand Management.................................................................................................................... 15 Postwar Market Segmentation ........................................................................................................................ 18 Behind Branding .............................................................................................................................................. 22 The Importance of Intangibles........................................................................................................................ 22 It’s Not Enough Just to Be First...................................................................................................................... 25 Identifying Brand Behemoths...................................................................................................................... 26 A Unique Database .......................................................................................................................................... 26 Brand Leaders and Brand Behemoths............................................................................................................ 27 A Distinct Competitive Advantage.............................................................................................................. 30 Branding the Basics ......................................................................................................................................... 31 Globally Local.................................................................................................................................................. 36 Behavior Modification..................................................................................................................................... 43 New and Improved........................................................................................................................................... 49 “Economies of Skill” ....................................................................................................................................... 51 Exposure to Regional Growth Opportunities............................................................................................ 53 “Stretching” — Extending Brands Across Categories ............................................................................ 60 Stretching and Brand Behemoths.................................................................................................................... 61 A Prolonged Period of Share Stability in a Market ................................................................................. 66 Appendix A ..................................................................................................................................................... 71 Biographies....................................................................................................................................................... 71 Appendix B...................................................................................................................................................... 72 General Forecasting Principles ....................................................................................................................... 72 Appendix C ..................................................................................................................................................... 75 Projected Brand Leaders in 2010.................................................................................................................... 75 Appendix D ..................................................................................................................................................... 82 Projected Brand Leader in 2010 by Region for 30 Categories ..................................................................... 82
The following analysts contributed to this report: Warren Ackerman, Chip Dillon, David Driscoll, Bonnie Herzog, Wendy Nicholson, and Andy Smith.
Peter N. Golder, PhD (associate professor, department of marketing, Stern School of Business, New York University) and Joel H. Steckel, PhD (professor, department of marketing, Stern School of Business, New York University) acted as consultants for this report.
Table of Contents

Brand Behemoths – March 31, 2006
3
Brand behemoths successfully leverage a leadership position in one category or region and extend that franchise into new markets.
Four key factors drive brand dominance. 1 A distinct competitive advantage, reflected in a large market share lead, and
derived through the following strategies:
➤ Branding the Basics: Benefiting from the growing number of global consumers who can afford the most basic packaged foodstuffs such as bottled water, biscuits, and milk (Nestlé and Danone).
➤ Globally Local: A strategy that stimulates consumer purchasing of more advanced packaged foodstuffs by carefully adapting products to local market conditions, such as roasted hot pepper–flavored mayonnaise in Brazil, Masala-flavored chips in India, and raisin-flavored bran cereal targeted at the elderly in the U.S. (Unilever, PepsiCo, and Kellogg).
➤ Behavior Modification: Changing consumer habits, e.g., from cleaning teeth with a stick to using a toothbrush, and from washing hair with soap to using shampoo (Colgate-Palmolive, Wrigley, and Procter & Gamble).
➤ New and Improved Products: Driving sales growth by encouraging consumers to “trade up” to products such as new and improved lipstick that stays on longer (L’Oréal).
➤ “Economies of Skill”: Reflecting an intense focus on, and a technological understanding of, a few key categories, such as facial tissues, where the production process adds value of $1,900 per ton (Kimberly-Clark).
2 Exposure to regional growth opportunities, e.g., the 1.2 billion incremental consumers Nestlé forecasts to be able to afford packaged goods by 2010.
3 Stretching, that is, extending brands across categories, e.g., from Kellogg’s cereals to breakfast bars, from Kimberly-Clark’s baby diapers to adult incontinence products, or from L’Oréal’s women’s skin care products to skin care products for men.
4 A prolonged period of share stability in a market — these behemoths have been around a long time, and not just in their home markets. The longer a company has enjoyed market share stability, the more time it will have had to exploit that position by extending its distribution network and/or by more fully understanding consumer preferences.
Our thematic outlook is not without risk. The key risk to our behemoth theme is that some of the ten companies we have identified lose their ability to maintain brand leadership. We further note that our analysis does not consider stock-specific metrics such as valuation, EPS, and P/E ratios, or balance sheets, market capitalization, and liquidity. Accordingly, when making decisions, investors should view thematic analysis as only one input. Further, since this analysis employs a longer-term methodology, its results may differ from the conclusions of fundamental analysis.

Brand Behemoths – March 31, 2006
4
Professional brand management has been practiced for close to a century. However, it is likely that it is more difficult to build a brand today than it was only a few decades ago.
➤ First, it is increasingly difficult to reach consumers due to greater media fragmentation.
➤ Second, the number of brands is proliferating. According to the Harvard Business Review1, 30,000 new consumer products are launched each year — although more than 90% of them fail — which means increased competition for consumer mindshare, access to the distribution channel, and marketing dollars.
It is likely, then, that leading brands have become even more valuable given that they can offer some, or all, of the following attributes:
➤ Premium Pricing. An increased emphasis on price, often involving the heavy use of price promotions, is resulting in a growing number of commodity-like products. In this environment, leading brands can usually command relatively high margins by way of premium pricing, as well as reduced reliance on promotions. The power of brands to command superior pricing is well illustrated by the unusual case of Chivas Regal, which used a high price to turn itself into a premium brand. Chivas was a struggling brand until it decided to raise its price to be dramatically higher than competitors’, at which point its sales took off. Price clearly became a quality cue for this brand, as the product itself was not changed. More recently, Grey Goose redefined the vodka category and fueled the super-premium boom — the brand’s French provenance, the distinctive frosted bottle, and the wooden case all helped justify a hefty price to consumers.
➤ Economies of Scale. A market leader can operate at a more efficient volume and earn higher profits than a rival that commands a narrow market niche. So, for example, Procter & Gamble reaps tremendous economies of scale because of its leadership position in household products.
➤ Barriers to Entry. Once familiar with a brand, consumers are likely to exhibit a degree of brand loyalty, making it much more difficult for a competing product to succeed in the marketplace. It’s likely that loyalty explains why Wrigley has remained the dominant brand in its category for decades — after all, chewing gum is quite easy to manufacture. (Then, too, most consumers will only put in their mouths something that comes from a trusted company.)
➤ Brand Extensions. Brands can offer a company an opportunity for growth via brand extensions (e.g., Unilever’s extension of its Dove soap brand into deodorant and shampoo). A promotion of a new product will likely be more effective if the brand is familiar, and if there is no need to combat consumer skepticism about brand quality.
1 Clayton M. Christensen, Scott Cook, and Taddy Hall, “Marketing Malpractice,” Harvard Business Review, December 2005.
The key risk to our behemoth
Why Brands Matter
30,000 new consumer products are launched
each year, although more than 90% of them
fail.
The power of brands to command superior
pricing is well illustrated.
Most consumers will only put in their mouths
something that comes from a trusted company.

Brand Behemoths – March 31, 2006
5
➤ Leverage in the Distribution Channel. A leading brand is likely to enjoy superior product placement or preferred shelf space in retail outlets frequented by increasingly time-starved consumers.
➤ Growth Potential in Developing Markets. Standards of living are rising rapidly in developing economies. As a result, consumers in these markets have growing amounts of disposable income to spend on branded products, which are often valued because of the perceived quality they offer. That’s not to say, however, that there is a global market for strictly uniform products. To the contrary, varying global tastes explain why, for example, in India, Frito-Lay offers a Masala-flavored potato chip (seasoned with freshly ground spices) and, in Latvia, it offers a paprika-flavored chip.
Reflecting the increased scarcity of quality brands, some of the recent corporate takeover frenzy has been focused on companies that possess assets that are virtually impossible to build quickly: strong, well-regarded franchises. A June 23, 2005, Wall Street Journal article, “Buying Spree by China Firms Is a Bet on Value of U.S. Brands,” pointed out that:
In recent months, a string of Chinese electronics makers with little international name recognition have attempted to vault into American and European homes by buying Western brands. Chinese television-set maker TCL Corp. did it first, taking control of the manufacturing operations of RCA-brand owner Thomson SA of France. Then computer maker Lenovo Group bought the personal computer operations of International Business Machines Corp., of the U.S., earlier this year. And this month Taiwanese electronics maker BenQ Corp. took over the cell phone operations of Germany’s Siemens AG.
In addition, China’s Haier Group launched a bid for home-appliance icon Maytag Corp. The reason behind this trend, according to the June 2005 Journal, article is as follows:
The toughest challenge facing the Chinese companies that already make many of the world’s appliances and electronics: how to transition from low-cost, often no-name manufacturers to respected global brands [italics added].
In India, Frito-Lay offers a Masala-flavored potato
chip and, in Latvia, a paprika-flavored chip.
Recent takeover activity has been focused on
companies that possess assets that are virtually
impossible to build quickly: strong, well-regarded franchises.

Brand Behemoths – March 31, 2006
6
Looking for Brand Behemoths For some observers, it’s conventional wisdom that the “first immutable law of marketing” is that “it’s better to be first, than it is to be better.”2 For the most part, we disagree. Today, there are many companies that maintain brand dominance largely because they were first to market — Clorox and Coca-Cola are examples of two companies whose business models remain largely unchanged from their earliest days.
Then there are another set of companies that are dominant branders — these “brand behemoths” have the skill set necessary to continuously develop brands in multiple categories and multiple regions. They leverage a leadership position in one category or region and extend that franchise into new markets. Importantly, these companies succeed where many others fail — as outlined above, the failure rate of new products is more than 90%. (In addition, we note that, with advertising and production costs on the rise, failure in a product introduction is not an insignificant event.) As we discuss in detail below, brand behemoths offer the potential for growth, in sharp contrast to other branded companies that struggle to innovate beyond their core franchise.
But what is the skill set necessary for a company to be a dominant brander? How does a company establish brand leadership in one category or region and then leverage that position into other markets? In other words, what does it take to be a brand behemoth?
Those are some key questions we set out to address. Working with Citigroup Investment Research analysts, and with Professors Peter N. Golder and Joel H. Steckel of the marketing department at New York University’s Stern School of Business, we examined hundreds of companies in 30 consumer nondurable product categories across eight geographic regions. (Please see Appendix A for the biographies of Professors Golder and Steckel.) The result of our research is that we have identified ten brand behemoths — companies that we believe clearly demonstrate “branding skill” by their ability to expand market share across categories and regions (see Figure 1).
As part of the study of these ten companies, Citigroup Investment Research strategists and the relevant fundamental industry analysts sought the viewpoints of key personnel at the companies in order to gain a deep understanding of how they approach branding. We note that the Citigroup Investment Research analysts sought out the managers responsible for the development and implementation of branding strategies rather than investor relations contacts.
2 Al Ries and Jack Trout, The 22 Immutable Laws of Marketing (New York: HarperCollins, 1993).
“Brand behemoths” leverage a leadership
position in one category or region and extend that
franchise into new markets.
We examined hundreds of companies in 30
consumer nondurable product categories
across eight geographic regions.

Brand Behemoths – March 31, 2006
7
Figure 1. Ten Brand Behemoths
Colgate-Palmolive is adept at changing global consumer habits, most notably in the area of oral hygiene. It educates consumers (mainly in
developing regions) on the benefits of regularly cleaning their teeth with a toothbrush and toothpaste, and then expands their usage of oral hygiene products, e.g., into mouthwash and tooth whiteners.
Danone is skilled at branding some of the basic necessities (e.g., water and nutritious biscuits), for which there is strong demand in emerging
markets. In many countries without safe drinking water, Danone’s brands are a trusted source — it owns four of the world’s largest water brands,
and is the global market leader by volume. Danone’s biscuits are perceived as a cheap source of nutrition for low-income consumers in emerging
markets.
Kellogg is skilled at assimilating its ready-to-eat cereals into changing markets. It modifies its cereals to reflect 1) jaded taste buds (consumers
get tired of the same old cereal each day); 2) the latest consumer trends (e.g., demand for “healthy” products); and 3) demographic factors (e.g., an
aging population’s appetite for bran). The company has used its strong cereal franchise to support an expansion into breakfast snack bars.
Kimberly-Clark is intensely focused on a few key categories, which enables it to reap “economies of skill” in the manufacture of its products. Its
key tissue business accounts for more than half of revenues, in sharp contrast to some of its larger competitors that are much more diversified.
For diapers (about 20% of sales), the emerging markets of China and India offer tremendous potential as, for example, spreading urbanization
means that parents likely won’t want to risk an “accident” by their child in, say, a store or an office. Adult incontinence currently represents only
about 10% of revenues, but that segment should grow rapidly as Kimberly leverages the expertise gained in diapers to exploit the opportunity created by aging boomers in the Western world.
L’Oréal is notable for its innovation, a key factor that drives sales growth in developed markets by encouraging consumers to “trade-up.” So, it
has recently developed a “new and improved” lipstick (that stays on longer) and mascara (that makes eyelashes curlier). A shift in the company’s
portfolio towards skin care reflects, in part, L’Oréal’s focus on developing markets, such as China and India, where skin care — including whiteners and anti-blemish creams — is a major area of growth.
Nestlé has a deep understanding of the basic nutrition needs of global consumers, particularly those in emerging markets. When the company
was founded in 1867, infant formula was its first product, and milk, in all its forms, is still at the heart of Nestlé. The company has over a century
of experience in emerging markets — it was exporting to Latin America as far back as 1875, and established a presence in China in 1908. The
longevity of Nestlé’s history in some countries means that it is frequently perceived as a domestic company by locals, a factor that reinforces trust
in its brands.
PepsiCo assimilates its snack products by carefully adapting to local market conditions, which typically means catering to different taste
preferences in developing markets (e.g., a Masala-flavored potato chip in India, paprika-flavored in Latvia), and changing taste preferences in
developed markets (e.g., the current interest in “eating healthy” in the U.S., and preference for tasty snacks with relatively little fat).
Procter & Gamble is particularly skilled at analyzing, understanding, and modifying consumer behavior on a global basis. In developing markets,
P&G launches new product categories (e.g., laundry detergent) with value pricing, conditions consumers to use the product, and then encourages
those consumers to trade up to a more value-added version.
Unilever is notably successful in difficult categories and difficult markets thanks, in large part, to its expertise at assimilation. By carefully adapting
to local preferences, the company has the No. 1 market share position in most of the global food categories in which it competes. This is despite
the fact that, in contrast to many household products, it is generally difficult to migrate global consumers to higher-priced, branded, packaged
foods, reflecting sharp differences in local tastes. In fast-growth emerging markets that lack a conventional supermarket format, Unilever has a unique distribution infrastructure that reaches 6 million retail outlets throughout Asia and Africa.
Wrigley is adept at integrating chewing gum into societies where gum consumption was previously not part of the culture. In addition, thanks to
heavy spending on new product innovation, the company has been expanding its product line to offer a full range of fresh breath solutions e.g.,
thin-film breath strips and mints. Wrigley’s commanding market shares support high margins which, in turn, enable it to defend its position by way of 1) heavy advertising and 2) aggressive consumer promotions.
Source: Citigroup Investment Research

Brand Behemoths – March 31, 2006
8
In order to understand how we find ourselves in an environment in which 30,000 new consumer products are launched each year, it is instructive to briefly review the evolution of brands. The Oxford English Dictionary (OED) traces the word “brand” back to about the tenth century, when it connoted a burning piece of wood. By the 16th century, the word’s meaning had widened to include distinctive marks, including those made by burning the hide of animals with a hot iron in order to designate ownership (see Figure 2).
Figure 2. The Evolution of the Word “Brand”
Recorded Use Meaning
c. 950 A piece of wood that is, or has been, burning on the hearth.
1552 The mark made by burning with a hot iron.
1827 A trademark, whether made by burning or otherwise.
1854 A particular sort or class of goods, as indicated by the trademarks on them.
1958 The impression of a product in the minds of potential users or consumers.
Source: Oxford English Dictionary
The OED records that a mark (or brand) on a product (made by burning or otherwise), also came to indicate specific quality standards and genuineness. Trademarks were applied to casks of wine, timber, and metals, including gold. So, for example, trade guilds like the Goldsmith’s Company of London stamped all its goods. In this way, the use of a brand had primarily defensive connotations: trademarks on products were used to protect buyers from fraudulent goods.
While the word “brand” appears to have originated around the tenth century, the concept of a brand has certainly been around for much longer. For example, in ancient Rome some potters identified their products by imprinting their initials into the pot’s wet clay (see Figure 3), reflecting that pottery was sometimes sold far from the workshops where it was made, and buyers looked for the stamp of reliable potters as a guide to quality. Chinese porcelain was also brand-marked, as were metal tools and implements in ancient China.
The Origin of Brands
A brand came to indicate specific quality standards and genuineness.
While the word “brand” appears to have
originated around the tenth century, the
concept of a brand has certainly been around for
much longer.

Brand Behemoths – March 31, 2006
9
Figure 3. Roman Bronze Stamp Used as a Pottery Workshop Trademark (Initials C B V) second to fourth century AD
Source: Hixenbaugh Ancient Art
For centuries, however, factors that limited the development of brands as they are known today included the absence of mass-production techniques, inadequate transportation systems, the lack of printing technologies, and widespread illiteracy. It would take until the 18th century for those hurdles to be overcome.
Wedgwood: An Aspirational Brand It’s arguable that one of the first consumer brands, in the modern sense, was the pottery and china of Josiah Wedgwood. Of course, in the mid-18th century, a handful of luxury goods — such as Chippendale furniture and Meissen porcelain — were known by their manufacturer’s name, but Wedgwood succeeded in creating a mass market for his products.
Until Wedgwood, the vast majority of Britons ate off wood and pewter plates. The exception was the aristocracy who, in the early 18th century, ate off elegant, hand-painted china made by skilled artisans. But rising incomes in 18th century Britain meant that the lower classes had more money to spend on nonessential goods, including china. Those rising incomes were directly attributable to the Industrial Revolution in Britain, which boosted industrial productivity. At the same time, agricultural and commercial productivity also increased, while the nation’s international trade boomed too.
In a highly class-conscious society, a growing number of middle class Britons opted to use this increased income for the purpose of social emulation, i.e., imitating the habits and purchases of the classes above them. In that regard, the ultimate arbiters of fashion in 18th century England were aristocrats and the nobility. Significantly, like many companies today, Josiah Wedgwood understood the value of celebrity endorsement. So, thanks to gifts of his finest products, Wedgwood was appointed as “Potter to Her Majesty,” Queen Charlotte, wife of George III. Wedgwood was also commissioned by Catherine the Great of Russia to make a 50-person dinner and dessert service, consisting of 952 hand-painted pieces.
One of the first consumer brands, in the
modern sense, was the pottery and china of
Josiah Wedgwood.
Like many companies today, Josiah Wedgwood
understood the value of celebrity endorsement.

Brand Behemoths – March 31, 2006
10
Wedgwood outlined his “mass-market” strategy in a letter to a partner about the market for his vases:
The Great People have had their vases in their Palaces long enough for them to be seen and admired by the Middling Class of People, which class we know are vastly, I had almost said, infinitely superior in number to the Great, and though a great price was, I believe, at first necessary to make the vases esteemed Ornament for Palaces, that reason no longer exists. Their character is established, and the middling People would probably buy quantitys [sic] of them at a reduced price.3
Although it is improbable that Wedgwood ever used the word “brand” in the modern sense, he had a firm grasp of the concept, especially when it came to his own products. In another letter, he implicitly acknowledged that the demand for his china was driven by factors other than its “utility” and, instead, by what we would call today, the aspirational appeal of the brand:
It is really amazing how rapidly…[our china] has spread over almost the whole Globe, & how universally it is liked. How much of this general use, & estimation, is owing to the mode of its introduction & how much to its real utility & beauty? are questions in which we may be a good deal interested for the government of our future Conduct.…For instance, if a Royal, or Noble Introduction be as necessary to the sale of an Article of Luxury as real Elegance & beauty, then the manufacturer, if he consults his own interest will bestow as much pains, & expense too if necessary, in gaining the former of these advantages, as he would in bestowing the latter.4
With regard to an actual trademark, until about 1770, most British potters did not mark their products. The few manufacturers that did typically used signs, symbols, or the location of the factory as identifying marks. Wedgwood changed this practice in the late 1760s by impressing his own name in the wet clay. His earthenware was thus much less vulnerable to forgery and, perhaps, more importantly, every piece advertised the Wedgwood name.
While demand side factors were critical to Wedgwood’s success, innovations on the supply side were important too. As noted above, the hand-painted china used by the aristocracy was made by skilled artisans. However, novel manufacturing methods and organizational arrangements brought about by the Industrial Revolution facilitated the production of simpler, much less expensive, china for the masses. Wedgwood employed a division of labor in the manufacture of china and separated the production of useful ware from that of ornamental ware, with the workshops for both the useful and ornamental incorporating all the latest technologies.
Wedgwood also took advantage of advancements in transportation, so that finished goods traveled by ship and canal barge to burgeoning urban areas. In addition, taking advantage of greater levels of literacy, Wedgwood sought to reach out to households through company catalogs (see Figure 4) and newspaper ads. 3 Josiah Wedgwood to Thomas Bentley, August 1772, Wedgwood Manuscripts, Keele University Library. 4 Josiah Wedgwood to Thomas Bentley, September 1767, Wedgwood Manuscripts, Keele University Library.
Demand for Wedgwood’s china was driven by the
aspirational appeal of the brand.
By impressing his own name in the wet clay, he
was less vulnerable to forgery, and every piece
advertised the Wedgwood name.

Brand Behemoths – March 31, 2006
11
Figure 4. Page from the Wedgwood Useful Ware Catalogue, 1774
Source: Image courtesy of the Wedgwood Museum Trust, Barlaston, Staffordshire (England)
19th Century Branding: Quality and Reliability One hundred years later, the demand-supply environment in the U.S. was very similar to that in which Wedgwood first developed a mass market for his products. On the demand side, productivity gains spurred by industrialization raised Americans’ incomes, while urbanization reduced the reliance on self-production (and also helped increase literacy, with the percentage of illiterate Americans dropping from 20% in 1870 to 10% in 1900). In addition, women were entering the paid workforce in large numbers, which spurred demand for convenient processed foods although, as we discuss below, the quality and reliability of products was a critical factor in the minds of consumers. On the supply side, improvements in manufacturing and communications allowed the mass marketing of consumer products.
From Middlemen to Mass Production For most of the 19th century, wholesalers controlled the distribution of consumer products in the U.S. The major factor dictating the fragmented marketplace was the absence of a transportation and communication infrastructure spanning the continent. These middlemen bought in large quantities and sold in small ones, putting their own names on the products they offered. (Indeed, one business historian5 observed that “prior to the 1880s most manufacturers were unknown to the people who bought their products.”) But given that these small-scale middlemen supplied just a local market, the quality of products varied considerably from region to region, especially given that several suppliers’ products were often mixed together.
5 Richard Tedlow, New and Improved: The Story of Mass Marketing in America (New York: Basic Books, 1990).
Productivity gains, spurred by
industrialization, raised Americans’ incomes,
while urbanization reduced the reliance on
self-production.
Women entering the workforce spurred
demand for convenient processed foods.

Brand Behemoths – March 31, 2006
12
In the 1880s, new methods of manufacturing (such as mass production) led to greatly increased output, decreased costs, and standardized products for the makers of consumer goods. (As we discuss below, it wasn’t until production techniques became more flexible, after World War II, that market segmentation became feasible.) Continuous process machinery was invented almost simultaneously for making cigarettes, matches, flour, breakfast cereals, soups and other canned products, and photographic film.
At the same time, improvements in packaging facilitated the manufacture of individual (as opposed to bulk) packages. Some of these packaging improvements included the toothpaste tube (1890), an effective cap for soda bottles (1892), easily fillable cans (1898), and freshness-sealing packaging for crackers and cereals (1899).
On top of these developments, the branding of individual packages with a proprietary trademark could be achieved, in part, through the creative design of packaging, which no longer served the sole purpose of protecting the contents. High-speed lithographic presses and other printing advances facilitated the reproduction of colorful and distinctive labels.
The brands of many of the consumer product companies at the forefront of these various 19th century advances remain well-known today, including Borden, Campbell Soup, Carnation, Eastman Kodak, Heinz, Pillsbury Flour, and Quaker Oats. It was early in this period that the Moon and Stars began to appear as the unofficial trademark of Procter & Gamble (see Figure 5). Wharf hands used the symbol to distinguish boxes of Star Candles. By the 1860s, the Moon and Stars appeared on all P&G products and correspondence.
Figure 5. Procter & Gamble’s Moon and Stars Trademark
Source: Used with permission of Procter & Gamble
Two other factors that facilitated the development of a mass consumer market in the U.S. in the late 19th century were the continental railroad system and the telegraph network. Consumer goods companies came to realize that what they could distribute nationally, they could advertise nationally.
In the 1880s, mass production led to greatly
increased output, decreased costs, and
standardized products.
Improvements in packaging facilitated the
manufacture of individual packages.
Printing advances facilitated the
reproduction of colorful and distinctive labels.

Brand Behemoths – March 31, 2006
13
Advertising was quite prevalent throughout the 19th century, although among the most widely advertised consumer products were patent medicines, about which extravagant claims were often made. Medicine potions such as Swaim’s Panacea, Fahnestock’s Vermifuge, and Perry Davis’s Vegetable Pain Killer were well known brands to the public. Indeed, one study6 showed that, as late as 1893, more than half of a sample of 104 firms that spent more than $50,000 annually on advertising were patent medicine manufacturers. (Only seven of the companies in this 1893 sample of 104 firms would still be major national advertisers 20 years later — American Tobacco Company, Armour, Cudahy Packing, P. Lorillard, Procter & Gamble, Quaker Oats, and Remington Typewriters.)
By contrast, if their products were to survive and be successful, consumer goods companies needed to build a bond of trust with their customers by using advertising to establish the quality and reliability of their brands, especially when it came to products that many consumers had previously made for themselves (see Figure 6).
Another important factor supporting the emergence of consumer brands was the development of new retail institutions, such as department and variety stores and national mail-order houses. These retail outlets facilitated the introduction of branded products to large numbers of potential customers. Some of these retailers became brands in their own right. So, for example, Marshall Field’s Chicago department store was renowned for its high-quality products, as well as the superior customer service that his staff was known to offer.
Then, too, changes in U.S. trademark law made it easier to protect trademarks, which were key to brand identity. One business writer7 describes the evolution of U.S. trademark law as follows:
As the use of brand names and trademarks spread, so did the practice of imitation and counterfeiting. Although the laws were somewhat unclear, more and more firms sought protection by sending their trademarks and labels to district courts for registration. Congress finally separated the registration of trademarks and labels in 1870 with the enactment of the country’s first federal trademark law. Under the law, registrants were required to send a facsimile of their mark with a description of the type of goods on which it was to be used to the Patent Office in Washington along with a $25 fee.
6 Daniel Pope, The Making of Modern Advertising (New York: Basic Books, 1983). 7 Kevin Lane Keller, Strategic Brand Management (New Jersey: Prentice Hall, 2002).
The emergence of consumer brands was
supported by the development of
department stores.
In 1870, the country’s first federal trademark
law was enacted.

Brand Behemoths – March 31, 2006
14
Figure 6. Brand building: Quaker Oats, Heinz, Pillsbury’s
Quaker Oats, 1896: “Pure”
Heinz, 1902: “Cleanliness is the first consideration…”
Pillsbury’s, 1908: “When best quality and most delicious taste is a consideration”
Sources: Quaker Oats: Reprinted permission of The Quaker Oats Company; Heinz: H.J. Heinz Company, L.P., owner of the copyright to the advertisement (used with permission); Pillsbury’s: Courtesy of The J.M. Smucker Company

Brand Behemoths – March 31, 2006
15
Professional Brand Management In this first stage of brand development — which lasted from about 1870 until the early 1900s — it was, in many instances, determined firm owner-entrepreneurs who created nationally branded consumer products.
➤ Asa G. Candler, owner and chief executive from 1891 to 1916, made Coca-Cola a powerful national brand by focusing on building national distribution.
➤ King C. Gillette became obsessed with his idea of a disposable blade and, after much effort, finally succeeded in developing one.
➤ H.J. Heinz dedicated much of his time to the production advances and promotions that built up the Heinz brand name.
➤ Harley Procter, one of the founders of Procter & Gamble, named the firm’s white soap “ivory” after hearing a sermon based on the 45th Psalm: “All thy garments smell of myrrh, and aloes, and cassia, out of ivory palaces.”
In the second stage of brand development, which extended from about 1915 to 1929, the market leadership of certain brands in various categories was firmly established by specialized managers. To be sure, this was a golden age for brand owners: Consumers, grateful for the improved quality that brands offered, and more heavily influenced by advertising than consumers before — due to large marketing expenditures (see Figure 7) — gladly purchased branded products.
Figure 7. 20 Largest Advertisers in National Magazines in 1915
Rank Rank 1 Quaker Oats Co. 11 R.J. Reynolds Tobacco Co.
2 Willys-Overland Co. 12 Colgate & Co.
3 Procter & Gamble Co. 13 Cream of Wheat Co.
4 American Tobacco Co. 14 Postum Cereal Co.
5 Victor Talking Machine Co. 15 Maxwell-Chalmers Motor Car Co.
6 Liggett & Myers Tobacco Co. 16 Kellogg Toasted Corn Flake Co.
7 Goodyear Tire & Rubber Co. 17 Hudson Motor Car Co.
8 Eastman Kodak Co. 18 Studebaker Corp.
9 Joseph Campbell Co. 19 U.S. Rubber Co.
10 Cudahy Packing Co. (Old Dutch Cleanser) 20 Columbia Graphophone Co.
Source: Daniel Pope, The Making of Modern Advertising (New York: Basic Books, 1983)
Business historian Alfred Chandler writes that, by 1914, firms that employed “a hierarchy of middle and top salaried managers to monitor and coordinate the work of the [multiple] units…had become the dominant business institution in many sectors of the American economy.”8 These sectors included those in which brand development had flourished — canned foods, soap, and tobacco.
8 Alfred D. Chandler Jr., The Visible Hand: The Managerial Revolution in American Business, (Cambridge, MA: Harvard University Press, 1977).
In this first stage, firm owner-entrepreneurs
created nationally branded consumer
products.
In the second stage of brand development,
market leadership was firmly established by
specialized managers.

Brand Behemoths – March 31, 2006
16
The managers who managed such enterprises “form[ed] an entirely new class of businessmen” (in the words of Alfred Chandler). As the old visionary entrepreneurs retired, died off, or simply could not shoulder the increasingly technical and complex burdens of decision making, specialized professional managers assumed the responsibility for brand management.
Moreover, the belief that advertising agencies possessed key insights into demand creation for brands led executives to look to agencies for assistance on a wide range of activities, including market research, product testing, package development, consumer sales promotions, and creating advertisements. The intuitive and commonsense approaches that had previously characterized marketing functions gave way to systematic and knowledge-based approaches that promised more effective brand management.
The preeminence that brands achieved in consumers’ minds as a result of this more systematic approach to brand management was demonstrated by a research study in the early 1920s of “100 typical” consumer product categories. The respondents were 512 male and 512 female students from a sample of “15 representative universities” across the United States. The research was based on respondents’ unaided recall of brand names in the 100 product categories.
Figure 8 lists the 28 product categories for which more than 85% of the respondents recalled at least one brand. These categories ranged from inexpensive, simple items, such as chewing gum and canned milk, to costly products such as automobiles and sewing machines. Significantly, all of these categories were advertised heavily, usually for 20 years or more. A key conclusion of the authors of the study:
In the great majority of fields…practically every one discriminates between brands in making a purchase. The tendency to do so is far more common today than it was a few years ago [italics added]. In many lines it has come to be regarded as the simplest and surest way to obtain standard quality and service.9
9 George B. Hotchkiss and Richard B. Franken, The Leadership of Advertised Brands, (New York: Doubleday, 1923).
As the old visionary entrepreneurs retired,
specialized professional managers assumed
responsibility for brand management.
Intuitive and commonsense
approaches gave way to systematic and
knowledge-based approaches.

Brand Behemoths – March 31, 2006
17
Figure 8. Product Categories with a High Degree of Brand Familiarity in 1923 category and best known brand in category
Category
Familiarity With Brands in Category (% of Respondents) Best Known Brand(s)*
Chewing Gum 96.0% Wrigley
Automobiles 95.3 Ford
Soap 95.1 Ivory
Baked Beans 93.6 Heinz
Watches 92.6 Elgin, Waltham
Soup 92.4 Campbell
Toothpaste 92.2 Colgate
Sewing Machines 92.1 Singer
Pens 91.8 Waterman
Phonographs 91.7 Victor (RCA), Edison
Breakfast Food 91.3 Kellogg’s Corn Flakes
Cameras 90.7 (Eastman) Kodak
Cleanser 90.5 Old Dutch
Flour 90.4 Gold Medal
Bacon 89.8 Swift Premium, Beech-Nut
Chocolates 89.8 Hershey’s
Crackers 89.7 National Biscuit Co.
Cocoa 89.5 Baker’s
Toilet Soap 89.4 Palm Olive
Talcum Powder 89.0 Mennen, Colgate
Candy 88.7 Huyler’s
Cigarettes 88.3 Camel, Fatima
Typewriters 88.0 Underwood, Remington
Tires 87.4 Goodyear
Coffee 86.8 Yuban
Shoes 86.6 Douglas
Canned Milk 86.5 Borden, Carnation
Laundry Soap 85.9 Fels Naptha
*Brands in boldface were mentioned by more than twice as many respondents as other brands in their categories. Italicized brands had only weak leadership. Where two brands are mentioned, both were close in familiarity but led all others.
Source: George B. Hotchkiss and Richard B. Franken, The Leadership of Advertised Brands, (New York: Doubleday, 1923).

Brand Behemoths – March 31, 2006
18
Postwar Market Segmentation The sharp drop in incomes during the Great Depression, and the rationing introduced during World War II, curbed consumer demand for all goods, including branded products. Reflecting this unfavorable demand environment, advertising volumes peaked in 1929, fell sharply thereafter, and did not regain the 1929 peak until 1947 (see Figure 9).
Figure 9. Volume of Advertising per Capita
$0
$10
$20
$30
$40
1860 1870 1880 1890 1900 1910 1920 1 9 3 0 1 9 4 0 1950
Source: Historical Statistics of the United States
The economic boom that followed the end of World War II fueled increases in personal income, the birth rate, and the growth of the suburban middle class. These demand trends were immensely positive for brands.
On the supply side, continuing the prewar trend, branding spread to more categories, including women’s apparel and home furnishings. In addition, an explosion of new consumer products, following the raw material shortages and rationing during World War II, as well as the impact of television, further increased the importance of brands.
Then too, as post war shortages eased, manufacturers were able to take advantage of the latest advances in manufacturing technologies, which permitted more diverse output. Techniques for altering the mix of raw materials became more widespread, as did means of packaging and labeling different product sizes and assortments. In addition, automatic control machinery could rapidly change the mix of products a plant turned out without greatly increasing costs.
The focus of consumer marketing in this next phase of branding became market segmentation (as opposed to the unification of the market by a dominant brand). Marketers used considerations such as demographics (age, income, and education) and psychographics (lifestyle) to create divisions in markets that they could exploit.
The economic boom that followed the end of
World War II was immensely positive for
brands.
New techniques for altering the raw materials
mix, and new means of packaging and labeling different product sizes
and assortments, became more
widespread.
Marketers used demographics and psychographics to create divisions in
markets.

Brand Behemoths – March 31, 2006
19
These segments had to be sufficiently large so that scale economies could be obtained. The goal, however, was not only to achieve scale economies, but also to gain the freedom to price in accord with the special value that a particular market segment placed on the product.
To be sure, market segmentation was not entirely a post–World War II concept, although, for the reasons outlined above, its practice exploded in the postwar years. In 1920, Alfred P. Sloan recognized the profit potential in marketing variations and features that could be added onto the basic vehicle manufactured by General Motors. Sloan decided that General Motors should:
[first], produce a line of cars in each price area from the lowest price up…; second, that the price steps should not be such as to leave wide gaps in the line, and yet should be great enough to keep their number within reason…; and third, that there should be no duplication by the corporation in the price fields or steps.10
Five brand names would each focus on a different segment with a distinct product offering, with Chevrolet at the bottom (offering lower-priced quality cars), and Cadillac at the top (being the standard of luxury). Chevrolet was intended to compete directly against the stripped-down basic transportation of Ford’s Model T. As a result of this market segmentation strategy, General Motors’ sales rose quickly in the 1920s, while Henry Ford continued to insist that the customer could have a car in any color he wanted as long as it was black.
As noted above, it was in the postwar years that market segmentation became widely embraced. Procter & Gamble became an adept practitioner of the strategy (see Figure 10), which goes a long way toward explaining how the company today holds a 50%-plus share of the mature laundry detergent category in the U.S.
Figure 10. Market Segmentation in Laundry Detergent ten Procter & Gamble brands have targeted different market segments
Ivory Snow “Mild, gentle soap for diapers and baby clothes”
Tide For extra-tough family laundry jobs
Cheer Works in cold, warm, or hot water
Gain Originally an “enzyme” detergent but now a detergent with a fragrance
Bold Includes fabric softener
Dash Concentrated power, less suds to avoid clogging washing machines
Dreft With “Borax, nature’s natural sweetener” for baby’s clothes
Oxydol Contains bleach — for “Sparkling whites — with color-safe bleach”
Era Concentrated liquid detergent — with proteins to clean stains
Solo Heavy-duty, with a fabric softener
Source: David A. Aaker, Managing Brand Equity (New York: The Free Press, 1991)
10 Alfred P. Sloan, Jr., My Years with General Motors (New York: Macfadden-Bartell, 1965).
In 1920, GM’s Alfred P. Sloan recognized the
profit potential in marketing variations and
features.
It was in the postwar years that market
segmentation became widely embraced.

Brand Behemoths – March 31, 2006
20
In the soft drinks sector, while Coca-Cola was slow to embrace market segmentation, Pepsi-Cola was not. Until 1955, Coca-Cola was available in only two forms — at the soda fountain and in the traditional 6.5-ounce, hobble-skirted bottle. In the words of one business historian, “Coke was, the company believed, perfect for everyone. There was no need to devote special attention to one group or another.” 11 (In addition, as recently as 2003, one financial analyst wrote, “Coca-Cola has tended to focus on one Global marketing message at a time rather than targeting consumers based on geographic or demographic differences.”12)
By contrast, Pepsi’s advertisements in the 1950s did not tout the product as much as they did the context in which the product was consumed: “Be sociable, look smart. Keep up to date with Pepsi” rang one jingle from the 1950s. This strategy was refined with the inauguration of the “Pepsi Generation” in the 1960s, which targeted the postwar baby boomers, then in their teenage years (see Figure 11). So, unlike Coke, Pepsi was about variety and change. (Note that market segmentation was greatly facilitated by the advent of television — it is hard to imagine the Pepsi Generation without television advertising.)
Figure 11. “Come Alive! You’re in the Pepsi Generation!”
Source: PEPSI and PEPSI-COLA are registered trademarks of PepsiCo, Inc. Used with permission.
11 Richard Tedlow, New and Improved: The Story of Mass Marketing in America (New York: Basic Books, 1990). 12 See Bonnie Herzog’s March 6, 2003, report, “The Coca-Cola Company.”
While Coca-Cola was slow to embrace market
segmentation, Pepsi-Cola was not.
Market segmentation was greatly facilitated by the advent of television.

Brand Behemoths – March 31, 2006
21
Figure 12. A Branding Timeline notable dates in the development of branding
0 A.D. Trademarks on Roman pottery.
900 Brand-marked metal tools in China.
1266 English law requires bakers to put their mark on every loaf of bread.
1597 Two English goldsmiths nailed to pillory by their ears for marking their wares falsely.
1665 Mark of ownership impressed on cattle by branding in American colonies.
1700 Technological advances facilitate the inexpensive printing of handbills and posters.
1722 Unique symbol used to distinguish Meissen porcelain from other manufacturers.
1770 Josiah Wedgwood begins to brand his china.
1850 The “Moon and Stars” begins to appear as the unofficial trademark of Procter & Gamble.
1870 First U.S. trademark law.
1870–1900 Nationally branded consumer products established in U.S. by firm owner-entrepreneurs.
1880-1890 Continuous process machinery invented.
1890–1900 Advances in packaging. Development of high-speed lithographic presses.
1893 Advertising in U.S. still dominated by ads for patent medicines.
1915–1928 Explosion of brands thanks to professional brand management.
1920 Alfred P. Sloan develops market segmentation by General Motors.
1929 Great Depression begins. Advertising spending collapses.
1939-1945 Many brands become relatively scarce during World War II.
1945- Post war explosion of brands driven, in part, by market segmentation.
Source: Citigroup Investment Research

Brand Behemoths – March 31, 2006
22
Behind Branding To review, key factors behind the evolution of brands through the ages (see Figure 12) include:
➤ Quality assurance. A mark (or brand) on products, ranging from casks of wine to metals, which came to indicate specific standards and genuineness.
➤ Mass-market products. In the late 19th century, continuous process machinery was invented almost simultaneously for making cigarettes, matches, flour, breakfast cereals, soups and other canned products, and photographic film.
➤ A sprawling distribution network. The continental railroad system facilitated the development of a mass consumer market in the U.S.
➤ A close relationship with a retail system. Department and variety stores and national mail-order houses aided in the introduction of branded products to large numbers of potential customers.
➤ A judicious use of advertising. In the 19th century, consumer goods companies needed to build a bond of trust with their customers, especially when it came to products that many consumers had previously made for themselves.
➤ Careful protection of brand identity. As the use of brand names and trademarks spread, so did the practice of imitation and counterfeiting; changes in U.S. trademark law made it easier to protect trademarks.
➤ Innovation. King C. Gillette became obsessed with his idea of a disposable blade and, after much effort, finally succeeded in developing one.
➤ Management focus. In the second stage of brand development, which occurred during the first decades of the 20th century, the intuitive and commonsense approaches that previously had characterized marketing functions gave way to systematic and knowledge-based approaches.
➤ Market segmentation. In the post–World War II years, marketers used considerations such as demographics and psychographics to create divisions in markets that they could exploit with competitive advantages.
➤ An aspirational element surrounding certain brands. As Josiah Wedgwood implicitly acknowledged, the demand for his china was driven by factors other than its “utility.”
The Importance of Intangibles By the late 20th century, what often determined the value of a brand was not so much the tangible factors outlined above — many of which were easily replicated (e.g., mass market products, advertising, etc) — as it was intangible factors such as quality, brand identity, innovation, and aspirations.
By the late 20th century, the value of a brand was not so much in tangible
factors, as it was in intangibles.

Brand Behemoths – March 31, 2006
23
Quality In 1989, Perrier dominated the market for bottled water, with almost a 50% share. Indeed, so strong was the brand power that, for many consumers, “Perrier” was synonymous with “bottled water.” However, in 1990, Perrier recalled its product worldwide after it was found to be contaminated by traces of benzene, a suspected carcinogen.
When the supply of Perrier was interrupted, consumers had to sample other brands, which they found were as good as or better than Perrier. Although Perrier rebounded from this fiasco, it never regained its previous market preeminence. (The Perrier brand is currently owned by Nestlé, but it is estimated that it accounts for just 6% of Nestlé’s total global water sales. So, for example, in the U.S. water market, where Nestlé is the leader by a wide margin, Poland Spring is a key brand.)
Schlitz suffered a much worse fate than Perrier. In 1976, Schlitz was the No. 2 premium beer brand in the U.S., with 16.1% of the market, as compared to 19.5% for Anheuser-Busch and 12.2% for Miller. In 1977, the Schlitz firm lost the No. 2 position to Miller, and by 1986 the brand had all but disappeared. (Today, Miller is still the No. 2 brand, behind Anheuser-Busch).
The simple reason behind the downfall of Schlitz was the decision by management in 1974 to reduce costs by changing the beer production method, and by substituting corn syrup for barley malt. Although the company’s belief was that the average beer drinker could not tell the difference between the taste of the new, cheaper beer and the original beer, the new beer did have a lighter taste and sales fell. The Joseph Schlitz Brewing Company limped along until 1982 when it was acquired by Stroh.
Brand Identity An inadequate commitment to a brand’s identity can take the form of either a muddled advertising strategy or a muddled corporate strategy. The example of Smirnoff below illustrates the first situation, while the example of IBM’s PCs illustrates the second.
Although it had been the leading brand for several decades, Smirnoff’s share of the U.S. vodka category peaked at 22% in 1974 and declined steadily thereafter, losing share to competitors such as Absolut and Stolichnaya. A key factor behind its market share loss was that Smirnoff’s advertising was not consistent over time, with 14 different advertising campaigns between 1953 and 1994 (and at least ten since 1978), each with different themes and visual imagery: The “self-expression” campaign was a reaction to the cultural changes of the Vietnam and Woodstock era; the “quality/value” theme was in direct response to a recession, and the “reigning vodka” theme attempted to defend the upscale position threatened by Absolut. As marketing professor David A. Aaker writes:
Because of the endless changes…it was usually unclear what Smirnoff stood for. The Smirnoff identity was muddled in terms of its personality, its visual image, its value proposition, and the basis of its relationship with the customer.13
13 David A. Aaker, Building Strong Brands (New York: The Free Press, 1996).
In February 1990, Perrier recalled its product
worldwide after it was found to be
contaminated.
The simple reason behind the downfall of
Schlitz was substituting corn syrup for barley
malt.
Smirnoff’s advertising was not consistent over
time, with 14 different advertising campaigns
between 1953 and 1994.

Brand Behemoths – March 31, 2006
24
With regard to a muddled corporate strategy, Apple was the dominant firm in the personal computer (PC) market in the late 1970s. When IBM entered the market, it quickly surpassed Apple, thanks to IBM’s brand name, which, at the time, represented quality, leading-edge products supported by outstanding service. However, as the PC grew in popularity, IBM felt that it threatened its core mainframe computer franchise. So the firm was not as willing as others to promote the growth of PCs, and it eventually lost its market leadership position to competitors, the most notable of which, in recent years, has been Dell.
Innovation In the 1980s, CompuServe and Prodigy lost their leadership positions in the online community sector to America Online, which offered something new and improved. Before AOL’s entry, CompuServe and Prodigy were leading brands catering to a niche market of sophisticated users; so, for example, CompuServe provided valuable financial information for investors, although in a hard-to-use format.
At the same time that its competitors cultivated niche markets, AOL worked to create a mass market of users by emphasizing community, a simple interface, and easy installation. As we now know, AOL was ultimately so successful that it acquired CompuServe, and pushed Prodigy into insignificance.
Aspirations Weight Watchers (then owned by Heinz) was one of the great brand success stories of the 1980s. Heinz had acquired Weight Watchers in the late 1970s in an effort to capitalize on a heightened concern with health and fitness by obtaining a brand with a strong association with professional weight control. This turned out to be a good investment, as the health and fitness trend was one of the growth areas of the 1980s.
In the late 1980s, however, consumer interest in weight control was eclipsed by a broader concern about a healthy diet. Many processed foods were high in fat and sodium, which have been linked to heart disease. Along came Healthy Choice (from ConAgra), a brand designed to address this new market opportunity. The brand’s objective was to minimize fat and control the level of other undesirable components, such as cholesterol and sodium, while simultaneously offering tasty products.
Purchasers of Weight Watchers products, which were positioned more as weight control brands, represented the target market of Healthy Choice because many of the consumers interested in weight control were the same individuals that were concerned about overall health. So, reflecting these new health concerns, Healthy Choice was one of the most successful new brands in the 1990s, although it did not entirely displace Weight Watchers.
Similarly, in the mid-1980s, increasingly health-conscious customers associated Kentucky Fried Chicken with high fat and cholesterol content, and began to patronize restaurants offering healthier alternatives, such as Boston Market.
IBM felt that PCs threatened its core
mainframe computer franchise, and so it
eventually lost its market leadership position in
PCs to competitors.
AOL worked to create a mass market of users by emphasizing community,
a simple interface, and easy installation.
In the late 1980s, consumer interest in
weight control was eclipsed by a broader
concern about a healthy diet.

Brand Behemoths – March 31, 2006
25
It’s Not Enough Just to Be First Not surprisingly then, brand leadership is not stable over time. Figure 8 illustrated perceived brand leaders in 1923. While many of the brand names are still familiar today, a detailed study showed that, by 1997, more of the leading brands in 1923 had failed (28%) than had remained leaders (23%) — see Figure 13.
Figure 13. Long-Term Success Rate of 1923 Market Leaders market rank in 1997
23%
8%9%
8%7%
1 6 %
28%
0%
10%
20%
30%
N u m b e r 1 N u m b e r 2 N u m b e r 3 Top 5 T o p 1 0 B e l o w 1 0 Fa i l ed
Source: Peter N. Golder, “Historical Method in Marketing Research with New Evidence on Long-Term Market Share Stability,” Journal of Marketing Research, May 2000
These data are a sharp refutation of the aforementioned “first immutable law of marketing” — that “it’s better to be first, than it is to be better.” According to this thesis, a firm’s probability of surviving and its share of market are in proportion to the order in which it enters a market. The firm that first enters a market is believed to have enormous advantages in terms of long-term market leadership.
However, Professor Golder believes that it’s not that simple. In his book Will and Vision: How Latecomers Grow to Dominate Markets14 (co-authored with Gerard J. Tellis), he argues that:
Market pioneers rarely endure as leaders. Most of them have low market share or fail completely. Actually, market pioneering is neither necessary nor sufficient for enduring success. The real causes of enduring market leadership are vision and will. Enduring market leaders have a revolutionary and inspiring vision of the mass market, and they exhibit an indomitable will to realize that vision. They persist under adversity, innovate relentlessly, commit financial resources, and leverage assets to realize their vision.
Although Professor Golder’s book is focused on the subject of “how latecomers grow to dominate markets,” in our view, the characteristics he outlines above apply just as well to what we label “brand behemoths” who may be latecomers to, or pioneers in, various categories and regions:
They persist under adversity, innovate relentlessly, commit financial resources, and leverage assets to realize their vision.
14 Gerard J. Tellis & Peter N. Golder, Will and Vision: How Latecomers Grow to Dominate Markets (New York: McGraw-Hill, 2002).
By 1997, more of the leading brands in 1923
had failed (28%) than had remained leaders (23%).
These data provide a sharp refutation of the “first immutable law of marketing” — that “it’s
better to be first, than it is to be better.”
“Market pioneers rarely endure as
leaders…market pioneering is neither
necessary nor sufficient for enduring success.”

Brand Behemoths – March 31, 2006
26
A Unique Database As noted, we define a “brand behemoth” as a company that can leverage a leadership position in one category or region and extend that franchise into new markets. In our search for brand behemoths, we could, of course, have taken a subjective approach. Instead, we chose to be more rigorous, and so, working with Professors Golder and Steckel, we constructed a unique database.
Current academic research on brand leadership tends to be based on U.S. data only, with little known about brand leadership on a global basis. However, Euromonitor International’s Integrated Market Information System (IMIS) offers market shares across many categories and countries. The traditional use of these data is for brand managers to perform analysis within their own individual categories. We are not aware of any publicly available study that, until now, has used similar data to understand brand leadership on a global basis.
Utilizing this database, we gathered global market share data for 30 consumer nondurable product categories — see Figure 14. (Note here that, in the opinion of Citigroup Investment Research analysts, given that we only focus on 30 categories and exclude others, our analysis may underestimate the extent to which some companies truly are brand behemoths.)
Figure 14. 30 Consumer Nondurable Product Categories
Food, Beverages, and Tobacco Household Products
Baby Food Functional Drinks Bath & Shower
Beer Gum Color Cosmetics
Biscuits Ice Cream Deodorant
Bottled Water Ready Meals Diapers
Breakfast Cereals Sauces & Dressings Facial Tissues
Carbonates Soups Hair Care
Chocolate Confectionery Spirits Laundry Care
Cigarettes Sweet & Savory Snacks Oral Hygiene
Coffee Tea Surface Care
Fast Food Yogurt
Fruit/Vegetable Juice
Source: Citigroup Investment Research
We aggregated 2004 market share data by company based on over 3,500 brands that compete in the 30 product categories. We then sorted the data into eight regions/countries: China, East Asia, Eastern Europe, India, Japan, Latin and South America, the U.S., and Western Europe. (Note that, for the regions, we simply focused on those countries that, combined, account for 75%-plus of a region’s GDP. So, for example, “Western Europe” represents market share data for Germany, the U.K., France, Italy, and Spain.)
Identifying Brand Behemoths
The traditional use of these data is for brand
managers to perform analysis within their own
individual categories.
We aggregated 2004 market share data by
company based on over 3,500 brands that compete in the 30
product categories.

Brand Behemoths – March 31, 2006
27
Given that we examined 30 product categories in eight regions, there are 240 category/region combinations for companies to compete in. We then asked Professors Golder and Steckel to forecast the market leaders in 2010 for the 240 category/region combinations. Their methodology is discussed in detail in Appendix B. As explained in that appendix, the 2010 market share forecasts are based on four primary factors (as well as many ancillary factors):
1 A company’s current market share, as well as its market share advantage over the No. 2 and No. 3 companies. (The larger a company’s market share advantage over its nearest competitors, the more likely it is to continue its lead.)
2 A company’s global and regional market shares. (A company that is strong globally or locally can leverage its knowledge into other markets.)
3 A company’s leadership position in more than one category. (This enables companies to, for example, leverage their distribution systems.)
4 A company’s market share stability (or lack thereof) over time.
The forecasts of the market leaders in the 240 category/region combinations in 2010 are contained in Appendix C. Figure 15 lists companies that are forecast to have at least four leadership positions in 2010.15
Figure 15. 2010 Brand Leaders: Total Number of No. 1 Positions in 240 Category/Region Combinations companies with at least four projected No. 1 market share rankings
Unilever 38 Kellogg 6
Nestlé 17 Colgate-Palmolive 5
Procter & Gamble 14 Kraft Foods Inc. 5
Coca-Cola 11 Lotte Group 5
PepsiCo 10 McDonald’s 5
Danone 9 L’Oréal 4
Kimberly-Clark 9 Wrigley 4
Source: Professors Peter N. Golder and Joel H. Steckel and Citigroup Investment Research
Brand Leaders and Brand Behemoths The 14 brand leaders listed in Figure 15 have competed in various markets for decades, have successful brands, and have enjoyed No. 1 market positions for some time. So, all of them are potential brand behemoths. However, in the opinion of Citigroup Investment Research analysts, only ten of these companies have the skill set necessary to be classified as a brand behemoth.16
15 Note that these forecasts do not include any assumptions about mergers and acquisitions that could lead to a material change in rankings. M&A has been a part of some companies’ expansion strategies in the past, and could well occur again in the future. 16 The four brand leaders that we do not make a case for as brand behemoths are Coca-Cola, Kraft Foods, Lotte Group, and McDonald’s. Citigroup Investment Research does not follow Lotte Group or McDonald’s. With regard to Coca-Cola (2M), the company already has a dominant position in carbonated soft drinks — and is the leader in that mature category in all eight regions we studied — but, in the opinion of Citigroup Investment Research analyst Bonnie Herzog, it has not experienced much success in extending its brand name across other categories. In addition, while Kraft Foods (2M) has an interesting portfolio of brands, questions remain in the mind of Citigroup Investment Research analyst David Driscoll about the company’s marketing commitment to those brands, especially in light of cuts to its advertising budget in recent years.
We forecast the market leaders in the 240
category/region combinations in 2010.

Brand Behemoths – March 31, 2006
28
Importantly, a key implication of Figure 15 is that brand behemoths are far from mature. The ten companies are projected to have the No. 1 position in less than half (48%) of the 240 category/region combinations by 2010 (see Figure 16).
Figure 16. Number of Projected No. 1 Positions Held by Ten Brand Behemoths in 240 Categories/Regions for 2010
Unilever
Nestle
Procter & Gamble
PepsiCo
Danone
Kimberly-Clark
Kellogg
Colgate-Palmolive
L'Oreal
Other(124 positions held by
88 companies)
Wrigley
Source: Professors Peter N. Golder and Joel H. Steckel and Citigroup Investment Research
To be sure, the dominance of brand behemoths has been growing over time, and it is forecast to continue to increase. As Figure 17 illustrates, the ten brand behemoths had the No. 1 position in more than 46% of the 240 category/region combinations in 2001 and in 47% of the category/region combinations in 2004, and that number is forecast to rise to 48% in 2010.
Figure 17. Percent of No. 1 Positions Held by Ten Brand Behemoths in 240 Categories/Regions cumulative number held by Unilever, Nestlé, Procter & Gamble, PepsiCo, Danone, Kimberly-Clark, Kellogg, Colgate-Palmolive, L’Oréal, and Wrigley
46.7%
47.1%
48.3%
45%
50%
2000 2001 2002 2003 2004 2005 2006 2007 2008 2009 2010e
Source: Citigroup Investment Research, Euromonitor International, and Professors Peter N. Golder and Joel H. Steckel
Looking at all of the companies in our 240-cell matrix (i.e., eight regions multiplied by 30 product categories), and not just a subset of brand behemoths, we also find that brand leadership is fluid, albeit viscous (i.e., slowly changing.) Between 2001 and 2004, the brand leader changed in only 23 of the 240 category/region combinations. Based on the modeling of Professors Golder and Steckel, there are forecast to be just 17 leadership changes between 2004 and 2010.
The dominance of brand behemoths has been
growing over time, and it is forecast to continue to
increase.

Brand Behemoths – March 31, 2006
29
Four Key Factors As noted above, the 2010 market share forecasts made by Professors Golder and Steckel are based on four primary factors that drive brand dominance:
1 A distinct competitive advantage (as reflected by a large market share lead);
2 Exposure to regional growth opportunities;
3 “Stretching,” or extending brands across categories; and
4 A prolonged period of share stability in a market (with brand leadership being viscous, it takes time to expand into a new region or category).
Below we discuss these four factors in detail in the context of the ten brand behemoths as they execute brand leadership on a global basis. Note here that, as our review of the evolution of brands illustrated, these four factors have been significant in the development of brands over time.
➤ We discuss below the way in which one of Kimberly-Clark’s competitive advantages is its “economies of skill” in the manufacture of key products. So, too, did Josiah Wedgwood enjoy economies of skill in the manufacture of china. Moreover, as we discuss below, a distinct advantage of L’Oréal is its ability to develop “new and improved” products that encourage consumers to “trade up,” just as Wedgwood’s functional china was a distinct improvement on the wood and pewter plates that the vast majority of Britons ate off of prior to the mid-18th century.
➤ While many of the brand behemoths seek to exploit growth opportunities in emerging markets overseas, the regional growth opportunity for Wedgwood (based in rural Staffordshire) was in burgeoning urban areas. Wedgwood took advantage of advancements in ship and barge transportation to reach those markets. So, too, did American firms exploit the continental railroad system to develop a mass consumer market in the U.S. in the late 19th century.
➤ Successfully stretching its brand into the PC segment would have been a good strategy for IBM, but one on which the company did not execute well.
➤ After determined firm-owner entrepreneurs created nationally branded consumer products in the first phase of brand development (1870–1900), specialized managers leveraged those positions in the next phase.
As our review of the evolution of brands
illustrated, four factors have been significant in their development over
time.

Brand Behemoths – March 31, 2006
30
The ten brand behemoths enjoy a market share advantage over their closest competitor of 18 percentage points, on average, in the selected categories in which they compete (see Figure 18). So, for example, of the 240 category/region combinations that we examined, Unilever had the No. 1 position (greatest market share) in 34. On average, the No. 2 company trailed Unilever by 13 percentage points, with Unilever’s largest market share advantage a significant 52 percentage points (in deodorant in India), and its smallest market share advantage being less than 1 percentage point (in ice cream in Eastern Europe).
Figure 18. Market Share Advantage of Brand Behemoth over No. 2 Company (2004)
Number of No. 1
Regional Categories Mean Share Advantage
Max Share Advantage
Min Share Advantage
Colgate-Palmolive 6 13% 43% 1%
Danone 9 11 25 2
Kellogg 6 16 30 3
Kimberly-Clark 9 29 55 5
L’Oréal 3 19 23 15
Nestlé 16 14 72 0
PepsiCo 10 26 67 3
Procter & Gamble 16 10 39 0
Unilever 34 13 52 0
Wrigley 4 33 46 25
Average 18% 45% 5%
Source: Citigroup Investment Research and Euromonitor International
As we discuss below, driving these commanding market share leads of the brand behemoths are distinct strengths including:
➤ “Branding the Basics” — Benefiting from the growing number of global consumers who can afford the most basic packaged foodstuffs (Nestlé and Danone).
➤ “Globally Local” — A strategy that stimulates consumers’ purchases of more advanced packaged foodstuffs by carefully adapting products to local market conditions (Unilever, PepsiCo, and Kellogg).
➤ “Behavior Modification” — Changing consumer habits, e.g., from cleaning teeth with a stick to using a toothbrush, and from washing hair with soap to using shampoo (Colgate-Palmolive, Wrigley, and Procter & Gamble).
➤ “New and Improved Products” — Driving sales growth by encouraging consumers to “trade up” (L’Oréal).
➤ “Economies of Skill” — Reflecting an intense focus on, and technological understanding of, a few key categories (Kimberly-Clark).
A Distinct Competitive Advantage
The ten brand behemoths enjoy a
market share advantage over their closest competitor of 18
percentage points, on average.

Brand Behemoths – March 31, 2006
31
Branding the Basics The number of people in the world who can afford packaged goods is forecast to increase from 3.68 billion in 2000 to 4.85 billion in 2010, an increase of 32% (see Figure 19).
Figure 19. Number of Global Consumers Who Can and Cannot Afford Packaged Goods in billions; based on purchasing power parity income levels
2.79 bn3.68 bn 4.85 bn
0
2
4
6
8
1990 2000 2010E
Can AffordCannot Afford
Source: Nestlé
Driving this forecast is a clear relationship between GDP per capita and food expenditures per capita (see Figure 20) — Franck Riboud, chairman and CEO of Danone observes that “consumption per capita is directly linked to the money you can spend on food.”
Figure 20. GDP per Capita and Food Expenditures per Capita in 2003
Bolivia
ChinaColombia
IndiaIran
Peru
Thailand Chile
MexicoCzech Republic
Spain Italy Canada
Australia
France
Austria Sweden
Japan
Netherlands
U.S. Norway
Finland
$0
$500
$1,000
$0 $10,000 $20,000 $30,000 $40,000 $50,000
Food ExpenditurePer Capita
GDP Per Capita
Source: United Nations Statistics Division
When disposable incomes increase in developing markets, consumers spend more on food products and “trade up” the value chain. In other words, at very low levels of income, a significant portion of that income is spent on the most basic necessities (e.g., milk bought from a local farmer). As income levels rise, consumers can afford to buy branded packaged goods that offer basic necessities in a convenient format (e.g., powdered and condensed milk).
The number of people in the world who can afford
packaged goods is forecast to increase 32%
by 2010.
As income levels rise, consumers can afford to
buy branded packaged goods that offer basic
necessities in a convenient format.

Brand Behemoths – March 31, 2006
32
Reflecting these trends, Nestlé forecasts that, in Asia, there will be by 2010:
➤ 120 million additional people who can afford packaged goods on a regular basis (up 6% versus 2000),
➤ 630 million additional people for whom convenience and pleasure in food products matters (up 95% versus 2000), and
➤ 100 million additional people with a per capita income of $30,000 who are looking for the most advanced products and services (up 74% versus 2000).
As we discuss in detail below, the millions of additional consumers who can afford packaged goods on a regular basis present a tremendous opportunity to Nestlé and Danone, both of which have proven adept at branding the most basic necessities, including infant formula, dairy products, and water.
Milk, in all its forms, is at the heart of Nestlé. Indeed, when the company was founded in Switzerland in 1867, Henri Nestlé’s first product was infant formula. Even though Nestlé has subsequently become a sprawling, multinational company, it is still the dominant leader in infant nutrition (25% global share) and powdered and condensed milk (40%–50% share), with these three categories accounting for close to 20% of sales (see Figure 21).
Figure 21. Nestlé: Selected Portfolio Analysis for 2004
Global Share
Global Rank
% of Nestlé 04E Sales
Europe Rank
Americas Rank
RoW Rank
Condensed & Evaporated Milk 50% 1 3% 1 1 1
Powdered Milk 40 1 8 NMF NMF 1
Dehydrated Bouillons & Seasonings 35 1 6 1 # 1
Infant Nutrition 25 1 6 = 4 1
Mineral Water 18 1* 9 1 1 2
#Does not compete in that category. =Tied for first place. *Mineral water global share by value. NMF — not meaningful Source: Citigroup Investment Research
In many developing markets, where a growing number of consumers can afford packaged goods on a regular basis, milk and nutrition products dominate the category mix. So, for example, in China and the Philippines, milk and nutrition products account for around half of Nestlé’s sales. Indeed, Nestlé’s powdered milk/infant nutrition brand Nido has sales that represent more than 2% of the company’s total revenues. In explaining this strength, Citigroup Investment Research analyst Warren Ackerman, points out that “in developing markets…Nestlé has a long history, iconic brands, and a deep understanding of the needs of local consumers.”17
Another important category in basic packaged good is dry culinary, e.g., seasonings. So, for example, under its Maggi brand, Nestlé sells 4 gram bouillon cubes for two cents each in developing markets. From the consumers’ perspective, this product is
17 See Warren Ackerman’s March 29, 2005, “Nestlé SA” report.
In many developing markets, where a
growing number of consumers can afford packaged goods on a
regular basis, milk and nutrition products
dominate the category mix.
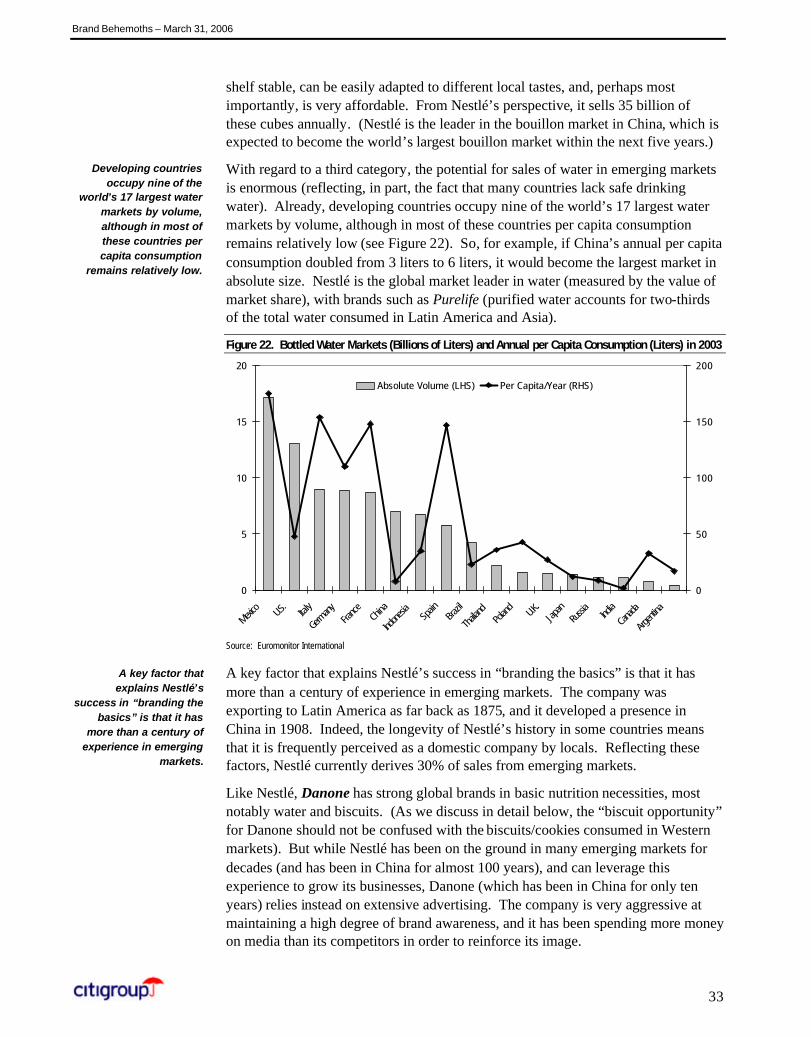
Brand Behemoths – March 31, 2006
33
shelf stable, can be easily adapted to different local tastes, and, perhaps most importantly, is very affordable. From Nestlé’s perspective, it sells 35 billion of these cubes annually. (Nestlé is the leader in the bouillon market in China, which is expected to become the world’s largest bouillon market within the next five years.)
With regard to a third category, the potential for sales of water in emerging markets is enormous (reflecting, in part, the fact that many countries lack safe drinking water). Already, developing countries occupy nine of the world’s 17 largest water markets by volume, although in most of these countries per capita consumption remains relatively low (see Figure 22). So, for example, if China’s annual per capita consumption doubled from 3 liters to 6 liters, it would become the largest market in absolute size. Nestlé is the global market leader in water (measured by the value of market share), with brands such as Purelife (purified water accounts for two-thirds of the total water consumed in Latin America and Asia).
Figure 22. Bottled Water Markets (Billions of Liters) and Annual per Capita Consumption (Liters) in 2003
0
5
10
15
20
Mexico U.S
.Ita
ly
Germ
anyFra
nce China
Indon
esia
Spain
Brazil
Thaila
ndPo
land
U.K.
Japan
Russi
aInd
ia
Canad
a
Argen
tina
0
50
100
150
200
Absolute Volume (LHS) Per Capita/Year (RHS)
Source: Euromonitor International
A key factor that explains Nestlé’s success in “branding the basics” is that it has more than a century of experience in emerging markets. The company was exporting to Latin America as far back as 1875, and it developed a presence in China in 1908. Indeed, the longevity of Nestlé’s history in some countries means that it is frequently perceived as a domestic company by locals. Reflecting these factors, Nestlé currently derives 30% of sales from emerging markets.
Like Nestlé, Danone has strong global brands in basic nutrition necessities, most notably water and biscuits. (As we discuss in detail below, the “biscuit opportunity” for Danone should not be confused with the biscuits/cookies consumed in Western markets). But while Nestlé has been on the ground in many emerging markets for decades (and has been in China for almost 100 years), and can leverage this experience to grow its businesses, Danone (which has been in China for only ten years) relies instead on extensive advertising. The company is very aggressive at maintaining a high degree of brand awareness, and it has been spending more money on media than its competitors in order to reinforce its image.
Developing countries occupy nine of the
world’s 17 largest water markets by volume, although in most of these countries per capita consumption
remains relatively low.
A key factor that explains Nestlé’s
success in “branding the basics” is that it has
more than a century of experience in emerging
markets.

Brand Behemoths – March 31, 2006
34
Water represents around 25% of Danone’s revenues, and biscuits are another 20%. Danone’s largest business, dairy (55% of revenues) — including yogurt and probiotic drinks — is not a foodstuff that has had much success in many emerging markets. One reason for this is that yogurt consumption is not a core element of the typical Asian diet, due, in part, to the lactose intolerance of many Asians. Then too, while making yogurt is not technically difficult, the real challenges in emerging markets are in milk collection and chilled distribution (in sharp contrast to infant formula and powdered and condensed milk, which don’t require refrigeration).
French-based Danone is targeting five “frontier” markets for long-term growth: China, Indonesia, Mexico, Russia, and U.S. dairy. In aggregate, these five markets account for one-quarter of sales, recently overtaking France, for the first time, in their group sales weighting. As Figure 23 illustrates, Danone holds the No. 1 position in water and biscuits in all of the “frontier” markets in which it competes.
Figure 23. Danone’s Position in Key “Frontier” Markets in 2005
Water Biscuits
China 1 1
Indonesia 1 1
Mexico 1* NA
Russia NA 1
*In Mexico, Danone is the leader in bottled water, excluding home and office delivery Source: Company reports
With regard to water, Danone owns four of the largest brands in the world: Aqua (Indonesia), Evian (global), Aga (Mexico), and Wahaha (China). The company is the clear global market leader by volume (in contrast to Nestlé, which is the global leader by value of water products sold), with an estimated market share of 18%. It is estimated that, in Asia, Danone is more than five times larger than its nearest competitor, and the company has a 50% share of the Chinese water market. (China accounts for fully 9% of total company sales.) Note that while, as discussed, Nestlé does have exposure to the emerging market water opportunity, Danone’s exposure is far larger, with the company deriving fully 54% of its water sales from Asia, Latin America, and Africa/Middle East (see Figure 24).
Figure 24. 2004 Water Sales of Danone and Nestlé (euros in billions)
North America 45%
Europe 48%
North America 5%
Europe 41%
Asia/Oceania 45%
Asia/Oceania 3%
Latin America 7%
Latin America 2%
Africa/Middle East 2%
Africa/Middle East 2%
0
2
4
6
Danone Nestle
Total Sales = Eur3.0bn
Total Sales = Eur5.2bn
Source: Citigroup Investment Research
French-based Danone is targeting “frontier”
markets for long-term growth: China,
Indonesia, Mexico, and Russia.
Danone derives fully 54% of its water sales from
Asia, Latin America, and Africa/Middle East.

Brand Behemoths – March 31, 2006
35
As for biscuits, Danone recently exited some if its weaker biscuit positions, including those in the U.K., at the same time that, as noted above, it continues to focus on biscuits in key frontier markets. This strategy reflects a dichotomy between developed regions where “biscuits” are a slow-growth sugary treat, and developing regions, where “biscuits” are, in many areas, a fast-growth nutritional supplement. In that regard, Danone has been positioning biscuits as a cheap way to get nutrition to low-income consumers in emerging markets. Here is how Danone outlines its strategy:
With eating habits in Asia in transition, malnutrition exists alongside obesity. Thus, studies have found that, in China, average consumption of calcium is only 40% of the recommended daily amount and more than 15% of the population is anemic, while in Indonesia the figure rises to 30%. Yet 8% of Chinese children and 20% of adults are overweight, while 20% suffer from hypertension. One of Danone’s key strategies is to create products that satisfy the nutritional and health needs of local populations.
Examples are biscuits — a product that, by definition, is easy to eat, with high-grain content and long shelf life — that are enriched with essential nutrients, including calcium, iron, and vitamins. In Asia, Danone sells biscuits especially for people with dietary deficiencies, such as Danone & Milk Biscuits in China, and Biskuat in Indonesia, but also cookies fortified with calcium and vitamins for children, or made with less fat, such as Wei Zi crackers sold in China. In 2004, we stepped up the development and launch of nutritional biscuits that are affordably priced: in China, Indonesia, and Malaysia, these sell for 1 yuan, 500 rupiah, or 30 ringgit cents, respectively—the equivalent of just a few cents.18
With regard to the Indonesian Biskuat product, Danone’s Franck Riboud notes that the company “replicated this strategy from India, where it is called Tiger, and we launched the same product in China.” Under Mr. Riboud, Danone is intensely focused on the biscuit segment, so that the company tries “to be No. 1 where we are…. We are a very strong player especially in some emerging markets” — Figure 25 illustrates Danone’s share of four markets where it has the No. 1 position.
Figure 25. Danone’s Market Share of Asian Biscuit Markets in 2005
30%
14%
c. 20%
>40%
0%
10%
20%
30%
40%
50%
India Malaysia China (East & North) Indonesia Source: Danone
18 Danone 2004 Annual Report
Danone has been positioning biscuits as a
cheap way to get nutrition to low-income consumers in emerging
markets.

Brand Behemoths – March 31, 2006
36
Globally Local In contrast to Nestlé and Danone, which have proven adept at branding the most basic necessities (e.g., infant formula and water), Unilever is skilled at branding more sophisticated foodstuffs (e.g., mayonnaise). With sales of food and beverage categories accounting for more than half of the company’s revenues (see Figure 26), and developing and emerging market operations accounting for a significant portion of the company’s sales growth (see Figure 27), Unilever is notably successful at assimilating its products into difficult categories and difficult markets.
Figure 26. Unilever Sales by Category 2005
Other44%
Beverages 8%
Spreads & Cooking
11%
Ice Cream & Frozen16%
Savoury & Dressings
21%
Source: Unilever
Figure 27. Unilever’s Sales Growth by Region in 2005 regional sales as a percentage of total in parentheses
-1%
4%
9%
-2% 0% 2% 4% 6% 8% 10%
Europe (41%)
Americas (33%)
Asia / Africa (26%)
Source: Unilever
➤ Global needs vs. local tastes. Various types of consumer product categories tend to behave differently from each other. The most successful categories tend to be personal care items, for which there is a clear global need (e.g., shampoo for clean hair). By contrast, it is generally much more difficult to migrate consumers “beyond the basics” to higher-priced, branded, packaged food items, especially when they are familiar with existing substitutes, such as homemade meals (e.g., in developed markets), or items purchased from street vendors (e.g., in developing markets). The difficulty of the task is further magnified when the category is one with which a culture is not already familiar, such as cereal or instant coffee might be for many cultures. Then, too, the local preference might be for spicy foodstuffs in some markets and more mild flavors elsewhere.
Despite these challenges, reflecting its expertise in assimilating its products into various markets around the world, Unilever has the No. 1 position in most of the global food categories in which it competes (see Figure 28). So, for example, its Hellmann’s mayonnaise is infused with the taste of roasted hot peppers for the Brazilian market, but has an olive flavor in Poland.
Unilever is notably successful at
assimilating its products into difficult categories
and difficult markets.
It is generally much more difficult to migrate
consumers “beyond the basics” to higher-priced, branded, packaged food
items.
Unilever’s Hellmann’s mayonnaise is infused
with the taste of roasted hot peppers for the
Brazilian market, but has an olive flavor in Poland.

Brand Behemoths – March 31, 2006
37
Figure 28. Unilever Global and Regional Category Market Share Positions (2004E)
Europe N. America S. America Africa/ M. East
Asia-Pac Global
Savory & Dressings 1 2 1 1 2 1
Ice Cream 1 1 2 2 1 1
Spreads 1 1 1 1 2 1
Tea 1 1 2 2 1 1
Source: Citigroup Investment Research
➤ Structural issues. With regard to the developing markets in which it seeks to sell its products, there frequently are challenging factors on both the demand and supply sides that Unilever has to overcome. On the demand side, reflecting generally low levels of disposable income, consumers in emerging markets are typically fairly price sensitive, and many consider branded packaged goods (beyond the basic necessities) to be infrequent luxuries.
On that point, Patrick Cescau, group chief executive officer of Unilever, notes that “not everybody can afford the kinds of branded goods most consumer goods companies sell. A growing number are aspiring to lifestyles that include all the benefits of branded consumer goods, but struggle to afford them. And the vast majority of people — we are talking billions — get by on about a dollar a day. Not much of which can be spared for anything other than the essentials. In Unilever, we understand that and we have developed the capabilities to deliver what consumers want and need. Affordability — for example — with products available in affordable formats and sizes.” So, in some markets, Unilever sells tea bags in packs of three.
On the supply side, while conventional retail supermarket formats continue to grow rapidly, traditional smaller retailers still account for a significant portion of retail sales in many emerging markets (see Figure 29).
Figure 29. Retail Trade Development in Asia/Africa in 2004
0%
20%
40%
60%
80%
100%
Nigeria India Iran Egypt Indonesia China Turkey Philippines
Traditional Modern Trade Source: Unilever
Consumers in emerging markets are typically
fairly price sensitive, and many consider branded
packaged goods to be infrequent luxuries.
Traditional smaller retailers still account for
a significant portion of retail sales in many emerging markets.

Brand Behemoths – March 31, 2006
38
Unilever has succeeded in this challenging retail environment thanks to a unique distribution infrastructure. With more than one hundred years of doing business in the region, Unilever has very wide coverage in Asia/Africa today, with 6,000 core distributors supplying its products to 6 million retail outlets. (Reflecting the uniqueness of Unilever’s distribution infrastructure, Kimberly-Clark, another brand behemoth, has a 50/50 joint venture with the company in India, whereby Kimberly’s diaper products are distributed through Unilever’s network.) Unilever is also experimenting with a direct selling model in some of its poorest markets: In India, its “Shakti” initiative is planning to recruit up to 300,000 sales representatives for rural areas by 2010, up from 10,000 currently.
Unilever’s prowess in catering to local needs while overcoming various structural issues is well illustrated by its recent success in Vietnam, a socialist republic that was closed to foreign investment until 1995. In that country, Unilever’s sales have risen from €150 million in 2001 to €250 million in 2005. Based on a wealth of experience in developing markets, three factors, in particular, have contributed to Unilever’s success in assimilating its products into the Vietnamese market: 1) building early scale in distribution, 2) responding to changing consumer needs and specific local habits (e.g., a Vietnamese preference for fish sauce), and 3) sacrificing short-term profitability for long-term growth potential (e.g., via low price points).
PepsiCo, like Unilever, is expert at assimilating its products by carefully adapting to local market conditions, although for PepsiCo this typically means catering to different taste preferences in developing markets, and changing taste preferences in developed markets.
Reflecting its ownership of Frito-Lay, PepsiCo has a 30% share of the global snack market. In developed economies, annual per capita consumption of salty snacks is relatively high (at over 4 kg in the U.S. and U.K.) but, in many developing markets, consumption levels are very low (i.e., less than 1 kg) — see Figure 30.
Figure 30. Annual Salty Snack Consumption per Capita in Kilograms in 2005
6.4
U.S.
U.K.
Hollan
d
Australia Sp
ain
S. Afr
icaMexi
co
Belgiu
mJap
anFra
nce
Vene
zuela
Polan
d
Thaila
ndSa
udi
Colom
biaEg
yptBra
zil
Turke
yRu
ssia
China Ind
ia
4 kgDeveloped
Developing 1 kg
Source: PepsiCo
In response to these consumption disparities, PepsiCo has a two-pronged strategy:
In India, Unilever is planning to recruit up to
300,000 sales representatives for rural
areas by 2010.
PepsiCo caters to different taste preferences in
developing markets and changing taste
preferences in developed markets.

Brand Behemoths – March 31, 2006
39
➤ To stimulate demand in markets where consumption is relatively low, Frito flavors its potato chips to appeal to local tastes. In the words of Mike White, chairman and CEO, PepsiCo International, the company develops “consumer insights that enable us to find ways to tailor those products in seasonings and flavors that are uniquely relevant to different consumers in different countries with different traditions and different cuisines.”
So, for example, in India, Frito-Lay offers a Masala-flavored chip (seasoned with freshly ground spices) and, in Latvia, it offers a paprika-flavored chip. In addition, Citigroup Investment Research analyst Bonnie Herzog noted that, in China, PepsiCo improved its performance “once it realized local preferences. For instance, the company began experimenting with flavor concepts that appeal to the Chinese concept of yin and yang. The Chinese believe everything should be consumed in balance and, as a result, during the hot summer, Chinese consumers prefer cool foods, while in the winter, hot foods are the preference. The idea of the Cool Lemon flavored potato chips was born out of the necessity to have a ‘cool’ product during the hot summer months. This year, the company introduced Cool Cucumber, which performed well during the summer months. The Cool line of potato chips comprised around 70% of volume during the summer. Other flavors that have done well in China also have local appeal like Beijing Duck, Spicy Crab, and Sha Sha Chicken.”19
➤ In developed markets where consumption of salty snacks is already relatively high, Frito uses innovation to respond to changing consumer preferences in order to increase consumption further. So, for example, reflecting an aspiration to healthy living by a growing number of Americans (albeit often without making the necessary sacrifices), Frito has extended its “fun for you” snacks (e.g., Cheetos and Doritos) by introducing “better for you” products (e.g., Baked Cheetos in 2001 and Baked Doritos in 2002) — see Figure 31. Importantly, PepsiCo’s Mike White points out that “some of Frito-Lay North America’s most differentiated products are not sold internationally yet. We will be launching Baked Lay’s for the first time in the U.K. and Holland later on this year [2006].”
That said, PepsiCo, has been developing “health and wellness” products for markets outside of North America. Mike White notes that, PepsiCo is “re-launching our Walkers brand in the U.K. It is going to be fried in a different oil. It’s a unique oil we call SunSeed. It’s a 100% sunflower oil that is lower in polyunsaturated fats and higher in monounsaturated fats and has characteristics much more similar to olive oil, but with a much more stable base for frying. It will enable us to get 70% less saturated fats and, in the testing, that we did with our heaviest users, they couldn’t tell the difference in taste blind between the new product and the old product, and when we asked them about their purchase intent when we identified the product and their attitudes, they were off the charts positive about what we were doing. We are also launching a number of new flavors in the U.K. where we have engineered the seasonings to deliver 25% reduction in sodium.”
19 See Bonnie Herzog’s February 24, 2006 “CAGNY Takeaways” report.
Frito flavors its potato chips to appeal to local
tastes.
During the hot summer, Chinese consumers
prefer cool foods, while in the winter, hot foods
are the preference.
PepsiCo is launching a number of new flavors in
the U.K., where it has engineered the
seasonings to deliver a 25% reduction in
sodium.

Brand Behemoths – March 31, 2006
40
Figure 31. Frito-Lay Product Innovations
Year Brand Product
2001 Tostitos Scoops Kettle Chips
Doritos Extreme; 3Ds
Fritos Flavor Twist
Rold Gold Colossal Cheddar Snack Mix; Nuggets
Cheetos Baked; Whirlz; Mystery Cheetos
Ruffles 3Ds
2002 Go Snacks Single serve snack canisters Munchies Snack Mix
Lays Tastes of America Line Regional flavors such as San Antonio Salsa
Lays Reduced Fat PC Less fat than original Lays
Tostitos Gold Hearty Mexican Style Corn Tortillas
Tostitos Party Bowls Ready-to-serve chip dip
Twisted Cheetos Spiraled Crunchy Cheetos
Baked Doritos Low-fat Doritos
2003 Organic Blue Corn Tortilla Chips Natural Line of Organic Snacks Cheetos Natural White Cheddar Puffs Natural Line of Organic Snacks
Lay’s Natural Country BBQ Potato Chips Natural Line of Organic Snacks
Baked Lay’s (Smart Snack) On-pack Smart Snack label
Stax Lays Potato Chips Stacked in a Canister
Doritos Guacamole! Flavored Tortilla Chips
Doritos Rollitos Bite-Size Tortilla Snacks
2004 Light Renamed “Wow!” Line of snacks with olestra Munchies Kid Mix FDA approval for fortification
Rold Gold Heartzels with less sodium
Lay’s Potato Chips Classic Cheddar and Sour Cream flavor
Doritos Black Pepper Jack flavor
Cheetos Baked Crunchy Cheetos
Doritos White Nacho Cheese Natural Tortilla Chips
Doritos Cool Ranch Natural Tortilla Chips
2005 Nacho Cheesier Doritos Reformulated with more cheese flavor. Lays Stax KC Masterpiece and Hidden Valley Ranch flavors
Walker’s UK Saturated fat reduced by one-third
Tostitos Light Relaunch with only 1 gram of fat per serving
Lays Stax Pizza and Salt & Vinegar flavors
Oh Boy! Oberto Beef Jerky Crisps Original, Sweet Mesquite and Smokey BBQ
Baked Lays Cheddar and Sour Cream flavor
Baked Flaming Hot Crunchy Cheetos Baked version of Flaming Hot Cheetos
Doritos Doritos Hot
Cheetos Flaming Hot Crunchy Cheetos
Lay’s Potato Chips Lightly salted version of Lay’s potato chips.
Lay’s Branded Dips French Onion and Ranch flavors
Source: Company reports and Citigroup Investment Research

Brand Behemoths – March 31, 2006
41
Kellogg, like PepsiCo, assimilates its products by catering to changing taste preferences in developed markets. In particular, Kellogg modifies its ready-to-eat (RTE) cereals to reflect:
➤ Jaded taste buds (i.e., consumers get “bored” with what they are eating),
➤ The latest consumer trends (e.g., demand for “healthy” products), and
➤ Demographic factors (e.g., an aging population’s appetite for bran).
As part of this process, Kellogg’s “volume-to-value” (v-to-v) strategy has sought to shift its portfolio from a lower-margin focus on volume, to a higher-margin focus on added value. So, the company has been moving away from the basic items such as Corn Flakes cereal (priced around $2.50 per unit at retail) — which would have been favored previously because of historically high volumes — to higher-priced (higher-margin), value-added cereals with distinctive qualities, such as Kellogg’s Special K with Red Berries ($4.02 per unit), Fruit Harvest ($3.78 per unit), Smorz ($3.83 per unit), and Kashi Organic Promise Strawberry Fields ($5.10 per unit), to name just a few.
Note here that adding berries to cereal sounds easy, but it isn’t. The idea of incorporating dehydrated fruit in cereal had been tried before by other cereal manufacturers, but without success due to quality issues. However, by using improved sourcing, processing, and handling, Kellogg successfully developed new technology that corrected previous inconsistencies. Clearly, then, innovation is critical at Kellogg; as Jim Jenness, chairman and CEO observes, “to win in our categories, you have to win in innovation.”
As noted, the v-to-v strategy reflects, in part, that consumers can grow tired of the same old cereal each day and eventually go looking for newer and more interesting varieties. Then, too, an emphasis on health and nutrition in recent years has driven demand for natural and organic cereals, including Kellogg’s Kashi brand.
In addition, an aging U.S. population creates opportunities for adult-oriented cereal — as people move from middle age into their later years, cereal consumption increases. David Mackay, Kellogg’s president and chief operating officer, notes that the “population of 50-plus are moving into a much higher cereal-eating demographic…. In fact, if you do a comparison of the 18 to 24 age group to the 65-plus group, between those two age groups, cereal servings per year goes up 75%” (see Figure 32). Citigroup Investment Research analyst David Driscoll estimates that approximately 45% of Kellogg’s ready-to-eat cereal portfolio is targeted toward an adult audience by way of brands such as Kellogg’s Raisin Bran.
Kellogg assimilates its products by catering to
changing taste preferences in developed
markets.
As people move from middle age into their
later years, cereal consumption increases.

Brand Behemoths – March 31, 2006
42
Figure 32. Ready-To-Eat Cereal Servings per Year and U.S. Population in 2005
0
20
40
60
80
Under 6 6-11 12-14 15-17 18-24 25-34 35-49 50-64 65+
0
40
80
120
160
Population in Millions (LHS)Servings Per Year (RHS)
Source: U.S. Census 2005 estimates, Kellogg Consumption Study 2005
As a result of the v-to-v strategy outlined above, Kellogg has been replacing lower-margin stock-keeping units (SKUs) with higher-margin products, with the end result being that the company has been reaping a higher average blended price through improved volume mix (see Figure 33).
Figure 33. Kellogg’s Total Blended Price for Cereal
$2.50
$2.60
$2.70
$2.80
$2.90
$3.00
1999 2000 2001 2002 2003 2004 2005 2006
Note: 2006 data not yet available Source: A.C. Nielsen and Citigroup Investment Research

Brand Behemoths – March 31, 2006
43
Behavior Modification As we noted above, the most successful categories of consumer products tend to be personal care items for which there is a clear global need (e.g., shampoo for clean hair). Even so, global companies looking to extend their products into new markets face three distinct challenges:
➤ Encouraging consumers to start using the product. This typically involves the first in a series of steps geared to behavior modification, e.g., using shampoo to wash hair instead of soap. Procter & Gamble CEO A.G. Lafley, notes that “laundry detergent, shampoo, and diapers are categories that take off relatively quickly as a country’s economy begins to develop.” Figure 34 illustrates what P&G’s Global Marketing Officer Jim Stengel labels “takeoff points” — i.e., income levels at which consumers have enough spending power to “enter a category in a significant way.”
Figure 34. Potential Number of Consumers at Various Levels of GDP per Capita in 2005
0
1
2
3
4
5
6
7
$0 $5,000 $10,000 $15,000 $20,000
GDP per Capita
Billi
ons
of P
eopl
e
LaundryDentifrice, Shampoo
Diapers
Facial Moisturizers, Fem Pads
Hair Styling and Color
Blades & RazorsTampons, Baby Wipes
Source: Procter & Gamble
➤ Encouraging consumers to use more of the product. Toothpaste consumption in China, at 190 grams per capita, is up from 150 grams per capita in 1999, but still well below the 600 grams per capita in the U.S. (So, if the average American brushes twice a day, using 43 grams at each brushing, one possibility is that the average Chinese is only brushing four times a week. Alternatively, some Chinese consumers may be brushing daily, while others are not brushing at all.)
➤ Encouraging consumers to “move up the value chain” by using a better (and more expensive) version of the product, and by extending the range of products they purchase (e.g., mouthwash and tooth whiteners, in addition to toothpaste).
Laundry detergent, shampoo, and diapers
are categories that take off relatively quickly as a
country’s economy begins to develop.

Brand Behemoths – March 31, 2006
44
Phase 1: Using the Product When visiting China just two years ago, Citigroup Investment Research analyst Wendy Nicholson, was “stunned by the lack of lipstick or blusher…on the faces of women…while deodorants, perfumes, and tampons are virtually nonexistent. While most consumers own televisions and cellular phones, fewer own washing machines…or clothes dryers.20” Wendy also noted that “currently, half of Chinese household income is spent on food and beverages…while less than 10% is spent on household products, and a far smaller percentage on personal care items.”
Global companies typically employ three strategies to stimulate use of new products in developing markets where they have not had a long-established presence:
➤ Acquire a Local Presence. Procter & Gamble first entered China in the late 1980s through a joint venture with a local soap manufacturer. To help with its entry into the Russian market, P&G acquired a majority stake in a detergent/cleaner plant outside Moscow in 1993. Meanwhile, the acquisition of Rakona in the Czech Republic in 1992 gave P&G detergents, cleaners, and shampoos with which to enter Eastern Europe. Colgate-Palmolive entered into a joint venture in China with toothbrush manufacturer Sanxiao in 2000 in order to gain access to its manufacturing facility and distribution network. In order to strengthen its position and penetration in Poland, Colgate acquired the largest Polish toothpaste manufacturer, Colodent, in 1998. Wrigley acquired Joyco — a global confections company with a strong presence in India and China — in 2004, thereby significantly increasing its presence in India, while adding to its distribution capabilities in the Chinese market. Although chewing gum is a relatively new concept in many emerging markets, Wrigley stimulates consumption by way of advertising and sampling programs.
➤ Value Pricing. In a 2005 report21, Wendy Nicholson wrote that she “whole-heartedly endorse[d] the strategy pioneered largely by Procter & Gamble to enter or launch new product categories with value pricing, so as to condition consumers to the habit of using any product within a certain category, and then subsequently encouraging them to trade up to a more value-added product (which, of course, carries with it a premium price).”
So, for example, in the Russian laundry detergent category, P&G offers Ariel at the high end, designed for superior cleaning; Tide in the mid-tier, designed for whiteness; Myth (a local Russian brand acquired in 1994) also at the mid-tier, representing freshness; and Tix (a product launched in 2004) at the value end.
➤ Advertising. In her 2005 report, Wendy Nicholson described the evolution of the Russian market as follows:
20 See Wendy Nicholson’s March 15, 2004, “Near-Term Growth in China” report. 21 See Wendy Nicholson’s June 12, 2005, “From Russia with Love” report.
Global companies typically employ three strategies to stimulate use of new products in
developing markets: 1) acquire a local presence,
2) value pricing, and 3) advertising.
P&G pioneered the strategy for launching
new product categories with value pricing.

Brand Behemoths – March 31, 2006
45
In 1992, with the advent of perestroika, as the Russian economy transformed from Communism to capitalism, the former “Soviet time” concept of shopping, which implied high prices and low selection, gave way to a more Western approach to retailing…. Since that time, and we believe as a direct result of the investment by multinational companies in advertising…global brands have increased in popularity….
So, for example, Colgate’s advertising spending in Russia has grown at an average annual rate of 70% since 2000. In China, P&G’s Jim Stengel notes that the company is “the largest advertiser by a wide margin.” P&G’s long-standing media relationships — “we were there when the media was developing” says Mr. Stengel — enable it to obtain favorable rates and time slots from China’s popular television channels.
Phase Two: Using More of the Product A.G. Lafley of P&G observes that “consumption per capita in our categories in developing markets is about one-third that of developed markets.” Similarly, in her report on her 2005 trip to Russia, Wendy Nicholson observed that:
In the case of detergent, while 95% of the population use the product, average consumption in 2003 in Russia [was] a very low 1.5 kg/year, compared to…roughly 12 kg/year in Germany…. Reflecting more traditional habits, only 8% of consumers use tampons…. Perhaps more stunningly, while the tissue/towel category consists of toilet tissue (75% of the population using the product), napkins (15%), facial tissue (6%), and paper towels (4%)…in the toilet tissue market, while consumption is growing, we note that consumption per capita in Russia is 10x lower than of Western Europe, and in facial tissue, consumption is 20x lower.
Another category where per capita consumption is relatively low in many developing markets is toothpaste. So, as noted, toothpaste consumption in China was 190 grams per capita in 2004, up from 150 grams in 1999, but well below the 600 grams in the U.S. Similarly, per capita consumption of chewing gum in the developing markets of Asia, Eastern Europe, and the Pacific regions is well below levels seen in North America and Western Europe (see Figure 35).
Figure 35. Per Capita Gum Consumption in Pounds per Year in 2005
1.6
1.0
0.7
0.4
0.1
0.0
0.5
1.0
1.5
2.0
North America Western Europe Eastern Europe Australia/Pacific Asia
Source: Euromonitor International, U.S. Census Bureau, ACNielsen, and Citigroup Investment Research
Colgate’s advertising spending in Russia has
grown at an average annual rate of 70% since
2000.

Brand Behemoths – March 31, 2006
46
Interestingly, the desire for fresh breath is both universal and ancient. The ancient Greeks chewed mastic gum, a substance formed from the resin contained in the bark of the mastic tree found mainly in Greece and Turkey. Grecian women favored chewing mastic gum to clean their teeth and sweeten their breath.
While chewing gum offers the promise of fresh breath, toothpaste is an important tool in the fight against tooth decay. Toothpaste represents more than 80% of Colgate-Palmolive’s sales in China and, as in other emerging markets, Colgate has attempted to stimulate increased consumption of toothpaste in China in a number of ways:
➤ Sampling programs. Colgate develops relationships with dentists and schools, both of which offer sampling programs.
➤ New product introductions. For example, in addition to a basic range of toothpastes, in 2003 Colgate introduced into China its Colgate Herbal White, a more flavorful product designed to appeal to younger consumers.
➤ Toothbrush production. Colgate is the market leader in the toothbrush category in China, with more than a 50% market share. Thanks to its joint venture with Sanxiao, Colgate has been in the toothbrush business in China since 2000, and it has the capacity to produce more than 1 billion toothbrushes.
➤ More advertising. Colgate increased its ad spending in China by 96% in 2005.
Colgate has experienced success in the Russian market too, both in terms of category growth (toothpaste up 35% in 2004) and market share (up 4.0 points in 2004). The company’s high rate of new product introductions has been a key factor in the Russian market. Indeed in 2004, new products accounted for fully 46% of Colgate’s Russia volumes, versus only 20% in 2000. Some of the products introduced in 2004 include Cavity Protection, Total Advanced Fresh, Propolis Whitening, Total 12 Hour, and Sensitive. While many of these products had originally been developed for and introduced into other markets around the world, Colgate operates an Innovation Center in Russia, where it uses local insights to help modify new products for the Russian market.
On the subject of such Innovation Centers, Reuben Mark, Colgate-Palmolive’s chairman and CEO, notes that:
Category Innovation Centers (CICs) on the ground allow us to develop consumer-relevant new products that meet consumer needs and wants. This is different than the way we used to do it, and it seems to be working extraordinarily well. We have ten fully operational innovation centers around the world now…[in the] U.S., Latin America, Europe, and Asia…Russia, China, India…and two more will be opening this year…. So we have to a certain extent come full circle. We used to develop the products locally in each country. We moved to total centralization, and now we have a balanced kind of approach…. They are able to deliver against regional insights and needs, which are different region to region.
The desire for fresh breath is both universal
and ancient.
Colgate has the capacity to produce more than 1 billion toothbrushes in
China.
Colgate operates an Innovation Center in
Russia, where it uses local insights to help
modify new products for the Russian market.

Brand Behemoths – March 31, 2006
47
Innovation is a critical factor at Procter & Gamble too. A.G. Lafley points out that P&G has “28 technical centers in 12 countries. 40% of P&G’s R&D is located outside the U.S.” So, for example, P&G has R&D capabilities within China (at its Beijing Innovation Center) that develop products specifically for China — Tide Clean White laundry powder, P&G’s low-priced entry product into the China market, offers bright, white clothes at a low price. As a result of innovations such as this, P&G is helping to influence Chinese consumer lifestyles and product choices. (China is now P&G’s No. 2 market by volume, and fifth by sales.)
Indeed, one of P&G’s key strengths around the world is its analysis and understanding of consumer behavior. Rather than just bringing its global brands into Country X and expecting them to succeed, the company spends time learning about consumers in that market, understanding how they shop, why they choose the products they do, how they use the products, and what price they are willing to pay. To accomplish this, P&G employs a team whose job it is to go into consumers’ homes around the world in order to glean “consumer insights.” As Jim Stengel, P&G’s global marketing officer, observes “going into consumer homes is a deep part of the culture, and we model it from the top. I am spending time in homes and in stores, and I just don’t go into the wealthy homes.”
A.G. Lafley outlines P&G’s philosophy for understanding consumer behavior as follows:
P&G is the consumer-understanding leader in the industry. We invest more than $200 million a year in consumer research, more than any competitor and roughly double the competitive average. We have more than 2,600 consumer understanding experts worldwide with researchers on the ground in nearly 50 countries. We interact directly with more than 4 million consumers a year. We have proprietary consumer understanding methodologies and techniques that enable us to discover unarticulated consumer needs and desires. These are the most fertile insights for innovation.
So, one insight gleaned from studying consumers in Russia is that many of them use four different types of laundry detergent — one for the husband’s clothes, one for the wife’s clothes, another for the children’s clothes, and a fourth for special “Saturday night” clothes — which helped P&G tailor laundry products especially for the Russian market.
Phase Three: Moving Up the Value Chain As markets develop, global companies can try to move consumers “up the value chain.” They can do this by enticing consumers to use a better (and more expensive) version of the product and, also, by extending the range of products they purchase.
➤ After initially entering the China market with (low-margin) toothpaste, Colgate subsequently introduced new products to the market, such as (higher-margin) tooth whiteners.
➤ In Russia, 90% of the population uses shampoo, but 51% of consumers use the lowest-priced tier, and only 21% use the premium-priced brand, suggesting a large opportunity for Procter & Gamble.
P&G has R&D capabilities at its Beijing
Innovation Center that develop products
specifically for China.
P&G has researchers on the ground in nearly 50
countries.
Skilled global companies entice consumers to use
a better — and more expensive — version of
their products and, also, extend the range of
products they purchase.

Brand Behemoths – March 31, 2006
48
Also in Russia, Jim Kilts, vice chairman of Procter & Gamble (and former chairman and CEO of Gillette) notes that the company’s success in the razor blades segment “has come with Slalom Plus, our entry-level system, which is an affordable trade-up for current disposable and double-edge users…. And since double-edged blades account for three-quarters of the units in the developing world, or close to one billion users, there is a lot more affordable trade-up ahead. This established user base represents one of each truly great trade-up opportunities in all of consumer products” (see Figure 36).
Figure 36. Blade Market in Developing Countries of Asia, Africa, and Europe in 2005 percentage of category units
Double-Edged78%
Disposables16%
Systems6%
Source: ACNielsen
Importantly, as consumers in developing markets become more familiar with packaged products, their affinity for brand names increases (in contrast to some consumers in developed markets who shift to private label products). As Wendy Nicholson observed in her Russia report:
Consumers in emerging markets [are] generally…more brand-aware and less willing to try private label products given their low level of disposable income (they can’t risk buying an unknown private label product, taking it home, and being dissatisfied with the product quality).
As consumers in developing markets
become more familiar with packaged products,
their affinity for brand names increases.

Brand Behemoths – March 31, 2006
49
New and Improved Innovation is important for manufacturers of consumer nondurables, including cosmetics, because it drives sales growth by encouraging consumers to trade up. It, therefore, allows the innovator to steal market share from competitors, and it supports higher price points. In addition, retailers generally prefer to stock innovative products that are backed by high media spend rates, as this boosts aisle traffic and promotes revenue and margin enhancement.
L’Oréal, the world’s largest cosmetics company, considers that “innovation is absolutely critical.” The company believes in the “science of beauty” and recognizes that beauty is “science in a jar.” As Jean-Paul Agon, incoming CEO of L’Oréal, observes:
It is true that, for some people, beauty is not something serious; it is more like “hope in a jar,” as Charles Revson, the founder of Revlon said 50 years ago. At L’Oréal, we believe exactly the opposite. We believe that beauty is “science in a jar”…. Our objective is simple: To dominate the technology battle to increase our market leadership…. We firmly believe that consumers always recognize quality and superior performance. We also believe that innovation is absolutely critical…we have to be able to constantly invent products that are new, different, and better.
Reflecting this philosophy, L’Oréal employs almost 3,000 scientists in 19 research centers (three main centers and 16 smaller centers) in Europe, the U.S., and Asia (a new R&D center has just opened in Shanghai). The company has been steadily increasing the amount that it invests in R&D (see Figure 37) and, largely as a result, each year it registers more than 500 patents and develops more than 4,000 formulas. (L’Oréal has pioneered more than 110 original molecules over the past decade.)
Figure 37. L’Oréal’s R&D as a Percentage of Sales
2%
3%
4%
1994 1996 1998 2000 2002 2004 2006
Note: 2005–06 data not yet available Source: Company reports
In addition, L’Oréal has a network of 13 evaluation centers around the world created to observe grooming habits. So, for example, L’Oréal discovered that, in Japan, women apply mascara with an average of 100 brush strokes, as compared to European women, who use just 50 brush strokes.
Retailers generally prefer to stock innovative
products that are backed by high media spend rates, as this boosts
aisle traffic.
L’Oréal believes that beauty is “science in a
jar.”
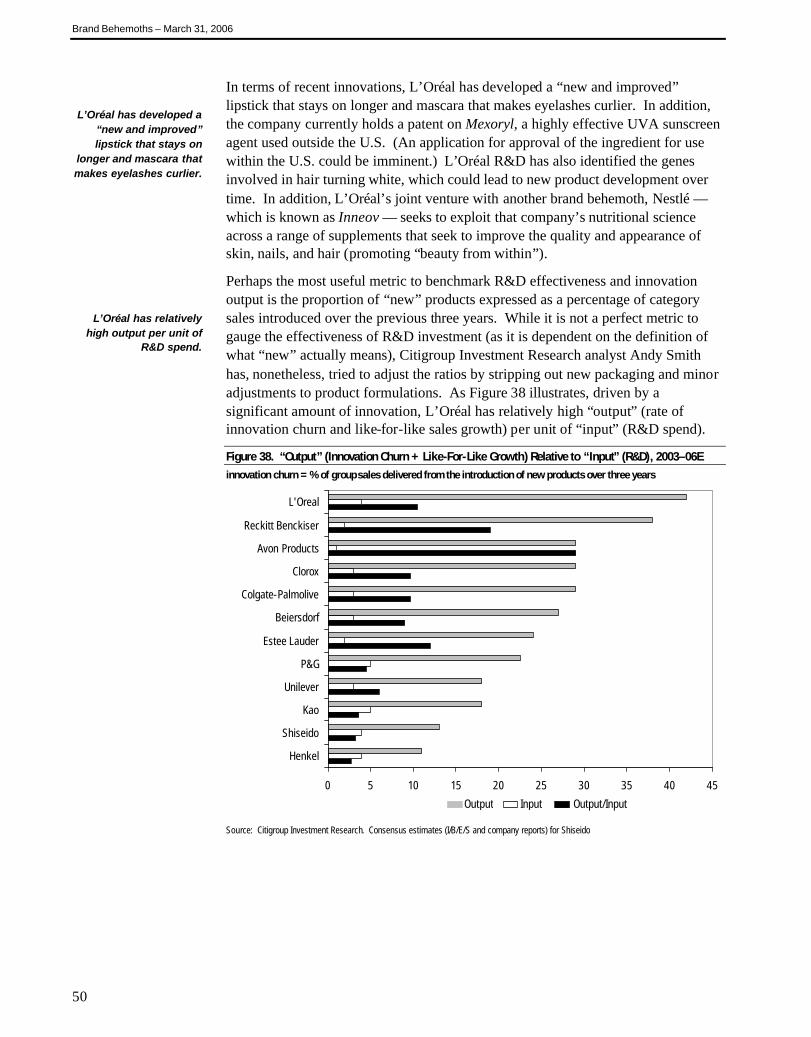
Brand Behemoths – March 31, 2006
50
In terms of recent innovations, L’Oréal has developed a “new and improved” lipstick that stays on longer and mascara that makes eyelashes curlier. In addition, the company currently holds a patent on Mexoryl, a highly effective UVA sunscreen agent used outside the U.S. (An application for approval of the ingredient for use within the U.S. could be imminent.) L’Oréal R&D has also identified the genes involved in hair turning white, which could lead to new product development over time. In addition, L’Oréal’s joint venture with another brand behemoth, Nestlé — which is known as Inneov — seeks to exploit that company’s nutritional science across a range of supplements that seek to improve the quality and appearance of skin, nails, and hair (promoting “beauty from within”).
Perhaps the most useful metric to benchmark R&D effectiveness and innovation output is the proportion of “new” products expressed as a percentage of category sales introduced over the previous three years. While it is not a perfect metric to gauge the effectiveness of R&D investment (as it is dependent on the definition of what “new” actually means), Citigroup Investment Research analyst Andy Smith has, nonetheless, tried to adjust the ratios by stripping out new packaging and minor adjustments to product formulations. As Figure 38 illustrates, driven by a significant amount of innovation, L’Oréal has relatively high “output” (rate of innovation churn and like-for-like sales growth) per unit of “input” (R&D spend).
Figure 38. “Output” (Innovation Churn + Like-For-Like Growth) Relative to “Input” (R&D), 2003–06E innovation churn = % of group sales delivered from the introduction of new products over three years
0 5 10 15 20 25 30 35 40 45
Henkel
Shiseido
Kao
Unilever
P&G
Estee Lauder
Beiersdorf
Colgate-Palmolive
Clorox
Avon Products
Reckitt Benckiser
L'Oreal
Output Input Output/Input
Source: Citigroup Investment Research. Consensus estimates (I/B/E/S and company reports) for Shiseido
L’Oréal has developed a “new and improved” lipstick that stays on
longer and mascara that makes eyelashes curlier.
L’Oréal has relatively high output per unit of
R&D spend.

Brand Behemoths – March 31, 2006
51
“Economies of Skill” Three specific factors help Kimberly-Clark protect and extend its franchise in three separate segments of the tissue market — facial (including Kleenex), bathroom (including Cottonelle), and kitchen (including Scott):
➤ Heavy Capital Intensity. Most tissue products are capital intensive, resulting in high barriers to entry, in terms of the absolute cost of the machinery, as well as the time necessary to get “tooled up.”
➤ Complex Technologies. Making and packaging a product as “simple” as a facial tissue is not easy, involving, e.g., just the right mix of pulps, drying technologies, and the correct fold of the individual tissues.
➤ Converting Capability. Raw tissue is produced on huge machines, and, over the decades, Kimberly has learned the processes involved in transforming the huge rolls of tissue into consumer-friendly sizes.
As Figure 39 illustrates, it is estimated that Kimberly-Clark adds about $1,900 per ton in manufacturing value added in the facial tissue making process. Starting with raw wood pulp, Kimberly then dries that pulp into “parent rolls” (unconverted rolls of tissue), and subsequently converts those parent rolls into tissue products.
Figure 39. Kimberly-Clark: Value Added in the Facial Tissue Production Process in 2005 $ per ton
Dried Parent Roll
Wholesale Products
$0
$2,000
$4,000
$6,000
Converted Tissue ProductsManufacturing Value Added:
$1,900/ton
Wood Pulp = $580/ton
Retail Products = $5,362/ton
}
Source: Citigroup Investment Research
Kimberly has, in effect, developed “economies of skill” that give it a strong competitive edge. In that regard, Tom Falk, Kimberly’s chairman and CEO, points out that Kimberly “took the risk of starting new manufacturing processes, and ultimately pioneered some new technologies,” in contrast to some competitors that simply “buy off-the-shelf technology.” To further strengthen its lead over competitors, Kimberly spends “a lot of time building a patent estate.” So, although Kimberly-Clark and Georgia-Pacific are comparable companies — in that they both derive about half of their mid-cycle/normalized earnings from tissue products — Kimberly has, over the years, devoted more resources to research and the development of innovative technologies and products (see Figure 40).
Three specific factors help Kimberly-Clark
protect and extend its franchise: heavy capital
intensity, complex technologies, and
converting capability.

Brand Behemoths – March 31, 2006
52
Figure 40. Patents Issued: Kimberly-Clark and Georgia-Pacific
0
100
200
300
400
500
2000 2001 2002 2003 2004 2005 2006
Kimberly-Clark
Georgia-Pacific
Note: 2006 data not yet available Source: U.S. Patent and Trademark Office
While it is arguable that Procter & Gamble — one of Kimberly’s key competitors in tissues — could threaten, or undermine, some of Kimberly’s economies of skill, P&G is a much larger and more diversified company than Kimberly. So, one of Kimberly’s key advantages is that it is intensely focused on just a few businesses, most notably all tissue categories — which together account for more than half of revenues — as well as diapers and adult incontinence (discussed in subsequent sections), accounting for 20% and 10% of revenues, respectively.

Brand Behemoths – March 31, 2006
53
We noted above that the brand behemoths are far from mature, holding the No. 1 position in only about one-half of the 240 category/region combinations that we looked at (see Figure 17). Moreover, in many instances where a brand behemoth holds the No. 1 position in a category, its absolute market share globally is still relatively low, suggesting tremendous growth opportunities. Indeed, the average global market share of the ten brand behemoths in 20 categories where they are the global leaders is projected to be just 24% in 2010 (see Figure 41).
Figure 41. Projected Global Market Share of Brand Behemoths
by category where Brand Behemoth is global leader in 2010
Category Brand Behemoth Global Market Share
Oral Hygiene Colgate-Palmolive 24%
Yogurt Danone 24
Breakfast Cereals Kellogg 34
Facial Tissues Kimberly-Clark 38
Color Cosmetics L’Oréal 20
Hair Care L’Oréal 22
Baby Food Nestlé 18
Bottled Water Nestlé 15
Coffee Nestlé 21
Ready Meals Nestlé 7
Functional Drinks PepsiCo 34
Sweet & Savory Snacks PepsiCo 30
Diapers Procter & Gamble 39
Laundry Care Procter & Gamble 27
Surface Care Procter & Gamble 13
Bath & Shower Unilever 21
Deodorant Unilever 31
Ice Cream Unilever 19
Sauces & Dressings Unilever 10
Tea Unilever 16
Gum Wrigley 38
Average 24%
Source: Professors Peter N. Golder and Joel H. Steckel and Citigroup Investment Research
Exposure to Regional Growth Opportunities
In many instances where a brand behemoth holds
the No. 1 position in a category, its absolute
market share globally is still relatively low.

Brand Behemoths – March 31, 2006
54
Note that developing regions would seem to offer particularly attractive opportunities for growth given that, while there are a number of global behemoths, there are no local behemoths that can challenge the hegemony of global companies. As Appendix D illustrates and Figure 42 summarizes, for the 30 categories in each region, a number of emerging markets (e.g., China, India, and East Asia) have a category leader that is the No. 1 company in just that category, and nowhere else — in other words, those markets are populated by multiple “local niche companies.”
So, for example, in China, 28 companies control the 30 categories (with two companies each having the leading position in two categories) — Column A. Furthermore, of those 28 different companies, 16 do not lead a category in any other region (Column B), suggesting a high level (57% = Column B/Column A) of “local brand dispersion” in China. In Western Europe, by contrast, the 30 categories are dominated by just 18 companies, with only four of those 18 being leaders in just Western Europe.
Figure 42. “Local Brand Dispersion Index” — Percentage of Companies by Region that are Leaders in Just One Category in 2004
A B B/A
# of Different Companies as Category Leaders
(Max = 30)
# that are Leaders in Only One Region
“Local Brand Dispersion Index”
Japan 25 16 64%
China 28 16 57
East Asia 23 9 39
India 18 7 39
Eastern Europe 21 7 33
Latin/South America 19 6 32
U.S. 19 6 32
Western Europe 18 4 22
Source: Citigroup Investment Research and Euromonitor International
While there are a number of global behemoths,
there are no local behemoths that can
challenge the hegemony of global companies.

Brand Behemoths – March 31, 2006
55
Opportunities On and Off the Beaten Track Nestlé’s overall strategy is to consolidate and build its positions in emerging markets, with a particular emphasis on the most populous countries, namely China and India. At the same time, however, it seeks to put a distribution infrastructure into growth markets of the future, e.g., Africa.
Another aim is to help redevelop Iraq and Iran and, ultimately, to become the biggest food and beverage company in these two underserved countries. As Figure 43 illustrates, the Swiss company already has the No. 1 position in some of the key categories in which it competes in the Middle East, as well as in other countries with ties to the Middle East (by way of their large Muslim populations), such as Malaysia and Indonesia.
Figure 43. Nestlé Market Rank in Selected Markets 2003 estimates
Middle East Malaysia Indonesia
Core dehydrated 1 1 4
Infant Nutrition 1 1 2
Milks 1 1 1
Soluble Coffee 1 1 1
Source: Nestlé and company reports
A distinguishing characteristic is that Nestlé invests in markets for the long term — in recent years, that has meant it has invested in markets when others were disinvesting (during times of economic or political turbulence), with the viewpoint that it is easier to build a branded position in a market when competitors are fleeing.
So, for example, in Indonesia, Nestlé’s “real internal growth” (a measure of volume growth that also includes mix improvement) declined by 30% in 1998 during the Asian currency crisis. However, Nestlé maintained its commitment to the Indonesian market during the crisis, and real internal growth rebounded strongly in subsequent years. Taking this approach may damage profits for one year, but the upside is that it builds consumer trust in and empathy for Nestlé’s brands.
Emerging Skin Care Potential A steady shift away from L’Oréal’s historical focus on mass-market hair products to one based on skin care and color cosmetics reflects, in part, the company’s focus on developing and emerging markets, such as China and India, where women’s skin care (including whiteners and anti-blemish creams) represent a major area of growth (see Figure 44).
Nestlé has invested in markets when others
were disinvesting during times of economic or
political turbulence.

Brand Behemoths – March 31, 2006
56
Figure 44. Women Aged 15–75 Years by Region millions in 2005
499 487
356
263
194
124 122
71
0
200
400
600
Asia-Pacific China India Africa LatAm E. Europe N. America W. Europe
Source: United Nations Population Division
Nascent growth is already under way in these markets, with the cosmetics market in China quadrupling to $4 billion over the past ten years; it is estimated that China will eventually become the world’s largest cosmetics market. As Figure 45 illustrates, L’Oréal’s sales in China (although still relatively small) have risen at a 74% compound annual growth rate since 1997, while its sales in India have grown at a 52% annual rate.
Figure 45. L’Oréal’s Annual Sales Growth in China and India
0%
50%
100%
150%
1998 1999 2000 2001 2002 2003 2004 2005 2006
ChinaIndia
400%
Note: 2006 data not yet available Source: Company reports and Citigroup Investment Research
“Going global” and exploiting regional growth opportunities is a key part of L’Oréal’s strategy. According to incoming CEO Jean-Paul Agon:
China will eventually become the world’s
largest cosmetics market.

Brand Behemoths – March 31, 2006
57
L’Oréal has made the choice of being global, and we are executing our plan without compromise…. There are presently 193 countries on this planet. Some of our brands, like Lancôme, are in more than 160 countries; many others are in more than 130. We acquire only brands that are already global or can become global, or local brands that will be merged with existing global brands. Moreover, the brand strategy is absolutely identical everywhere in the world, which means one name, one concept, one formula, one packaging, and one communication approach.
Since it was founded in 1907, L’Oréal has concentrated only on the development, manufacturing, and distribution of beauty products. The company can draw on this century of experience in understanding consumer preference as it seeks to expand into new markets. In that regard, Mr. Agon notes that:
Beauty is about creating products that people will want and desire, not just need…the marketing we do at L’Oréal is a unique combination of intelligence and emotion, reasoning and intuition, rigor and sensitivity, details and visions, dreams and reality.
So, to understand preferences in China, L’Oréal interviews about 35,000 women a year (including a woman in Shanghai, with hair that is about 13 feet long, who is under contract to study the aging of hair fiber). In this way, the company has discovered that powder remains more popular than liquids in color cosmetics in that market, and that Chinese consumers prefer fragrances that are more calming, in contrast to typical consumers in the West who prefer more invigorating fragrances.
L’Oréal’s broad strategy in China is to target younger women — 60% of all women are under 30 years old — living in major cities with affordable brands such as Maybelline color cosmetics. The company only entered China in 1997 and, in 2003–04, it made two critically important acquisitions (Yue Sai and Mininurse), which gave it a manufacturing base and allowed it to offer Chinese consumers a broader range of products.
Today, employing about 7,000 people, L’Oréal has three factories in China: Pudong (from the Yue Sai acquisition), Yichang in Hubei province (from the Mininurse acquisition), and its previous Suzhon facility. Citigroup Investment Research analysts estimate that L’Oréal’s total capacity in China will exceed 400 million units early in 2006.
As for India, L’Oréal entered the market in 1985 through a joint venture. A wholly owned subsidiary was established in 1994, the same year as the launch of India’s first hair colorant, Excellence Creme. While L’Oréal’s sales remain relatively small in India, recent growth rates have been impressive (see Figure 45), and will be supported by a new manufacturing facility in Pune. This facility was recently expanded to support a capacity of 100 million units per year, in both the color cosmetics and hair care segments.
“Beauty is about creating products that
people will want and desire, not just need.”

Brand Behemoths – March 31, 2006
58
Developing Potty-Training Opportunities Outside the U.S., Kimberly-Clark’s regional presence is mixed, creating tremendous opportunity for expansion, especially of its diaper business. So, for example, the company is well established in Australia, but not in India; in South Korea and Taiwan, but not in China; and in the U.K., but not in Russia. As Figure 46 illustrates, the diaper opportunity in developing markets is significant, especially when compared to the more mature markets.
Figure 46. Projected Population of 0–4 Year-Olds in 2010 millions
1 28
3
120
85
0
40
80
120
India Australia China S. Korea Russia U.K.
Source: United Nations Population Division
Indeed, Tom Falk, Kimberly’s CEO, pointed out that the six key “BRICIT” countries (Brazil, Russia, India, China, Indonesia, and Turkey) “account for half of the world’s population, but the disposable diaper markets in those countries, while growing rapidly, are only 15%–20% penetrated. So, even though Kimberly’s sales in the BRICIT countries rose 30% in 2005, those sales accounted for only 4% of total revenues.”
In many parts of China, particularly the vast rural areas, the toilet training of toddlers often involves, as one observant analyst noted, pants that “are split open at the crotch such that the children effectively go to the bathroom on the street.”22 As urbanization spreads, however, it seems unlikely that parents will want to risk an “accident” in, say, a store or an office, suggesting a tremendous market opportunity for Kimberly’s Huggies and Pull-Ups brands of diapers and training pants.
At the other extreme, babies in Russia tend to be potty trained by an average age of approximately 18 months. It seems likely, however, that while Russian parents may have had the time to engage in such training under a socialist system, as market forces advance in that country and the “time-drought” worsens, many parents will take the convenient approach of fitting their children with diapers.
22 See Wendy Nicholson’s March 15, 2004, “Near-Term Growth in China” report
The diaper opportunity in developing markets is significant, especially when compared to the more mature markets.
“BRICIT” countries account for half of the
world’s population, but the disposable diaper
markets in those countries are only 15%–
20% penetrated.

Brand Behemoths – March 31, 2006
59
Importantly, Tom Falk points out that diaper markets are “not identical worldwide, necessitating a degree of product customization” by Kimberly. So, for example, in South Korea, the hot and humid summers created demand for a breathable diaper (which ultimately became a popular product in other countries too).
Tom Falk states that Kimberly’s goal is to offer “a full range of products to care for infants and toddlers.” So, Kimberly aspires to be, as it were, a one-stop shop for global mothers — Figure 47 lists the infant and toddler products that Kimberly currently offers in the U.S.
Figure 47. Kimberly-Clark’s Baby and Toddler Products by brand
Babies --------------------Toddlers--------------------
Huggies Huggies Pull-Ups
Diapers Detangler Training Pants
Baby Wipes Body Wash
Shampoo Cleansing Cloth GoodNites
Washcloths Bath Mitt Underpants
Baby Wash Shampoo
Lotion Hand Soap Little Swimmers
Liquid Powder/Rash Cream Flushable Moist Wipes Disposable Swimpants
Disposable Changing Pads
Source: Company reports
Brand Behemoths – March 31, 2006
60
Some brands are essentially confined to a single product category (e.g., Clorox is confined to bleach/cleaning products) while others “stretch” across several categories (e.g., L’Oréal encompasses hair products, color cosmetics, and women’s and men’s skin care). Two factors facilitate a brand’s ability to stretch:
➤ What consumers’ think about the brand, and
➤ The company’s market orientation.
What Consumers Think The power of a brand lies in two types of imprints it makes on a consumer’s mind: brand awareness and brand associations.23
➤ Brand awareness simply reflects the degree to which consumers are familiar with the brand. As such, it dictates which brands consumers can even consider.
➤ Brand associations, on the other hand, dictate how consumers will evaluate or infer characteristics of the brand. A brand association is whatever comes to a consumer’s mind when the consumer thinks of the brand. It can be specific products, properties of the product, usage occasions, spokespeople, promotional avenues — literally anything that comes to mind on mention of the brand name or view of its logo. The nature of a brand’s associations dictates its ability to stretch.
For a brand to stretch, its critical associations must extend beyond that of the specific product itself. For example, Clorox is, for most people, simply bleach — great bleach but, nonetheless, only bleach. It is hard for most consumers to think of Clorox as anything but bleach. On the other hand, Nike and the symbolism of effort, toughness, and performance created by the slogan “Just Do It!” has allowed it to stretch not only from its core running shoe into other athletic shoes, but also into sports apparel and watches. Similarly, Harley-Davidson is not simply a motorcycle; it represents a lifestyle of freedom. That association has enabled Harley Davidson to put its name on everything from t-shirts to key chains to restaurants, anything that can be bought by someone who aspires to a lifestyle of freedom.
Market Orientation Importantly, companies can stretch even when their brands do not. Major consumer products companies, such as Unilever and Procter & Gamble, are multi-brand companies that stretch over a broad spectrum when each individual brand may not be able to. The market orientation of these companies allows them to stretch and be successful in a wide variety of markets. A market-oriented company recognizes that consumers do not buy products; they buy benefits.
23 See Keller, Kevin L., Strategic Brand Management: Building, Measuring, and Managing Brand Equity, Upper Saddle River, NJ: Prentice Hall, 2003.
“Stretching” — Extending Brands Across Categories
The power of a brand lies in two types of imprints
it makes on a consumer’s mind: brand
awareness and brand associations.
Companies can stretch even when their brands
do not.

Brand Behemoths – March 31, 2006
61
Figure 48 illustrates the categories (of the 30 that we have focused on) in which the ten brand behemoths already have leadership positions. Note that this figure more than likely downplays the extent of brand “stretching” by the ten companies for two reasons: 1) as noted, it only focuses on 30 categories and, therefore, excludes many others; and 2) it only lists categories in which the brand behemoth has a No. 1 position in some region of the world — if the company has the No. 2 position in a region, that is not captured in the figure.
Figure 48. Brand “Stretching” categories in which brand behemoth had No. 1 position in 2004 in some region of the world
Brand Behemoth # of Categories Categories
Unilever 10 Bath & Shower, Color Cosmetics, Deodorant, Hair Care, Ice Cream, Laundry Care, Sauces & Dressings, Soups, Surface Care, Tea
Procter & Gamble 7 Coffee, Deodorant, Diapers, Hair Care, Laundry Care, Oral Hygiene, Surface Care
Nestlé 5 Baby Food, Bottled Water, Chocolate Confectionery, Coffee, Ready Meals
PepsiCo 4 Biscuits, Fruit/Vegetable Juice, Functional Drinks, Sweet & Savory Snacks
Danone 3 Biscuits, Bottled Water, Yogurt
Kimberly-Clark 2 Diapers, Facial Tissues
L’Oréal 2 Color Cosmetics, Hair Care
Colgate-Palmolive 1 Oral Hygiene
Kellogg 1 Breakfast Cereals
Wrigley 1 Gum
Source: Citigroup Investment Research and Euromonitor International
Nonetheless, Figure 48 illustrates that all but three of the behemoths have stretched their brand so successfully that, in one region or another, they have attained the No. 1 position in at least two categories.
Stretching and Brand Behemoths
From Cereal to Snack Bars A core competency of Kellogg has been its solid track record with new product innovations. Over several decades, the company has introduced many highly successful cereals (e.g., Special K with Red Berries, Crispix, Corn Pops, Fruit Loops), and has even occasionally invented new food categories, such as breakfast bars, under its Nutri-Grain brand.
In recent years, Kellogg used its strong cereal franchise to support an expansion into the snack bar category. The U.S. snack bar market has experienced rapid growth due to the positioning of snack bars as wholesome meal replacements. This has appealed to today’s on-the-go consumers, who are seeking convenience and quality in their meal selections. In particular, the breakfast bar subsegment drove the overall growth in the snack bar category, which tied in nicely with Kellogg’s core portfolio.
Kellogg used its strong cereal franchise to
support an expansion into the snack bar
category.

Brand Behemoths – March 31, 2006
62
Kellogg used its respected ready-to-eat (RTE) cereal brands to support breakfast bar launches. The company has enjoyed a host of successful new product launches in the breakfast bar category, including the launch of its Fruit Loops and Frosted Flakes bars in 2003 (see Figure 49). Backing its breakfast bars with the brand names of other well-respected and reputable RTE cereal brands gives Kellogg a strong competitive advantage in the breakfast bar segment, making it more difficult for new entrants to compete.
Figure 49. Kellogg’s New Breakfast Bar Volume Trends in millions; food, drug, and mass channels, excluding Wal-Mart
0
1
2
3
4
Jan-03 Feb-03 Mar-03 Apr-03 May-03 Jun-03
Frosted Flakes Breakfast Bars
Froot Loops Breakfast Bars
0
Source: A.C. Nielsen
From Gum to Mints Wrigley underwent a significant transition in 1999 when William Wrigley Sr. passed away and William Wrigley Jr. took over the company. Under the elder Wrigley, the company stuck to a growth plan of geographical expansion. The approach was very successful, with solid sales and earnings growth for many years. Compared with the changes his son would make, however, the approach was more conservative, as there were very few new product introductions, and growth was organic.
In the years since Bill Wrigley Jr. has taken over, new product activity has increased significantly, with Wrigley’s $100 million R&D center in Chicago (opened in 2004) being a key factor driving this new product development. Specifically, new products as a percentage of overall company sales have climbed from about 6% in the year preceding Wrigley Jr.’s ascension to CEO to 17% in 2005 — see Figure 50. (Note that management has indicated that the sustainable level of new products, as a percentage of total sales, is in the range of 10%–20%, with variations naturally occurring at the higher and lower ends of that range.)
Kellogg went from zero breakfast bars to 2.5
million units per month in three months.
Wrigley’s new products as a percentage of
overall company sales climbed from about 6% in 1998 to 17% in 2005.

Brand Behemoths – March 31, 2006
63
Figure 50. Wrigley’s New Products as a Percentage of Total Sales
6%
10%
16%
20%
23%
17% 17%19%
0%
5%
10%
15%
20%
25%
1998 1999 2000 2001 2002 2003 2004 2005 2006
SUSTAINABLE LEVEL
Note: 2006 data not yet available Source: Company reports and Citigroup Investment Research
Largely as a result of this increased focus on innovation, there has been a sharp acceleration in sales growth at the company. While Wrigley Sr. presided over a very respectable 9% compound annual sales growth rate (CAGR) during the last 15 of his 39 years heading the company, the sales CAGR in his last four years slowed to 5%. By contrast, between 2001 and 2005, the sales CAGR has been 15%.
Specific examples of new product types in recent years include:
➤ Thin-film breath strips, a category Wrigley entered in 2002 with Eclipse Flash.
➤ Mints. Wrigley launched Eclipse mints in the U.S. in 2003, and underscored its commitment to mints with its 2004 acquisition of Altoids and Lifesavers.
The breadth of Wrigley’s platform today provides an opportunity to build a brand across product forms, all offering fresh breath. So, for example, an ad campaign can include both mints and gum with the message “Eclipse can solve breath problems.”
From Women’s to Men’s Skin Care L’Oréal has been pushing into the fast-growth men’s skin care category. It is estimated that about 20% of men in the U.S. and Europe use skin care products today (with half of these products “borrowed” from their partners), a percentage that is expected to double over the next ten years (see Figure 51).
Figure 51. Percentage of Men in U.S. and Europe Using Skin Care Products
20%
40%
0%
10%
20%
30%
40%
50%
2005 2015e Source: Citigroup Investment Research
20% of men in the U.S. and Europe use skin care products today,
with half of these products “borrowed”
from their partners.

Brand Behemoths – March 31, 2006
64
Biotherm was L’Oréal’s first brand to enter the male skin category in 1958 and the brand now offers anti-blemish, anti-aging, and body care products. In 2003, Lancôme launched Lancôme Homme, while more than a third of all Kiehl’s sales are for men. But while L’Oréal controls about half the European prestige market in male skin care, it has been weak in the mass skin care market. As a result, L’Oréal launched its first mass male skin care range, Men Expert, at the end of 2004 in Europe, and in first quarter 2005 in the U.S.
With regard to other extensions, Citigroup Investment Research analyst Andy Smith speculates that men’s hair care (“anti-gray”) could be another segment that L’Oréal targets, perhaps under the Color Expert line.
From Diapers to Adult Incontinence… As noted, Kimberly-Clark has a particularly strong franchise in children’s diapers. Reflecting the aging baby boomers in the Western world, as well as in Japan, Kimberly has been extending that franchise (in part by using the manufacturing insights it has learned from diapers) into the growing adult incontinence segment (which already accounts for about 10% of revenues).
It is estimated that more than 19 million North American adults have some form of incontinence (80% of them women) — see Figure 52 — and that 50%, or more, of the elderly persons living at home or in long-term care facilities are incontinent. Kimberly CEO Tom Falk estimates that “only one-third of people with incontinence are using incontinence products regularly.”
Figure 52. Percentage of Persons in North America with Urinary Incontinence by Age in 2001
0%
10%
20%
30%
40%
50%
0 10 20 30 40 50 60 70 80
Male Female
Source: Tri-State Incontinence Support Group
As a result of these trends, Kimberly-Clark’s North American Adult Care business has been growing at a double-digit rate. Tom Falk points out that “the fastest area of growth has been ‘light-end incontinence,’ particularly in women.” As they age, many women in the U.S., especially those who have borne children, are finding the need for an incontinence pad that offers better absorbency than a regular feminine pad, but with the same shape and form that they are familiar with.
Kimberly-Clark is extending into the
growing adult incontinence segment.

Brand Behemoths – March 31, 2006
65
…And from a Tissue to a Delivery Mechanism Kleenex is one of a handful of brand names that is often associated with a single product. (We discussed above the unfortunate case of Perrier that, for many consumers, used to be synonymous with “bottled water.”). However, Kimberly-Clark has been working hard to alter consumer perceptions, so that Kleenex is perceived as more than just a tissue. As CEO Falk observes, Kimberly is trying to “expand the functionality of the product.”
So, for example, Kimberly’s Kleenex Anti-Viral tissue has a moisture-activated middle layer that is scientifically proven to kill cold and flu viruses. When moisture from a runny nose, cough, or sneeze comes in contact with the tissue’s special middle layer, cold and flu viruses are trapped and killed. (We believe that, in parts of the world, such as China, where SARS and bird flu are hot issues, the anti-viral properties of such tissues will likely be a key selling point in the future.) Anti-viral is just one potential use of tissue delivery mechanisms, with a whole range of other possibilities, including, for example, using tissues to deliver face cream (for skin care).
In parts of the world such as China, where SARS and bird flu are
hot issues, the anti-viral properties of tissues will
likely be a key selling point in the future.

Brand Behemoths – March 31, 2006
66
As outlined above, for successful brand behemoths there is something of a virtuous circle involving product technology, branding, distribution, and knowledge of consumer preferences:
➤ First, a company needs a good product.
➤ Once the reputation of the product is established, effective branding will drive purchases by a growing number of consumers.
➤ In order to reach consumers in different regions, the company will need to expand its distribution network.
➤ Given the knowledge of what motivates consumers in different markets and a sprawling distribution network, a company can then seek to stretch its brand across categories.
Importantly, as we noted above, brand leadership is viscous, so gaining share takes time. In other words, even for companies with a strong brand, it’s not a straightforward matter to extend that brand across regions and categories. As Citigroup Investment Research analyst Warren Ackerman observes:
The emerging market opportunity should benefit those companies that have entered early, developed consumer insights and critical mass [italics added]. Developing a business from scratch in a market like India or China could take a decade or so to become profitable and, even then, there is no certainty that any profits will be generated.
The European food space is littered with companies that are still not at breakeven after a decade or more in developing markets. True, the demographics are favorable in markets like Brazil, Russia, China, and Indonesia, but unlocking this opportunity with the right business model is the trick.24
The longer that a company has enjoyed market share stability in a particular region or category, the more time it will have had to exploit that position by extending its distribution network and/or by more fully understanding consumer preferences. Note that Nestlé has been in China since 1908; Colgate-Palmolive has been in India since 1937; and Unilever has been in East Asia since 1933 (see Figure 53). On average, the ten brand behemoths have more than 39 years in those three markets.
So, for example, as we discuss below, Kimberly-Clark, which first entered the East Asian market by way of a joint venture in the Philippines in 1963, has learned that, in developing Asia, the preference is for low-cost diapers that offer moderate functionality. Insights such as this one give Kimberly an edge as it targets new markets in Asia, such as China. Then, too, as is the case with Colgate-Palmolive in Latin America, a prolonged period of share stability in a market can act as a significant hurdle for competitors to overcome.
24 See Warren Ackerman’s March 29, 2005, “Nestlé SA” report.
A Prolonged Period of Share Stability in a Market
The emerging market opportunity should
benefit those companies that have entered early
and developed consumer insights and critical
mass.
The longer that a company has enjoyed
market share stability in a particular region or
category, the more time it will have had to exploit
that position by extending its distribution
network and/or by more fully understanding
consumer preferences.

Brand Behemoths – March 31, 2006
67
Figure 53. Year of First Entry of Manufacturing Operation/Subsidiary into Region by ten brand behemoths
U.S. W. Europe Japan Latin/ S. America
East Asia E. Europe China India
Colgate-Palmolive 1806 1920 1978 1927 1930 1992 1992 1937
Danone 1942 1919 1980 1970 1999 1989 1987 1990
Kellogg 1906 1922 1963 1951 NMF 1993 1995 1994
Kimberly-Clark 1872 1955 NMF 1955 1963 1995 1994 1994
L’Oréal 1953 1907 1963 1939 1993 1991 1997 1985
Nestlé 1900 1867 1913 1921 1905 1991 1908 1912
PepsiCo 1902 1936 1966 1907 1947 1966 1982 1988
Procter & Gamble 1837 1930 1973 1948 1935 1991 1988 1985
Unilever 1906 1872 1930 1926 1933 1992 1986 1913
Wrigley 1891 1927 NMF NMF 1915 1990 1981 2004
Note: NMF= not meaningful Source: Citigroup Investment Research and Company Reports
Leveraging a Local Market Presence
Through its “Power of One” initiative, PepsiCo has sought to realize potential synergies at the retail level between its snack and beverage businesses. So, for example, Pepsi has been selling its cola in Latin America since the early 20th century and, in recent decades, it has introduced Frito-Lay snacks into those markets too. (Frito-Lay merged with PepsiCo in 1965.)
In Mexico (Frito’s largest market in Latin America), the Power of One strategy has meant that convenience stores and gas stations now represent the largest source of snack sales. Mike White, chairman and CEO of Pepsi International points out that the company has “established over 20,000 snack and beverage centers in the small shops, the changarros, in Mexico.” Moreover, Massimo D’Amore, executive vice president, commercial, of PepsiCo International, points out that, in many emerging markets, PepsiCo has had to “overcome infrastructure issues that don’t exist in developed markets,” such as that “there are many mom-and-pop stores that have no formal address.”
PepsiCo is employing the Power of One strategy in relatively new markets too. In China, which PepsiCo first entered in 1982, a recent Power of One promotion created special packs containing Stax chips and Pepsi cola. In the Indian market (first entered in 1988), a similar “chip and sip” promotion combined Lay’s chips and Pepsi cola.
Entrenched in Latin America for 80 Years Colgate-Palmolive entered Latin America almost 80 years ago (specifically, it entered Brazil in 1927), invested steadily in its brands and in new product innovation, and developed very close ties to key distribution channels in the region.
Pepsi has been selling its cola in Latin America
since the early 20th century and, in recent
decades, it has introduced Frito-Lay
snacks into those markets too.

Brand Behemoths – March 31, 2006
68
Importantly, Colgate opted to invest in the region during times of crisis, so that it continued to maintain its market share during (and after) these periodic crises.
Thanks in large part to Colgate’s efforts, average annual consumption of toothpaste in Latin America is 650 grams (and there are two toothbrushes per person), which is basically comparable to U.S. averages. In addition, Colgate’s profit margins in the region have consistently been among the strongest in the company’s global portfolio, a factor that supports advertising and other product support initiatives.
Colgate’s well-entrenched position in Latin America makes it very challenging (in terms of the cost and time required) for competitors to steal market share — as Figure 54 illustrates, Colgate’s lead over its closest competitor in Latin America is a significant 43 percentage points.
Figure 54. Colgate-Palmolive’s Market Share Lead in Oral Hygiene over Closest Competitor 2004
0%
10%
20%
30%
40%
50%
Latin/SouthAmerica
China India EasternEurope
East Asia WesternEurope
USA Japan
NMFNMF
Note: NMF = not meaningful Source: Citigroup Investment Research and Euromonitor International
A Sticky Position in Gum Wrigley has been in the chewing gum business since 1891, and has leading market share positions in practically every market it participates in. The company’s wide geographic reach was created over decades of planning and investments, and would likely be difficult, if not outright impossible, to replicate today.
Indeed, on a global basis, Wrigley has no true peer, as it commands a dominant 35% share of the global gum market (with its closest competitor having a 25% share). Much like Colgate’s dominance of the Latin American oral hygiene market, Wrigley’s leading share in gum acts as a formidable hurdle to competitors.
Specifically, Wrigley’s high margins (the company boasts gross margins in the high 50%’s) enable it to invest heavily in its brands. Using SG&A comparisons as an indicator of brand support levels, Figure 55 illustrates that Wrigley spends twice as much on brand support as Hershey, another confectionery company. This investment allows Wrigley to 1) build brand equity by way of heavy advertising, and 2) defend itself with aggressive consumer promotions (including free samples), when necessary.
Wrigley spends twice as much on brand support
as Hershey.

Brand Behemoths – March 31, 2006
69
Figure 55. Wrigley and Hershey SG&A as a Percentage of Sales
35% 36% 36% 35% 35% 36%
19% 19% 19% 19% 19% 18%
0%
10%
20%
30%
40%
2000 2001 2002 2003 2004 2005 2006
WrigleyHershey
Note: 2006 data not yet available Source: Company reports and Citigroup Investment Research
Acquiring a History in a Market It has been argued that a key reason for Procter & Gamble’s acquisition of Gillette was to gain exposure to attractive opportunities in developing markets. Indeed, Jim Kilts, vice chairman of Procter & Gamble (and former chairman and CEO of Gillette) notes that “as a freestanding company, Gillette had success growing our developing markets faster than our developed markets.” So, for example, whereas P&G only entered Brazil in 1988 (but entered some other Latin American markets considerably earlier, e.g., Mexico in 1948), Gillette has been operating in Latin America since the 1920s. Today, Gillette enjoys huge market shares in that region, e.g., 78% in razors and blades, 44% in batteries.
Over time, it is likely that P&G will take advantage of the opportunity to better coordinate and cross-pollinate the distribution of each company’s respective products. Jim Kilts points out one example of this potential in China, where “our entry-level Vector system quadrupled over the past four years. This growth will continue as we utilize Procter & Gamble’s distribution throughout China and introduce the product into other Asian markets.” Indeed, Jim Stengel, P&G’s global marketing officer, says that P&G’s distribution infrastructure in China is “incredible — we have distribution in 2,000 cities and 11,000 villages.”
Similarly, Gillette’s Duracell products are distributed in only 46% of traditional trade locations (i.e., bodegas, kiosks, and small grocery stores) in Mexico, versus a 90% rate for P&G products; in Brazil, Pampers is distributed in only 29% of traditional trade, whereas Prestobarba (Gillette’s local razors and blades brand) is in 73% of stores.
A key reason for Procter & Gamble’s acquisition
of Gillette was to gain exposure to attractive
opportunities in developing markets.

Brand Behemoths – March 31, 2006
70
Decades of Dominance in Diapers Kimberly-Clark, which has been exceptionally strong in the U.S. tissue and diaper markets for decades, has a well-established track record in establishing a presence in overseas markets — it entered the South Korean market 36 years ago, the Taiwanese market 37 years ago, and the Mexican market 51 years ago. The company has generally been successful in foreign markets when it has entered into a joint venture with a local partner. This knowledge of the pros and cons of entering into a joint venture, as opposed to going it alone in a new market, give Kimberly an edge as it targets new markets in Asia, such as China.
Kimberly’s motivation for a partnership is, primarily, to get access to distribution networks and, secondarily, to gain local market knowledge. With regard to the latter point, Kimberly has gained valuable insights into consumer preferences in different parts of the globe over the years. So, for example, in developing East Asia, the preference is for low-cost diapers that offer moderate functionality; in the German toilet tissue market, CEO Falk notes that consumers “value strength not softness,” while their “green” sentiment leads to greater acceptance of recycled fiber in toilet tissue.
Kimberly’s motivation for a partnership is,
primarily, to get access to distribution networks
and, secondarily, to gain local market knowledge.

Brand Behemoths – March 31, 2006
71
Biographies Peter N. Golder Peter N. Golder is an associate professor of marketing at New York University Stern School of Business. He currently teaches the marketing concepts and new product development courses.
Professor Golder has been with NYU Stern since 1995. His primary research interests include brands, business strategy, marketing strategy, new products, and market entry. He has published papers in leading academic journals, including Management Science, Sloan Management Review, Journal of Marketing Research, and Marketing Science. His research has been featured in the Wall Street Journal several times, as well as in the Economist and Advertising Age. He has also been recognized with three of the marketing discipline’s most prestigious best paper awards. He has advised large and small companies on issues related to his research specialties. Professor Golder is the co-author of Will and Vision: How Latecomers Grow to Dominate Markets, which was selected by Harvard Business Review as one of the ten best business books of 2001.
Professor Golder received his bachelor of science in mechanical engineering from the University of Pennsylvania, Philadelphia, and his doctor of philosophy in business administration (marketing) from the University of Southern California, Los Angeles.
Joel H. Steckel Professor Steckel has been with NYU for more than 15 years. His primary research areas of interest include marketing research, marketing and branding strategy, approaches for one-to-one marketing, managerial decision processes and methodologies for measuring consumer performance and behavior. He has consulted for several major corporations, and testified in litigation as an expert on these issues. Professor Steckel has published numerous articles in publications, including Journal of Marketing Research , Management Science, Journal of Retailing, Journal of Marketing, Marketing Science, Interfaces, and Journal of Consumer Research . He has authored two textbooks on marketing strategy and marketing research, as well as a practitioner-oriented book on quantitative methods in marketing.
He is the founding president of the INFORMS Society for Marketing Science, the foremost professional association for the development and dissemination of quantitative methods in marketing. Before joining NYU Stern, Professor Steckel held professorial positions at Columbia University, the University of California at Los Angeles, and the Yale University.
Professor Steckel received his bachelor of arts in mathematics from Columbia University, where he was elected to Phi Beta Kappa, and his master of business administration in management science and his doctor of philosophy in marketing/statistics from the University of Pennsylvania, Wharton.
Appendix A

Brand Behemoths – March 31, 2006
72
General Forecasting Principles Market share forecasts are based on four primary factors, and many ancillary factors.
Primary Forecasting Factors Several factors were considered in generating forecasts of brand leaders in 2010. Most importantly, Professors Golder and Steckel considered a company’s current market share, as well as its market share advantage over the No. 2 and No. 3 companies. The larger a company’s market share advantage over its nearest competitors, the more likely it is to continue its lead five years in the future. Not surprisingly, the long-term success of a brand is proportional to the strength of its starting position.25
A second set of important factors includes a company’s global and regional market shares. These factors are important because a company that is strong globally or locally can leverage its market knowledge into other countries and regions.26 In particular, companies can leverage this knowledge into other countries that are similar to countries where the company is currently strong.
A third important factor was a company’s general strength in a country, as measured by a leadership position in more than one category. This type of strength is particularly important because it enables companies to leverage their distribution systems, which are a key asset in nondurable markets.27
A fourth key factor is how market shares change over time. These trends are particularly important because they capture the net effect of a company’s actions across the complete range of strategic and marketing actions (i.e., innovation and new product development, product positioning, advertising and promotion, distribution, and pricing).
In general, the analysis reveals a high degree of market share stability. This result is consistent with a general finding that market shares are in equilibrium.28 Leadership transitions are more likely over many decades, but they are less likely to occur over five- to ten-year periods. In addition, maintaining leadership is more common in nondurables, and leadership stability is especially pronounced in food and beverages.29
25 See Golder, Peter N., “Historical Method in Marketing Research with New Evidence on Long-Term Market Share Stability,” Journal of Marketing Research, 37 (May, 2000), 156-172. 26 See Mitra, Debanjan and Peter N. Golder, “Whose Culture Matters? Near-Market Knowledge and Its Impact on Foreign Market Entry Timing,” Journal of Marketing Research, 39 (August, 2002), 350-365. 27 See Tellis, Gerard J. and Peter N. Golder, “First to Market, First to Fail? Real Causes of Enduring Market Leadership,” Sloan Management Review, (Winter, 1996), 65-75 and Tellis, Gerard J. and Peter N. Golder, Will and Vision: How Latecomers Grow to Dominate Markets, New York: McGraw-Hill, 2002. 28 See Lal, Rajiv and V. Padmanabhan, “Competitive Response and Equilibria,” Marketing Science, 14 (1995, Number 3, Part 2 of 2), G101-G108 and DeKimpe, Marnik G. and Dominique M. Hanssens, “Empirical Generalizations About Market Evolution and Stationarity,” Marketing Science, 14 1995 Number 3, Part 2 of 2), G109-G121. 29 See Golder, op. cit.
Appendix B
Brand Behemoths – March 31, 2006
73
In general, leading companies and their strong brands provide several advantages.30 Indeed, recent research on the longitudinal relationship between objective quality and perceived quality reveals an important advantage for strong brands.31 When high-reputation brands improve their relative quality, consumers perceive this increase faster than for similar improvements by low-reputation brands. Also, when high-reputation brands decline in relative quality, consumers perceive this decrease slower than for similar decreases by low reputation brands. These asymmetries in consumer perceptions between high-reputation and low-reputation brands provide an important, sustainable advantage for leading brands.
Ancillary Forecasting Factors In addition to the four primary factors, Professors Golder and Steckel also considered multiple additional factors that have been shown to influence the degree of leadership stability in a category.
First, in markets with heterogeneous consumer preferences, companies typically establish leadership by offering a variety of products suited to these various tastes.32 In these situations, a challenging company must offer an attractive product line in order to overtake the leader.
Second, leaders in children’s products tend to maintain their leadership.33 One reason for this result is that parents will buy brands they used when they were children for their own children to use.
A third and related factor is risk aversion. When consumers are risk averse, they tend to stick with their current brands. A prototypical example of risk aversion in children’s products is Gerber baby food.
Fourth, larger and more established markets contribute to leadership stability. In the early stages of a new product market, consumer preferences and the products themselves are still evolving. Yet, those companies that have established leadership by the growth stage of the new market have above-average rates of leadership persistence.34
Fifth, when products have ambiguous performance criteria, it is difficult for a challenging brand to establish “superior” performance.35 Many food, beverage, and household items perform more ambiguously than other products like computers, digital cameras, and automobiles, which have clear performance measures.
30 See Keller, Kevin L., Strategic Brand Management: Building, Measuring, and Managing Brand Equity, Upper Saddle River, NJ: Prentice Hall, 2003. 31 See Mitra, Debanjan and Peter N. Golder, “How Does Objective Quality Affect Perceived Quality? Short-Term Effects, Long-Term Effects, and Asymmetries,” Marketing Science, forthcoming. 32 See Bohlmann, Jonathan D., Peter N. Golder, and Debanjan Mitra, “Deconstructing the Pioneer’s Advantage: Examining Vintage Effects and Consumer Valuations of Quality and Variety, Management Science, 48 (September, 2002), 1175-1195. 33 See Golder, Peter N., “Insights from Senior Executives about Innovation in International Markets,” Journal of Product Innovation Management, 17 (September, 2000), 326-340. 34 See Golder, Peter N. and Gerard J. Tellis, "Pioneer Advantage: Marketing Logic or Marketing Legend?" Journal of Marketing Research, (May, 1993), 158-170. 35 See Bohlmann, Jonathan D., Peter N. Golder, and Debanjan Mitra, op. cit.

Brand Behemoths – March 31, 2006
74
Extrapolative Forecasts Given the above, the specific forecasts were obtained through a series of trend extrapolations and curve-fitting exercises. Academic research has shown that, when an analyst has access to a time series of data on the variable to be forecast over time (e.g., market share), trend extrapolations provide a common and viable approach to forecasting.36 Trend extrapolations assume that the pattern of the past will continue into the future. This assumption of constancy is an underlying premise of all quantitative forecasting techniques, even in seemingly more complicated causal procedures that explicitly incorporate variables known to cause changes in market share, such as advertising and R&D.
If the task is purely to forecast market share, such causal procedures are actually less useful than trend extrapolations.37 Without special foresight as to how the causal variables are going to change in the future, models that incorporate causal variables are almost impossible to apply. Of course, if there are unforeseeable discontinuous changes in the patterns of the underlying causal variables, the extrapolative forecasts will be subject to error. That said, these variables are accounted for in the forecasts. The assumption of constancy simply provides that any time varying patterns of these causal variables in the past will persist into the future.
36 See Rao, Vithala R. and Joel H. Steckel, Analysis for Strategic Marketing, Reading, MA: Addison-Wesley, 1998, Chapter 6. 37 See Makridakis, Spyros and Steven C. Wheelwright, Forecasting: Methods & Applications, New York: Wiley, 1978.
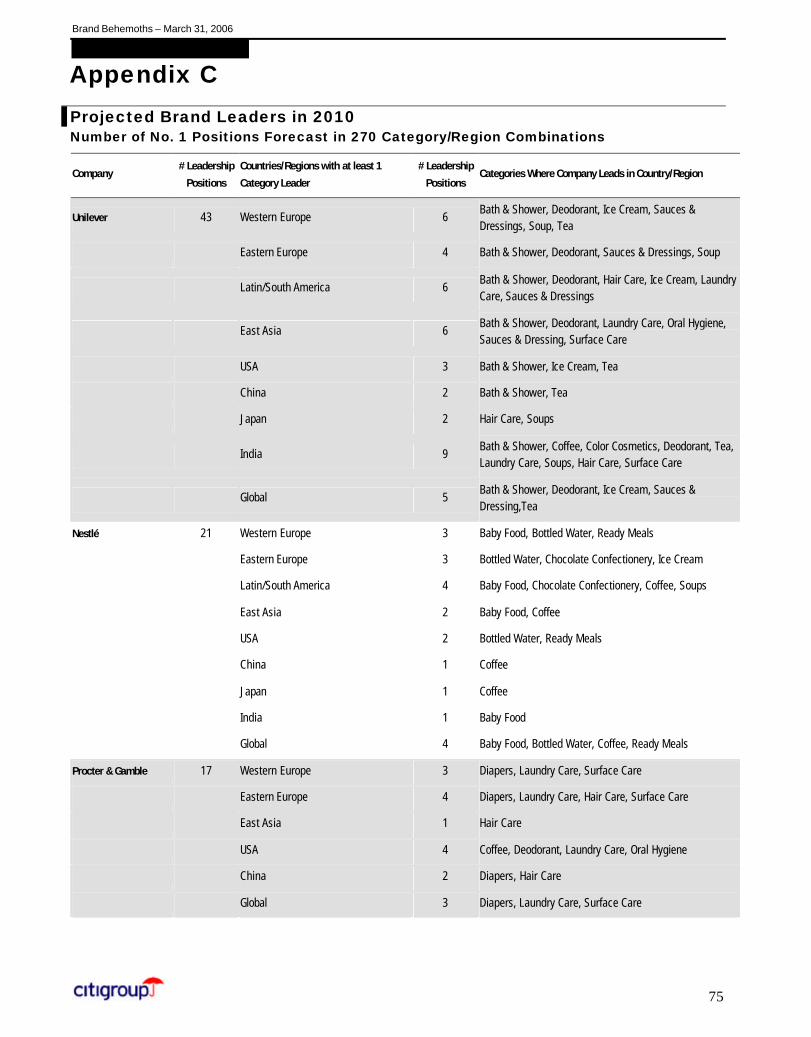
Brand Behemoths – March 31, 2006
75
Projected Brand Leaders in 2010 Number of No. 1 Positions Forecast in 270 Category/Region Combinations
Company # Leadership
Positions
Countries/Regions with at least 1
Category Leader
# Leadership
Positions Categories Where Company Leads in Country/Region
Unilever 43 Western Europe 6 Bath & Shower, Deodorant, Ice Cream, Sauces & Dressings, Soup, Tea
Eastern Europe 4 Bath & Shower, Deodorant, Sauces & Dressings, Soup
Latin/South America 6 Bath & Shower, Deodorant, Hair Care, Ice Cream, Laundry Care, Sauces & Dressings
East Asia 6 Bath & Shower, Deodorant, Laundry Care, Oral Hygiene, Sauces & Dressing, Surface Care
USA 3 Bath & Shower, Ice Cream, Tea
China 2 Bath & Shower, Tea
Japan 2 Hair Care, Soups
India 9 Bath & Shower, Coffee, Color Cosmetics, Deodorant, Tea, Laundry Care, Soups, Hair Care, Surface Care
Global 5 Bath & Shower, Deodorant, Ice Cream, Sauces & Dressing,Tea
Nestlé 21 Western Europe 3 Baby Food, Bottled Water, Ready Meals
Eastern Europe 3 Bottled Water, Chocolate Confectionery, Ice Cream
Latin/South America 4 Baby Food, Chocolate Confectionery, Coffee, Soups
East Asia 2 Baby Food, Coffee
USA 2 Bottled Water, Ready Meals
China 1 Coffee
Japan 1 Coffee
India 1 Baby Food
Global 4 Baby Food, Bottled Water, Coffee, Ready Meals
Procter & Gamble 17 Western Europe 3 Diapers, Laundry Care, Surface Care
Eastern Europe 4 Diapers, Laundry Care, Hair Care, Surface Care
East Asia 1 Hair Care
USA 4 Coffee, Deodorant, Laundry Care, Oral Hygiene
China 2 Diapers, Hair Care
Global 3 Diapers, Laundry Care, Surface Care
Appendix C

Brand Behemoths – March 31, 2006
76
Company # Leadership
Positions Countries/Regions with at least 1 Category Leader
# Leadership Positions
Categories Where Company Leads in Country/Region
Coca-Cola 13 Western Europe 1 Carbonates
Eastern Europe 1 Carbonates
Latin/South America 1 Carbonates
East Asia 1 Carbonates
USA 2 Carbonates, Fruit & Vegetable Juice
China 1 Carbonates
Japan 2 Carbonates, Fruit & Vegetable Juice
India 2 Bottled Water, Carbonates
Global 2 Carbonates, Fruit & Vegetable Juice
PepsiCo 12 Western Europe 2 Fruit & Vegetable Juice, Sweet & Savory Snacks
Eastern Europe 1 Sweet & Savory Snacks
Latin/South America 3 Biscuits, Functional Drinks, Sweet & Savory Snacks
East Asia 1 Sweet & Savory Snacks
USA 2 Functional Drinks, Sweet & Savory Snacks
India 1 Sweet & Savory Snacks
Global 2 Functional Drinks, Sweet & Savory Snacks
Danone 10 Western Europe 2 Biscuits, Yogurt
Eastern Europe 2 Biscuits, Yogurt
Latin/South America 2 Bottled Water, Yogurt
East Asia 1 Bottled Water
USA 1 Yogurt
China 1 Bottled Water
Global 1 Yogurt
Kimberly-Clark 10 Western Europe 1 Facial Tissues
Eastern Europe 1 Facial Tissues
Latin/South America 2 Diapers, Facial Tissues
East Asia 2 Diapers, Facial Tissues
USA 2 Diapers, Facial Tissues
India 1 Diapers
Global 1 Facial Tissues

Brand Behemoths – March 31, 2006
77
Company # Leadership
Positions Countries/Regions with at least 1 Category Leader
# Leadership Positions
Categories Where Company Leads in Country/Region
Kellogg 7 Western Europe 1 Breakfast Cereal
Latin/South America 1 Breakfast Cereal
East Asia 1 Breakfast Cereal
USA 1 Breakfast Cereal
Japan 1 Breakfast Cereal
India 1 Breakfast Cereal
Global 1 Breakfast Cereal
Colgate-Palmolive 6 Western Europe 1 Oral Hygiene
Eastern Europe 1 Oral Hygiene
Latin/South America 1 Oral Hygiene
China 1 Oral Hygiene
India 1 Oral Hygiene
Global 1 Oral Hygiene
Kraft Foods Inc. 6 Western Europe 1 Coffee
Eastern Europe 1 Coffee
USA 2 Biscuits, Sauces & Dressings
China 1 Biscuits
Global 1 Biscuits
L’Oréal 6 Western Europe 2 Color Cosmetics, Hair Care
USA 1 Hair Care
China 1 Color Cosmetics
Global 2 Color Cosmetics, Hair Care
McDonald’s 6 Western Europe 1 Fast Food
Eastern Europe 1 Fast Food
Latin/South America 1 Fast Food
USA 1 Fast Food
Japan 1 Fast Food
Global 1 Fast Food
Lotte Group 5 East Asia 3 Biscuits, Gum, Ice Cream
Japan 2 Gum, Ice Cream

Brand Behemoths – March 31, 2006
78
Company # Leadership
Positions Countries/Regions with at least 1 Category Leader
# Leadership Positions
Categories Where Company Leads in Country/Region
Wrigley 5 Western Europe 1 Gum
Eastern Europe 1 Gum
USA 1 Gum
China 1 Gum
Global 1 Gum
Cadbury Schweppes 3 Latin & South America 1 Gum
East Asia 1 Chocolate Confectionery
India 1 Chocolate Confectionery
Campbell Soup 3 USA 1 Soups
China 1 Soups
Global 1 Soups
Kao Corp 3 Japan 3 Bath & Shower, Laundry Care, Surface Care
Philip Morris 3 Western Europe 1 Cigarettes
Eastern Europe 1 Cigarettes
USA 1 Cigarettes
Anheuser-Busch 2 USA 1 Beer
Global 1 Beer
Avon Products 2 E. Europe 1 Color Cosmetics
Latin/South America 1 Color Cosmetics
Cereal Partners 2 Eastern Europe 1 Breakfast Cereal
China 1 Breakfast Cereal
China National Tobacco 2 China 1 Cigarettes
Global 1 Cigarettes
Diageo 2 USA 1 Spirits
Global 1 Spirits
Gujarat Cooperative 2 India 2 Ice Cream, Yogurt
Lion 2 Japan 1 Oral Hygiene
Japan 1 Deodorant
Mars 2 China 1 Chocolate Confectionery
Global 1 Chocolate Confectionery

Brand Behemoths – March 31, 2006
79
Company # Leadership
Positions Countries/Regions with at least 1 Category Leader
# Leadership Positions
Categories Where Company Leads in Country/Region
Otsuka Pharmaceutical 2 Japan 1 Functional Drinks
East Asia 1 Functional Drinks
UB Group 2 India 2 Beer, Spirits
Yakult Honsha 2 East Asia 1 Yogurt
Japan 1 Yogurt
AmBev 1 Latin/South America 1 Beer
Amore Pacific Corp 1 East Asia 1 Color Cosmetics
Asahi 1 Japan 1 Beer
Asia Pulp & Paper 1 China 1 Facial Tissues
BBH 1 Eastern Europe 1 Beer
Bright Dairy & Food 1 China 1 Yogurt
Bristol Myers Squibb 1 USA 1 Baby Food
Britannia Industries 1 India 1 Biscuits
British American Tobacco
1 Latin/South America 1 Cigarettes
Cafes La Virginia 1 Latin/South America 1 Tea
Calbee Foods 1 Japan 1 Sweet & Savory Snacks
Cia Müller de Bebidas 1 Latin/South America 1 Spirits
CJ Corp 1 East Asia 1 Ready Meals
Clorox 1 USA 1 Surface Care
East Asiatic Co. (EAC) 1 China 1 Baby Food
Estee Lauder 1 USA 1 Color Cosmetics
Ezaki Glico 1 Japan 1 Biscuits
Ferrero 1 Western Europe 1 Chocolate Confectionery
Foshan Haitian 1 China 1 Sauces & Dressings
GlaxoSmithKline 1 Western Europe 1 Functional Drinks
Grey Market 1 Eastern Europe 1 Spirits
Gruppa Planeta 1 Eastern Europe 1 Ready Meals
Guangdong Jianlibao 1 China 1 Functional Drinks
Guangdong Strong 1 China 1 Sweet & Savory Snacks
Guangzhou Blue Moon 1 China 1 Surface Care
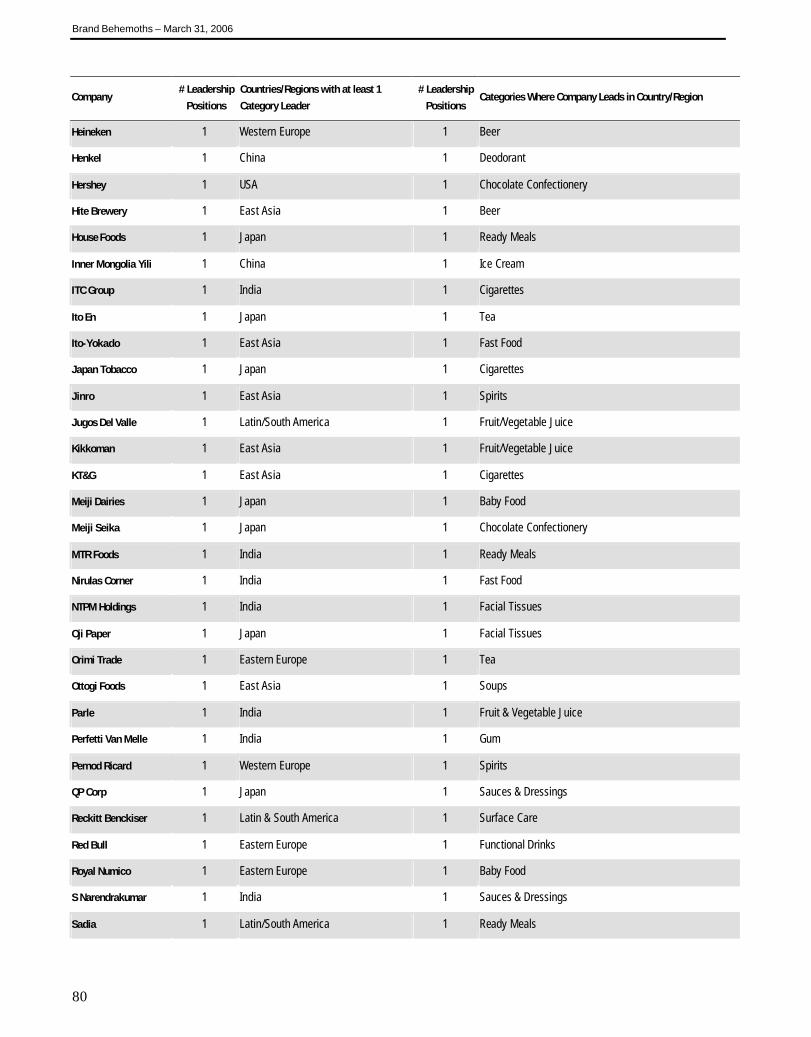
Brand Behemoths – March 31, 2006
80
Company # Leadership
Positions Countries/Regions with at least 1 Category Leader
# Leadership Positions
Categories Where Company Leads in Country/Region
Heineken 1 Western Europe 1 Beer
Henkel 1 China 1 Deodorant
Hershey 1 USA 1 Chocolate Confectionery
Hite Brewery 1 East Asia 1 Beer
House Foods 1 Japan 1 Ready Meals
Inner Mongolia Yili 1 China 1 Ice Cream
ITC Group 1 India 1 Cigarettes
Ito En 1 Japan 1 Tea
Ito-Yokado 1 East Asia 1 Fast Food
Japan Tobacco 1 Japan 1 Cigarettes
Jinro 1 East Asia 1 Spirits
Jugos Del Valle 1 Latin/South America 1 Fruit/Vegetable Juice
Kikkoman 1 East Asia 1 Fruit/Vegetable Juice
KT&G 1 East Asia 1 Cigarettes
Meiji Dairies 1 Japan 1 Baby Food
Meiji Seika 1 Japan 1 Chocolate Confectionery
MTR Foods 1 India 1 Ready Meals
Nirulas Corner 1 India 1 Fast Food
NTPM Holdings 1 India 1 Facial Tissues
Oji Paper 1 Japan 1 Facial Tissues
Orimi Trade 1 Eastern Europe 1 Tea
Ottogi Foods 1 East Asia 1 Soups
Parle 1 India 1 Fruit & Vegetable Juice
Perfetti Van Melle 1 India 1 Gum
Pernod Ricard 1 Western Europe 1 Spirits
QP Corp 1 Japan 1 Sauces & Dressings
Reckitt Benckiser 1 Latin & South America 1 Surface Care
Red Bull 1 Eastern Europe 1 Functional Drinks
Royal Numico 1 Eastern Europe 1 Baby Food
S Narendrakumar 1 India 1 Sauces & Dressings
Sadia 1 Latin/South America 1 Ready Meals

Brand Behemoths – March 31, 2006
81
Company # Leadership
Positions Countries/Regions with at least 1 Category Leader
# Leadership Positions
Categories Where Company Leads in Country/Region
Shanghai Maling 1 China 1 Ready Meals
Shiseido 1 Japan 1 Color Cosmetics
Sosro 1 East Asia 1 Tea
Suntory 1 Japan 1 Bottled Water
Takara Holdings 1 Japan 1 Spirits
Tsingtao 1 China 1 Beer
Uni-Charm 1 Japan 1 Diapers
Uni-President 1 China 1 Fruit/Vegetable Juice
Wimm Bill Dann 1 Eastern Europe 1 Fruit/Vegetable Juice
Wuliangye Yibin 1 China 1 Spirits
Yum! Brands 1 China 1 Fast Food
Zhejiang Nice Daily Use 1 China 1 Laundry Care
N/A N/A India N/A Functional Drinks
Source: Professors Peter N. Golder and Joel H. Steckel and Citigroup Investment Research

Brand Behemoths – March 31, 2006
82
Projected Brand Leader in 2010 by Region for 30 Categories
Category Global China East Asia Eastern Europe
Baby Food Nestlé East Asiatic Co. (EAC) Nestlé Royal Numico
Bath & Shower Unilever Unilever Unilever Unilever
Beer Anheuser Busch Tsingtao Hite Brewery BBH
Biscuits Kraft Foods Inc. Kraft Foods Inc. Lotte Group Danone
Bottled Water Nestlé Danone Danone Nestlé
Breakfast Cereals Kellogg Cereal Partners Kellogg Cereal Partners
Carbonates Coca-Cola Coca-Cola Coca-Cola Coca-Cola
Chocolate Confectionery Mars Mars Cadbury Schweppes Nestlé
Cigarettes China National Tobacco China National Tobacco KT&G Philip Morris
Coffee Nestlé Nestlé Nestlé Kraft Foods Inc.
Color Cosmetics L’Oréal L’Oréal Amore Pacific Corp Avon Products
Deodorant Unilever Henkel Unilever Unilever
Diapers Procter & Gamble Procter & Gamble Kimberly-Clark Procter & Gamble
Facial Tissues Kimberly-Clark Asia Pulp & Paper Kimberly-Clark Kimberly-Clark
Fast Food McDonald’s Yum! Brands Ito-Yokado McDonald’s
Fruit/Vegetable Juice Coca-Cola Uni-President Kikkoman Wimm Bill Dann
Functional Drinks PepsiCo Guangdong Jianlibao Otsuka Pharmaceutical Red Bull
Gum Wrigley Wrigley Lotte Group Wrigley
Hair Care L’Oréal Procter & Gamble Procter & Gamble Procter & Gamble
Ice Cream Unilever Inner Mongolia Yili Lotte Group Nestlé
Laundry Care Procter & Gamble Zhejiang Nice Daily Use Unilever Procter & Gamble
Oral Hygiene Colgate-Palmolive Colgate-Palmolive Unilever Colgate-Palmolive
Ready Meals Nestlé Shanghai Maling CJ Corp Gruppa Planeta
Sauces & Dressings Unilever Foshan Haitian Unilever Unilever
Soups Campbell Soup Campbell Soup Ottogi Foods Unilever
Spirits Diageo Wuliangye Yibin Jinro Grey Market
Surface Care Procter & Gamble Guangzhou Blue Moon Unilever Procter & Gamble
Sweet & Savory Snacks PepsiCo Guangdong Strong PepsiCo PepsiCo
Tea Unilever Unilever Sosro Orimi Trade
Yogurt Danone Bright Dairy & Food Yakult Honsha Danone
Appendix D

Brand Behemoths – March 31, 2006
83
India Japan Latin/South America U.S. Western Europe
Nestlé Meiji Dairies Nestlé Bristol-Myers Squibb Nestlé
Unilever Kao Corp Unilever Unilever Unilever
UB Group Asahi AmBev Anheuser Busch Heineken
Britannia Industries Ezaki Glico PepsiCo Kraft Foods Inc. Danone
Coca-Cola Suntory Danone Nestlé Nestlé
Kellogg Kellogg Kellogg Kellogg Kellogg
Coca-Cola Coca-Cola Coca-Cola Coca-Cola Coca-Cola
Cadbury Schweppes Meiji Seika Nestlé Hershey Ferrero
ITC Group Japan Tobacco British American Tobacco Philip Morris Philip Morris
Unilever Nestlé Nestlé Procter & Gamble Kraft Foods Inc.
Unilever Shiseido Avon Products Estee Lauder L’Oréal
Unilever Lion Unilever Procter & Gamble Unilever
Kimberly-Clark Uni-Charm Kimberly-Clark Kimberly-Clark Procter & Gamble
NTPM Holdings Oji Paper Kimberly-Clark Kimberly-Clark Kimberly-Clark
Nirulas Corner McDonald’s McDonald’s McDonald’s McDonald’s
Parle Coca-Cola Jugos Del Valle Coca-Cola PepsiCo
N/A Otsuka Pharmaceutical PepsiCo PepsiCo GlaxoSmithKline
Perfetti Van Melle Lotte Group Cadbury Schweppes Wrigley Wrigley
Unilever Unilever Unilever L’Oréal L’Oréal
Gujarat Cooperative Lotte Group Unilever Unilever Unilever
Unilever Kao Corp Unilever Procter & Gamble Procter & Gamble
Colgate-Palmolive Lion Colgate-Palmolive Procter & Gamble Colgate-Palmolive
MTR Foods House Foods Sadia Nestlé Nestlé
S Narendrakumar QP Corp Unilever Kraft Foods Inc. Unilever
Unilever Unilever Nestlé Campbell Soup Unilever
UB Group Takara Holdings Cia Müller de Bebidas Diageo Pernod Ricard
Unilever Kao Corp Reckitt Benckiser Clorox Procter & Gamble
PepsiCo Calbee Foods PepsiCo PepsiCo PepsiCo
Unilever Ito En Cafes La Virginia Unilever Unilever
Gujarat Cooperative Yakult Honsha Danone Danone Danone
Source: Professors Peter N. Golder and Joel H. Steckel and Citigroup Investment Research

Brand Behemoths – March 31, 2006
84
Notes

Brand Behemoths – March 31, 2006
85
Notes

Brand Behemoths – March 31, 2006
86
ANALYST CERTIFICATION Appendix A-1
We, Edward Kerschner and Michael Geraghty, research analysts and the authors of this report, hereby certify that all of the views expressed in this research report accurately reflect our personal views about any and all of the subject issuer(s) or securities. We also certify that no part of our compensation was, is, or will be directly or indirectly related to the specific recommendation(s) or view(s) in this report.
IMPORTANT DISCLOSURES Analysts' compensation is determined based upon activities and services intended to benefit the investor clients of Citigroup Global Markets Inc. and its affiliates ("the Firm"). Like all Firm employees, analysts receive compensation that is impacted by overall firm profitability, which includes revenues from, among other business units, the Private Client Division, Institutional Equities, and Investment Banking.
Citigroup Investment Research Ratings Distribution Data current as of 31 December 2005 Buy Hold SellCitigroup Investment Research Global Fundamental Coverage (2784) 42% 41% 17%
% of companies in each rating category that are investment banking clients 47% 48% 37%Guide to Fundamental Research Investment Ratings: Citigroup Investment Research's stock recommendations include a risk rating and an investment rating. Risk ratings, which take into account both price volatility and fundamental criteria, are: Low (L), Medium (M), High (H), and Speculative (S). Investment ratings are a function of Citigroup Investment Research's expectation of total return (forecast price appreciation and dividend yield within the next 12 months) and risk rating. For securities in developed markets (US, UK, Europe, Japan, and Australia/New Zealand), investment ratings are: Buy (1) (expected total return of 10% or more for Low-Risk stocks, 15% or more for Medium-Risk stocks, 20% or more for High-Risk stocks, and 35% or more for Speculative stocks); Hold (2) (0%-10% for Low-Risk stocks, 0%-15% for Medium-Risk stocks, 0%-20% for High-Risk stocks, and 0%-35% for Speculative stocks); and Sell (3) (negative total return). For securities in emerging markets (Asia Pacific, Emerging Europe/Middle East/Africa, and Latin America), investment ratings are: Buy (1) (expected total return of 15% or more for Low-Risk stocks, 20% or more for Medium-Risk stocks, 30% or more for High-Risk stocks, and 40% or more for Speculative stocks); Hold (2) (5%-15% for Low-Risk stocks, 10%-20% for Medium-Risk stocks, 15%-30% for High-Risk stocks, and 20%-40% for Speculative stocks); and Sell (3) (5% or less for Low-Risk stocks, 10% or less for Medium-Risk stocks, 15% or less for High-Risk stocks, and 20% or less for Speculative stocks). Investment ratings are determined by the ranges described above at the time of initiation of coverage, a change in investment and/or risk rating, or a change in target price (subject to limited management discretion). At other times, the expected total returns may fall outside of these ranges because of market price movements and/or other short-term volatility or trading patterns. Such interim deviations from specified ranges will be permitted but will become subject to review by Research Management. Your decision to buy or sell a security should be based upon your personal investment objectives and should be made only after evaluating the stock's expected performance and risk.
Between September 9, 2002, and September 12, 2003, Citigroup Investment Research's stock ratings were based upon expected performance over the following 12 to 18 months relative to the analyst's industry coverage universe at such time. An Outperform (1) rating indicated that we expected the stock to outperform the analyst's industry coverage universe over the coming 12-18 months. An In-line (2) rating indicated that we expected the stock to perform approximately in line with the analyst's coverage universe. An Underperform (3) rating indicated that we expected the stock to underperform the analyst's coverage universe. In emerging markets, the same ratings classifications were used, but the stocks were rated based upon expected performance relative to the primary market index in the region or country. Our complementary Risk rating system -- Low (L), Medium (M), High (H), and Speculative (S) -- took into account predictability of financial results and stock price volatility. Risk ratings for Asia Pacific were determined by a quantitative screen which classified stocks into the same four risk categories. In the major markets, our Industry rating system -- Overweight, Marketweight, and Underweight -- took into account each analyst's evaluation of their industry coverage as compared to the primary market index in their region over the following 12 to 18 months.
OTHER DISCLOSURES For securities recommended in the Product in which the Firm is not a market maker, the Firm is a liquidity provider in the issuers' financial instruments and may act as principal in connection with such transactions. The Firm is a regular issuer of traded financial instruments linked to securities that may have been recommended in the Product. The Firm regularly trades in the securities of the subject company(ies) discussed in the Product. The Firm may engage in securities transactions in a manner inconsistent with the Product and, with respect to securities covered by the Product, will buy or sell from customers on a principal basis.
Securities recommended, offered, or sold by the Firm: (i) are not insured by the Federal Deposit Insurance Corporation; (ii) are not deposits or other obligations of any insured depository institution (including Citibank); and (iii) are subject to investment risks, including the possible loss of the principal amount invested. Although information has been obtained from and is based upon sources that the Firm believes to be reliable, we do not guarantee its accuracy and it may be incomplete and condensed. Note, however, that the Firm has taken all reasonable steps to determine the accuracy and completeness of the disclosures made in the Important Disclosures section of the Product. In producing Products, members of the Firm's research department may have received assistance from the subject company(ies) referred to in the Product. Any such assistance may have included access to sites owned, leased or otherwise operated or controlled by the issuers and meetings with management, employees or other parties associated with the subject company(ies). Firm policy prohibits research analysts from sending draft research to subject companies. However, it should be presumed that the author of the Product has had discussions with the subject company to ensure factual accuracy prior to publication. All opinions, projections and estimates constitute the judgment of the author as of the date of the Product and are subject to change without notice. Prices and availability of financial instruments also are subject to change without notice. Although Citigroup Investment Research does not set a predetermined frequency for publication, if the Product is a fundamental research report, it is the intention of Citigroup Investment

Brand Behemoths – March 31, 2006
87
Research to provide research coverage of the/those issuer(s) mentioned therein, including in response to news affecting this issuer, subject to applicable quiet periods and capacity constraints. The Product is for informational purposes only and is not intended as an offer or solicitation for the purchase or sale of a security. Any decision to purchase securities mentioned in the Product must take into account existing public information on such security or any registered prospectus.
Investing in non-U.S. securities, including ADRs, may entail certain risks. The securities of non-U.S. issuers may not be registered with, nor be subject to the reporting requirements of the U.S. Securities and Exchange Commission. There may be limited information available on foreign securities. Foreign companies are generally not subject to uniform audit and reporting standards, practices and requirements comparable to those in the U.S. Securities of some foreign companies may be less liquid and their prices more volatile than securities of comparable U.S. companies. In addition, exchange rate movements may have an adverse effect on the value of an investment in a foreign stock and its corresponding dividend payment for U.S. investors. Net dividends to ADR investors are estimated, using withholding tax rates conventions, deemed accurate, but investors are urged to consult their tax advisor for exact dividend computations. Investors who have received the Product from the Firm may be prohibited in certain states or other jurisdictions from purchasing securities mentioned in the Product from the Firm. Please ask your Financial Consultant for additional details. Citigroup Global Markets Inc. takes responsibility for the Product in the United States. Any orders by non-US investors resulting from the information contained in the Product may be placed only through Citigroup Global Markets Inc.
The Citigroup legal entity that takes responsibility for the production of the Product is the legal entity which the first named author is employed by. The Product is made available in Australia to wholesale clients through Citigroup Global Markets Australia Pty Ltd. (ABN 64 003 114 832 and AFSL No. 240992) and to retail clients through Citigroup Wealth Advisors Pty Ltd. (ABN 19 009 145 555 and AFSL No. 240813), Participants of the ASX Group and regulated by the Australian Securities & Investments Commission. Citigroup Centre, 2 Park Street, Sydney, NSW 2000. If the Product is being made available in certain provinces of Canada by Citigroup Global Markets (Canada) Inc. (“CGM Canada”), CGM Canada has approved the Product. Citigroup Place, 123 Front Street West, Suite 1100, Toronto, Ontario M5J 2M3. The Product may not be distributed to private clients in Germany. The Product is distributed in Germany by Citigroup Global Markets Deutschland AG & Co. KGaA, which is regulated by Bundesanstalt fuer Finanzdienstleistungsaufsicht (BaFin). Frankfurt am Main, Reuterweg 16, 60323 Frankfurt am Main. If the Product is made available in Hong Kong by, or on behalf of, Citigroup Global Markets Asia Ltd., it is attributable to Citigroup Global Markets Asia Ltd., Citibank Tower, Citibank Plaza, 3 Garden Road, Hong Kong. Citigroup Global Markets Asia Ltd. is regulated by Hong Kong Securities and Futures Commission. If the Product is made available in Hong Kong by The Citigroup Private Bank to its clients, it is attributable to Citibank N.A., Citibank Tower, Citibank Plaza, 3 Garden Road, Hong Kong. The Citigroup Private Bank and Citibank N.A. is regulated by the Hong Kong Monetary Authority. The Product is made available in India by Citigroup Global Markets India Private Limited, which is regulated by Securities and Exchange Board of India. Bakhtawar, Nariman Point, Mumbai 400-021. If the Product was prepared by Citigroup Investment Research and distributed in Japan by Nikko Citigroup Ltd., it is being so distributed under license. Nikko Citigroup Limited is regulated by Financial Services Agency, Securities and Exchange Surveillance Commission, Japan Securities Dealers Association, Tokyo Stock Exchange and Osaka Securities Exchange. Akasaka Park Building, 2-20, Akasaka 5-chome, Minato-ku, Tokyo 107-6122. The Product is made available in Korea by Citigroup Global Markets Korea Securities Ltd., which is regulated by Financial Supervisory Commission and the Financial Supervisory Service. Hungkuk Life Insurance Building, 226 Shinmunno 1-GA, Jongno-Gu, Seoul, 110-061. The Product is made available in Malaysia by Citigroup Global Markets Malaysia Sdn Bhd, which is regulated by Malaysia Securities Commission. Menara Citibank, 165 Jalan Ampang, Kuala Lumpur, 50450. The Product is made available in Mexico by Acciones y Valores Banamex, S.A. De C. V., Casa de Bolsa, which is regulated by Comision Nacional Bancaria y de Valores. Reforma 398, Col. Juarez, 06600 Mexico, D.F. In New Zealand the Product is made available through Citigroup Global Markets New Zealand Ltd., a Participant of the New Zealand Exchange Limited and regulated by the New Zealand Securities Commission. Level 19, Mobile on the Park, 157 lambton Quay, Wellington. The Product is made available in Poland by Dom Maklerski Banku Handlowego SA an indirect subsidiary of Citigroup Inc., which is regulated by Komisja Papierów Wartosciowych i Gield. Bank Handlowy w Warszawie S.A. ul. Senatorska 16, 00-923 Warszawa. The Product is made available in the Russian Federation through ZAO Citibank, which is licensed to carry out banking activities in the Russian Federation in accordance with the general banking license issued by the Central Bank of the Russian Federation and brokerage activities in accordance with the license issued by the Federal Service for Financial Markets. Neither the Product nor any information contained in the Product shall be considered as advertising the securities mentioned in this report within the territory of the Russian Federation or outside the Russian Federation. The Product does not constitute an appraisal within the meaning of the Federal Law of the Russian Federation of 29 July 1998 No. 135-FZ (as amended) On Appraisal Activities in the Russian Federation. 8-10 Gasheka Street, 125047 Moscow. The Product is made available in Singapore through Citigroup Global Markets Singapore Pte. Ltd., a Capital Markets Services Licence holder, and regulated by Monetary Authority of Singapore. 1 Temasek Avenue, #39-02 Millenia Tower, Singapore 039192. Citigroup Global Markets (Pty) Ltd. is incorporated in the Republic of South Africa (company registration number 2000/025866/07) and its registered office is at 145 West Street, Sandton, 2196, Saxonwold. Citigroup Global Markets (Pty) Ltd. is regulated by JSE Securities Exchange South Africa, South African Reserve Bank and the Financial Services Board. The investments and services contained herein are not available to private customers in South Africa. The Product is made available in Taiwan through Citigroup Global Markets Inc. (Taipei Branch), which is regulated by Securities & Futures Bureau. No portion of the report may be reproduced or quoted in Taiwan by the press or any other person. No. 8 Manhattan Building, Hsin Yi Road, Section 5, Taipei 100, Taiwan. The Product is made available in Thailand through Citicorp Securities (Thailand) Ltd., which is regulated by the Securities and Exchange Commission of Thailand. 18/F, 22/F and 29/F, 82 North Sathorn Road, Silom, Bangrak, Bangkok 10500, Thailand. The Product is made available in United Kingdom by Citigroup Global Markets Limited, which is regulated by Financial Services Authority. This material may relate to investments or services of a person outside of the UK or to other matters which are not regulated by the FSA and further details as to where this may be the case are available upon request in respect of this material. Citigroup Centre, Canada Square, Canary Wharf, London, E14 5LB. The Product is made available in United States by Citigroup Global Markets Inc, which is regulated by NASD, NYSE and the US Securities and Exchange Commission. 388 Greenwich Street, New York, NY 10013. Unless specified to the contrary, within EU Member States, the Product is made available by Citigroup Global Markets Limited, which is regulated by Financial Services Authority. Many European regulators require that a firm must establish, implement and make available a policy for managing conflicts of interest arising as a result of publication or distribution of investment research. The policy applicable to Citigroup Investment Research's Products can be found at www.citigroupgeo.com. Compensation of equity research analysts is determined by equity research management and Citigroup's senior management and is not linked to specific transactions or recommendations. The Product may have been distributed simultaneously, in multiple formats, to the Firm's worldwide institutional and retail customers. The Product is not to be construed as providing investment services in any jurisdiction where the provision of such

Brand Behemoths – March 31, 2006
88
services would be illegal. Subject to the nature and contents of the Product, the investments described therein are subject to fluctuations in price and/or value and investors may get back less than originally invested. Certain high-volatility investments can be subject to sudden and large falls in value that could equal or exceed the amount invested. Certain investments contained in the Product may have tax implications for private customers whereby levels and basis of taxation may be subject to change. If in doubt, investors should seek advice from a tax adviser. Advice in the Product has been prepared without taking account of the objectives, financial situation or needs of any particular investor. Accordingly, investors should, before acting on the advice, consider the appropriateness of the advice, having regard to their objectives, financial situation and needs.
© 2006 Citigroup Global Markets Inc. Citigroup Investment Research is a division and service mark of Citigroup Global Markets Inc. and its affiliates and is used and registered throughout the world. Citigroup and the Umbrella Device are trademarks and service marks of Citigroup or its affiliates and are used and registered throughout the world. Nikko is a registered trademark of Nikko Cordial Corporation. All rights reserved. Any unauthorized use, duplication, redistribution or disclosure is prohibited by law and will result in prosecution. The Firm accepts no liability whatsoever for the actions of third parties. The Product may provide the addresses of, or contain hyperlinks to, websites. Except to the extent to which the Product refers to website material of the Firm, the Firm has not reviewed the linked site. Equally, except to the extent to which the Product refers to website material of the Firm, the Firm takes no responsibility for, and makes no representations or warranties whatsoever as to, the data and information contained therein. Such address or hyperlink (including addresses or hyperlinks to website material of the Firm) is provided solely for your convenience and information and the content of the linked site does not in anyway form part of this document. Accessing such website or following such link through the Product or the website of the Firm shall be at your own risk and the Firm shall have no liability arising out of, or in connection with, any such referenced website.
ADDITIONAL INFORMATION IS AVAILABLE UPON REQUEST US03R078