Branched chain amino acids are novel biomarkers for discrimination of metabolic wellness
9
Branched chain amino acids are novel biomarkers for discrimination of metabolic wellness Bryan C. Batch a, b, ⁎ , Svati H. Shah b, c , d , Christopher B. Newgard b , Christy B. Turer e , Carol Haynes f , James R. Bain a, b , Michael Muehlbauer b , Mahesh J. Patel c , Robert D. Stevens a, b , Lawrence J. Appel g , L. Kristin Newby c , f , Laura P. Svetkey b, h a Division of Endocrinology, Metabolism, and Nutrition, Duke University Medical Center, Durham, NC 27710, USA b Sarah W. Stedman Nutrition and Metabolism Center, Duke University, Durham, NC 27710, USA c Division of Cardiology, Department of Medicine, Duke University Medical Center, Durham, NC 27710, USA d Duke Center for Human Genetics, Duke University Medical Center, Durham, NC 27710, USA e Department of Pediatrics, UTSW Medical Center, Dallas, TX 75390–9063, USA f Duke Clinical Research Institute, Durham, NC 27710, USA g Welch Center for Prevention, Epidemiology and Clinical Research, Johns Hopkins Medical Institutions, Baltimore, MD, USA h Division of Nephrology, Department of Medicine, Duke University Medical Center, Durham, NC 27710, USA ARTICLE INFO ABSTRACT Article history: Received 21 June 2012 Accepted 7 January 2013 Objective. To identify novel biomarkers through metabolomic profiles that distinguish metabolically well (MW) from metabolically unwell (MUW) individuals, independent of body mass index (BMI). Materials/Methods. This study was conducted as part of the Measurement to Understand the Reclassification of Disease of Cabarrus/Kannapolis (MURDOCK) project. Individuals from 3 cohorts were classified as lean (BMI < 25 kg/m 2 ), overweight (BMI ≥ 25 kg/m 2 , BMI<30 kg/ m 2 ) or obese (BMI ≥ 30 kg/m 2 ). Cardiometabolic abnormalities were defined as: (1) impaired fasting glucose (≥ 100 mg/dL and ≤ 126 mg/dL); (2) hypertension; (3) triglycerides ≥ 150 mg/dL; (4) HDL-C <40 mg/dL in men, <50 mg/dL in women; and (5) insulin resistance (calculated Homeostatic Model Assessment (HOMA-IR) index of > 5.13). MW individuals were defined as having < 2 cardiometabolic abnormalities and MUW individuals had ≥ two cardiometabolic abnormalities. Targeted profiling of 55 metabolites used mass-spectroscopy-based methods. Principal components analysis (PCA) was used to reduce the large number of correlated metabolites into clusters of fewer uncorrelated factors. Keywords: Obesity Metabolomics Insulin resistance Metabolic risk METABOLISM CLINICAL AND EXPERIMENTAL XX (2013) XXX – XXX Abbreviations: MW, Metabolically Well; MUW, Metabolically UnWell; BMI, Body Mass Index; MURDOCK, Measurement to Understand the Reclassification of Disease of Cabarrus/Kannapolis; HDL-C, High Density Lipoprotein Cholesterol; HOMA-IR, Homeostatic Model Assessment; PCA, Principal Components Analysis; CDC, Centers for Disease Control and Prevention; NHANES, National Health and Nutrition Examination Survey; LDL, Low Density Lipoprotein; hs-CRP, High Sensitivity C-Reactive Protein; CMRF, Cardiometabolic Risk Factor; CVD, CardioVascular Disease; WLM, Weight Loss Maintenance; STEDMAN, Study of the Effect of Diet on Metabolism and Nutrition; MS, Mass Spectrometry; LEU/ILE, Leucine/Isoleucine; NEFA, Non Esterified Fatty Acids; AA, African American; GLX, Glutamate/glutamine; NEFA, Non-Esterified Fatty Acids; ORN, Ornithine; ARG, Arginine; HIS, Histidine; AC, Acylcarnitines; GLY, Glycine; SER, Serine; PRO, Proline; CIT, Citruline; C22, C22 acylcarnitine; ASX, Aspartate/asparagine; HTN, Hypertension; DM, Diabetes Mellitus; HBUT, β- Hydroxybutyrate; KET, Ketone; ALA, Alanine; PHE, Phenylalanine; VAL, Valine; TYR, Tyrosine; MET, Methionine; CATHGEN, CATHeterization GENetics. ⁎ Corresponding author. Duke University Medical Center, DUMC Box # 3031, Durham, NC 27710, USA. Tel.: +1 919 668 1219; fax: +1 919 681 9846. E-mail address: [email protected] (B.C. Batch). 0026-0495/$ – see front matter © 2013 Elsevier Inc. All rights reserved. http://dx.doi.org/10.1016/j.metabol.2013.01.007 Available online at www.sciencedirect.com Metabolism www.metabolismjournal.com Please cite this article as: Batch BC, et al, Branched chain amino acids are novel biomarkers for discrimination of metabolic wellness, Metabolism (2013), http://dx.doi.org/10.1016/j.metabol.2013.01.007
Transcript of Branched chain amino acids are novel biomarkers for discrimination of metabolic wellness

M E T A B O L I S M C L I N I C A L A N D E X P E R I M E N T A L X X ( 2 0 1 3 ) X X X – X X X
Ava i l ab l e on l i ne a t www.sc i enced i r ec t . com
Metabolismwww.metabo l i sm jou rna l . com
Branched chain amino acids are novel biomarkers fordiscrimination of metabolic wellness
Bryan C. Batcha, b,⁎, Svati H. Shahb, c, d, Christopher B. Newgardb, Christy B. Turer e,Carol Haynes f, James R. Baina, b, Michael Muehlbauer b, Mahesh J. Patel c,Robert D. Stevensa, b, Lawrence J. Appel g, L. Kristin Newbyc, f, Laura P. Svetkeyb, h
a Division of Endocrinology, Metabolism, and Nutrition, Duke University Medical Center, Durham, NC 27710, USAb Sarah W. Stedman Nutrition and Metabolism Center, Duke University, Durham, NC 27710, USAc Division of Cardiology, Department of Medicine, Duke University Medical Center, Durham, NC 27710, USAd Duke Center for Human Genetics, Duke University Medical Center, Durham, NC 27710, USAe Department of Pediatrics, UTSW Medical Center, Dallas, TX 75390–9063, USAf Duke Clinical Research Institute, Durham, NC 27710, USAg Welch Center for Prevention, Epidemiology and Clinical Research, Johns Hopkins Medical Institutions, Baltimore, MD, USAh Division of Nephrology, Department of Medicine, Duke University Medical Center, Durham, NC 27710, USA
A R T I C L E I N F O
Abbreviations: MW, Metabolically Well; MUthe Reclassification of Disease of Cabarrus/Assessment; PCA, Principal Components AnNutrition Examination Survey; LDL, Low DenFactor; CVD, CardioVascular Disease;WLM,WMS, Mass Spectrometry; LEU/ILE, Leucine/IsoNEFA, Non-Esterified Fatty Acids; ORN, OrnProline; CIT, Citruline; C22, C22 acylcarniHydroxybutyrate; KET, Ketone; ALA, AlanCATHeterization GENetics.⁎ Corresponding author. Duke University Med
9846.E-mail address: [email protected] (B
0026-0495/$ – see front matter © 2013 Elsevihttp://dx.doi.org/10.1016/j.metabol.2013.01.00
Please cite this article as: Batch BC, et awellness, Metabolism (2013), http://dx.d
A B S T R A C T
Article history:Received 21 June 2012Accepted 7 January 2013
Keywords:Obesity
Objective. To identify novel biomarkers through metabolomic profiles that distinguishmetabolically well (MW) frommetabolically unwell (MUW) individuals, independent of bodymass index (BMI).
Materials/Methods. This study was conducted as part of the Measurement to Understandthe Reclassification of Disease of Cabarrus/Kannapolis (MURDOCK) project. Individuals from3 cohorts were classified as lean (BMI<25 kg/m2), overweight (BMI≥25 kg/m2, BMI<30 kg/m2) or obese (BMI≥30 kg/m2). Cardiometabolic abnormalities were defined as: (1) impairedfasting glucose (≥100 mg/dL and ≤126 mg/dL); (2) hypertension; (3) triglycerides ≥150 mg/dL;(4) HDL-C <40 mg/dL in men, <50 mg/dL in women; and (5) insulin resistance (calculatedHomeostatic Model Assessment (HOMA-IR) index of >5.13). MW individuals were defined ashaving <2 cardiometabolic abnormalities and MUW individuals had≥ two cardiometabolicabnormalities. Targeted profiling of 55 metabolites used mass-spectroscopy-basedmethods. Principal components analysis (PCA) was used to reduce the large number ofcorrelated metabolites into clusters of fewer uncorrelated factors.
MetabolomicsInsulin resistanceMetabolic risk
W, Metabolically UnWell; BMI, Body Mass Index; MURDOCK, Measurement to UnderstandKannapolis; HDL-C, High Density Lipoprotein Cholesterol; HOMA-IR, Homeostatic Modelalysis; CDC, Centers for Disease Control and Prevention; NHANES, National Health andsity Lipoprotein; hs-CRP, High Sensitivity C-Reactive Protein; CMRF, Cardiometabolic Riskeight Loss Maintenance; STEDMAN, Study of the Effect of Diet onMetabolism and Nutrition;
leucine; NEFA, Non Esterified Fatty Acids; AA, African American; GLX, Glutamate/glutamine;ithine; ARG, Arginine; HIS, Histidine; AC, Acylcarnitines; GLY, Glycine; SER, Serine; PRO,tine; ASX, Aspartate/asparagine; HTN, Hypertension; DM, Diabetes Mellitus; HBUT, β-ine; PHE, Phenylalanine; VAL, Valine; TYR, Tyrosine; MET, Methionine; CATHGEN,
ical Center, DUMC Box # 3031, Durham, NC 27710, USA. Tel.: +1 919 668 1219; fax: +1 919 681
.C. Batch).
er Inc. All rights reserved.7
l, Branched chain amino acids are novel biomarkers for discrimination of metabolicoi.org/10.1016/j.metabol.2013.01.007

2 M E T A B O L I S M C L I N I C A L A N D E X P E R I M E N T A L X X ( 2 0 1 3 ) X X X – X X X
Please cite this article as: Batch BC, et alwellness, Metabolism (2013), http://dx.do
Results. Of 1872 individuals, 410 were lean, 610 were overweight, and 852 were obese. Oflean individuals, 67% were categorized as MUW, whereas 80% of overweight and 87% ofobese individuals were MUW. PCA-derived factors with levels that differed the mostbetween MW and MUW groups were factors 4 (branched chain amino acids [BCAA])[p<.0001], 8 (variousmetabolites) [p<.0001], 9 (C4/Ci4, C3, C5 acylcarnitines) [p<.0001] and 10(amino acids) [p<.0002]. Further, Factor 4, distinguishes MW from MUW individualsindependent of BMI.
Conclusion. BCAA and related metabolites are promising biomarkers that may aid inunderstanding cardiometabolic health independent of BMI category.
© 2013 Elsevier Inc. All rights reserved.
1. Introduction
Individuals who are overweight/obese are at increased risk fordeveloping a wide range of diseases, including cardiovasculardisease, cerebrovascular disease, and type 2 diabetes mellitus[1]. However, not all overweight/obese individuals will developthese diseases or risk factors for disease. A prior study byWildman et al. [2] examined metabolic “wellness” in a crosssectional sample of the National Health and NutritionExamination Survey (NHANES) 1999–2004 cohort. The cardio-metabolic risk factors (CMRF) of interest in this study includedelevated blood pressure, fasting glucose, reduced high densitylipoprotein cholesterol (HDL-C), elevated low density lipopro-tein cholesterol (LDL-C), elevated triglycerides, high sensitivityC-reactive protein (hs-CRP) and elevated homeostasis modelassessment of insulin resistance (HOMA-IR) value. Individualswith one or fewer CMRF were considered metabolically well(MW) and those with two or more were considered metabol-ically unwell (MUW). In this population-based sample, 23.5%oflean individuals were metabolically unwell (body mass index[BMI] <25 kg/m2), and 31.7% of obese individuals weremetabolically well despite being obese (BMI≥30 kg/m2).
Novel molecular techniques may help to identify bio-markers that improve discrimination of risk beyond the riskpredicted by BMI alone and elucidate the mechanismsunderlying this seeming disparity between BMI and presenceof metabolic risk factors.
Our group has used high throughput targeted metabolicprofiling to identify a biosignature composed of branched chainamino acids (BCAA) and related catabolites that is stronglyassociatedwith insulin resistance [3,4], discriminates lean fromobese individuals [3], is independently associatedwithcoronaryartery disease [5], and predicts who will have improvement ininsulin resistance withmoderateweight loss [6]. This signaturealso has been shown by another group to predict incidentdiabetes [7]. Therefore, we hypothesized that similar methodswould identify novel biomarkers that distinguish individualswho are metabolically well (MW) from individuals who aremetabolically unwell (MUW), independent of BMI.
2. Methods
The current analysis was conducted as part of the Measure-ment to Understand the Reclassification of Disease ofCabarrus/Kannapolis (MURDOCK) project, designed to identifynovel biomarkers in a range of clinical conditions [8].
, Branched chain aminoi.org/10.1016/j.metabol
2.1. Study population
Individuals included in this analysis were pooled from theWeight Loss Maintenance (WLM) Clinical Trial [9,10], theCATHGEN cardiovascular biorepository [8], and the Study ofthe Effect of Diet on Metabolism and Nutrition (STEDMAN)project [11], using baseline clinical, demographic, and labora-tory data. Stored baseline blood samples were analyzed aspart of the MURDOCK project. Descriptions of each source ofparticipants and biological samples are as follows:
2.1.1. Weight Loss Maintenance clinical trialThe WLM trial was a multi-center, randomized, controlledtrial (clinicaltrials.gov Identifier: NCT00054925) to determinethe effects of two behavioral strategies for maintaining weightloss compared with a usual care control group. The WLM trialmethods and main results have been described in detailelsewhere [9,10]. Briefly, the study enrolled overweight andobese individuals (BMI 25–45 kg/m2) aged 25 years or olderwho were taking medications for hypertension and/or dysli-pidemia. Exclusion criteria were treatment for diabetesmellitus, recent cardiovascular event, weight loss of greaterthan nine kilograms in the preceding threemonths, recent useof weight loss medications, or prior weight loss surgery. Atentry into the study, venous blood samples were obtainedafter an overnight fast. Within 1–2 h of phlebotomy, serumand plasma were frozen at −80 °C.
A total of 1035 participants from four United States centerswere randomized in WLM. Of these, targeted metabolicprofiling was performed on a random sample of 500 in-dividuals [6]. Of these 500 individuals, those enrolled in bothWLM and the STEDMAN project (see below) were excluded,leaving 462 unique individuals from WLM available for thecurrent analysis.
2.1.2. The CATHGEN StudyThe CATHGEN biorepository consists of over 9000 sequential-ly-recruited individuals undergoing cardiac catheterization atDuke University Medical Center (Durham, NC) [8]. Theindication for catheterization for all subjects was clinicalconcern for ischemic heart disease. Patients with severepulmonary hypertension or organ transplant were excluded.All subjects were fasting for a minimum of six hours prior tosample collection. After informed consent, blood wasobtained from the femoral artery at the time of arterial accessfor cardiac catheterization, immediately processed to sepa-rate plasma, and frozen at −80 °C until later use. Targeted
acids are novel biomarkers for discrimination of metabolic.2013.01.007

3M E T A B O L I S M C L I N I C A L A N D E X P E R I M E N T A L X X ( 2 0 1 3 ) X X X – X X X
metabolic profiling and measurement of insulin and fastingglucose were previously performed on samples from 2023CATHGEN individuals as part of the MURDOCK Horizon 1Cardiovascular Disease project [8]; this population was alsoused for the current analysis. Individuals missing data for keyvariables necessary for definition of metabolic wellness andthosewith a clinical diagnosis of type II diabetesmellituswereexcluded. Patients with Type II diabetes mellitus wereexcluded in order to be consistent with the other two cohorts.Further, we considered it appropriate to exclude those withtype II diabetes because these individuals have high cardio-vascular risk regardless of other known or novel markers ofmetabolic wellness. A total of 1273 CATHGEN individuals wereincluded in the current analysis.
2.1.3. The STEDMAN ProjectThe STEDMAN project was designed to perform comprehen-sive metabolic profiling on lean and overweight/obese in-dividuals and to determine the effect onmetabolic profiling ofweight loss achieved by various means [11]. Profiling wasperformed on blood samples obtained after an overnight fast.A total of 137 individualswere included in the current analysis.
2.2. Current analysis
The protocols for the WLM trial, the STEDMAN Project andCATHGEN were approved by the Duke Institutional ReviewBoard (IRB), and all participants provided written informedconsent for future analyses of stored samples. The specificanalyses conducted for theMURDOCKprojectwereapprovedbythe Duke Institutional Review Board under separate IRB review.
2.3. Definition of metabolically well and unwell
Individuals were classified into three categories based onbaseline BMI: lean (BMI <25 kg/m2), overweight (BMI ≥25 kg/m2, <30 kg/m2) and obese (BMI ≥30 kg/m2). Cardiometabolicabnormalities were defined as: (1) impaired fasting glucose(≥100 mg/dL and ≤126 mg/dL); (2) hypertension (defined as aself-reported diagnosis of hypertension or taking a bloodpressure medication). Additionally, in a subset of studyparticipants (derived from the CATHGEN study; see below) inwhom blood pressure measurements were also available, anindividual without a clinical diagnosis of hypertension andtaking no blood pressure medication was considered hyper-tensive if the resting systolic blood pressure was ≥130 ordiastolic blood pressure was ≥85 mmHg; (3) triglycerides≥150 mg/dL; (4) HDL-C <40 mg/dL in men or <50 mg/dL inwomen; and (5) insulin resistance (calculated HomeostaticModel Assessment [HOMA-IR] index of >5.13). The HOMAIndex was calculated using the formula: HOMA-IR=(fastinginsulin in μUI/mL * fasting glucose inmM) / 22.5 [12]. Althougha HOMA-IR of >2.60 is generally accepted as the clinicaldefinition of insulin resistance [13] we chose a higherthreshold because of apparent ethnic/racial differences inthe clinically significant threshold [14], and to be consistentwith previous reports of the relationship between metabolicwellness and BMI [2]. Metabolically well (MW) individualswere defined as having zero or one of these cardiometabolicabnormalities, and metabolically unwell (MUW) individuals
Please cite this article as: Batch BC, et al, Branched chain aminowellness, Metabolism (2013), http://dx.doi.org/10.1016/j.metabol
were defined as having two or more cardiometabolicabnormalities.
Although other studies have considered hsCRP in thedefinition of metabolic abnormalities [2], hsCRP was notincluded in the definition of metabolically well or unwell inthis study because the value was not measured for themajority of individuals.
2.4. Laboratory measurements
Targeted metabolic and other laboratory analyses wereperformed on baseline frozen plasma samples. Quantitativedetermination of metabolite levels was made for 37 acylcar-nitines, 15 amino acids, ketones (KET), beta-hydroxybutyrate(HBUT), total free fatty acids (NEFA), glucose and insulin.Sample preparationmethodology and coefficients of variationfor each assay have been reported [3,5]. The SarahW. StedmanNutrition and Metabolism metabolomics/biomarker core lab-oratory was blinded to weight loss status, BMI and otherclinical variables, and study participants' samples wererandomly distributed during analysis.
Standard clinical chemistrymethods were used for glucoseand insulin with reagents from Roche Diagnostics (Indianap-olis, IN), and for free fatty acids (total) and ketones (total and 3-hydroxybutyrate) with reagents from Wako. All assays wereperformed on a Hitachi 911 clinical chemistry analyzer.
For mass spectrometry (MS)-profiled metabolites (acylcar-nitines and amino acids), the following protocol was used, aspreviously described [15,16]. Proteins were first removed byprecipitation with methanol. Aliquoted supernatants weredried, and then esterified with hot, acidic methanol (acylcar-nitines) or n-butanol (amino acids). Tandem mass spectros-copy (MS) analysis was done with a Quattro Micro instrument(Waters, Milford, MA) and employed stable-isotope-dilution.Quantification of the “targeted” intermediary metabolites wasfacilitated by addition of mixtures of known quantities ofstable-isotope internal standards to samples. Leucine andisoleucine (LEU/ILE) are reported as a single analyte becausethey are not resolved by our MS/MS method, and includecontributions from allo-isoleucine and hydroxyproline. Theseisobaric amino acids normally contribute little to the signalattributed to LEU/ILE [16]. The acidic conditions used to formbutyl esters results in partial hydrolysis of glutamine toglutamic acid and of asparagine to aspartate. Values reportedas GLX or ASX are not meant to signify the molar sum ofglutamate and glutamine, or of aspartate and asparagines.They signify the amount of glutamate or aspartate plus thecontribution of the partial hydrolysis reactions of glutamineand asparagine, respectively.
2.5. Statistical analysis
Given that many metabolites reside in overlapping pathways,correlation of metabolites is expected. We used principalcomponents analysis (PCA) to reduce the large number ofcorrelated variables into clusters of fewer uncorrelatedfactors, as done in previous metabolic studies [3,5]. Metabo-lites that had >25% of values as “0” (i.e., below the lower limitsof quantification for that assay) were not analyzed further,leading to exclusion of two acylcarnitine species. PCA was
acids are novel biomarkers for discrimination of metabolic.2013.01.007

4 M E T A B O L I S M C L I N I C A L A N D E X P E R I M E N T A L X X ( 2 0 1 3 ) X X X – X X X
performed on baseline levels of acylcarnitines, amino acids,NEFA, ketones and HBUT. Factors with an eigenvalue ≥1.0were identified and varimax rotation was performed toproduce interpretable factors. Metabolites with a factor load≥0.4 were reported as composing a given factor. Scoringcoefficients were constructed and used to calculate baselinemetabolomic factor scores for each individual (weightedsum of the values of the standardized metabolites withinthat factor, weighted on the factor loading for eachindividual metabolite).
In our primary analysis, we used unadjusted Wilcoxonrank sum to assess the significance of the difference in meanmetabolite factor levels between metabolically unwell andmetabolically well individuals, stratified by three BMI cate-gories, and for the overall group (BMI categories combined).To ensure that the significance of the difference in meanmetabolic factor levels between the metabolically unwell andwell individuals was not confounded by differences in BMI,we also constructed linear regression models adjusted forBMI. Finally, to further assess whether factor levels werepredictive of metabolic wellness independent of BMI, weused logistic regression models in the overall group adjustedfor BMI.
As all analyses were exploratory in nature and given co-linearity of the metabolites, two-sided p-values unadjustedfor multiple comparisons are presented; however, resultsinterpreted in the context of a conservative Bonferronicorrection are also reported. Nominal statistical significancewas defined as p≤0.05. Statistical analyses were performedusing SAS version 9.1 (SAS Institute, Cary NC).
3. Results
3.1. Metabolic characteristics of study population
A total of 1872 individuals were included in this analysis.When stratified by BMI, 410 individuals were lean, 610 wereoverweight, and 852 were obese. Table 1 presents baseline
Table 1 – Baseline characteristics of the study population.
Overall Lean (N=410)
Agea 59.49±11.80 61.52±13.73Female (%) 45 45Weight (lb) 193.03±49.93 145.12±22.64BMI (kg/m2) 30.05±6.44 22.28±2.33African American (%) 24 18HTN (%) 85 74Fasting glucose (mg/dL) 94.90 ±13.52 93.29±14.76HOMA-IR 2.24±1.87 1.67±1.51Triglycerides (mg/dL) 118.56±74.11 91.94±50.71HDL-C level (mg/dL) 38.35±14.63 42.44±17.92Metabolically unwell (%) 67
BMI (Body Mass Index).HTN (Hypertension).HOMA-IR (Homeostatic Model Assessment-Insulin Resistance).HDL-C (High Density Lipoprotein).a All continuous variables are reported as mean±SD, all discrete variableb p-value of comparison of distribution of variable between lean/overwe
Please cite this article as: Batch BC, et al, Branched chain aminowellness, Metabolism (2013), http://dx.doi.org/10.1016/j.metabol
clinical characteristics of the cohort. Obese individuals wereyounger (57.0±10.8 years) compared with overweight or leanindividuals (61.7±11.0 years and 61.5±13.7 years, respective-ly). Approximately 50% of obese and lean individuals werefemale compared with only 38% of overweight individuals.African Americans (AA) were disproportionately representedin the obese category compared with the lean and overweightcategories. As expected, obese individuals overall were moreinsulin resistant. The prevalence of hypertension was similaracross BMI groups.
Table 2 shows baseline characteristics of the studypopulation stratified by both BMI and MW and MUWcategories. The majority (67%) of the lean individuals werecategorized as MUW. The percent of MUW increased withincreasing BMI; 80% of the overweight and 87% of the obesegroups were classified as MUW. In each stratum of BMI, MUWwas associated with male sex and Non-AA.
3.2. Metabolomic profiling
Principal components analysis (PCA) identified 12 metabolicfactors (Table 3) composed of correlated metabolites. Asexpected, and consistent with our prior work [3–6,17],metabolites generally clustered within factors in biologicallyplausible pathways. In particular, factors that we previouslyidentified as associated with insulin resistance, type 2diabetes and cardiovascular disease phenotypes were identi-fied, (factor 4, composed of branched chain amino acids andrelated catabolites, and factor 9 composed of C4/Ci4, C3, C5acylcarnitines).
Table 4 shows the association of metabolic factors withMW vs. MUW categories for the overall population andstratified by BMI. When considering the population as awhole, there were significant differences between MW andMUW for factor 3 (composed of ketones and related metab-olites) [p=.0058], factor 4 (BCAA) [p<.0001], factor 6 (mediumchain acylcarnitines) [p<.0001], factor 8 (various metabolites,glutamate/glutamine, ornithine, arginine and histidine)[p<.0001], factor 9 (C5 acylcarnitines) [p<.0001], factor 10
Overweight (N=610) Obese (N=852) p value b
61.66±11.02 56.97±10.82 <0.000138 51 <0.0001180.59±22.15 225.01±37.50 <0.000127.63±1.45 35.53±4.87 <0.000119 30 <0.000187 89 <0.000193.16±13.10 96.91±12.91 <0.00011.81±1.22 2.82±2.21 <0.0001122.02±81.50 128.90±75.05 <0.000136.78±13.95 37.51±12.89 <0.000180 87 <0.0001
s are reported as percent (%).ight/obese categories.
acids are novel biomarkers for discrimination of metabolic.2013.01.007
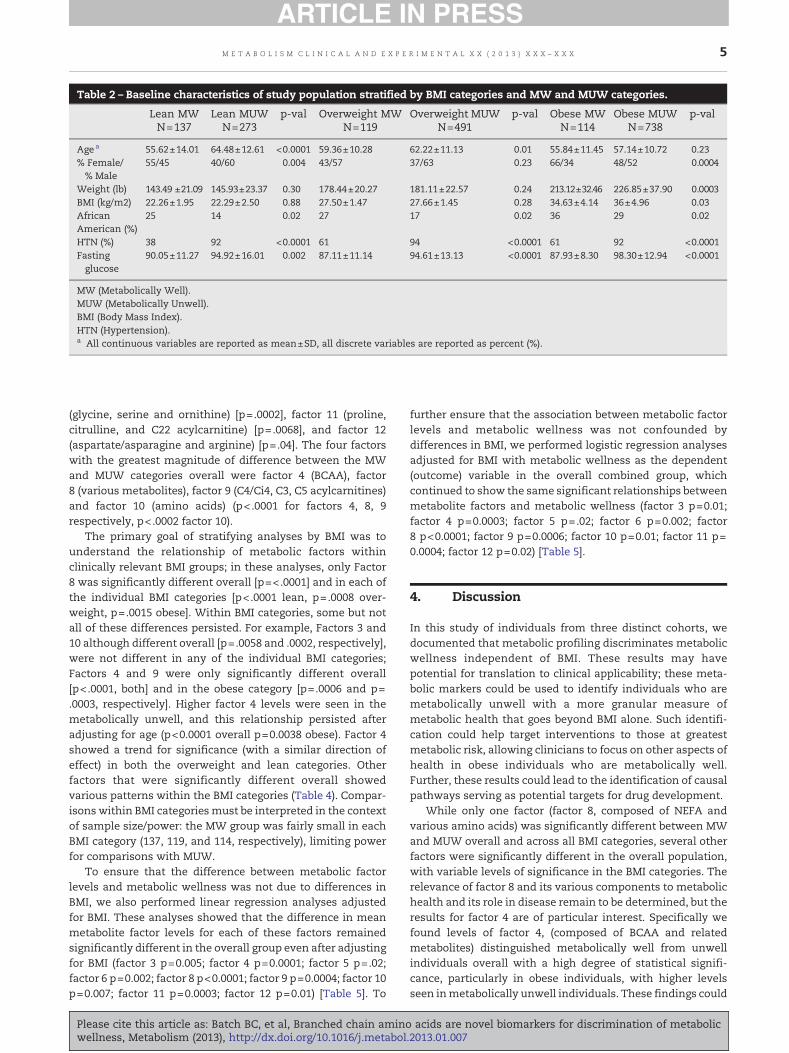
Table 2 – Baseline characteristics of study population stratified by BMI categories and MW and MUW categories.
Lean MWN=137
Lean MUWN=273
p-val Overweight MWN=119
Overweight MUWN=491
p-val Obese MWN=114
Obese MUWN=738
p-val
Agea 55.62±14.01 64.48±12.61 <0.0001 59.36±10.28 62.22±11.13 0.01 55.84±11.45 57.14±10.72 0.23% Female/% Male
55/45 40/60 0.004 43/57 37/63 0.23 66/34 48/52 0.0004
Weight (lb) 143.49 ±21.09 145.93±23.37 0.30 178.44±20.27 181.11±22.57 0.24 213.12±32.46 226.85±37.90 0.0003BMI (kg/m2) 22.26±1.95 22.29±2.50 0.88 27.50±1.47 27.66±1.45 0.28 34.63±4.14 36±4.96 0.03AfricanAmerican (%)
25 14 0.02 27 17 0.02 36 29 0.02
HTN (%) 38 92 <0.0001 61 94 <0.0001 61 92 <0.0001Fastingglucose
90.05±11.27 94.92±16.01 0.002 87.11±11.14 94.61±13.13 <0.0001 87.93±8.30 98.30±12.94 <0.0001
MW (Metabolically Well).MUW (Metabolically Unwell).BMI (Body Mass Index).HTN (Hypertension).a All continuous variables are reported as mean±SD, all discrete variables are reported as percent (%).
5M E T A B O L I S M C L I N I C A L A N D E X P E R I M E N T A L X X ( 2 0 1 3 ) X X X – X X X
(glycine, serine and ornithine) [p=.0002], factor 11 (proline,citrulline, and C22 acylcarnitine) [p=.0068], and factor 12(aspartate/asparagine and arginine) [p=.04]. The four factorswith the greatest magnitude of difference between the MWand MUW categories overall were factor 4 (BCAA), factor8 (various metabolites), factor 9 (C4/Ci4, C3, C5 acylcarnitines)and factor 10 (amino acids) (p< .0001 for factors 4, 8, 9respectively, p<.0002 factor 10).
The primary goal of stratifying analyses by BMI was tounderstand the relationship of metabolic factors withinclinically relevant BMI groups; in these analyses, only Factor8 was significantly different overall [p=<.0001] and in each ofthe individual BMI categories [p<.0001 lean, p=.0008 over-weight, p=.0015 obese]. Within BMI categories, some but notall of these differences persisted. For example, Factors 3 and10 although different overall [p=.0058 and .0002, respectively],were not different in any of the individual BMI categories;Factors 4 and 9 were only significantly different overall[p<.0001, both] and in the obese category [p=.0006 and p=.0003, respectively]. Higher factor 4 levels were seen in themetabolically unwell, and this relationship persisted afteradjusting for age (p<0.0001 overall p=0.0038 obese). Factor 4showed a trend for significance (with a similar direction ofeffect) in both the overweight and lean categories. Otherfactors that were significantly different overall showedvarious patterns within the BMI categories (Table 4). Compar-isons within BMI categoriesmust be interpreted in the contextof sample size/power: the MW group was fairly small in eachBMI category (137, 119, and 114, respectively), limiting powerfor comparisons with MUW.
To ensure that the difference between metabolic factorlevels and metabolic wellness was not due to differences inBMI, we also performed linear regression analyses adjustedfor BMI. These analyses showed that the difference in meanmetabolite factor levels for each of these factors remainedsignificantly different in the overall group even after adjustingfor BMI (factor 3 p=0.005; factor 4 p=0.0001; factor 5 p=.02;factor 6 p=0.002; factor 8 p<0.0001; factor 9 p=0.0004; factor 10p=0.007; factor 11 p=0.0003; factor 12 p=0.01) [Table 5]. To
Please cite this article as: Batch BC, et al, Branched chain aminowellness, Metabolism (2013), http://dx.doi.org/10.1016/j.metabol
further ensure that the association between metabolic factorlevels and metabolic wellness was not confounded bydifferences in BMI, we performed logistic regression analysesadjusted for BMI with metabolic wellness as the dependent(outcome) variable in the overall combined group, whichcontinued to show the same significant relationships betweenmetabolite factors and metabolic wellness (factor 3 p=0.01;factor 4 p=0.0003; factor 5 p=.02; factor 6 p=0.002; factor8 p<0.0001; factor 9 p=0.0006; factor 10 p=0.01; factor 11 p=0.0004; factor 12 p=0.02) [Table 5].
4. Discussion
In this study of individuals from three distinct cohorts, wedocumented that metabolic profiling discriminates metabolicwellness independent of BMI. These results may havepotential for translation to clinical applicability; these meta-bolic markers could be used to identify individuals who aremetabolically unwell with a more granular measure ofmetabolic health that goes beyond BMI alone. Such identifi-cation could help target interventions to those at greatestmetabolic risk, allowing clinicians to focus on other aspects ofhealth in obese individuals who are metabolically well.Further, these results could lead to the identification of causalpathways serving as potential targets for drug development.
While only one factor (factor 8, composed of NEFA andvarious amino acids) was significantly different between MWand MUW overall and across all BMI categories, several otherfactors were significantly different in the overall population,with variable levels of significance in the BMI categories. Therelevance of factor 8 and its various components to metabolichealth and its role in disease remain to be determined, but theresults for factor 4 are of particular interest. Specifically wefound levels of factor 4, (composed of BCAA and relatedmetabolites) distinguished metabolically well from unwellindividuals overall with a high degree of statistical signifi-cance, particularly in obese individuals, with higher levelsseen inmetabolically unwell individuals. These findings could
acids are novel biomarkers for discrimination of metabolic.2013.01.007

Table 3 – Principal components analysis.
Factor Name Individualcomponents
Eigenvalue Variance
1 Medium chainacylcarnitines
C8, C10, C12,C14, C14:1,C10:1, C14:2,C12:1
11.76 .22
2 Long chaindicarboxylacylcarnitines
C20-OH/C18-DC, C20:1-OH/C18:1-DC, C18-OH/C16-DC,C16-OH/C14-DC, C18:1-OH/C16:1-DC, C20,C14-OH/C12-DC, C12-OH/C10-DC
5.85 .11
3 Ketone related HBUT, KET, C4-OH, C2, C18:1-OH/C16:1-DC,ALA (−)
4.21 .08
4 BCAA related PHE, LEU/ILE,VAL, TYR, MET,ALA, HIS
3.64 .07
5 Long chainacylcarnitines
C18:1, C16,C18:2, C18, C14,C14:1-OH/C12:1-DC
2.67 .05
6 Medium chainacylcarnitines
C10:3, C8:1,C10:2, C10:1,Ci4-DC/C4-DC,
2.00 .04
7 Short chaindicarboxylacylcarnitines
C5-DC, C6-DC,Ci4-DC/C4-DC,C12-OH/C10-DC
1.77 .03
8 Various C5:1, NEFA,GLX, ORN, ARG(−), HIS (−)
1.62 .03
9 Short chainacylcarnitines
C4/Ci4, C3, C5S 1.38 .03
10 Amino acids GLY, SER, ORN 1.21 .0211 Various PRO, CIT, C22 1.89 .0212 Various ASX, ARG (−) 1.06 .02
Included in the table below are twelve factors identified fromprincipal components analysis (PCA). Column 2 lists an overalldescription of the factor, column 3 the individual metabolitescomprising that factor, column 4 the eigenvalue for the factor andcolumn 5 the variance for the factor.BCAA (Branch Chain Amino Acids).HBUT (β-Hydroxybutyrate).KET (Ketone).ALA (Alanine).PHE (Phenylalanine).LEU/ILE (Leucine/Isoleucine).VAL (Valine).TYR (Tyrosine).MET (Methionine).HIS (Histidine).NEFA (Non Esterified Fatty Acids).GLX (Glutamate/glutamine).ORN (Ornithine).ARG (Arginine).GLY (Glycine).SER (Serine).PRO (Proline).CIT (Citruline).C22 (C22 acylcarnitine).ASX (Aspartate/asparagine).
6 M E T A B O L I S M C L I N I C A L A N D E X P E R I M E N T A L X X ( 2 0 1 3 ) X X X – X X X
Please cite this article as: Batch BC, et al, Branched chain aminowellness, Metabolism (2013), http://dx.doi.org/10.1016/j.metabol
inform future research to determine causal links between theBCAA metabolic profile and the pathogenesis of obesity-associated adverse health consequences.
In addition to the BCAA factor, a related factor, factor 9 (C3and C5 acylcarnitines) distinguished between MW and MUWoverall and in the obese category. The similar patterns ofassociation of factors 4 and 9 are likely due to the fact that C3and C5 acylcarnitines are generated in part as byproducts ofBCAA catabolism. In fact, these metabolites cluster with theBCAA in a PCA-derived factor in many of our studies,suggesting their biological as well as statistical correlation.The findings for both factors 4 and 9 are particularlyprovocative given that we have shown previously that theBCAA biosignature is associated with insulin resistance [3],independently discriminates individuals with coronary arterydisease [5], and predicts who will have improvements ininsulin resistance with weight loss [6]. This group of metab-olites also has been shown to decrease drastically after gastricbypass surgery vs. similar amounts of behavioral weight loss[18] and to predict development of incident type 2 diabetes inindividuals without baseline diabetes [7].
The potential impact of using metabolic profiling in thisway (rather than targeting all obese but no lean individualswith prevention and treatment) depends on the prevalence ofmetabolic wellness among obese and unwellness among leanindividuals. In our population, the proportion of MW obeseindividuals (13%) was considerably lower than in the study byWildman (32%) [2]. The Wildman study used data from 5440participants of the NHANES (1999–2004) general populationsurvey; thus, the results may reflect prevalence in the generalpopulation. In contrast, a large proportion of our populationwas derived from a clinical database (i.e., CATHGEN, compris-ing patients undergoing evaluation for possible ischemic heartdisease), and may reflect lower prevalence of metabolicwellness in obese individuals who are older and havecardiovascular risk factors or CVD. Similarly, the number oflean individuals who were metabolically unwell in ouranalysis was higher than in the NHANES population (67% vs.,23.5%, respectively), again reflecting the difference between apopulation sample and an older clinical population [2].
These results also may inform understanding of racial/ethnic health disparities with regard to metabolic conse-quences of obesity. Interestingly, there were fewer AAs thannon-AAs who were MUW in all BMI categories. Thesedemographic differences are consistent with the results ofWildman et al. but are not consistent with epidemiologic datathat show that AAs have a higher prevalence of diabetes andhypertension, and AAs have higher rates of complicationsrelated to diabetes and hypertension [19]. Many studies havelooked beyond BMI for the etiology of these disparities. Studieshave shown that BMI alone is not predictive of mortality forAA women in particular [20]. For example, in a study byStevens et al., AA women were followed prospectively for upto 15 years. The results show no difference in the strength ofassociation between BMI andmortality across the entire rangeof BMI [21]. Although investigators have postulated that theracial/ethnic disparities in development of DM and hyperten-sion in AA may be secondary to lower resting metabolic rate,differences in site-specific adiposity and levels of adipocyto-kines, no theory has successfully defined the underlying
acids are novel biomarkers for discrimination of metabolic.2013.01.007

Table 5 – Regression model for each factor individually.
Factor Linear RegressionModel
Logistic Regression Model
Type III SS P value a OR 95% CI P value b
1 1.97 0.16 0.94 0.84–1.04 0.202 2.21 0.14 1.12 0.96–1.30 0.143 7.91 0.005 0.87 0.78–0.97 0.014 13.61 0.0001 1.26 1.11–1.43 0.00035 5.29 0.02 1.15 1.02–1.30 0.026 9.73 0.002 1.22 1.07–1.38 0.0027 3.06 0.08 1.24 0.99–1.55 0.078 57.11 <0.0001 1.64 1.44–1.86 <0.00019 12.47 0.0004 1.25 1.10–1.42 0.000610 6.91 0.007 0.86 0.77–0.97 0.0111 12.58 0.0003 1.24 1.10–1.40 0.000412 6.03 0.01 1.15 1.02–1.29 0.02
a Difference in mean metabolite factor levels between MW andMUW groups adjusted for BMI.b Factor level as a predictor of metabolic wellness, adjusted forBMI.
Tab
le4–Mea
nm
etab
olitefactor
leve
lsstratified
bym
etab
olic
fitn
essan
dBM
Icateg
ories.
Factor
Ove
rall
Lean
Ove
rweigh
tObe
se
MW
aMUW
pb
MW
MUW
pb
MW
MUW
pb
MW
MUW
pb
1)Med
ium
ChainAcy
lcarnitines
0.06
(0.96)
−0.01
(1.01)
0.89
0.04
(.94)
0.09
(1.55)
0.50
−0.07
(0.69)
−0.08
(0.76)
0.84
0.21
(1.18)
−0.00
9(0.89)
0.07
2)Lo
ngch
aindica
rbox
ylac
ylca
rnitines
−0.04
(0.84)
0.00
7(1.03)
0.59
0.05
(1.09)
0.11
(0.79)
0.05
−0.03
(0.81)
0.09
(1.14)
0.16
−0.15
(0.45)
−0.08
(1.03)
0.59
3)Keton
erelated
0.16
(1.20)
−0.04
(0.94)
.005
80.38
(1.37)
0.18
(1.03)
0.26
0.20
(1.29)
0.02
(1.02)
0.33
−0.13
(0.74)
−0.16
(0.83)
0.52
4)BC
AA
related
−0.26
(0.95)
0.06
(1.00)
<.000
1−0.46
(1.02)
−0.33
(0.96)
0.18
−0.26
(0.93)
−0.07
(0.96)
0.07
−0.00
3(0.82)
0.30
(0.98)
0.00
065)
Longch
ainac
ylca
rnitines
−0.09
(0.91)
0.02
(1.02)
.09
−0.06
(0.93)
0.13
(1.20)
0.33
−0.01
(0.99)
0.01
(1.03)
0.61
−0.22
(0.78)
−0.01
(0.93)
0.05
6)Med
ium
chainac
ylca
rnitines
−0.18
(0.89)
0.04
(1.01)
<.000
1−0.31
(0.90)
−0.01
(1.17)
0.00
04−0.20
(1.01)
−0.01
(1.07)
0.04
0−0.00
5(0.72)
0.09
(0.90)
0.41
7)Sh
ortch
aindica
rbox
ylac
ylca
rnitines
−0.05
(0.53)
0.01
(1.08)
0.53
−0.07
(0.33)
0.22
(2.16)
0.04
0.06
(0.79)
0.05
(0.74)
0.95
−0.15
(0.34)
−0.09
(0.50)
0.24
8)Various
−0.31
(0.98)
0.07
(0.99)
<.000
1−0.38
(1.0)
0.22
(0.88)
<.000
1−0.13
(0.98)
0.25
(0.90)
0.00
08−0.43
(0.94)
−0.09
(1.05)
0.00
159)
Shor
tch
ainac
ylca
rnitin
es−0.19
(0.89)
0.04
(1.02)
<.000
1−0.27
(0.84)
−0.06
(1.11)
0.14
−0.08
(0.93)
−0.03
(1.08)
0.64
−0.21
(0.91)
0.13
(0.93)
.000
310
)AminoAcids
0.20
(1.05)
−0.05
(0.98)
0.00
020.43
(1.13)
0.30
(1.05)
0.66
0.23
(1.03)
0.02
(0.97)
0.09
−0.10
(0.88)
−0.23
(0.92)
0.17
11)V
arious
−0.12
(0.90)
0.03
(1.02)
0.00
68−0.04
(1.02)
0.26
(1.20)
0.00
470.00
4(0.89)
0.11
(1.02)
0.40
−0.33
(0.72)
−0.11
(0.92)
0.02
12)V
arious
−0.14
(1.79)
0.03
(0.95)
0.04
−0.71
(1.27)
−0.14
(0.94)
<.000
10.33
(0.92)
0.10
(0.75)
0.01
0.05
(1.02)
0.05
(1.06)
0.91
MUW
(Metab
olically
Unwell).
MW
(Metab
olically
Well).
aValues
expr
esse
das
mea
n(SD).
bp-
valueforth
edifferen
cein
mea
nmetab
olitefactor
leve
lsbe
twee
nMW
andMUW
grou
ps.
7M E T A B O L I S M C L I N I C A L A N D E X P E R I M E N T A L X X ( 2 0 1 3 ) X X X – X X X
Please cite this article as: Batch BC, et al, Branched chain aminowellness, Metabolism (2013), http://dx.doi.org/10.1016/j.metabol
cause of the disparity. Our results provide a potential way toassess metabolic wellness in diverse populations where BMIhas not reliably predicted metabolic risk.
In the WLM study, dietary BCAA intake was only weaklycorrelated with peripheral BCAA levels [6], implying somebiological/genetic differences in processing of BCAA that maybe reflected in peripheral blood levels. Indeed, there isevidence as published by Herman et al. that adipose tissuehas the potential capacity to regulate circulating BCAA levelsin vivo [22].
Understanding how dietary BCAA intake affects insulinresistance is essential asmodulation of BCAA in the diet couldbe utilized as a future target for treatment. A recentlypublished randomized controlled trial designed to study theeffects of BCAA supplementation on glycemic control inpatients with chronic hepatitis C and insulin resistanceshowed there were no significant differences between fastingglucose, HbA1c or HOMA-IR in the control or BCAA supple-mented groups [23]. Future research in human subjects isneeded to further elucidate the effects of dietary BCAA oncirculating levels of BCAA and the impact on insulinresistance and glycemic control.
The strengths of the analysis are inclusion of a large,diverse group of men and women, standardized application ofthe definition of well and unwell to the entire population, useof highly accurate targeted quantitative metabolomic profil-ing and use of data reduction techniques to minimize the riskof false positive results.
Our analyses do have limitations. First, we pooled datasetsfrom studies with different designs and enrollment criteriarather than a random population sample. Still, the size anddiversity of our study populations and the fact that themethods for clinical characterization and metabolic profilingwere the same for all datasets enhance the potentialgeneralizability of our results. Second we do not know theimpact on results, if any, of varying duration of fasting andsource of serum/plasma (venous vs. arterial blood) in thedifferent study populations. Third, while our observational
acids are novel biomarkers for discrimination of metabolic.2013.01.007

8 M E T A B O L I S M C L I N I C A L A N D E X P E R I M E N T A L X X ( 2 0 1 3 ) X X X – X X X
analyses demonstrate association, we cannot determinecause and effect. Nonetheless, these associations point tofuture research of potential causal pathways. Fourth, ourknowledge of physiologic determinants of BCAA levels isincomplete.
In summary, multiple metabolic factors were able todistinguish metabolic wellness and unwellness in the overalland obese categories, independent of BMI. In particular, afactor comprising BCAA and related metabolites is a promis-ing biomarker that could refine the designation of cardiome-tabolic risk. Further research is needed to determine theclinical utility of BCAA profiling, the role of nutrient intake,and the extent to which the observed associations reflectcausal pathways.
Author contributions
Study concept and design: Batch, Shah, Turer, Haynes, Svetkey.Acquisition of data: Shah, Stevens, Muehlbauer, Bain,
Svetkey.Analysis and interpretation of data: Batch, Shah, Newgard,
Patel, Appel, Svetkey.Drafting of the manuscript: Batch, Shah, Svetkey.Critical revision of the manuscript for important intellectual
content: Batch, Shah, Newgard, Turer, Haynes, Bain Muehl-bauer, Patel, Stevens, Appel, Newby, Svetkey.
Statistical analysis: Batch, Shah, Svetkey.
Funding/Support
This study was supported by UO1 grants HL68734, HL68676,HL68790,HL68920, andHL68955. Itwas also supportedby fundingfrom the Measurement to Understand Re-Classification ofDisease of Cabarrus and Kannapolis (MURDOCK) Study and byGrant Number 1UL1 RR024128-01 from the National Center forResearch Resources (NCRR), a component of the NationalInstitutesofHealth (NIH)andNIHRoadmap forMedicalResearch,and its contentsare solely the responsibilityof theauthorsanddonot necessarily represent the official view of NCRR or NIH.Information on NCRR is available at [http://www.ncrr.nih.gov/].Information on Re-engineering the Clinical Research Enterprisecan be obtained from http://nihroadmap.nih.gov/clinicalresearch/overview/-translational.asp.
Acknowledgments
We are grateful to all the participants in the WLM clinical trialand the CATHGEN biorepository and to Gayle Meltesen andAlan Bauck at theWLMCoordinating Center, Center for HealthResearch, Portland, OR.
Conflicts of interest
No authors reported any relevant financial disclosures orconflicts of interest.
Please cite this article as: Batch BC, et al, Branched chain aminowellness, Metabolism (2013), http://dx.doi.org/10.1016/j.metabol
R E F E R E N C E S
[1] Ogden CL, Carroll MD, Flegal KM. Epidemiologic trends inoverweight and obesity. Endocrinol Metab Clin North Am2003;32:741–60.
[2] Wildman RP, Muntner P, Reynolds K, et al. The obese withoutcardiometabolic risk factor clustering and the normal weightwith cardiometabolic risk factor clustering. Arch Intern Med2008;168(15):1617–24.
[3] Newgard CB, An J, Bain JR, et al. A branched-chain aminoacid-related metabolic signature that differentiates obeseand lean humans and contributes to insulin resistance. CellMetab 2009;9:311–26.
[4] Huffman KM, Shah SH, Stevens RD, et al. Relationshipsbetween circulating metabolic intermediates and insulinaction in overweight to obese, inactive men and women.Diabetes Care 2009;32:1678–83.
[5] Shah SH, Bain JR, Muehlbauer MJ, et al. Association of aperipheral blood metabolic profile with coronary arterydisease and risk of subsequent cardiovascular events. CircCardiovasc Genet 2010;3:207–14.
[6] Shah SH, Crosslin DR, Haynes CS, et al. Branched-chainamino acid levels are associated with improvement ininsulin resistance with weight loss. Diabetologia 2012;55:321–30.
[7] Wang TJ, Larson MG, Vasan RS, et al. Metabolite profilesand the risk of developing diabetes. Nat Med 2011;17:448–53.
[8] Shah SH, Granger CB, Hauser ER, et al, for the MURDOCKHorizon 1 Cardiovascular Disease Investigators. Reclassifica-tion of cardiovascular risk using integrated clinical andmolecular biosignatures: design and rationale of the MUR-DOCK Horizon 1 Cardiovascular Disease Study. Am Heart J2010;160:371–9.e2.
[9] Hollis JF, Gullion CM, Stevens VJ, et al. Weight loss during theinitial intensive intervention phase of the Weight LossMaintenance Trial. Am J Prev Med 2008;35:118–26.
[10] Svetkey LP, Stevens VJ, Brantley PJ, et al. Comparison ofstrategies for sustaining weight loss: the weight loss main-tenance randomized controlled trial. JAMA 2008;299:1139–48.
[11] Haqq AM, Lien LF, Boan J, Arlotto M, et al. The Study of theEffects of Diet on Metabolism and Nutrition (STEDMAN)weight loss project: rationale and design. Contemp Clin Trials2005;26:616–25.
[12] Matthews DR, Hosker JP, Rudenski AS, et al. Homeostasismodel assessment: insulin resistance and beta cell functionfrom fasting plasma glucose and insulin concentrations inman. Diabetologia 1985;28:412–9.
[13] Ascaso JF, Pardo S, Real JT, et al. Diagnosing insulin resistanceby simple quantitative methods in subjects with normalglucose metabolism. Diabetes Care 2003;26:3320–5.
[14] Qu H-Q, Li Q, Rentfro AR, et al. The definition of insulinresistance using HOMA-IR for Americans of Mexican descentusing machine learning. PLoS One 2011;6(6):1–4.
[15] An J, Muoio DM, Shiota M, et al. Hepatic expression ofmalonyl-CoA decarboxylase reverses muscle, liver andwhole-animal insulin resistance. Nat Med 2004;10:268–74.
[16] Chace DH, Hillman SL, Millington DS, et al. Rapid diagnosis ofmaple syrup urine disease in blood spots from newborns bytandem mass spectrometry. Clin Chem 1995;41:62–6.
[17] Shah SH, Hauser ER, Bain JR, et al. High heritability ofmetabolomic profiles in families burdened with prematurecardiovascular disease. Mol Syst Biol 2009;5:1–7.
[18] Laferrère B, Reilly D, Arias S, et al. Differential metabolicimpact of gastric bypass surgery versus dietary intervention
acids are novel biomarkers for discrimination of metabolic.2013.01.007
9M E T A B O L I S M C L I N I C A L A N D E X P E R I M E N T A L X X ( 2 0 1 3 ) X X X – X X X
in obese diabetic subjects despite identical weight loss. SciTransl Med 2011;3(80):80.
[19] Bonds DE, Goff DC, Karter AJ, et al. Ethnic and racialdifferences in diabetes care. Diabetes Care 2003;26:1040–6.
[20] Fontaine KR, ReddenDT,Wang C, et al. Years of life lost due toobesity. JAMA 2003;289:187–93.
[21] Stevens J. Obesity and mortality in African Americans. NutrRev 2000;58:316–58.
Please cite this article as: Batch BC, et al, Branched chain aminowellness, Metabolism (2013), http://dx.doi.org/10.1016/j.metabol
[22] Herman MA, She P, Peroni OD, et al. Adipose tissue branchedchain amino acid (BCAA) metabolism modulates circulatingBCAA levels. J Biol Chem 2010;285(15):11348–56.
[23] Takeshita Y, Takamura T, Kita Y, et al. Beneficial effect ofbranched chain amino acid supplementation on glycemiccontrol in chronic hepatitis C patients with insulin resistance:implications for type 2 diabetes. Metabolism 2012;61(10):1388–94.
acids are novel biomarkers for discrimination of metabolic.2013.01.007


![Branched-chain Amino Acid Nitrogen Transfer · Branched-chain AminoAcid Nitrogen Transfer to Alanine In Vivo in Dogs DIRECTISOTOPIC DETERMINATIONWITH[15N]LEUCINE ... (1.01 mol percent](https://static.fdocuments.in/doc/165x107/5e348c91356a29563d0a2781/branched-chain-amino-acid-nitrogen-transfer-branched-chain-aminoacid-nitrogen-transfer.jpg)