Brain Structural and Functional Image Analysis of Amblyopia
68
Brain Structural and Functional Image Analysis of Amblyopia Huiguang He(何晖光), Ph. D [email protected] Institute of Automation , Chinese Academy of Sciences
Transcript of Brain Structural and Functional Image Analysis of Amblyopia

Brain Structural and Functional Image Analysis of Amblyopia
Huiguang He(何晖光), Ph. [email protected]
Institute of Automation , Chinese Academy of Sciences
Overview and Background Structural and Functional Deficit in
Amblyopia Functional Connectivity Analysis in
Amblyopia Conclusion
Outline

Background
Medical Treatment:– qualitative analysis quantitative analysis
(experience based) (knowledge based)

Background - 19~20 Century
To see the pathological changes– Structure imaging
X-ray CT Image processing and
analyzing system

Background - 1990s, 20 Century
To see the functions– Functional imaging
fMRI PET SPECT

■ Molecular Imaging▪ Optical Imaging▪ Nuclear Imaging
To see the cell, molecular
Realtime、Live
Background - 21 Century
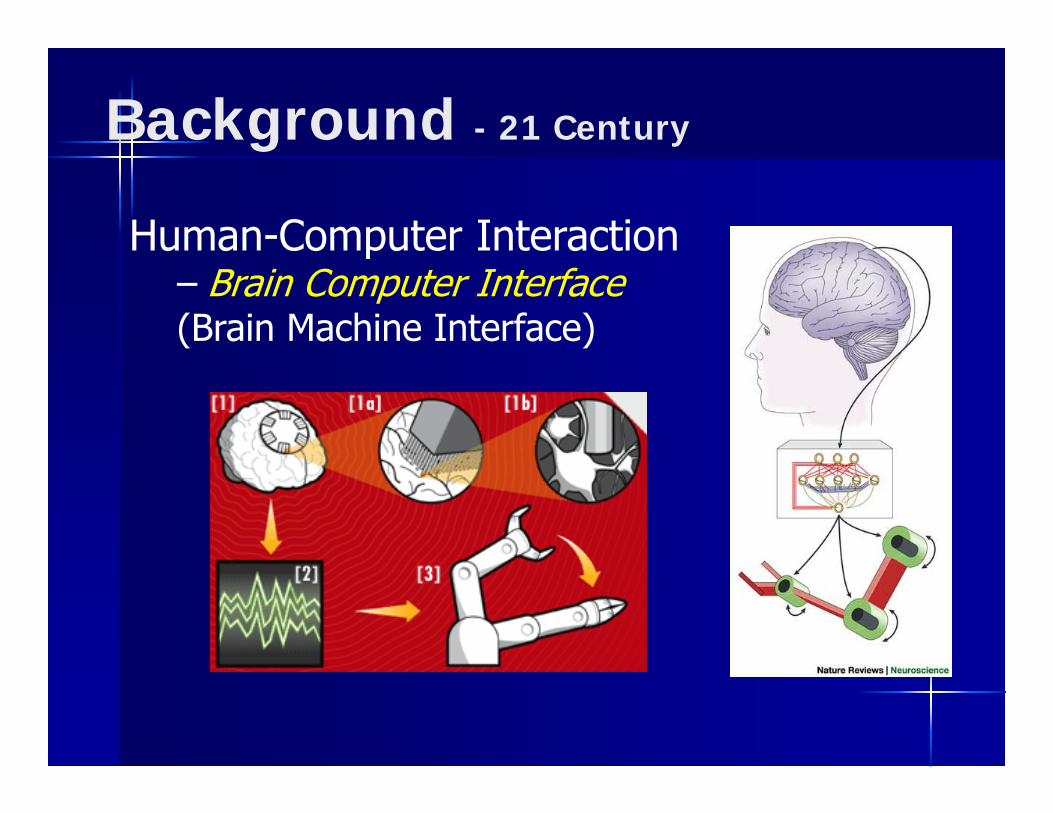
Background - 21 Century
Human-Computer Interaction– Brain Computer Interface(Brain Machine Interface)

Image Processing
Method Application
Clinical Information
Medical Imaging
TherapistBio-markers
Early Diagnosis
Diagnosis Assistance
Prognosis
Research & Analysis
Theory
Overview---Research Framework
PatternRecognition
Image Processing

Research Fields
Algorithmplatform
Softwaresystem
Visual System
Network Analysis
Spike Data Anaysis
Algorithms &
Theory

Where are the lesions
The
lesions
The relationship
between lesions
Struc. VS Func.
Background---Visual Pathway

外侧膝状体与视觉通路
Courtesy of http://anatome.ncl.ac.uk/tutorials/clinical/eye/page6.html#title.
外侧膝状体(LGN)
结构细小,突触连接复杂,缺乏有效的活体内定位、观察手段。
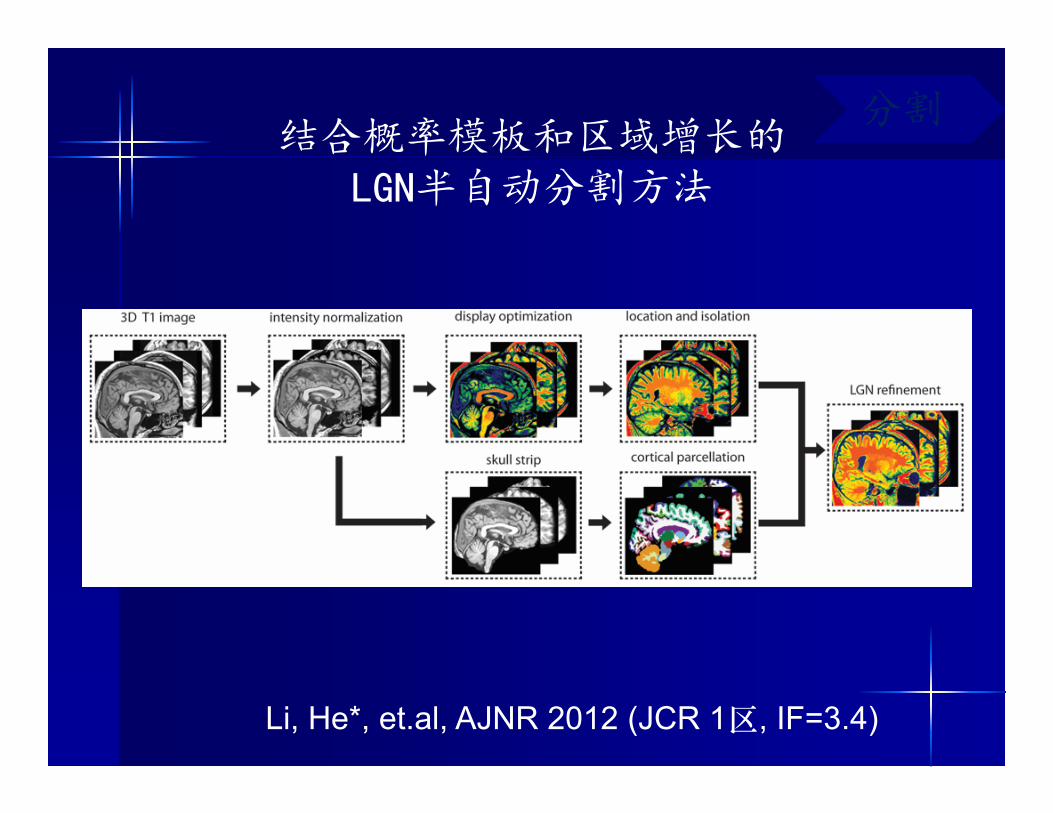
Li, He*, et.al, AJNR 2012 (JCR 1区, IF=3.4)
结合概率模板和区域增长的LGN半自动分割方法
分割

Li, Li, He*, et. al, British Journal of Radiology, JCR 2区, IF=2.4, 2011
理论法

弱视结构损伤和功能损伤的定位
Lv, He*, et al, NeuroScience Letters 2008 IF=2.2

基于脑皮层厚度的结构网络
FDR
Cortical thickness measurements
Cortical parcellation
0
0.6
0.4
0.2
-0.2
-0.4
Regions
Reg
ions
Cross-correlationmatrix
Binarized matrix
Reg
ions
N
0
7
Subjects
54Cortical thickness data matrix
Lv, Li, He*, et al, NeuroImage 2010,(JCR 1区, 5 year IF=6.8)

Voxel-based time coursesVoxel-based time courses
Threshold and rearrange FC edge weight
Threshold and rearrange FC edge weight
CC400 Template Time courses of 351 ROIsTime courses of 351 ROIs
FC Matrix
RS-fMRI data preprocessingRS-fMRI data preprocessing
Functional ParcellationFunctional Parcellation
FC edge featuresFC edge features
Pearson Correlation
Pearson Correlation
结合多模态影像的网络分类方法研究
Dai, et al, Frontiers in System Neuroscience 2012Dai, et al, Machine Vision and Application, 2013

Bayes 网络对神经元交互模式的分析
Sang,Lv, He*, et al, IEEE Intelligent Systems,2011, JCR 1区,IF=2.6

冠状动脉手术导航系统

Source: fMRIB Brief Introduction to fMRI
neural activity blood flow oxyhemoglobin T2* fMRI signal
Blood Oxygen Level Dependent signal
Background- fMRI BOLD Signal
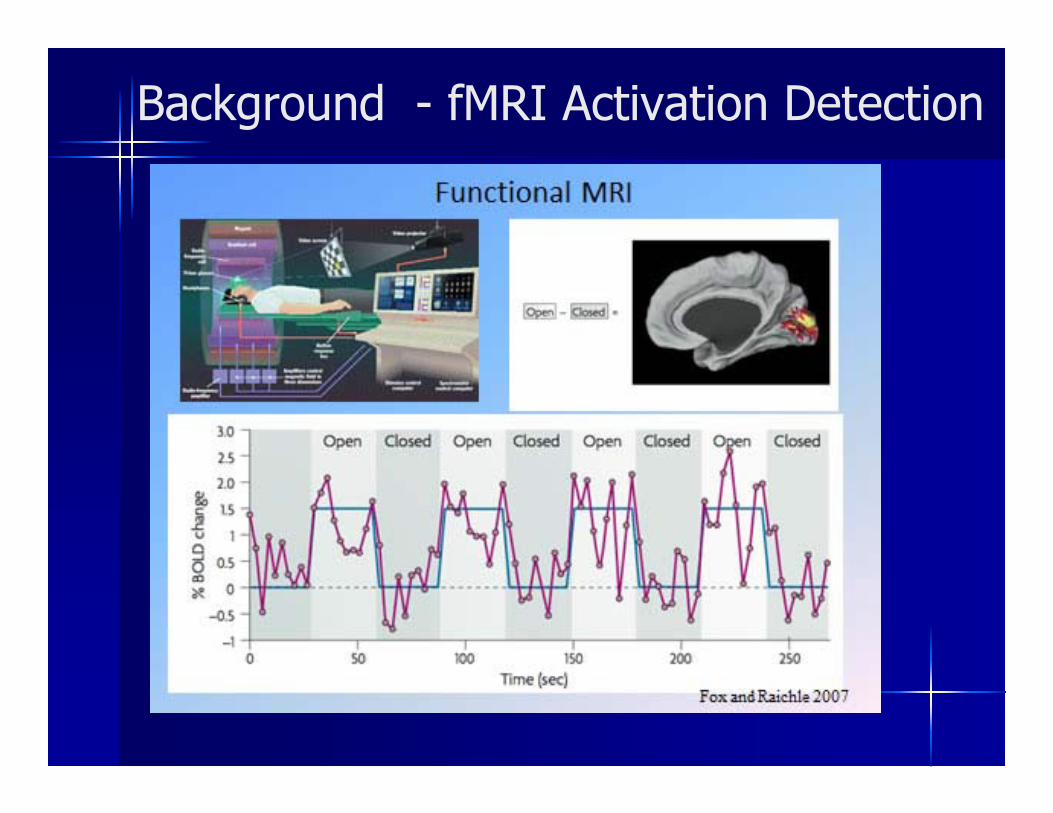
Background - fMRI Activation Detection

Background ---Retinotopic Organization
From visual field to primary visual cortex
Left to right
Upper to lower

Background --- Retinotopic organization
From Engel et al, Cerebral Cortex, 1997

Retinotopy Mapping

Amblyopia
Amblyopia is poor vision in an eye that did not develop normal sight during early childhood
Different with myopia, can't be rectified by glasses
Most caused by Strabismus , Refractive Error, and so on

Amblyopia

How common is amblyopia?
approximately 3% of the world population
Amblyopia

Background of amblyopia study
How is amblyopia treated?

What causes amblyopia?
http://www.edoctoronline.com/medical-atlas.asp?c=4&id=21877
Background of amblyopia study

Motivation
Perform the retinotopic mapping to identify the visual areas;
Investigate whether there is the functional deficit in visual area;
Investigate whether there is the structural deficit (cortical thickness, lobe volume) and its relationship with functional deficit.

Subjects
11 amblyopes (7M/4F, 22.57±3.45)
11 normal control (7M/4F, 25.34±1.53)
7 anisometropic and 4 strabismic ,The best-corrected visual acuities of their soundeye were all 1.0, while that of their amblyopia eye were less than 0.6 (mean 0.31±0.26).

wedge rotating clockwise ring dilatingor counterclockwise or contracting
Experiment DesignTwo kinds of visual stimuli
polar-angle and eccentricity

Image Acquisition
Anatomic MRI 3D 256*256*124 FOV 256mm*256mm
Functional MRI (64*64*30 EPI TR=3s TE=51ms, slice thickness 4mm, 128 Volumes)
1.5T GE Scanner, JinLing Hospital, Medical School of Nanjing University
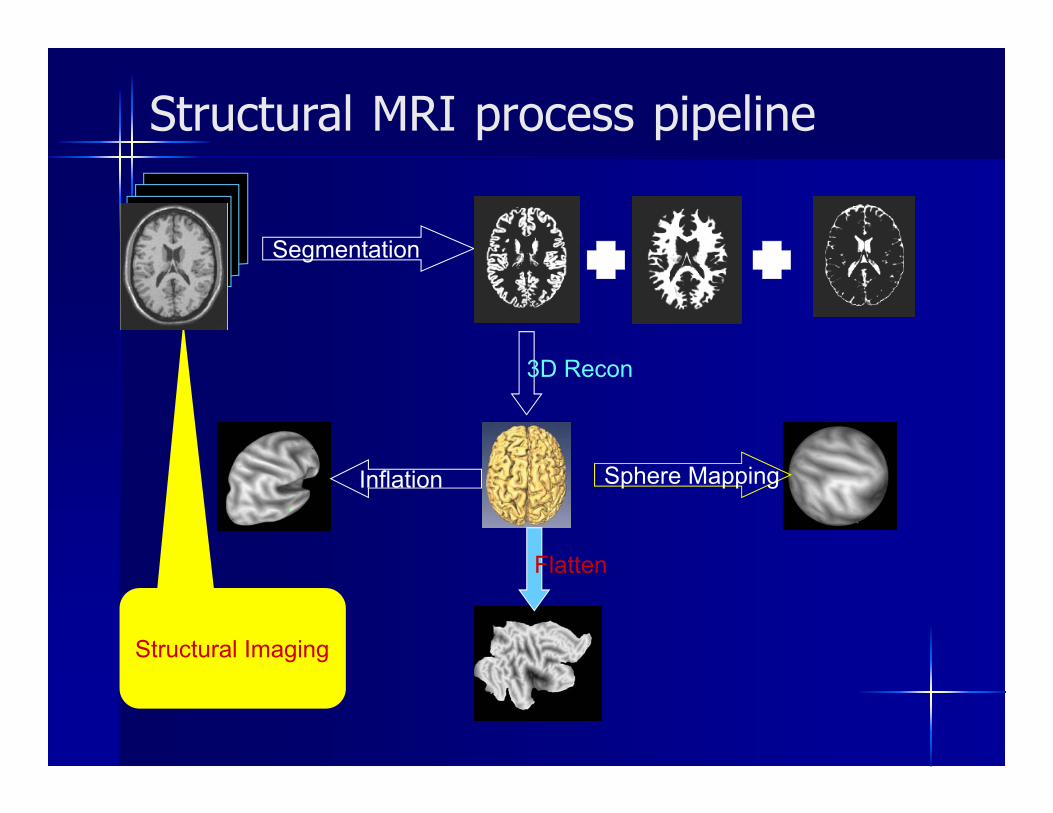
Segmentation
3D Recon
Inflation
Flatten
Sphere Mapping
Structural Imaging
Structural MRI process pipeline

fMRI preprocess pipeline
Conventional preprocess steps--SPM

fMRI process pipeline
Fourier transform (FFT)


fMRI process pipeline Conventional preprocess steps Fourier transform (FFT) Visual field sign identification (VFS)

Retinotopic visual areas
For detail, ref. Warnking J, et al, NeuroImage, 2002

Individual Analysis---BOLD Response Curve
Fixing amblyopic

Activation Magnitude Analysis
Normal amblyopic

Phase Analysis
Normal amblyopic
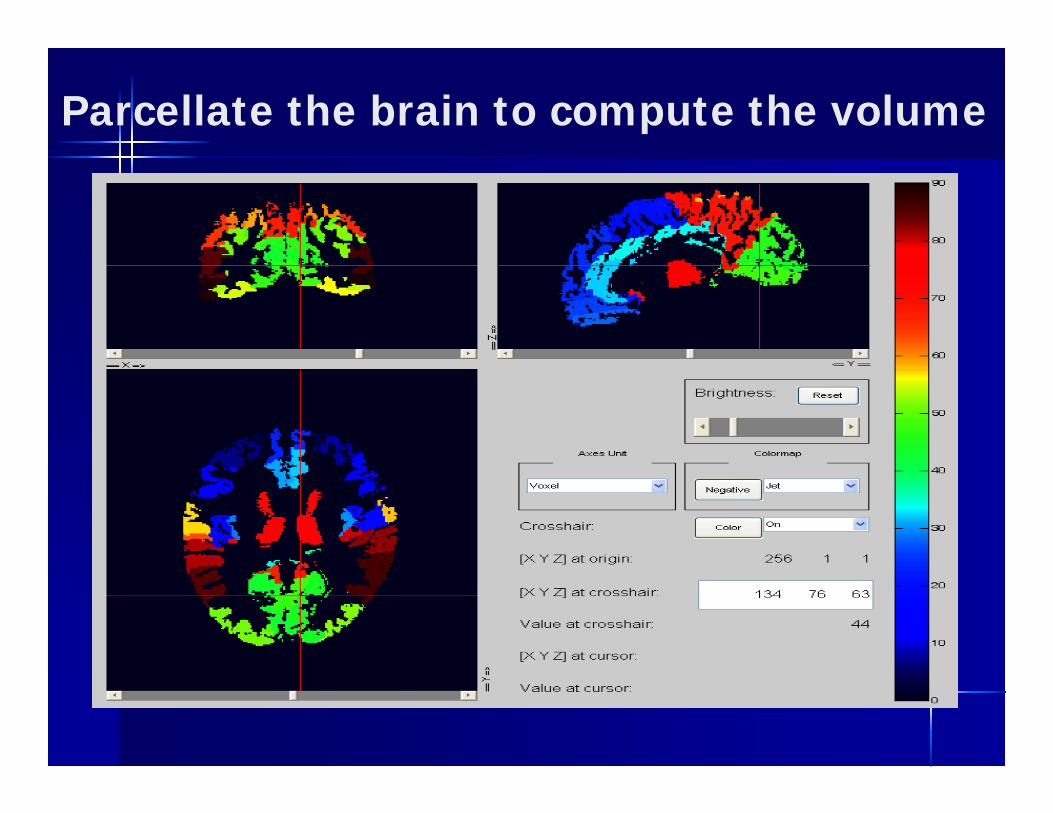
Parcellate the brain to compute the volume

Functional Difference
Ffix : means the activation of the fix eyeFamb : means the activation of the amblyopic eye

Structural-Functional Correlation

Structural-Functional Correlation Results

Cortical thickness

Results and Summary
No significant difference on global mean cortical thickness and V1/v2 mean cortical thickness
There were significant main effect of hemisphere (F (1, 22) = 6.37, P < 0.05) and main effect of group (F (10, 22) = 2.95, P < 0.05
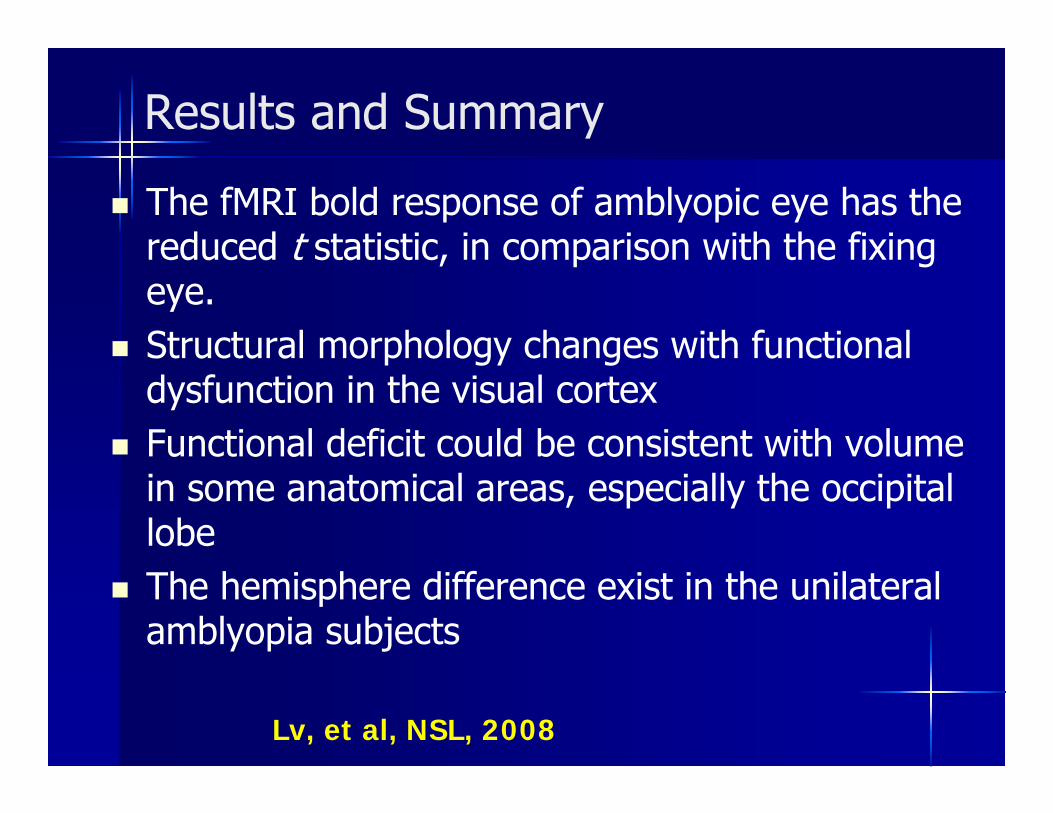
The fMRI bold response of amblyopic eye has the reduced t statistic, in comparison with the fixing eye.
Structural morphology changes with functional dysfunction in the visual cortex
Functional deficit could be consistent with volume in some anatomical areas, especially the occipital lobe
The hemisphere difference exist in the unilateral amblyopia subjects
Results and Summary
Lv, et al, NSL, 2008

Overview Structural and Functional Deficit in
Amblyopia Functional Connectivity Analysis in Amblyopia Conclusion
Outline

Motivation
Investigate whether there is functional connectivity abnormality in amblyopia subjects with resting state fMRI
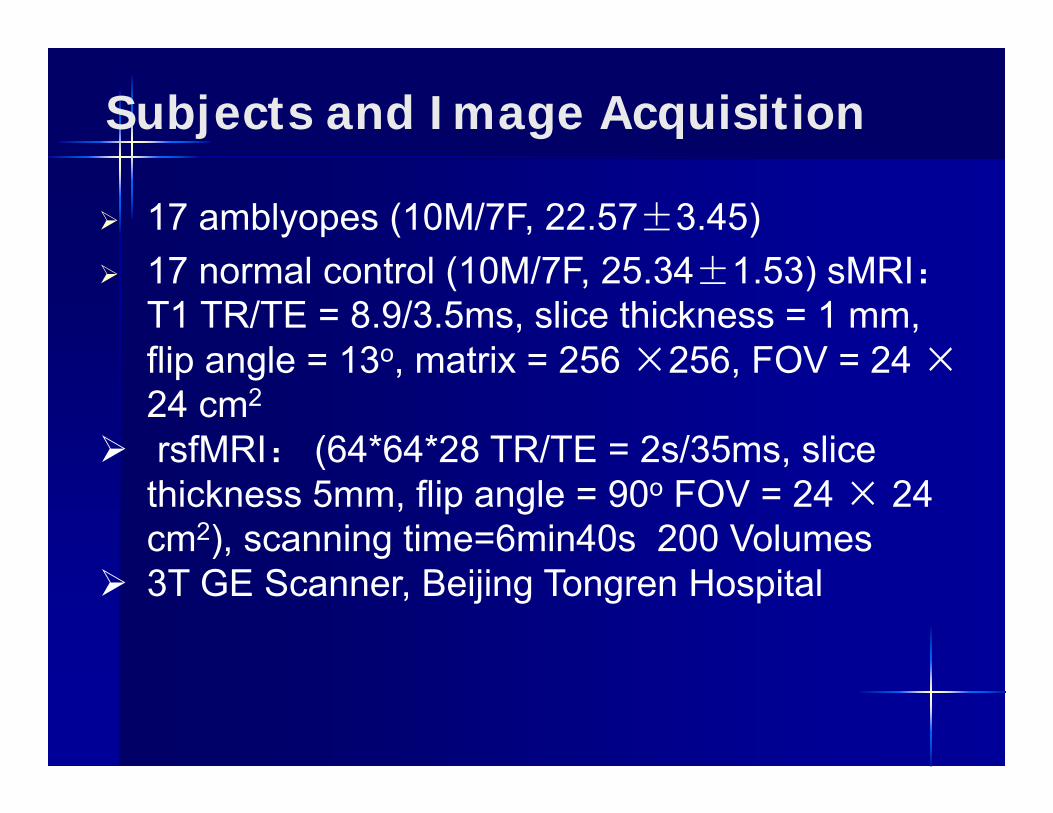
Subjects and Image Acquisition
17 amblyopes (10M/7F, 22.57±3.45) 17 normal control (10M/7F, 25.34±1.53) sMRI:
T1 TR/TE = 8.9/3.5ms, slice thickness = 1 mm, flip angle = 13o, matrix = 256 ×256, FOV = 24 ×24 cm2
rsfMRI: (64*64*28 TR/TE = 2s/35ms, slice thickness 5mm, flip angle = 90o FOV = 24 × 24 cm2), scanning time=6min40s 200 Volumes
3T GE Scanner, Beijing Tongren Hospital

Analysis of functional connectivity
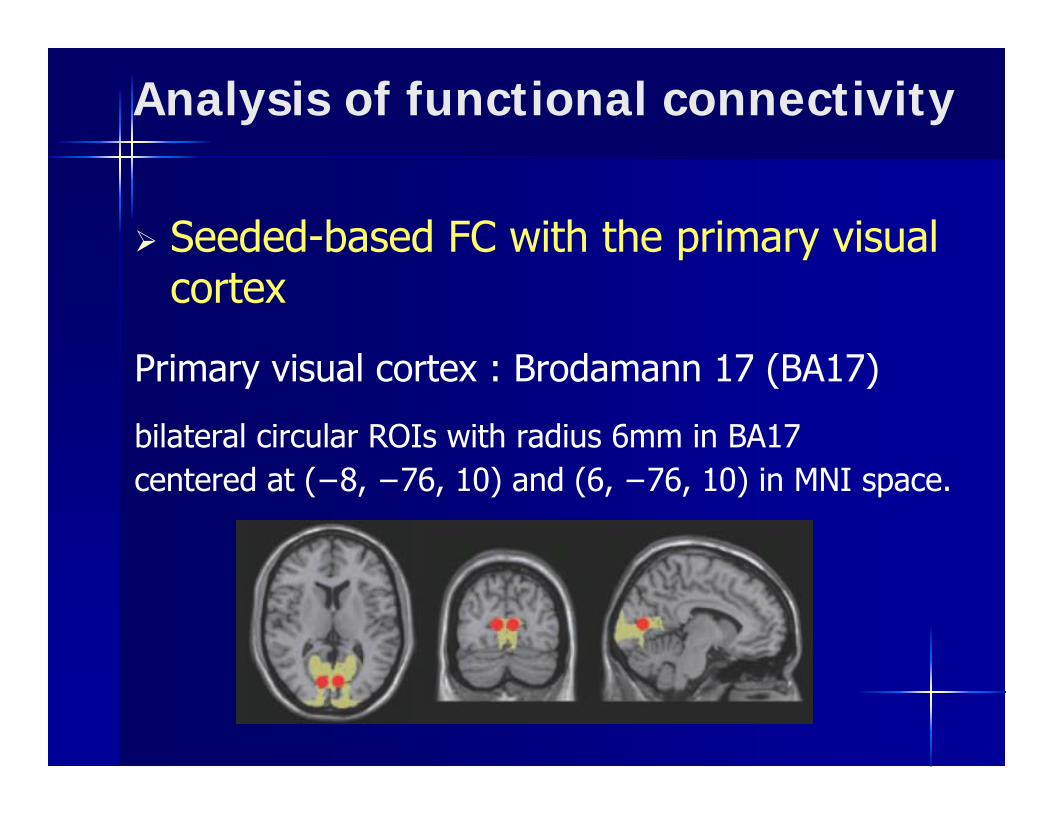
Seeded-based FC with the primary visual cortex
Whole brain network

Preprocessing of resting state fMRI
Slice & Motioncorrection Smoothing
kernel
Spatialnormalisation
Standardtemplate
fMRI time-series
Analysis of functional connectivity
Seeded-based FC with the primary visual cortex
Primary visual cortex : Brodamann 17 (BA17)bilateral circular ROIs with radius 6mm in BA17centered at (−8, −76, 10) and (6, −76, 10) in MNI space.

Analysis of functional connectivity
Smoothing
kernel
Spatialnormalisation
Standardtemplate
fMRI time-series
Connectivity with the other voxels
Slice & Motioncorrection

Analysis of functional connectivity
Smoothing
kernel
Spatialnormalisation
Standardtemplate
fMRI time-series
Slice & Motioncorrection
Whole brain network

Experiments and ResultsSeeded-based FC with the left primary visual
cortex:FDR corrected, p<0.05

Experiments and Results
Seeded-based FC with the left primary visual cortex:
Dorsal stream Ventral stream

Experiments and ResultsSeeded-based FC with the right primary visual
cortex:FDR corrected, p<0.05

Experiments and ResultsSeeded-based FC with the right primary visual
cortex:
Dorsal stream Ventral stream

Experiments and Results
Whole brain network:

Experiments and ResultsWhole brain network:

Experiments and ResultsWhole brain network: (uncorrected P<0.001)
Temporal cortex
Cerebellum

Summary Seed-based FC: decreased FC with the primary visual cortex was found in the superior occipital gyrus and the lingual gyrus. The results suggested that functional deficits exist in both dorsal stream and ventral stream.Whole brain network: decreased functional connectivities most concentrate in the temporal cortex, then in the cerebellum. These results suggest that amblyopia may be caused by the deficits in the visual information transmission.
Wang, et al, SPIE MI, 2014 Oral

Conclusion and future work
Introduce two kinds of amblyopia study, task fMRI and resting state fMRI
Will try to reconstruct the whole visual pathway and make connectivity analysis
Will try to combine multi-modality imaging, such as DTI, fMRI, OCT, and VEP, etc.

Human Brain Connectome
PLoS Biology 6(7): e150, 2008
fcMRI
DSI
CBF
EEG
fMRI
MEG

Acknowledgements This project is collaborated with
McGill Vision Center,Nanjing Jinling Hospital
and Beijing Tongren Hospital
McGill Center:Dr. Robert HessDr. Xingfeng Li
Nanjing Jinling Hospital:MD. Guangming LuMD. Zhiqiang ZhangMD. Wei Huang
CASIA Graduate Students:Bin Lv, Meng Li, Wenjing Li, Wen Miao, Jieqiong Wang
Bejing Tongren Hosital:MD. Zhengchang Wang, Junfang Xian, Likun Ai, Wei Shi, Jing Li