Brain magnetic resonance imaging and manganese ...
10
Brain magnetic resonance imaging and manganese concentrations in red blood cells of smelting workers: Search for biomarkers of manganese exposure Yueming Jiang a , Wei Zheng b, * , Liling Long c , Weijia Zhao d , Xiangrong Li c , Xuean Mo d , Jipei Lu a , Xue Fu a , Wenmei Li c , Shouting Liu e , Quanyong Long f , Jinli Huang f , Enrico Pira g a Department of Occupational Health and Toxicology, Guangxi Medical University, Nanning 530021, China b School of Health Sciences, Purdue University, 550 Stadium Mall Drive, CIVL-1163D, West Lafayette, IN 47907, USA c Department of Radiology, The First Affiliated Hospital of Guangxi Medical University, Nanning 530021, China d Department of Neurology, The First Affiliated Hospital of Guangxi Medical University, Nanning 530021, China e Guangxi Center for Analysis and Test Research, Nanning 530021, China f Worker’s Hospital of Guangxi Bayi Ferroalloy Company, Laibin 546102, China g Department of Traumatology, Orthopaedics and Occupational Health, University of Turin, Turin 10126, Italy Received 4 April 2006; accepted 14 August 2006 Available online 22 August 2006 Abstract The MRI technique has been used in diagnosis of manganism in humans and non-human primates. This cross-sectional study was designed to explore whether the pallidal signal intensity in T1-weighted MRI correlated with Mn levels in the blood compartment among Mn-exposed workers and to understand to what extent the MRI signal could reflect Mn exposure. A group of 18 randomly selected male Mn-exposed workers of which 13 were smelting workers with high exposure (mean of airborne Mn in work place: 1.26 mg/m 3 ; range: 0.31–2.93 mg/m 3 ), and 5 power distribution control workers with low exposure (0.66 mg/m 3 and 0.23–0.77 mg/m 3 ) from a ferroalloy factory, and another group of 9 male subjects as controls from a non-smelting factory who were office or cafeteria workers (0.01 mg/m 3 and 0–0.03 mg/m 3 ) were recruited for neurological tests, MRI examination, and analysis of Mn in whole blood (MnB), plasma (MnP) or red blood cells (MnRBC). No clinical symptoms and signs of manganism were observed among these workers. MRI data showed average increases of 7.4% ( p < 0.05) and 16.1% ( p < 0.01) in pallidal index (PI) among low- and high-exposed workers, respectively, as compared to controls. Fourteen out of 18 Mn-exposed workers (78%) had intensified PI values, while this proportion was even higher (85%) among the high Mn-exposed workers. Among exposed workers, the PI values were significantly associated with MnRBC (r = 0.55, p = 0.02). Our data suggest that the workers exposed to airborne Mn, but without clinical symptoms, display an exposure-related, intensified MRI signal. The MRI, as well as MnRBC, may be useful in early diagnosis of Mn exposure. # 2006 Elsevier Inc. All rights reserved. Keywords: Manganese; MRI; Red blood cells; Trace element; Smelting workers; Biomarker 1. Introduction Severe manganese (Mn) intoxication (manganism) causes irreversible neurodegenerative parkinsonian syndromes which can be recognized and characterized by patient’s clinical manifestations (Aschner et al., 1999; Crossgrove and Zheng, 2004; Huang et al., 1998). Because there is scarcely any effective treatment for manganism, the early diagnosis of Mn neurotoxicity, particularly with low-level Mn exposure in occupational settings, has become critical in disease prevention and possibly clinical intervention. Recent clinical research efforts have been devoted to exploring the utility of magnetic resonance imaging (MRI) technique to identify brain regional Mn status among Mn-exposed workers (Kim, 2004; Kim et al., 1999c; Lucchini et al., 1999, 2000; Shinotoh et al., 1995) or to seek biochemical markers that are associated with Mn exposure (Husain et al., 2001; Lu et al., 2005). NeuroToxicology 28 (2007) 126–135 * Corresponding author. Tel.: +1 765 496 6447; fax: +1 765 496 1377. E-mail address: [email protected] (W. Zheng). 0161-813X/$ – see front matter # 2006 Elsevier Inc. All rights reserved. doi:10.1016/j.neuro.2006.08.005
Transcript of Brain magnetic resonance imaging and manganese ...

NeuroToxicology 28 (2007) 126–135
Brain magnetic resonance imaging and manganese concentrations
in red blood cells of smelting workers: Search
for biomarkers of manganese exposure
Yueming Jiang a, Wei Zheng b,*, Liling Long c, Weijia Zhao d, Xiangrong Li c,Xuean Mo d, Jipei Lu a, Xue Fu a, Wenmei Li c, Shouting Liu e,
Quanyong Long f, Jinli Huang f, Enrico Pira g
a Department of Occupational Health and Toxicology, Guangxi Medical University, Nanning 530021, Chinab School of Health Sciences, Purdue University, 550 Stadium Mall Drive, CIVL-1163D, West Lafayette, IN 47907, USA
c Department of Radiology, The First Affiliated Hospital of Guangxi Medical University, Nanning 530021, Chinad Department of Neurology, The First Affiliated Hospital of Guangxi Medical University, Nanning 530021, China
e Guangxi Center for Analysis and Test Research, Nanning 530021, Chinaf Worker’s Hospital of Guangxi Bayi Ferroalloy Company, Laibin 546102, China
g Department of Traumatology, Orthopaedics and Occupational Health, University of Turin, Turin 10126, Italy
Received 4 April 2006; accepted 14 August 2006
Available online 22 August 2006
Abstract
The MRI technique has been used in diagnosis of manganism in humans and non-human primates. This cross-sectional study was designed to
explore whether the pallidal signal intensity in T1-weighted MRI correlated with Mn levels in the blood compartment among Mn-exposed workers
and to understand to what extent the MRI signal could reflect Mn exposure. A group of 18 randomly selected male Mn-exposed workers of which
13 were smelting workers with high exposure (mean of airborne Mn in work place: 1.26 mg/m3; range: 0.31–2.93 mg/m3), and 5 power distribution
control workers with low exposure (0.66 mg/m3 and 0.23–0.77 mg/m3) from a ferroalloy factory, and another group of 9 male subjects as controls
from a non-smelting factory who were office or cafeteria workers (0.01 mg/m3 and 0–0.03 mg/m3) were recruited for neurological tests, MRI
examination, and analysis of Mn in whole blood (MnB), plasma (MnP) or red blood cells (MnRBC). No clinical symptoms and signs of manganism
were observed among these workers. MRI data showed average increases of 7.4% ( p < 0.05) and 16.1% ( p < 0.01) in pallidal index (PI) among
low- and high-exposed workers, respectively, as compared to controls. Fourteen out of 18 Mn-exposed workers (78%) had intensified PI values,
while this proportion was even higher (85%) among the high Mn-exposed workers. Among exposed workers, the PI values were significantly
associated with MnRBC (r = 0.55, p = 0.02). Our data suggest that the workers exposed to airborne Mn, but without clinical symptoms, display an
exposure-related, intensified MRI signal. The MRI, as well as MnRBC, may be useful in early diagnosis of Mn exposure.
# 2006 Elsevier Inc. All rights reserved.
Keywords: Manganese; MRI; Red blood cells; Trace element; Smelting workers; Biomarker
1. Introduction
Severe manganese (Mn) intoxication (manganism) causes
irreversible neurodegenerative parkinsonian syndromes
which can be recognized and characterized by patient’s
clinical manifestations (Aschner et al., 1999; Crossgrove and
Zheng, 2004; Huang et al., 1998). Because there is scarcely
* Corresponding author. Tel.: +1 765 496 6447; fax: +1 765 496 1377.
E-mail address: [email protected] (W. Zheng).
0161-813X/$ – see front matter # 2006 Elsevier Inc. All rights reserved.
doi:10.1016/j.neuro.2006.08.005
any effective treatment for manganism, the early diagnosis of
Mn neurotoxicity, particularly with low-level Mn exposure in
occupational settings, has become critical in disease
prevention and possibly clinical intervention. Recent clinical
research efforts have been devoted to exploring the utility of
magnetic resonance imaging (MRI) technique to identify
brain regional Mn status among Mn-exposed workers (Kim,
2004; Kim et al., 1999c; Lucchini et al., 1999, 2000; Shinotoh
et al., 1995) or to seek biochemical markers that are
associated with Mn exposure (Husain et al., 2001; Lu et al.,
2005).
Y. Jiang et al. / NeuroToxicology 28 (2007) 126–135 127
MRI identification of brain regional Mn accumulation takes
advantage of the paramagnetic properties of Mn, which allows
the shortening of the T1 relaxation time and hence increases the
signal intensity unique to Mn ions. An increased T1-weighted
Mn signal in the globus pallidus area has been found among
workers occupationally exposed to Mn (Dietz et al., 2001; Kim
et al., 1999b; Lucchini et al., 2000; Nelson et al., 1993), in
patients receiving long-term total parenteral nutrition (Alves
et al., 1997; Ejima et al., 1992; Fell et al., 1996; Fredstrom et al.,
1995; Iwase et al., 2000; Komaki et al., 1999; Nagatomo et al.,
1999; Quaghebeur et al., 1996), and in clinical cases reported
with hepatic failure (Butterworth et al., 1995; Chetri and
Choudhuri, 2003; Hauser et al., 1994; Hazell and Butterworth,
1999; McKinney et al., 2004; Spahr et al., 2002). While in
animal models the MRI intensity has been linked to external
Mn exposure (Eriksson et al., 1992; Kim et al., 1999a;
Misselwitz et al., 1995; Newland et al., 1989a,b; Shinotoh et al.,
1995), the question as to how the change in MRI signals in
humans is associated with external exposure conditions and
whether this consequentially leads to alternations of the internal
Mn exposure indices or the fluctuation in blood chemistry
remains elusive.
Historically, biological monitoring of internal Mn exposure
has relied on determination of Mn concentrations in the whole
blood, serum or plasma. One of the perplexing problems in
clinics is that blood levels of Mn usually poorly reflect the body
burden of Mn and the ensuing disease status. There is a
discrepancy between blood Mn levels and intracellularly
distributed tissue Mn contents. For example, the terminal-phase
elimination half life (t1/2) following i.v. injection of MnCl2 in rats
is only about 2 h; such a short half life, in theory, would not result
in the accumulation of Mn in the body (Zheng et al., 2000).
However, tissue analyses suggest that the biological half life of
Mn in brain tissues is between 51 and 74 days (Newland et al.,
1987; Takeda et al., 1995). Thus, it is possible that the
intracellular binding and sequestration of Mn ions may prevent
the metal from migration to the extracellular space. As such, a
simple measurement of extracellular Mn such as in plasma or
serum may not accurately reflect Mn concentrations in the blood
compartment, including blood cells. Additionally, Mn is known
to be transported by the transferrin receptor (TfR) and/or divalent
metal transporter (DMT1) (Crossgrove and Zheng, 2004). Both
transporters have been identified in the RBC (Andrews, 1999;
Poola et al., 1990; Weiss et al., 1997). Thus, it is reasonable to
postulate that Mn in the blood compartment may tend to
accumulate in the blood cells, leaving less in the extracellular
fluid of plasma or serum. Thus, a direct analysis of Mn in the
blood cells, e.g. in red blood cells (RBC), is deemed necessary.
This study was designed to investigate the relationship
between MRI signal intensities in brains and Mn concentrations
in the RBCs among active smelting workers. Most studies prior
to this work on MRI and Mn exposure were conducted on
exposed welders (Josephs et al., 2005; Kim et al., 1999c;
Nelson et al., 1993; Ono et al., 2002). Since the welding fumes
generated during the welding process possesses at least 13
metals (Li et al., 2004), the exposure to multiple metals, notably
iron (Fe), may complicate the exposure scenario for accurate
assessment of Mn exposure. In addition, the welders’ job
assignments vary frequently between indoor and outdoor
environments and amid open or closed compartments, bringing
about the day-to-day variations in exposure conditions. Thus,
we chose smelting workers whose job assignments are more
stable and whose exposure scenario is relatively less
complicated than those of welders. For example, our
occupational air monitoring data indicate that air samples of
smelting environment contain mainly MnO (20%) and SiO2
(22%), in addition to other trace metals including Fe2O3 (4%),
CaO (4.5%), MgO (4%) and Al2O3 (5%).
Specifically, this study was aimed at evaluating (1) if there
were changes in MRI signals in Mn-exposed smelting workers,
as compared to non-exposed control subjects, (2) whether the
prevalence of the increased MRI signal intensities correlated
with external Mn exposure indices, and (3) if there was an
association between MRI signal changes and Mn concentra-
tions in the whole blood, plasma, serum or RBCs.
2. Subjects and methods
2.1. Factory and production processes
The study site chosen was a ferroalloy manufacture
company located in the central region of Guangxi Province
and not adjacent to any other metal industries. This Group
Company has more than 10,000 employees. A subordinate
smelting factory, where smelting workers were recruited and air
Mn levels monitored, was selected for its day-to-day production
of ferroalloy. The smelting workshop has more than 2000
workers working in front of smelting furnaces who have a direct
exposure to airborne Mn and about 100 workers in a power
distribution/control room, which is located within the smelting
workshop but in a separate room.
For comparative purposes, the workers in another factory
within the same ferroalloy industry group whose job functions
were not relevant to smelting, such as office or cafeteria
services, located 20 km upwind direction and in the same urban
area, was chosen as the control.
2.2. Study population
This is a cross-sectional study. A group of 18 male workers
in the ferroalloy factory were randomly selected as the exposed
group. Among them, 13 workers engaged in furnace smelting
who had direct exposure to a high level of airborne Mn were
considered as the high Mn-exposed group and 5 workers
working in the power distribution/control room with a low level
of Mn exposure were considered as the low Mn-exposed group.
The workers worked 7–8 h per day with the average employ-
ment history of 14 years (range: 5–33 years). A control group of
nine workers were then recruited, frequency-matched to the Mn
exposed group by age and years of employment, from a non-
smelting factory. The mean ages were 35.8 years (range: 25–55)
and 40.3 years (range: 27–54), respectively, for the Mn-exposed
group and controls. Both groups were also matched for
socioeconomic status (salary, education, etc.) and background
Y. Jiang et al. / NeuroToxicology 28 (2007) 126–135128
Table 1
Summary of demographic data among Mn-exposed and control workers
Parameters Control Mn exposed
Low High Combine
Number of cases 9 5 13 18
Mean age (years) (95% CI) 40.3 � 9.2 (33.3–47.4) 42.8 � 9.6 (30.8–54.8) 33.2 � 8.8 (27.9–38.4) 35.8 � 9.8
Years in employment (95% CI) 17.6 � 8.0 (12.0–27.5) 21.6 � 11.1 (7.9–35.4) 11.3 � 9.1 (5.8–16.8) 14.1 � 10.5*
Initial working age (years) (95% CI) 21.0 � 2.9 (18.9–23.2) 21.4 � 2.5 (18.3–24.5) 22.2 � 3.9 (19.9–24.6) 22.0 � 3.5
Smoking (%) 33.3 40.0 46.2 44.4
Alcohol (%) 33.3 40.0 30.1 33.3
Airborne MnO2 (mg/m3) (95% CI) 0.01 (0–0.03) 0.66* (0.36–0.96) 1.26**~ (1.05–1.48) 0.60**
MnB (mg/mL) (95% CI) 0.04 � 0.02 (0.02–0.05) 0.05 � 0.01 (0.04–0.06) 0.05 � 0.03 (0.03–0.07) 0.05 � 0.03
MnP (mg/mL) (95% CI) 0.05 � 0.03 (0.04–0.08) 0.04 � 0.01* (0.03–0.05) 0.05 � 0.02 (0.04–0.07) 0.05 � 0.02
MnRBC (mg/mL) (95% CI) 0.14 � 0.01 (0.14–0.16) 0.15 � 0.02 (0.12–0.18) 0.16 � 0.05 (0.12–0.18) 0.15 � 0.04
Data represent mean � S.D. *p < 0.05, **p < 0.01 compared with the control workers; ~p < 0.01 compared with low-exposed workers. Note. The statistical
significance among groups was further analyzed by ANCOVA (see Table 4).
environmental factors (place of residence, etc.). These and
other demographic data of the study population are summarized
in Table 1.
Subjects in both groups at the time of interview had reported
no exposure to other toxic substances, radiation therapy, or
substance abuse. There were no statistically significant
differences in smoking and alcohol consumption between
the Mn-exposed workers and the controls (Table 1).
2.3. Collection of personal data and biological samples
The standardized interviews, clinical examinations, and
MRI evaluations took place in the First Affiliated Hospital of
Guangxi Medical University. The written informed consent
forms were obtained from all subjects prior to interview and
physical examination. A scheduled interview with a ques-
tionnaire lasting approximately 60 min was conducted by
trained interviewers to obtain detailed information on occupa-
tional history, job description, socioeconomic status, lifestyle,
and family and personal medical history. The participants were
asked to fast overnight prior to the study. Blood samples were
collected in the morning of the day of examination, followed by
neurological examination on the same day. One millilitre of
venous blood was drawn from a cubital vein into a heparinized
tube as the whole blood fraction; 0.5 mL of the whole blood was
used for testing routine blood parameters as well as
measurement of trace elements. Four millilitres of venous
blood was collected into a heparinized tube and maintained at
room temperature for 30 min. The sample was then centrifuged
at 600 � g/min for 5 min to separate the red blood cell (RBC)
fraction. The supernatant was collected as the plasma fraction.
All samples were stored at�20 8C until analyses. All test tubes
used in the study were free of metal contamination, as pre-
tested by atomic absorption spectrophotometry (AAS).
2.4. MRI examination
MRI examinations were performed using a 1.5 T Signa
superconducting system (Signa Horizon LX; GE Medical
Systems; Milwaukee, WI, USA) with a quadrature coil. The
method and result interpretation have been described in detail
by Kim et al. (1999c). In general, the spin echo (SE) technique
was applied with two acquisitions in the T1-weighted sequence
and one acquisition in the T2-weighted sequence. T1-weighted
images were acquired in the axial and sagittal planes by using
the following parameters: 466/14 [repetition time (TR)/echo
time (TE) ms] two excitations, a 22 cm field-of-view, a
256 � 160 matrix, and slice thickness of 7 mm. Axial T2-
weighted (TR/TE = 4000/100 ms) images were also obtained in
the similar manner. The signal intensity of the globus pallidus
relative to that recorded from frontal white matter was
subjectively evaluated by a radiologist without prior knowledge
of the disease status of the T1-weighted images. For
quantitative evaluation of signal intensities, the region of
interest (ROI) was placed in areas with the highest intensity by
visual assessment in the globus pallidus and the subcortical
frontal white matter. The pallidal index (PI), which is defined as
the ratio of the signal intensity in the globus pallidus (SIGP) to
that in the subcortical frontal white matter (SIFW) in axial T1-
weighted MRI planes multiplied by 100, was then estimated
(Krieger et al., 1995).
2.5. Air sample collection and analysis
For evaluation of the external exposure, the locations where
workers usually worked in the smelting workshop (15 sites), the
power distribution/control room (7 sites), or the offices or
cafeteria (10 sites) were identified. Airborne manganese
concentrations were determined in the breathing zones of
workers by station air samplers. Air samples were collected
using a Model BFC-35 pump equipped with a micro-porous
filter, which has a diameter of 40 mm and the pore size of
0.8 mm. Air flow was pumped at a flow rate of 5 L/min for
4 min 1 h after smelting started. At each monitoring site,
samples were collected in duplicates every other hour and two
more times in the same day (total 5 h). The mean values of all
four duplicated samples are presented in Table 1.
The filters were digested with 5 mL of HClO4–HNO3
mixture (1:9 v/v) at 200 8C. The dry residues were dissolved in
10 mL of 1% HCl. The solutions were diluted by 20–50-fold
Y. Jiang et al. / NeuroToxicology 28 (2007) 126–135 129
prior to AAS. Air Mn concentrations in working place were
determined by a model HITACHI Z-5000 flame atomic
absorption spectrophotometer (AAS) according to a China
National Standard Operation Protocol (GB/T16018-1995) for
occupational safety surveillance.
2.6. Determination of blood chemistry and metals in
biological samples
Levels of white blood cells (WBC), red blood cells (RBC),
hemoglobin (Hgb), haematocrit (Hct), mean corpuscular
volume (MCV), mean corpuscular hemoglobin (MCH), mean
corpuscular hemoglobin concentration (MCHC), platelets
(PIT), lymphocyte percentage (LY), and lymphocyte count
(LY#) among Mn exposed workers and control subjects were
determined by using well established routine assay procedures
in the hospital or an automated COULTER LH 750 Hematology
Analyzer (Beckman, USA).
Concentrations of Mn, Zn, Cu, Fe, Ca and Mg in the whole
blood, plasma, or RBC fractions were quantified by a model JY-
70PII inductively coupled plasma-atomic emission spectro-
photometer (ICP-AES, JY70P Type II, Jobin-Yvon Company,
France). Aliquots (0.1 mL) of samples were diluted (5–20-fold)
with an appropriate volume of 0.8% Triton X-100/0.5% EDTA
in distilled, deionized water prior to ICP-AES analysis. The
standard curves were established using freshly made metal
standards on the day of analysis. The detection limit of this
method was 0.3, 5.7, 3.9, 3.3 9.9, 0.6 ng/mL for Mn, Fe, Cu, Zn,
Ca and Mg, respectively.
2.7. Statistical analyses
Records of interviews and other reports were reviewed and
abstracted for demographic data. All data are expressed as the
mean � S.D. The data were initially analyzed using ANOVA
linear contract analysis. If the ANOVA showed an overall
significance at p < 0.05, Student’s t-test was used to identify the
significant differences among subgroups. Analysis of covariance
(ANCOVA) using Years in Employment as covariate was further
employed to analyze statistical significance among groups for
parameters such as air level of MnO2 (MnA), Mn in the whole
blood (MnB), Mn in plasma (MnP), Mn in RBC (MnRBC), white
blood cell counts (WBC), mean corpuscular hemoglobin
concentration (MCHC), signal intensity in globus pallidus
(SIGP), signal intensity in frontal white matter (SIFW) and PI.
Associations between the PI and MnA, MnRBC, SIGP or SIFW
in exposed workers were analyzed by stepwise multiple
regression analysis by controlling variables including age, years
in employment, initial working age, concentration of Mn, Zn, Cu,
Fe, Ca and Mg in the whole blood, plasma and RBC, and all
routine blood parameters. Statistical software SPSS/PC+ for
Windows (V.10.0) was used in data analysis.
2.8. Materials
Chemicals were obtained from the following sources: AAS
standards of all metals from Alfa Products (Danvers, MA,
USA). All reagents were of analytical grade, HPLC grade or the
highest available pharmaceutical grade.
3. Results
3.1. Airborne Mn levels in working zones
Table 1 summarizes the demographic characteristics of the
study population. There were no significant differences
between Mn-exposed workers and controls in their age, years
in employment, initial age at employment, smoking, and
alcohol consumption.
The maximum allowable concentration (MAC) and the
threshold limit value (TLV) for airborne Mn in the work place is
0.2 mg/m3, according to the Chinese Ministry of Public Health
(TJ36-79) and the American Conference of Governmental
Industrial Hygienists. In this cross-sectional study, the
geometric mean of airborne Mn concentrations in the furnace
smelting workplace (i.e., the high exposure group) was 1.3
(range: 0.3–2.9) mg/m3. Among 15 worksites monitored, 81%
had Mn exposure levels above the MAC value. The geometric
mean of Mn concentrations in the air of the power distribution/
control room (i.e., the low exposure group) was 0.7 (range: 0.2–
0.8) mg/m3; about 86% of the seven monitored worksites had
Mn exposure levels above the MAC value. These two geometric
means of the low and high exposure groups were 3.3-fold and
6.3-fold, respectively, above the MAC. It was noticed that the
air samples in the current study were taken during a summer
season when all windows in this semi-open designed smelting
workshop were open, allowing outdoor air flow to cool down
the workshop.
3.2. Blood chemistry and Mn concentrations in the whole
blood (MnB), Plasma (MnP) and red blood cells (MnRBC)
in Mn-exposed and control workers
Of 10 parameters monitored for blood chemistry of Mn-
exposed workers, all were in the normal range as compared to
control subjects (Table 2).
Concentrations of MnB, MnP, and MnRBC in Mn-exposed
workers were not statistically significantly different from those
in controls (Table 1), although a slight increase was observed in
MnRBC of high Mn-exposed workers. It is noteworthy that
MnRBC levels in both exposed workers and controls were
about three-fold higher than the values of MnB and MnP.
Moreover, the variations of MnRBC values (S.D./
mean � 100%) were found to be between 1 and 27% of the
means, whereas the variations of MnB or MnP were between 40
and 60% of the means, suggesting that the levels of MnRBC
were less variable than the traditional MnB and MnP.
3.3. MRI analysis and correlations between the PI and
MnB, MnP, or MnRBC
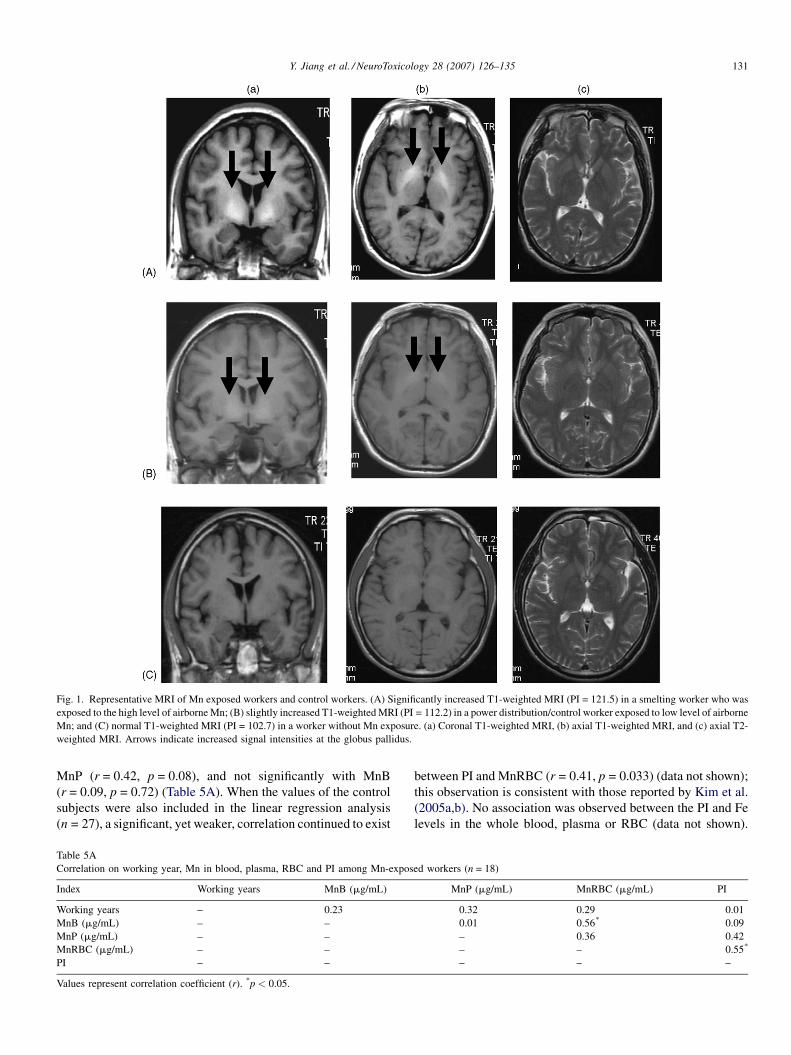
Among active smelting workers who were exposed to high
levels of airborne Mn, the T1-weighted MRI showed a distinct,
whitened signal in globus pallidus area (Fig. 1A). The enhanced

Y. Jiang et al. / NeuroToxicology 28 (2007) 126–135130
Table 2
Routine blood parameters in Mn-exposed and control workers
Parameters Control Mn exposed
Low High Combine
Case number 9 5 13 18
WBC (�109 L�1) 6.56 � 0.75 7.40 � 1.29 6.35 � 0.97* 6.64 � 1.14
RBC (�1012 L�1) 5.03 � 0.56 5.08 � 0.18 5.40 � 0.69 5.31 � 0.61
Hgb (g/L) 145 � 15.8 151 � 8.08 145 � 12.3 147 � 11.4
Hct (%) 43.6 � 3.85 45.1 � 2.40 44.4 � 3.35 44.6 � 3.06
MCV (fL) 87.5 � 10.1 88.8 � 3.74 83.0 � 8.25 84.6 � 7.64
MCH (pg) 29.1 � 3.81 29.8 � 1.16 27.1 � 3.20 27.9 � 3.01
MCHC (g/L) 332 � 9.86 335 � 2.59 326 � 7.61~ 329 � 7.66
PIT (�109 L�1) 197 � 73.2 225 � 40.8 203 � 36.9 209 � 38.1
LY (%) 34.6 � 5.85 32.4 � 3.55 36.1 � 3.80 35.0 � 4.00
LY# (�109 L�1) 2.26 � 0.34 2.40 � 0.55 2.28 � 0.25 2.31 � 0.35
Data represent mean � S.D. ~p < 0.05 compared with low-exposed workers. The statistical significance among groups for WBC and MCHC was further analyzed by
ANCOVA (see Table 4). WBC, white blood cell counts; RBC, red blood cell counts; Hgb, hemoglobin; Hct, hematocrit; MCV, mean corpuscular volume; MCH, mean
corpuscular hemoglobin; MCHC, mean corpuscular hemoglobin concentration; PIT, platelet; LY, lymphocyte percentage; LY#, lymphocyte counts.
Table 3
Pallidal index (PI) of brain T1-weighted MRI among Mn-exposed and control workers
Group n Workers with increased PI (%) SIGP (mean � S.D.) SIFW (mean � S.D.) PI (mean � S.D.)
Control 9 0 (0.0) 428.5 � 15.0 419.4 � 15.2 102.2 � 1.5
Mn-exposed 18 14 (77.8)** 529.1 � 71.0** 453.8 � 33.6 116.2 � 8.4**
Low-Mn 5 3 (60.0) 466.3 � 27.5## 425.0 � 26.7# 109.8 � 4.5*#
High-Mn 13 11 (84.6) 533.3 � 67.9** 464.9 � 29.8* 118.7 � 8.4**
<5 years 5 3 (60.0) 515.6 � 72.0 450.6 � 25.9 114.1 � 9.9
5–10 years 4 4 (100) 572.2 � 61.6 464.7 � 30.6 123.0 � 7.2
>10 years 4 4 (100) 581.3 � 61.7 483.0 � 30.5 120.1 � 5.8
Data represent mean � S.D. *p < 0.05, **p < 0.01, compared with control group; #p < 0.05, ##p < 0.01, compared with high-exposed group. Note. The statistical
significance among groups was further analyzed by ANCOVA (see Table 4). SIGP, signal intensities of globus pallidus; SIFW, signal intensities of frontal
white matter.
Table 4
Statistical significance among control, low-exposed, and high-exposed workers
for critical parameters by ANCOVA
Variables F-value (d.f.) p
MnO2 31.09 (2) 0.000**
MnB 0.361 (2) 0.701
MnRBC 0.337 (2) 0.717
MnP 3.110 (2) 0.064
WBC 1.943 (2) 0.166
MCHC 2.743 (2) 0.085
SIGP 15.78 (2) 0.000**
SIFW 9.513 (2) 0.001**
PI 15.43 (2) 0.000**
Values were analyzed by ANCOVA by controlling years of employment as
covariate. F-value, value of covariance analysis; d.f., degree of freedom; p, level
of significance. For air MnO2, SIGP, SIFW, and PI, there existed statistically
significant differences among groups.** Highly significant.
signal was also evident among low Mn-exposed workers
(Fig. 1B). The prevalence of enhanced T1-weighted MRI
signals was 60 and 85% among low and high Mn-exposed
workers, respectively, with 100% occurrence among smelting
workers who had more than 5 years of working experience
(Table 3).
The pallidal indices (PI), as calculated in reference to the
signal intensity in the subcortical frontal white matter (SIFW),
were increased by 7.4 and 16.1%, respectively, in the low and
high Mn-exposed workers as compared to control workers
( p < 0.05). Among high Mn-exposed workers with 5–10 years
of working experience, the PI values were increased by 20% as
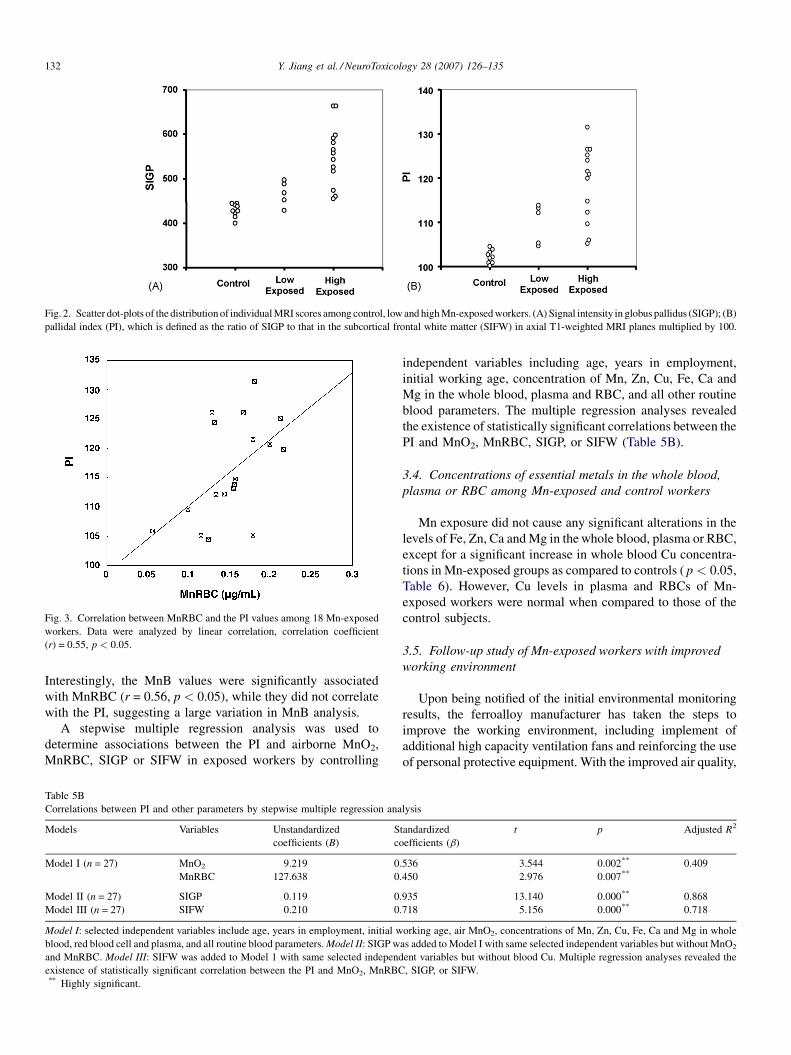
compared to that of non-exposed workers (Table 3). Scatter dot-
plots of the distribution outcomes of the PI and SIGP values
among control, low and high Mn-exposed workers are
presented in Fig. 2.
It is possible that the year of employment, which is related to
the duration of Mn exposure, may function as a confounder.
Thus, an analysis of covariance (ANCOVA) was conducted for
the following parameters: airborne MnO2, MnB, MnP and
MnRBC (in Table 1), WBC and MCHC (in Table 2), and SIGP,
SIFW and PI (in Table 3), by controlling years of employment
as a covariate. ANCOVA revealed that for airborne MnO2,
SIGP, SIFW, and PI, a statistically significant difference did
indeed existed among control, low-exposed and high-exposed
workers (Table 4).
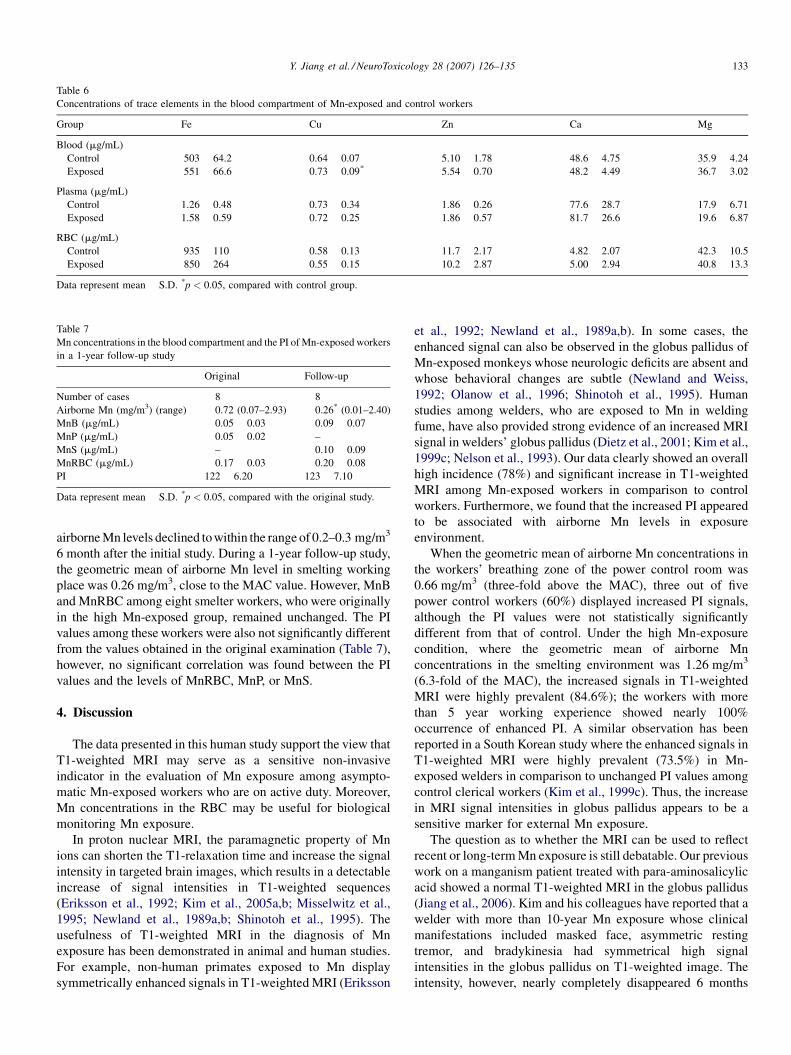
When the PI values among 18 Mn exposed workers were
correlated with MnB, MnP or MnRBC by a linear regression
analysis, the PI values were significantly associated with
MnRBC (r = 0.55, p = 0.02) (Fig. 3), less significantly with
Y. Jiang et al. / NeuroToxicology 28 (2007) 126–135 131
Fig. 1. Representative MRI of Mn exposed workers and control workers. (A) Significantly increased T1-weighted MRI (PI = 121.5) in a smelting worker who was
exposed to the high level of airborne Mn; (B) slightly increased T1-weighted MRI (PI = 112.2) in a power distribution/control worker exposed to low level of airborne
Mn; and (C) normal T1-weighted MRI (PI = 102.7) in a worker without Mn exposure. (a) Coronal T1-weighted MRI, (b) axial T1-weighted MRI, and (c) axial T2-
weighted MRI. Arrows indicate increased signal intensities at the globus pallidus.
MnP (r = 0.42, p = 0.08), and not significantly with MnB
(r = 0.09, p = 0.72) (Table 5A). When the values of the control
subjects were also included in the linear regression analysis
(n = 27), a significant, yet weaker, correlation continued to exist
Table 5A
Correlation on working year, Mn in blood, plasma, RBC and PI among Mn-expos
Index Working years MnB (mg/mL)
Working years – 0.23
MnB (mg/mL) – –
MnP (mg/mL) – –
MnRBC (mg/mL) – –
PI – –
Values represent correlation coefficient (r). *p < 0.05.
between PI and MnRBC (r = 0.41, p = 0.033) (data not shown);
this observation is consistent with those reported by Kim et al.
(2005a,b). No association was observed between the PI and Fe
levels in the whole blood, plasma or RBC (data not shown).
ed workers (n = 18)
MnP (mg/mL) MnRBC (mg/mL) PI
0.32 0.29 �0.01
�0.01 0.56* 0.09
– 0.36 0.42
– – 0.55*
– – –
Y. Jiang et al. / NeuroToxicology 28 (2007) 126–135132
Fig. 2. Scatter dot-plots of the distribution of individual MRI scores among control, low and high Mn-exposed workers. (A) Signal intensity in globus pallidus (SIGP); (B)
pallidal index (PI), which is defined as the ratio of SIGP to that in the subcortical frontal white matter (SIFW) in axial T1-weighted MRI planes multiplied by 100.
Fig. 3. Correlation between MnRBC and the PI values among 18 Mn-exposed
workers. Data were analyzed by linear correlation, correlation coefficient
(r) = 0.55, p < 0.05.
Interestingly, the MnB values were significantly associated
with MnRBC (r = 0.56, p < 0.05), while they did not correlate
with the PI, suggesting a large variation in MnB analysis.
A stepwise multiple regression analysis was used to
determine associations between the PI and airborne MnO2,
MnRBC, SIGP or SIFW in exposed workers by controlling
able 5B
orrelations between PI and other parameters by stepwise multiple regression analysis
odels Variables Unstandardized
coefficients (B)
Standardized
coefficients (b)
t p Adjusted R2
odel I (n = 27) MnO2 9.219 0.536 3.544 0.002** 0.409
MnRBC 127.638 0.450 2.976 0.007**
odel II (n = 27) SIGP 0.119 0.935 13.140 0.000** 0.868
odel III (n = 27) SIFW 0.210 0.718 5.156 0.000** 0.718
odel I: selected independent variables include age, years in employment, initial working age, air MnO2, concentrations of Mn, Zn, Cu, Fe, Ca and Mg in whole
lood, red blood cell and plasma, and all routine blood parameters. Model II: SIGP was added to Model I with same selected independent variables but without MnO2
nd MnRBC. Model III: SIFW was added to Model 1 with same selected independent variables but without blood Cu. Multiple regression analyses revealed the
xistence of statistically significant correlation between the PI and MnO2, MnRBC, SIGP, or SIFW.* Highly significant.
T
C
M
M
M
M
M
b
a
e*
independent variables including age, years in employment,
initial working age, concentration of Mn, Zn, Cu, Fe, Ca and
Mg in the whole blood, plasma and RBC, and all other routine
blood parameters. The multiple regression analyses revealed
the existence of statistically significant correlations between the
PI and MnO2, MnRBC, SIGP, or SIFW (Table 5B).
3.4. Concentrations of essential metals in the whole blood,
plasma or RBC among Mn-exposed and control workers
Mn exposure did not cause any significant alterations in the
levels of Fe, Zn, Ca and Mg in the whole blood, plasma or RBC,
except for a significant increase in whole blood Cu concentra-
tions in Mn-exposed groups as compared to controls ( p < 0.05,
Table 6). However, Cu levels in plasma and RBCs of Mn-
exposed workers were normal when compared to those of the
control subjects.
3.5. Follow-up study of Mn-exposed workers with improved
working environment
Upon being notified of the initial environmental monitoring
results, the ferroalloy manufacturer has taken the steps to
improve the working environment, including implement of
additional high capacity ventilation fans and reinforcing the use
of personal protective equipment. With the improved air quality,
Y. Jiang et al. / NeuroToxicology 28 (2007) 126–135 133
Table 6
Concentrations of trace elements in the blood compartment of Mn-exposed and control workers
Group Fe Cu Zn Ca Mg
Blood (mg/mL)
Control 503 � 64.2 0.64 � 0.07 5.10 � 1.78 48.6 � 4.75 35.9 � 4.24
Exposed 551 � 66.6 0.73 � 0.09* 5.54 � 0.70 48.2 � 4.49 36.7 � 3.02
Plasma (mg/mL)
Control 1.26 � 0.48 0.73 � 0.34 1.86 � 0.26 77.6 � 28.7 17.9 � 6.71
Exposed 1.58 � 0.59 0.72 � 0.25 1.86 � 0.57 81.7 � 26.6 19.6 � 6.87
RBC (mg/mL)
Control 935 � 110 0.58 � 0.13 11.7 � 2.17 4.82 � 2.07 42.3 � 10.5
Exposed 850 � 264 0.55 � 0.15 10.2 � 2.87 5.00 � 2.94 40.8 � 13.3
Data represent mean � S.D. *p < 0.05, compared with control group.
Table 7
Mn concentrations in the blood compartment and the PI of Mn-exposed workers
in a 1-year follow-up study
Original Follow-up
Number of cases 8 8
Airborne Mn (mg/m3) (range) 0.72 (0.07–2.93) 0.26* (0.01–2.40)
MnB (mg/mL) 0.05 � 0.03 0.09 � 0.07
MnP (mg/mL) 0.05 � 0.02 –
MnS (mg/mL) – 0.10 � 0.09
MnRBC (mg/mL) 0.17 � 0.03 0.20 � 0.08
PI 122 � 6.20 123 � 7.10
Data represent mean � S.D. *p < 0.05, compared with the original study.
airborne Mn levels declined to within the range of 0.2–0.3 mg/m3
6 month after the initial study. During a 1-year follow-up study,
the geometric mean of airborne Mn level in smelting working
place was 0.26 mg/m3, close to the MAC value. However, MnB
and MnRBC among eight smelter workers, who were originally
in the high Mn-exposed group, remained unchanged. The PI
values among these workers were also not significantly different
from the values obtained in the original examination (Table 7),
however, no significant correlation was found between the PI
values and the levels of MnRBC, MnP, or MnS.
4. Discussion
The data presented in this human study support the view that
T1-weighted MRI may serve as a sensitive non-invasive
indicator in the evaluation of Mn exposure among asympto-
matic Mn-exposed workers who are on active duty. Moreover,
Mn concentrations in the RBC may be useful for biological
monitoring Mn exposure.
In proton nuclear MRI, the paramagnetic property of Mn
ions can shorten the T1-relaxation time and increase the signal
intensity in targeted brain images, which results in a detectable
increase of signal intensities in T1-weighted sequences
(Eriksson et al., 1992; Kim et al., 2005a,b; Misselwitz et al.,
1995; Newland et al., 1989a,b; Shinotoh et al., 1995). The
usefulness of T1-weighted MRI in the diagnosis of Mn
exposure has been demonstrated in animal and human studies.
For example, non-human primates exposed to Mn display
symmetrically enhanced signals in T1-weighted MRI (Eriksson
et al., 1992; Newland et al., 1989a,b). In some cases, the
enhanced signal can also be observed in the globus pallidus of
Mn-exposed monkeys whose neurologic deficits are absent and
whose behavioral changes are subtle (Newland and Weiss,
1992; Olanow et al., 1996; Shinotoh et al., 1995). Human
studies among welders, who are exposed to Mn in welding
fume, have also provided strong evidence of an increased MRI
signal in welders’ globus pallidus (Dietz et al., 2001; Kim et al.,
1999c; Nelson et al., 1993). Our data clearly showed an overall
high incidence (78%) and significant increase in T1-weighted
MRI among Mn-exposed workers in comparison to control
workers. Furthermore, we found that the increased PI appeared
to be associated with airborne Mn levels in exposure
environment.
When the geometric mean of airborne Mn concentrations in
the workers’ breathing zone of the power control room was
0.66 mg/m3 (three-fold above the MAC), three out of five
power control workers (60%) displayed increased PI signals,
although the PI values were not statistically significantly
different from that of control. Under the high Mn-exposure
condition, where the geometric mean of airborne Mn
concentrations in the smelting environment was 1.26 mg/m3
(6.3-fold of the MAC), the increased signals in T1-weighted
MRI were highly prevalent (84.6%); the workers with more
than 5 year working experience showed nearly 100%
occurrence of enhanced PI. A similar observation has been
reported in a South Korean study where the enhanced signals in
T1-weighted MRI were highly prevalent (73.5%) in Mn-
exposed welders in comparison to unchanged PI values among
control clerical workers (Kim et al., 1999c). Thus, the increase
in MRI signal intensities in globus pallidus appears to be a
sensitive marker for external Mn exposure.
The question as to whether the MRI can be used to reflect
recent or long-term Mn exposure is still debatable. Our previous
work on a manganism patient treated with para-aminosalicylic
acid showed a normal T1-weighted MRI in the globus pallidus
(Jiang et al., 2006). Kim and his colleagues have reported that a
welder with more than 10-year Mn exposure whose clinical
manifestations included masked face, asymmetric resting
tremor, and bradykinesia had symmetrical high signal
intensities in the globus pallidus on T1-weighted image. The
intensity, however, nearly completely disappeared 6 months
Y. Jiang et al. / NeuroToxicology 28 (2007) 126–135134
after he discontinued welding practice (Kim et al., 1999c).
Similar observations among welders, either with or without
chelating drug treatment, are also reported by other investi-
gators (Arona et al., 1997; Discalzi et al., 2000; Nelson et al.,
1993). These observations support the view that T1-weighted
MRI may serve as a good indicator for recent exposure among
active workers, but it may not be sensitive for patients who have
been removed from the exposure scene. Our 1-year follow-up
study revealed that the geometric mean of airborne Mn level in
a smelting working environment had been significantly reduced
nearly to the MAC level for about 6 months; however, the PI
values among these exposed workers did not decline during the
follow-up study. Notably, the workers in this study were not
removed from their jobs and their blood and RBC concentra-
tions of Mn were also unchanged. Thus, the possibility for
sporadic exposure to low levels of Mn among these smelting
workers cannot be excluded.
It should be noted also that none of the workers in the current
study displayed any clinical signs and symptoms of Mn
intoxication typically seen among manganism patients,
although they did have the elevated PI values. The enhanced
T1-weighted MRI signals have been observed in patients
receiving total parenteral nutrition, presumably owing to
excessive Mn intake (Mirowitz et al., 1991; Mirowitz and
Westrich, 1992), and in patients with liver failure because of
their inability to eliminate Mn (Krieger et al., 1995).
Appreciably, these patients usually do not have permanent
neurological damage. Taken together, these findings support the
view that T1-weighted image among active workers is a
reasonable indicator for Mn exposure before signs and
symptoms appear in clinics, but not necessarily for severe
cases of manganism.
Determination of Mn concentrations in the whole blood,
plasma, or serum has been used in our previous clinical and
experimental animal studies (Li et al., 2004; Lu et al., 2005;
Zheng et al., 1999). Since Mn is primarily intracellularly
distributed (Crossgrove and Zheng, 2004), it was reasonable to
hypothesize that Mn in the blood compartment may accumulate
in the blood cells, and a direct assay of Mn in the RBC fraction
may serve as a better indicator for Mn concentrations in the
blood circulation. Our current results revealed a slight increase
in MnRBC in Mn exposed workers as compared to controls,
although this difference did not reach any statistical sig-
nificance due to the small sample size. However, when the brain
MRI signal was plotted against MnRBC among smelting
workers, the PI value was significantly associated with
MnRBC, suggesting the existence of a relationship between
Mn in brain tissue and Mn in RBC. Thus, further studies to
explore the RBC as a useful matrix for monitoring Mn exposure
are deemed necessary.
Upon entering the body, Mn may interfere with the
metabolism of trace elements and alter their homeostasis,
particularly those of Fe and Cu (Li et al., 2004; Nikolova, 1993;
Zhang et al., 2001). The results from the current study did not
reveal any substantial changes in four essential elements
examined, i.e., Fe, Zn, Ca, and Mg. However, the Cu level in the
whole blood of Mn-exposed group was significantly higher than
that of the control group. It remains unclear whether this is
secondary to Mn exposure or simply due to co-exposure to
airborne Cu in the smelting environment. It is also unclear what
is the clinical significance of elevated Cu level among smelting
workers. Nonetheless, the subject on Cu homeostasis among
smelting workers should be of interest for future investigation.
In summary, the present study demonstrates that the
smelting workers with Mn exposure but without clinical
symptoms of Mn intoxication display intensified MRI signals in
the globus pallidus region. The increased PI values appear to be
associated with the degree of environmental Mn exposure.
Moreover, the PI values among Mn-exposed workers is
correlates with Mn concentrations in red blood cells. Future
research should be directed toward understanding the uses of
MRI and MnRBC for early diagnosis of Mn exposure.
Acknowledgments
This study was partly supported by National Science
Foundation of China Grant #30070663 (YMJ), Guangxi
Science and Technology Commission Grant #0443004-42
(YMJ), U.S. NIH/National Institute of Environmental Health
Sciences Grant #ES-08164 (WZ), and U.S. Department of
Defense Contract #USAMRMC W81XWH-05-1-0239 (WZ).
References
Alves G, Thiebot J, Tracqui A, Delangre T, Guedon C, Lerebours E. Neurologic
disorders due to brain manganese deposition in a jaundiced patient receiving
long-term parenteral nutrition. J Parenter Enteral Nutr 1997;21:41–5.
Andrews NC. The iron transporter DMT1. Int J Biochem Cell Biol 1999;31:
991–4.
Arona A, Mata M, Bonet M. Diagnosis of chronic manganese intoxication by
magnetic resonance imaging. New Engl J Med 1997;336:964–5.
Aschner M, Vrana KE, Zheng W. Manganese uptake and distribution in the
central nervous system (CNS). Neurotoxicology 1999;20:173–80.
Butterworth RF, Spahr L, Fontaine S, Layrargues GP. Manganese toxicity,
dopaminergic dysfunction and hepatic encephalopathy. Metab Brain Dis
1995;10:259–67.
Chetri K, Choudhuri G. Role of trace elements in hepatic encephalopathy: zinc
and manganese. Indian J Gastroenterol 2003;22(Suppl 2):S28–30.
Crossgrove J, Zheng W. Manganese toxicity upon overexposure. NMR Biomed
2004;17:544–53.
Dietz MC, Ihrig A, Wrazidlo W, Bader M, Jansen O, Triebig G. Results of
magnetic resonance imaging in long-term manganese dioxide-exposed
workers. Environ Res 2001;85:37–40.
Discalzi G, Pira E, Herrero Hernandez E, Valentini C, Turbiglio N, Meliga F.
Occupational Mn parkinsonism: magnetic resonance imaging and
clinical patterns following CaNa2EDTA chelation. Neurotoxicology
2000;21:863–6.
Ejima A, Imamura T, Nakamura S, Saito H, Matsumoto K, Momono S.
Manganese intoxication during total parenteral nutrition. Lancet 1992;
339:426.
Eriksson H, Tedroff J, Thuomas KA, Aquilonius SM, Hartvig P, Fasth KJ, et al.
Manganese induced brain lesions in Macaca fascicularis as revealed by
positron emission tomography and magnetic resonance imaging. Arch
Toxicol 1992;66:403–7.
Fell JM, Reynolds AP, Meadows N, Khan K, Long SG, Quaghebeur G, et al.
Manganese toxicity in children receiving long-term parenteral nutrition.
Lancet 1996;347:1218–21.
Fredstrom S, Rogosheske J, Gupta P, Burns LJ. Extrapyramidal symptoms in a
BMT recipient with hyperintense basal ganglia and elevated manganese.
Bone Marrow Transplant 1995;15:989–92.

Y. Jiang et al. / NeuroToxicology 28 (2007) 126–135 135
Hazell AS, Butterworth RF. Hepatic encephalopathy: an update of pathophy-
siologic mechanisms. Proc Soc Exp Biol Med 1999;222:99–112.
Hauser RA, Zesiewicz TA, Rosemurgy AS, Martinez C, Olanow CW. Man-
ganese intoxication and chronic liver failure. Ann Neurol 1994;36:871–5.
Huang CC, Chu NS, Lu CS, Chen RS, Calne DB. Long-term progression in
chronic manganism. Neurology 1998;50:698–700.
Husain M, Khanna VK, Roy A, Tandon R, Pradeep S, Set PK. Platelet dopamine
receptors and oxidative stress parameters as markers of manganese toxicity.
Hum Exp Toxicol 2001;20:631–6.
Iwase K, Kondoh H, Higaki J, Tanaka Y, Yoshikawa M, Hori S, et al.
Hyperintense basal ganglia on T1-weighted magnetic resonance images
following postoperative parenteral nutrition in a pancreatoduodenectomized
patient. Dig Surg 2000;17:190–3.
Jiang YM, Mo XA, Du FQ, Fu X, Zhu XY, Gao HY, et al. Effective treatment of
manganese-induced occupational parkinsonism with PAS-Na: a case of 17-
year follow-up study. J Occup Environ Med 2006;48:644–9.
Josephs KA, Ahlskog JE, Klos KJ, Kumar N, Fealey RD, Trenerry MR, et al.
Neurological manifestations in welders with pallidal MRI T1 hyperintensity.
Neurology 2005;64:2033–9.
Kim SH, Chang KH, Chi JG, Cheong HK, Kim JY, Kim YM, et al. Sequential
change of MR signal intensity of the brain after manganese administration
in rabbits. Correlation with manganese concentration and histopathologic
findings. Invest Radiol 1999a;34:383–93.
Kim Y, Kim J, Ito K, Lim HS, Cheong HK, Kim JY, et al. Idiopathic
parkinsonism with superimposed manganese exposure: utility of positron
emission tomography. Neurotoxicology 1999b;20:249–52.
Kim Y, Kim KS, Yang JS, Shin YC, Park IJ, Kim E, et al. Increase in signal
intensities on T1-weighted magnetic resonance images in asymptomatic
manganese-exposed workers. Neurotoxicology 1999c;20:901–7.
Kim Y. High signal intensities on T1-weighted MRI as a biomarker of exposed
to manganese. Ind Health 2004;42:111–5.
Kim E, Kim Y, Cheong HK, Cho S, Shin YC, Sakong J, et al. Pallidal index on
MRI as a target organ dose of manganese: structural equation model
analysis. Neurotoxicology 2005a;26:351–9.
Kim Y, Park JK, Choi YH, Yoo CY, Lee CR, Lee H, et al. Blood manganese
concentration is elevated in iron deficiency anemia patients, whereas globus
pallidus signal intensity is minimally affected. Neurotoxicology 2005b;26:
107–11.
Komaki H, Maisawa S, Sugai K, Kobayashi Y, Hashimoto T. Tremor and
seizures associated with chronic manganese intoxication. Brain Dev
1999;21:122–4.
Krieger D, Krieger S, Jansen O, Gass P, Theilmann L, Lichtnecker H. Manganese
and chronic hepatic encephalopathy. Lancet 1995;346(8970):270–4.
Li GJ, Zhang L, Lu L, Wu P, Zheng W. Occupational exposure to welding fume
among welders: alterations of manganese, iron, zinc, copper, and lead in
body fluids and the oxidative stress status. J Occup Environ Med 2004;46:
241–8.
Lu L, Zhang LL, Li GJ, Guo W, Liang W, Zheng W. Serum concentrations of
manganese and iron as the potential biomarkers for manganese exposure in
welders. Neurotoxicology 2005;26:257–65.
Lucchini R, Apostoli P, Perrone C, Placidi D, Albini E, Migliorati P, et al. Long-
term exposure to ‘‘low levels’’ of manganese oxides and neurofunctional
changes in ferroalloy workers. Neurotoxicology 1999;20:287–97.
Lucchini R, Albini E, Placidi D, Gasparotti R, Pigozzi MG, Montani G, et al.
Brain magnetic resonance imaging and manganese exposure. Neurotox-
icology 2000;21:769–75.
McKinney AM, Filice RW, Teksam M, Casey S, Truwit C, Clark HB, et al.
Diffusion abnormalities of the globi pallidi in manganese neurotoxicity.
Neuroradiology 2004;46:291–5.
Mirowitz SA, Westrich TJ. Basal ganglial signal intensity alterations: reversal
after discontinuation of parenteral manganese administration. Radiology
1992;185:535–6.
Mirowitz SA, Westrich TJ, Hirsch JD. Hyperintense basal ganglia on T1-
weighted MR images in patients receiving parenteral nutrition. Radiology
1991;181:117–20.
Misselwitz B, Muhler A, Weinmann HJ. A toxicologic risk for using manganese
complexes? A literature survey of existing data through several medical
specialties Invest Radiol 1995;30:611–20.
Nagatomo S, Umehara F, Hanada K, Nobuhara Y, Takenaga S, Arimura K, et al.
Manganese intoxication during total parenteral nutrition: report of two cases
and review of the literature. J Neurol Sci 1999;162:102–5.
Nelson K, Golnick J, Korn T, Angle C. Manganese encephalopathy: utility of
early magnetic resonance imaging. Br J Ind Med 1993;50:510–3.
Newland MC, Weiss B. Persistent effects of manganese on effortful responding
and their relationship to manganese accumulation in the primate globus
pallidus. Toxicol Appl Pharmacol 1992;113:87–97.
Newland MC, Cox C, Hamada R, Oberdorster G, Weiss B. The clearance of
manganese chloride in the primate. Fundam Appl Toxicol 1987;9:314–28.
Newland MC, Ceckler TL, Kordower JH, Weiss B. Visualizing manganese in
primate basal ganglia with magnetic resonance imaging. Exp Neurol
1989a;106:251–8.
Newland MC, Ceckler TL, Kordower JH, Weiss B. Visualizing manganese in
the primate basal ganglia with magnetic resonance imaging. Exp Neurol
1989b;106:251–8.
Nikolova P. Effect of manganese on essential trace element metabolism tissue
concentrations and excretion of manganese, iron, copper, cobalt and zinc.
Trace Elements Med 1993;10:141–7.
Olanow CW, Good PF, Shinotoh H, Hewitt KA, Vingerhoets F, Snow BJ, et al.
Manganese intoxication in the rhesus monkey: a clinical, imaging, patho-
logic, and biochemical study. Neurology 1996;46:492–8.
Ono K, Komai K, Yamada M. Myoclonic involuntary movement associated
with chronic manganese poisoning. J Neurol Sci 2002;93–6.
Poola I, Mason AB, Lucas JJ. The chicken oviduct and embryonic red blood cell
transferrin receptors are distinct molecules. Biochem Biophys Res Commun
1990;171:26–32.
Quaghebeur G, Taylor WJ, Kingsley DP, Fell JM, Reynolds AP, Milla PJ. MRI in
children receiving total parenteral nutrition. Neuroradiology 1996;38:680–3.
Shinotoh H, Snow BJ, Hewitt KA, Pate BD, Doudet D, Nugent R, et al. MRI
and PET studies of manganese-intoxicated monkeys. Neurology 1995;45:
1199–204.
Spahr L, Burkhard PR, Grotzsch H, Hadengue A. Clinical significance of basal
ganglia alterations at brain MRI and 1H MRS in cirrhosis and role in the
pathogenesis of hepatic encephalopathy. Metab Brain Dis 2002;17:399–413.
Takeda A, Sawashita J, Okada S. Biological half-lives of zinc and manganese in
rat brain. Brain Res 1995;695:53–8.
Weiss G, Houston T, Kastner S, Johrer K, Grunewald K, Brock JH. Regulation
of cellular iron metabolism by erythropoietin: activation of iron-regulatory
protein and upregulation of transferrin receptor expression in erythroid
cells. Blood 1997;89:680–7.
Zhang LL, Wu P, Lu L, Li GJ, Guo WR, Zheng W, et al. Alteration of 5 essential
trace elements in serum of welder exposed to manganese. China Public
Health 2001;17:783–4.
Zheng W, Zhao Q, Slavkovich V, Aschner M, Graziano H. Alteration of iron
homeostasis following chronic exposure to manganese in rats. Brain Res
1999;833:125–32.
Zheng W, Kim H, Zhao Q. Comparative toxicokinetics of manganese chloride
and methylcyclo-pentadienyl Mn tricarbonyl in male Sprague–Dawley rats.
Toxicol Sci 2000;54:295–301.