Brain drain in globalization A general equilibrium...
45
Brain drain in globalization A general equilibrium analysis from the sending countries’ perspective Luca Marchiori a,b , I-Ling Shen *,a,c,e , Fr´ ed´ eric Docquier a,d,e a IRES and Department of Economics, Catholic University of Louvain, Belgium b Faculty of Law, Economics and Finance, University of Luxembourg, Luxembourg c Department of Econometrics, University of Geneva, Switzerland d Belgian National Fund of Scientific Research, Belgium e Institute for the Study of Labor (IZA), Germany Abstract The paper assesses the global effects of brain drain on developing economies and quantifies the relative sizes of various static and dynamic impacts. By constructing a unified generic framework characterized by overlapping- generations dynamics, this study incorporates many direct impacts of brain drain whose interactions, along with other indirect effects, are endogenously and dynamically generated. Our findings suggest that the short-run impact of brain drain on resident human capital is extremely crucial, as it does not only determines the number of skilled workers available to domestic pro- duction, but it also affects the sending economy’s capacity to innovate or to adopt modern technologies. The latter impact plays an important role particularly in a globalized economy where capital investments are made in places with higher production efficiencies. Hence, despite several empirically documented positive feedback effects, those countries with high skilled emi- gration rates are the most candid victims to brain drain since they are least likely to benefit from the “brain gain” effect, and thus suffering from declines of their resident human capital. JEL Classifications: F22, J24, O15 Keywords: Brain Drain, Capital Flow, Development, Human Capital, Remittances * Corresponding author. Tel: +41 22 379 9594. Fax: +41 22 379 8299. Email address: [email protected] (I-Ling Shen) Preliminary draft. Please do not quote without permission. May 27, 2009
Transcript of Brain drain in globalization A general equilibrium...
Brain drain in globalization
A general equilibrium analysis
from the sending countries’ perspective
Luca Marchioria,b, I-Ling Shen∗,a,c,e, Frederic Docquiera,d,e
aIRES and Department of Economics, Catholic University of Louvain, BelgiumbFaculty of Law, Economics and Finance, University of Luxembourg, Luxembourg
cDepartment of Econometrics, University of Geneva, SwitzerlanddBelgian National Fund of Scientific Research, Belgium
eInstitute for the Study of Labor (IZA), Germany
Abstract
The paper assesses the global effects of brain drain on developing economiesand quantifies the relative sizes of various static and dynamic impacts.By constructing a unified generic framework characterized by overlapping-generations dynamics, this study incorporates many direct impacts of braindrain whose interactions, along with other indirect effects, are endogenouslyand dynamically generated. Our findings suggest that the short-run impactof brain drain on resident human capital is extremely crucial, as it does notonly determines the number of skilled workers available to domestic pro-duction, but it also affects the sending economy’s capacity to innovate orto adopt modern technologies. The latter impact plays an important roleparticularly in a globalized economy where capital investments are made inplaces with higher production efficiencies. Hence, despite several empiricallydocumented positive feedback effects, those countries with high skilled emi-gration rates are the most candid victims to brain drain since they are leastlikely to benefit from the “brain gain” effect, and thus suffering from declinesof their resident human capital.
JEL Classifications: F22, J24, O15Keywords: Brain Drain, Capital Flow, Development, Human Capital,Remittances
∗Corresponding author. Tel: +41 22 379 9594. Fax: +41 22 379 8299.Email address: [email protected] (I-Ling Shen)
Preliminary draft. Please do not quote without permission. May 27, 2009
1. Introduction
Is brain drain a curse or a boon for the sending countries? In the sur-vey by Commander et al. (2004), while different forces at work are discussedand several possible positive and negative effects of skilled emigration arereviewed, they conclude by suggesting that “much more research is neededto pin down the relevant magnitudes.” In order to study the global effectsof brain drain on developing economies and to quantify the relative sizesof various static and dynamic impacts, a generic framework is certainly re-quired, which is capable of incorporating the main mechanisms identified inthe existing literature.
With this aim, we develop a ten-region general equilibrium model charac-terized by the overlapping-generations (OLG) dynamics and calibrated withreal data. We assess the impacts of skill outflow using three economic indi-cators: Gross Domestic Product (GDP) per capita, Gross National Income(GNI) per capita, and the skilled-to-less-skilled income inequality. In sucha framework, not only can we juxtapose the direct impacts of brain drain,but their interactions and other indirect effects are also endogenously anddynamically generated. This is a very important step forward, as skilled em-igration is not an isolated incident, but it ripples through the entire globaleconomic system. Therefore, the open economy setting utilized in this studyallows us to gauge the impacts of brain drain in the most relevant contextof globalization, where international flows of factors and outputs have influ-ences upon each other. Moreover, the OLG framework allows us to take intoaccount the impacts of brain drain through the age structure, and it alsoallows for dynamic effects via asset accumulation.1
In the process of economic globalization, international movement of pro-duction factors is an essential component that stimulates further integrationof the world economy. On the one hand, financial liberalization and thepractice of international arbitrage contribute to large cross-border flows ofcapital. While the amount of Foreign Direct Investment (FDI) at the world
1Docquier and Rapoport (2009) studies the overall costs and benefits of brain drain onthe per country basis. However, in their partial equilibrium setting where all effects occuron the production parameters except for labor endowment, all direct impacts of brain drainare simulated outside the production equation. Hence, their study incorporates neitherthe changes in international capital flows, nor the impacts on the demographic structureand the amounts of consumption/savings.
2
level has increased from 13,346 millions in 1970 to 1,833,324 millions in 2007(measured in US$ at current prices), the rise in FDI per capita is far moreremarkable in the developed economies alias “North”, than in the developingeconomies alias “South” (see Figure 1). This North-South disparity reflectslargely the wide gaps in terms of total factor productivity, and not insignifi-cantly, the higher risks involved in investing in many developing countries.2
Similarly, international wage gaps are the most important pull factor thatlures economic migrants from the developing to the developed economies(Clemens and Pritchett, 2008; Grogger and Hanson, 2008). The immigrationrate in high-income countries has tripled since 1960 and doubled since 1985.Moreover, Docquier et al. (2009) document that, in OECD countries, twothirds of the increase in immigration stocks during the 1990s are accountedfor by the South-to-North movement. When skill heterogeneity is taken intoaccount, it is found that the number of highly educated immigrants hasincreased by 70 percent, whereas the corresponding figure for immigrantswith lower educational attainments is a dwarfed 30 percent. Although thisdifference does not necessarily imply an increasing trend of brain drain,3
stylized facts show that there does exist strong positive selection of emigrants,especially in the lower income countries (see Figure 2). In many developingcountries, brain drain rates are well above 40 percent, particularly for sub-Saharan African countries, Central American countries, and small states.4
This positive selection may originate from either self-selection into em-igration or from the destination country’s immigration policy. As shownby Grogger and Hanson (2008), the larger international wage differences forskilled than for less-skilled workers are consistent with positive self-selection.Moreover, in poorer countries, this pattern can be further reinforced whencredit constraints are binding and less-skilled potential migrants cannot af-ford migration costs (Chiquiar and Hanson, 2005). On the other hand, ad-mission criterion adopted by major labor-receiving countries have grown pro-
2See, for example, the Country Risk Classification produced by the Organisation forEconomic Co-operation and Development (OECD).
3In fact, Defoort (2008) demonstrates that brain drain rates, measured as the emigra-tion rates of the skilled natives, were relatively stable over time. This may be due tothe general rise in educational attainments in developing countries; thus, increases in thenumber of skilled emigrants are accompanied by a more educated population at origin.
4The skilled emigration rate exceeds 70 percent in a dozen countries.
3
gressively skilled-biased.5 This raises the probability to migrate for highly-educated young workers, while restrictions imposed on immigration of theless-skilled are generally not relaxed, if not increased. Despite that trade bar-riers have been greatly reduced and capital markets liberalized, the nationalbarriers to immigration remain substantial; consequently, notwithstandingthe rise in immigration rates, people flows in globalization are much lessin extent when compared to other international flows of factors and goods(Freeman, 2006).
Although the debate over open/close border to immigration have so farremained mainly in the political and philosophical domains,6 the economicliterature of brain drain has already gained major attention back in the1970s. This can be attributed to the pioneering works of Bhagwati (1972,1976a,b), where the well-known “Bhagwati Tax” was proposed and aimedto compensate for the loss incurred by skill outflow in the developing coun-tries. However, in Bhagwati and Hamada (1974, 1975), this loss is predictedin a partial equilibrium framework characterized by wage rigidity, unem-ployment, and fiscal costs, with brain drain worsening wage distortions andaccentuating fiscal externality, yet generating few potentially counteractingeffects. Moreover, as skilled labor serves as a pivotal engine of growth, mod-ern theories of brain drain based on endogenous growth models also predictpessimistic outcomes, due to externalities related to human capital forma-tion (Miyagiwa, 1991; Haque and Kim, 1995; Wong and Yip, 1999). Ontop of these theoretical adverse effects, emigration in general implies loss ofworking-age population in the sending countries. This may pose as a seriousthreat to those developing economies with high emigration rates as well asa substantial degree of population aging, most notably the Eastern Europecountries.7
5Put aside the traditional emphasis on family reunion, immigration policy-setting hasgrown more skilled-biased in the major immigrant receiving countries. In 1967, Canadaadopts the point system that favors highly educated and highly skilled young individuals.Australia followed suit in 1989, then New Zealand in 1991. In 2006, a detailed plan waspresented in the British Parliament on how to implement a points-based immigrationsystem. In the United States, the immigration reform bill of 2007, although failed, alsoincludes a similarly merit-based system. In the same year, the European Commissionannounced her ”Blue Card” scheme in the hope of luring more skilled migrants.
6There are some economic studies discussing the issue of migration barriers and theirwelfare costs, see for example, Freeman (2006) and Clemens and Pritchett (2008).
7In less developed regions, the average share of population aged 65 or over is expected
4
Recent developments in the migration literature, however, have identifieda series of positive feedback effects. Starting from Stark et al. (1997, 1998),it is demonstrated that increased migration prospects for the skilled couldstimulate more human capital formation, thanks to higher expected returnsto education; thus, in countries with low skilled-emigration rates, their ex-post human capital stocks increase as a result.8 Furthermore, diaspora atthe destination countries may reduce information-related investment risksand is shown to spur FDI at the origin countries (Kugler and Rapoport,2007; Docquier and Lodigiani, 2009). Through immigrants’ ties with theirhome countries, diaspora may also lower transaction costs, and empirical ev-idence suggests that it encourages bilateral trade flows (Gould, 1994; Headand Ries, 1998). While the aforementioned network externalities are not spe-cific to more educated migrants, skilled diaspora nevertheless plays a uniquerole in promoting international technology diffusion, which raises the totalfactor productivity in immigrants’ home countries (Kerr, 2008; Lodigiani,2008).9 Arguably, the list of potentially positive effects of diaspora mayalso include transferring of norms, which could alter fertility behavior (Beineet al., 2008b) or bring about institutional reforms (Spilimbergo, 2009),10 andthus indirectly enhancing economic development at the origin.
From the above, it is apparent that international flows of factors andgoods/services are not independent of one another, as already demonstrated
to rise from 5.0 % in 2000 to 14.6 % in 2050; however, when Eastern Europe is consideredalone, the rise goes from 12.9 % in 2000 to 25.4 % in 2050 (see the United Nations’ (U.N.)World Population Prospects: The 2008 Revision).
8See Mountford (1997), Vidal (1998), Stark and Wang (2002), Stark (2004), and theempirical evidence in Beine et al. (2001, 2008a).
9Kerr (2008) finds that, how technology diffusion spurs output growth differs withthe home country’s development level. In less developed countries, this positive effectis more likely to transmit through the reallocation of labor from the agricultural to themanufacturing sector. However, this paper does not distinguish different sectors due to thealready complex setting of our dynamic model. For the same reason, we do not take intoaccount another possible complementary link between skilled emigration and FDI inflowsput forward by Ivlevs and de Melo (2008). They suggest that, when the non-trading sectoris more skill intensive than the production of traded goods, brain drain raises the price ofnon-traded goods and leads to capital inflow to this very sector.
10Notice that Spilimbergo (2009) does not exactly study the diaspora effect on institu-tional reforms. Alternatively but relatedly, he studies whether foreign educated individualsplay a role in promoting democracy in their home country, and he finds a positive impactif foreign education is acquired in democratic countries.
5
in the traditional trade theory. However, their inter-dependencies are notunambiguous. For example, static trade models predict that, a change infactor endowment differential, due to an exogenous reallocation of labor tothe North from the South, must raise returns to capital at the destinationand induce capital outflow from the origin. In the meantime, the aforemen-tioned evidence on network externalities indicate that emigration and FDI in-flows may well act as complements, especially from a dynamic perspective;11
moreover, technology diffusion can also augment the marginal productivityof capital in the South and attract more capital investments. Last but notthe least, the officially recorded amount of remittances has been increasingat a fast rate,12 suggesting yet another complementary and important linkbetween labor emigration and capital inflows (Walmsley and Winters, 2005),and it further promotes economic growth in the relatively capital-scarce de-veloping countries, particularly those with less developed financial systems(Giuliano and Ruiz-Arranz, 2008).
In order to assess the global effects of South-to-North brain drain on thesending economies, this paper utilizes a calibrated OLG model, which dividesthe world into three developed and seven developing regions. In each decadefrom 2010-20 to 2050-60, we increase by 20 percent the forecast flow of skilledmigrants from every developing region to each developed region. Increases inskilled immigration in the North may be owed to either an enlarging inter-national gap of skilled wage, or to an increasingly skilled-biased immigrationpolicy in response to aging, occupational shortage, and so forth. However, inorder to maintain tractability in the already complex setting, these decennial20-percent increases are treated as exogenous shocks. Moreover, whereas ourgeneric framework is capable of incorporating many of the potential effects ofbrain drain reported in the exisitng literature, some of them are not includeddue to compatibility issues (e.g., increasing bilateral trade flows, transferringof norms, etc.).
11For instance, Kugler and Rapoport (2007) observes dynamic complementarity butcontemporaneous substitutability between emigration and FDI inflows. While the for-mer suggests the existence of network externalities, the latter is consistent with factorreallocation in the trade models.
12In 2005, the officially recorded amount of remittances to developing countries exceededtotal development aid and equalized total FDI. It continued to grow at a double-digit rateduring 2005-2007, but slowed down in 2008, likely due to the global financial crisis (seethe World Bank’s Global Economic Prospects 2009).
6
Despite the constraints, the greatest advantage of our unified genericframework is that it allows for the interactions between different forces atwork. This is especially important in a globalized economy, where interna-tional flows of people are often accompanied by international flows of otherfactors, as mentioned above. In the simulations, it is observed that the de-mographic shock of additional brain drain generates multiple positive andnegative impacts through four channels. First, demographic changes in theage structure result in less working-age population to support the retirees.Second, the incentive effect on human capital formation contribute to “braingain” in regions where skilled emigration is less prevalent. Third, technologi-cal progress is accelerated in technologically less-advanced regions, where theskilled diaspora plays an important role in facilitating technology diffusion;on the other hand, however, the loss of skilled human capital also breedsdynamic impacts that slow down the catching-up of technology. Forth, anenlarged diaspora helps to reduce information-related investment risks atorigin, and thus attracting more FDI inflows.
Our findings suggest that the winners and losers of brain drain can be dis-tinguished by the short-run impacts on their resident human capital, whichin turn affects technological progress via a regions’ capacity to innovate orto adopt modern technologies. Therefore, the loser regions are characterizedby high skilled emigration rates, which make them less likely to benefit fromthe “brain gain” effect, and/or by relatively more advanced technology level,with which technology diffusion generates less benefits. Most importantly, itis found the impacts working through the technology mechanism generatesa large impact greatly due to international capital mobility, as productiontechnology defines its efficiency, which is one of the most important deter-minants of returns to physical capital. In other words, the benefits and theharms of brain drain can be amplified when it takes place in globalization.
The rest of the paper is organized as follows. Section 2 presents the cali-brated OLG model and describes the calibration methods. In Section 3, thesimulated results are summarized and followed by a detailed analysis, wherethe dominant channels are identified through which brain drain impacts thedeveloping economies, and the conditions are explained under which eachchannel generates positive or negative impacts. Finally, Section 4 concludes.
7
2. Model
We introduce international migration with skill heterogeneity into a gen-eral equilibrium model with overlapping generations of individuals. Themodel economy is composed of ten regions, similarly to the INGENUE modelbuilt by Aglietta et al. (2005).13 We distinguish three developed regions, orthe North, which includes
• North America (NAM),
• Japan (JAP), and
• other high-income advanced countries (ADV).
Seven developing regions, or the South, are grouped as follows:
• Eastern Europe (EAS),
• Middle East and Northern Africa (MEN),
• Latin America and the Caribbean (LAC),
• Sub-Saharan Africa (SSA),
• the Former Soviet Union (RUS),
• the Chinese world (CHI), and
• the Indian world and Pacific Islands (IND).
Table 1 provides a glimpse at the regional characteristics of the South in2000, which includes a region’s demographic share of the population aged 25or over among all developing regions (Demog), then for each region itself,the proportion of skilled in the resident population (Skill),14 the average em-igration rate towards the OECD countries (Aemig), the skilled emigrationrate (Semig), the less-skilled emigration rate (Lemig), and the ratio of remit-tances to GDP (Rem/Y).15 Each region exhibits a strong pattern of positive
13The detailed list of countries by region can be found in Table A.1.14Due to data availability, the skilled is defined as those with post-secondary degrees.15Regarding remittances, the amounts presented in Table 1 are taken from the IMF
database and are usually seen as underestimating the reality since many transfers arechanneled through the informal sector. It is a priori difficult to estimate the region-specific bias. Thus, we will only consider the official IMF numbers in our analysis.
8
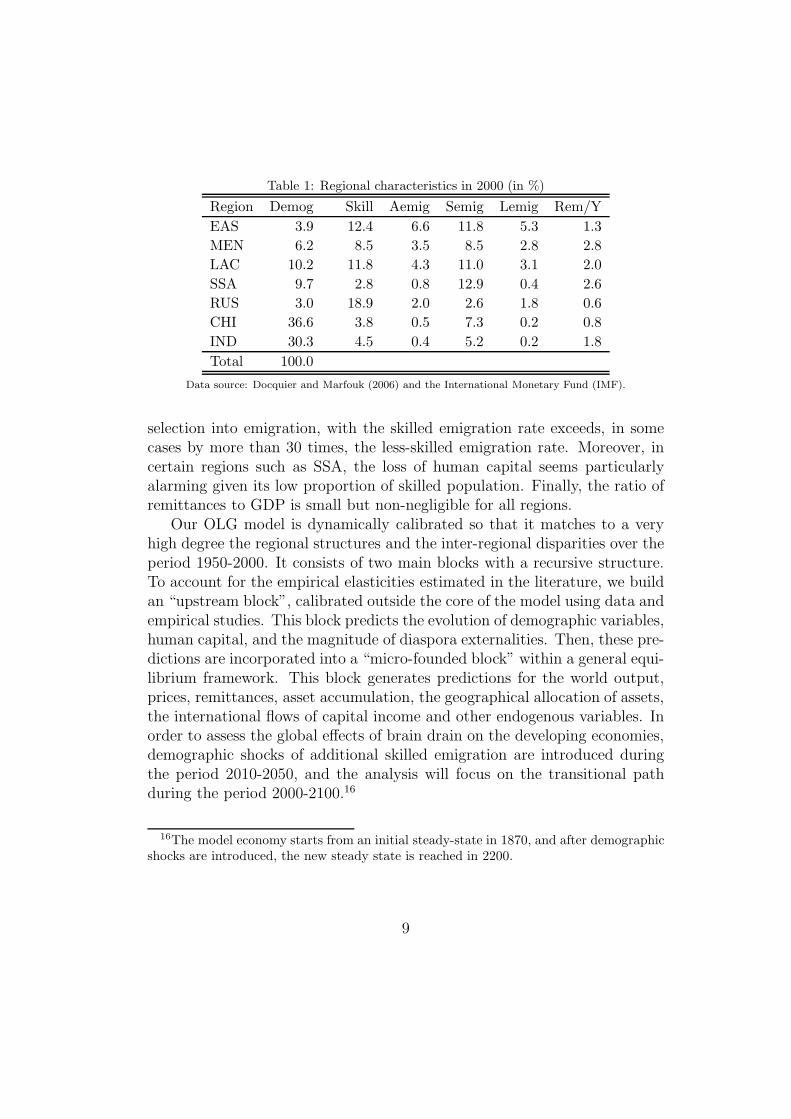
Table 1: Regional characteristics in 2000 (in %)
Region Demog Skill Aemig Semig Lemig Rem/Y
EAS 3.9 12.4 6.6 11.8 5.3 1.3
MEN 6.2 8.5 3.5 8.5 2.8 2.8
LAC 10.2 11.8 4.3 11.0 3.1 2.0
SSA 9.7 2.8 0.8 12.9 0.4 2.6
RUS 3.0 18.9 2.0 2.6 1.8 0.6
CHI 36.6 3.8 0.5 7.3 0.2 0.8
IND 30.3 4.5 0.4 5.2 0.2 1.8
Total 100.0
Data source: Docquier and Marfouk (2006) and the International Monetary Fund (IMF).
selection into emigration, with the skilled emigration rate exceeds, in somecases by more than 30 times, the less-skilled emigration rate. Moreover, incertain regions such as SSA, the loss of human capital seems particularlyalarming given its low proportion of skilled population. Finally, the ratio ofremittances to GDP is small but non-negligible for all regions.
Our OLG model is dynamically calibrated so that it matches to a veryhigh degree the regional structures and the inter-regional disparities over theperiod 1950-2000. It consists of two main blocks with a recursive structure.To account for the empirical elasticities estimated in the literature, we buildan “upstream block”, calibrated outside the core of the model using data andempirical studies. This block predicts the evolution of demographic variables,human capital, and the magnitude of diaspora externalities. Then, these pre-dictions are incorporated into a “micro-founded block” within a general equi-librium framework. This block generates predictions for the world output,prices, remittances, asset accumulation, the geographical allocation of assets,the international flows of capital income and other endogenous variables. Inorder to assess the global effects of brain drain on the developing economies,demographic shocks of additional skilled emigration are introduced duringthe period 2010-2050, and the analysis will focus on the transitional pathduring the period 2000-2100.16
16The model economy starts from an initial steady-state in 1870, and after demographicshocks are introduced, the new steady state is reached in 2200.
9
In the ensuing sections, we will describe the structure of the two mainbuilding blocks and specify the demographic shock in the context of the modeleconomy. For clarity of the exposition, we will begin with the micro-foundedblock.
2.1. The micro-founded block
Each region has three types of agents: households, the firm, and the gov-ernment. Before depicting the behavior of each type of agents, it is essentialto discuss the demographic composition.
⊙ Demography: At each period, there are eight overlapping generations de-noted by a, with a = 0 standing for the age class 15-24, a = 1 for 25-34, andso on, up to a = 7 for 85-94. Individuals have uncertain longevities, meaningthat they may die at the end of every period. Each individual of the samegeneration faces an identical cumulative survival probability, which decreaseswith age. Hence, the size of each generation (Na,t+a) declines deterministi-cally over time:
Na,t+a = Pa,t+aN0,t a = {0, 1, . . . , 7}, (1)
where Pa,t+a ∈ [0, 1] is the exogenous fraction of generation a born at periodt alive at period t + a, with P0,t = 1.
The size of the young generation (a = 0) increases over time at an exoge-nous growth rate:
N0,t = mt−1N0,t−1, (2)
where N0,t measures the initial size of the young generation, and mt−1 is oneplus the population growth rate, which includes both fertility and migration.It is assumed that migration takes place at the first period of life (i.e., a = 0)and is permanent. This is a reasonable assumption since we focus on theSouth-to-North migration of the skilled, who are likely to migrate, alongwith their family members, on a more permanent basis.17
Individuals belonging to the same generation are heterogeneous in termsof their skills. They are either skilled (denoted by s) or less-skilled (denotedby l). It is assumed that an individual obtains post-secondary schooling and
17This assumption is made also out of consideration for analytical tractability, so thatmigrants and natives living in the same region have identical asset accumulations.
10
becomes skilled before reaching age 25.18 Let φt stand for the proportion ofthe skilled among the young generation born at period t. The populationsof the skilled and the less-skilled youth are then given respectively by:
N s0,t = φtN0,t
N l0,t = (1 − φt)N0,t
, φt ∈ [0, 1]. (3)
An exogenous profile of participation in the labor market is assumedper age and skill group (denoted by λj
a,t). Hence, labor supply of a type jindividual at period t is given by
Ljt =
7∑
a=0
λja,tN
ja,t j = {s, l}. (4)
Specifically, full participation is assumed except for the following threegroups. First, the skilled youth spend a fraction of their time in ob-taining education and do not fully participate in the labor market (i.e.,λs
0,t ∈ ]0, 1[). Second, part of the population aged 55-64 are retired (i.e.,
λj4,t ∈ ]0, 1[, j = {s, l}). Lastly, all individuals aged above 65 are retired (i.e.,
λja,t = 0, ∀ a > 4, j = {s, l}).
⊙ Households: Each non-migrant individual derives utility from her lifetimeconsumption. The expected utility function is assumed to be time-separableand logarithmic:
E(
U jt
)
=7
∑
a=0
Pa,t+a ln(
cja,t+a
)
j = {s, l} ,
where cja,t+a ≥ 0 denotes the amount of goods consumed by a non-migrant
individual of generation a at period t + a. The price of goods is normalizedto unity; therefore, cj
a,t+a also equals to her total expenditures of the same
18Our perception of skilled versus less-skilled labor is similar to the one described inCervellati and Sunde (2005). Each individual is endowed with one unit of less-skilledlabor; however, it is transformed into a skilled unit upon the completion of post-secondaryeducation, when one has acquired the ability of abstract reasoning. This specification isconsistent with empirical evidence showing perfect substitutibility between high schoolgraduates and dropouts (Ottaviano and Peri, 2008; Card, 2009), and it also explains whythe skilled diaspora is unique in facilitating technology diffusion (see Section 1).
11
period.However, migrants, i.e., those born in the South and living in the North,
are assumed to derive utility from a combination of goods consumption (cM,j)and remittances (RMM,j):
cja,t+a = (cM,j
a,t+a)1−γj
(RMM,ja,t+a)
γj
j = {s, l}, (5)
where γj ∈ [0, 1] is a time-invariant and age-invariant propensity to remit.It determines the share of total expenditures that a migrant of skill type jsends home as remittances. This exogenous parameter is region-specific andcalibrated using the IMF recorded remittance receipts in 2003.19
Following de la Croix and Docquier (2007), we postulate the existence ofan insurance mechanism a la Arrow-Debreu. Each time after an individualdies, her assets are equally distributed among individuals belonging to thesame generation living in the same region. Individuals thus maximize theirexpected utility subject to a budget constraint requiring equality betweenthe discounted expected value of expenditures and the discounted expectedvalue of income, which consists of net labor income, pension benefits, otherwelfare transfers and/or net remittances. The household optimization prob-lem determines the age profiles for consumption, remittances, savings, andasset accumulation.
⊙ Firm: At each period and in each region, a representative and profit-maximizing firm uses efficient labor (Lt) and physical capital (Kt) to producea composite good (Yt).
20 A Cobb-Douglas production function is assumed
19Remittances are modelled in this way for the same reason explained in Footnote 17.The age-invariance of the propensity to remit comes from our implicit assumption thatthere is no remittances decay, due to scant empirical evidence.
20With our modeling of the production sector, we implicitly assumes that every regionproduces homogeneous goods. They are traded freely, and the international goods marketis cleared by Walras’ law. Hence, a region either imports or exports and no bilateral tradeexists. Given our focus on factor flows and their (real) prices, we choose this parsimoniousmodeling of international trade. Furthermore, if the Hecksher-Ohlin type of assumptionsare satisfied, free trade would have led to factor price equalization even without factormobility. However, these assumption are not satisfied in our setting. As discussed later,the ex-post returns to capital do not equalize because of region-specific risk premiums,while cross-country differences in technology, along with capital endowment differentials,contribute to international wage gaps.
12
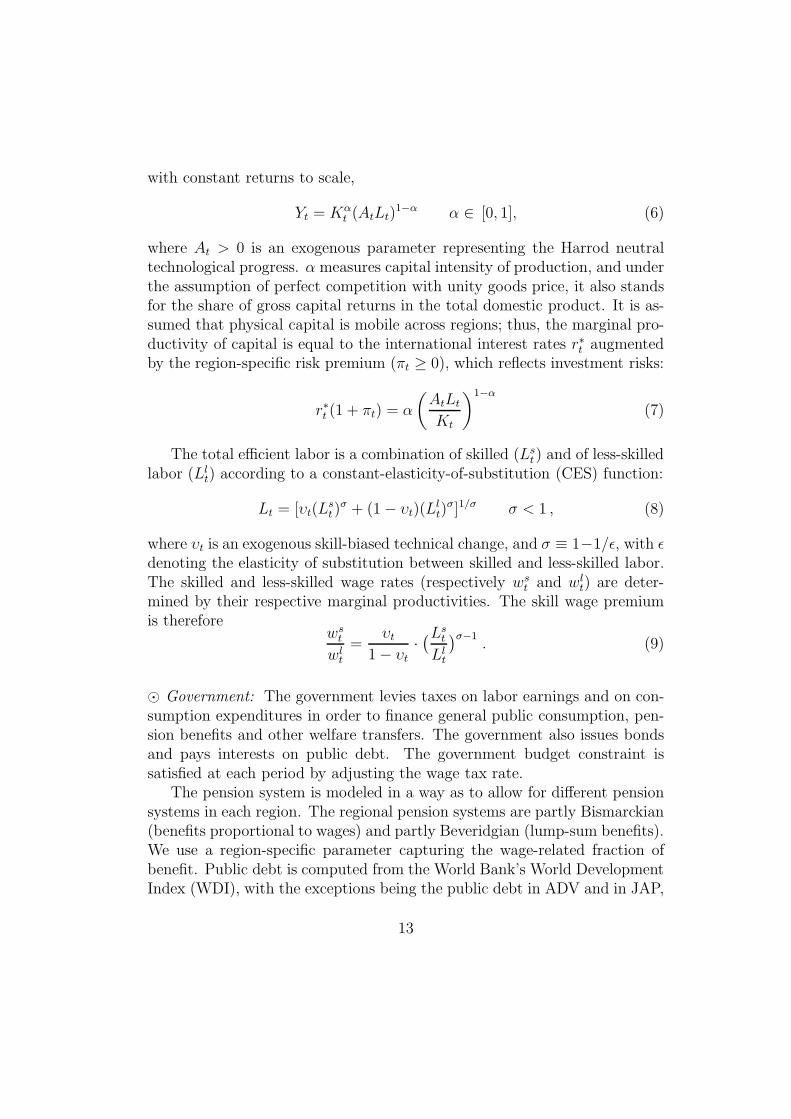
with constant returns to scale,
Yt = Kαt (AtLt)
1−α α ∈ [0, 1], (6)
where At > 0 is an exogenous parameter representing the Harrod neutraltechnological progress. α measures capital intensity of production, and underthe assumption of perfect competition with unity goods price, it also standsfor the share of gross capital returns in the total domestic product. It is as-sumed that physical capital is mobile across regions; thus, the marginal pro-ductivity of capital is equal to the international interest rates r∗t augmentedby the region-specific risk premium (πt ≥ 0), which reflects investment risks:
r∗t (1 + πt) = α
(
AtLt
Kt
)1−α
(7)
The total efficient labor is a combination of skilled (Lst ) and of less-skilled
labor (Llt) according to a constant-elasticity-of-substitution (CES) function:
Lt = [υt(Lst )
σ + (1 − υt)(Llt)
σ]1/σ σ < 1 , (8)
where υt is an exogenous skill-biased technical change, and σ ≡ 1−1/ǫ, with ǫdenoting the elasticity of substitution between skilled and less-skilled labor.The skilled and less-skilled wage rates (respectively ws
t and wlt) are deter-
mined by their respective marginal productivities. The skill wage premiumis therefore
wst
wlt
=υt
1 − υt·(Ls
t
Llt
)σ−1. (9)
⊙ Government: The government levies taxes on labor earnings and on con-sumption expenditures in order to finance general public consumption, pen-sion benefits and other welfare transfers. The government also issues bondsand pays interests on public debt. The government budget constraint issatisfied at each period by adjusting the wage tax rate.
The pension system is modeled in a way as to allow for different pensionsystems in each region. The regional pension systems are partly Bismarckian(benefits proportional to wages) and partly Beveridgian (lump-sum benefits).We use a region-specific parameter capturing the wage-related fraction ofbenefit. Public debt is computed from the World Bank’s World DevelopmentIndex (WDI), with the exceptions being the public debt in ADV and in JAP,
13
which are obtained from the OECD data on Gross Financial Liabilities.
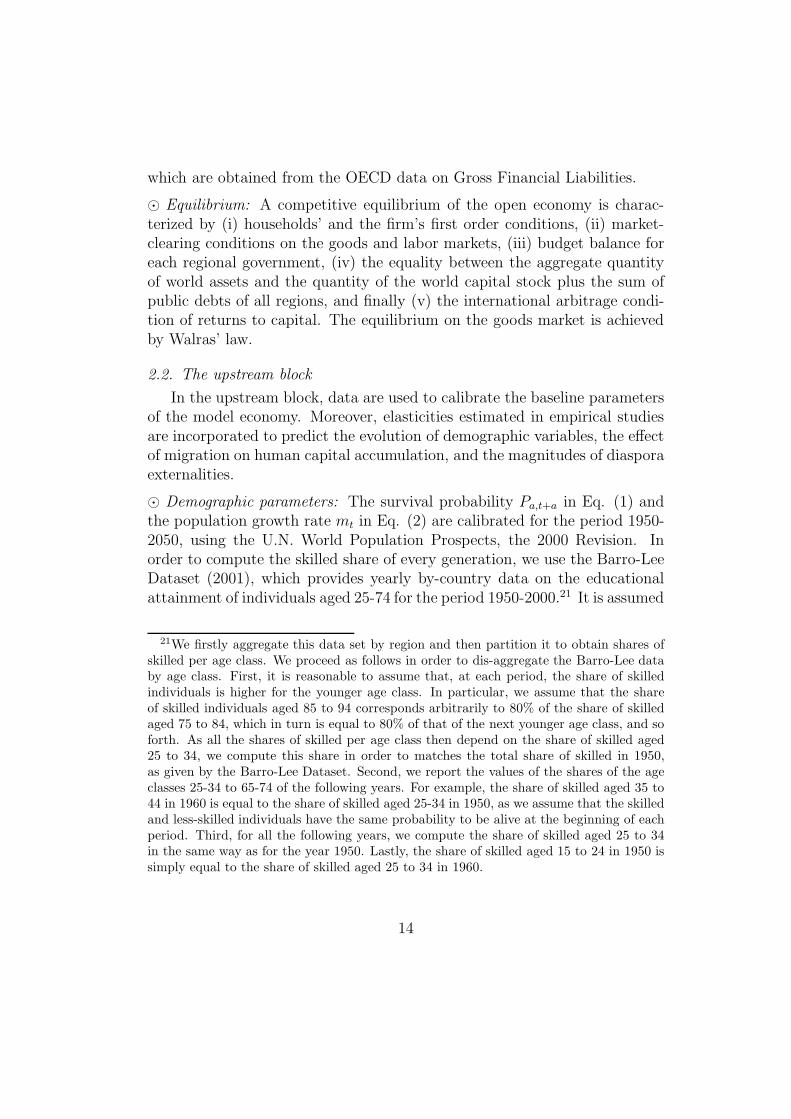
⊙ Equilibrium: A competitive equilibrium of the open economy is charac-terized by (i) households’ and the firm’s first order conditions, (ii) market-clearing conditions on the goods and labor markets, (iii) budget balance foreach regional government, (iv) the equality between the aggregate quantityof world assets and the quantity of the world capital stock plus the sum ofpublic debts of all regions, and finally (v) the international arbitrage condi-tion of returns to capital. The equilibrium on the goods market is achievedby Walras’ law.
2.2. The upstream block
In the upstream block, data are used to calibrate the baseline parametersof the model economy. Moreover, elasticities estimated in empirical studiesare incorporated to predict the evolution of demographic variables, the effectof migration on human capital accumulation, and the magnitudes of diasporaexternalities.
⊙ Demographic parameters: The survival probability Pa,t+a in Eq. (1) andthe population growth rate mt in Eq. (2) are calibrated for the period 1950-2050, using the U.N. World Population Prospects, the 2000 Revision. Inorder to compute the skilled share of every generation, we use the Barro-LeeDataset (2001), which provides yearly by-country data on the educationalattainment of individuals aged 25-74 for the period 1950-2000.21 It is assumed
21We firstly aggregate this data set by region and then partition it to obtain shares ofskilled per age class. We proceed as follows in order to dis-aggregate the Barro-Lee databy age class. First, it is reasonable to assume that, at each period, the share of skilledindividuals is higher for the younger age class. In particular, we assume that the shareof skilled individuals aged 85 to 94 corresponds arbitrarily to 80% of the share of skilledaged 75 to 84, which in turn is equal to 80% of that of the next younger age class, and soforth. As all the shares of skilled per age class then depend on the share of skilled aged25 to 34, we compute this share in order to matches the total share of skilled in 1950,as given by the Barro-Lee Dataset. Second, we report the values of the shares of the ageclasses 25-34 to 65-74 of the following years. For example, the share of skilled aged 35 to44 in 1960 is equal to the share of skilled aged 25-34 in 1950, as we assume that the skilledand less-skilled individuals have the same probability to be alive at the beginning of eachperiod. Third, for all the following years, we compute the share of skilled aged 25 to 34in the same way as for the year 1950. Lastly, the share of skilled aged 15 to 24 in 1950 issimply equal to the share of skilled aged 25 to 34 in 1960.
14
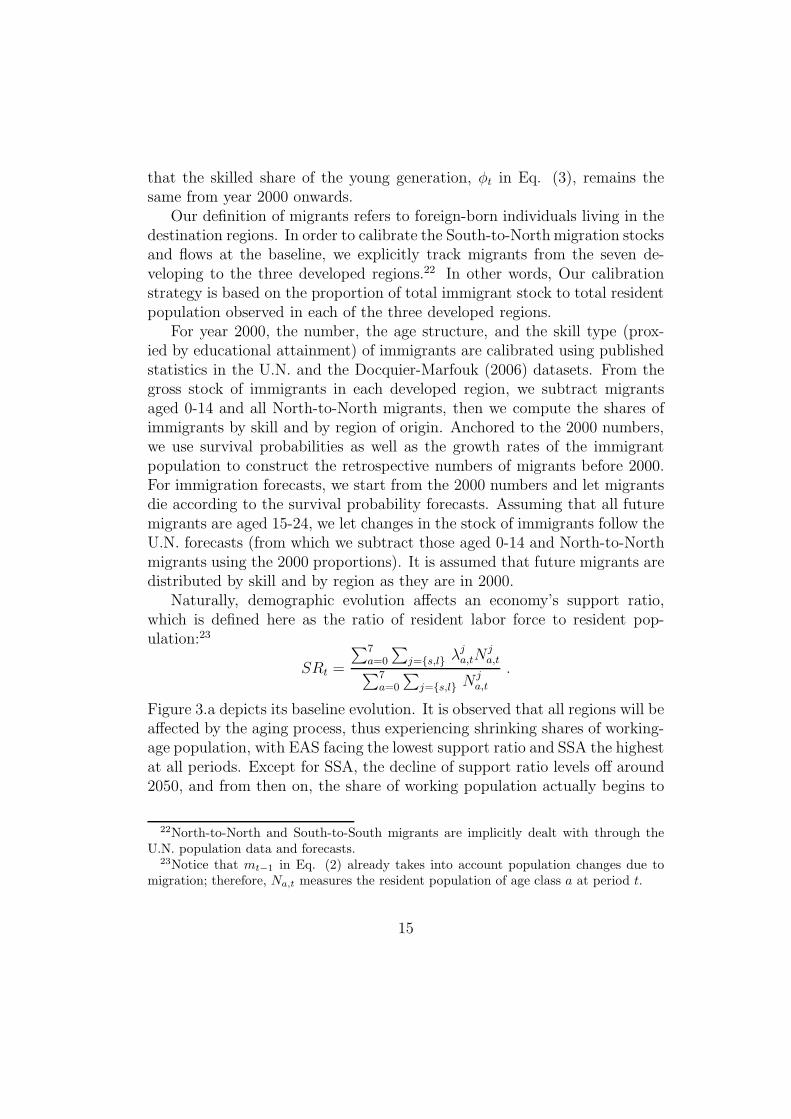
that the skilled share of the young generation, φt in Eq. (3), remains thesame from year 2000 onwards.
Our definition of migrants refers to foreign-born individuals living in thedestination regions. In order to calibrate the South-to-North migration stocksand flows at the baseline, we explicitly track migrants from the seven de-veloping to the three developed regions.22 In other words, Our calibrationstrategy is based on the proportion of total immigrant stock to total residentpopulation observed in each of the three developed regions.
For year 2000, the number, the age structure, and the skill type (prox-ied by educational attainment) of immigrants are calibrated using publishedstatistics in the U.N. and the Docquier-Marfouk (2006) datasets. From thegross stock of immigrants in each developed region, we subtract migrantsaged 0-14 and all North-to-North migrants, then we compute the shares ofimmigrants by skill and by region of origin. Anchored to the 2000 numbers,we use survival probabilities as well as the growth rates of the immigrantpopulation to construct the retrospective numbers of migrants before 2000.For immigration forecasts, we start from the 2000 numbers and let migrantsdie according to the survival probability forecasts. Assuming that all futuremigrants are aged 15-24, we let changes in the stock of immigrants follow theU.N. forecasts (from which we subtract those aged 0-14 and North-to-Northmigrants using the 2000 proportions). It is assumed that future migrants aredistributed by skill and by region as they are in 2000.
Naturally, demographic evolution affects an economy’s support ratio,which is defined here as the ratio of resident labor force to resident pop-ulation:23
SRt =
∑7a=0
∑
j={s,l} λja,tN
ja,t
∑7a=0
∑
j={s,l} N ja,t
.
Figure 3.a depicts its baseline evolution. It is observed that all regions will beaffected by the aging process, thus experiencing shrinking shares of working-age population, with EAS facing the lowest support ratio and SSA the highestat all periods. Except for SSA, the decline of support ratio levels off around2050, and from then on, the share of working population actually begins to
22North-to-North and South-to-South migrants are implicitly dealt with through theU.N. population data and forecasts.
23Notice that mt−1 in Eq. (2) already takes into account population changes due tomigration; therefore, Na,t measures the resident population of age class a at period t.
15
climb up in some regions, most notably in EAS, RUS, and to a lesser degreein CHI.
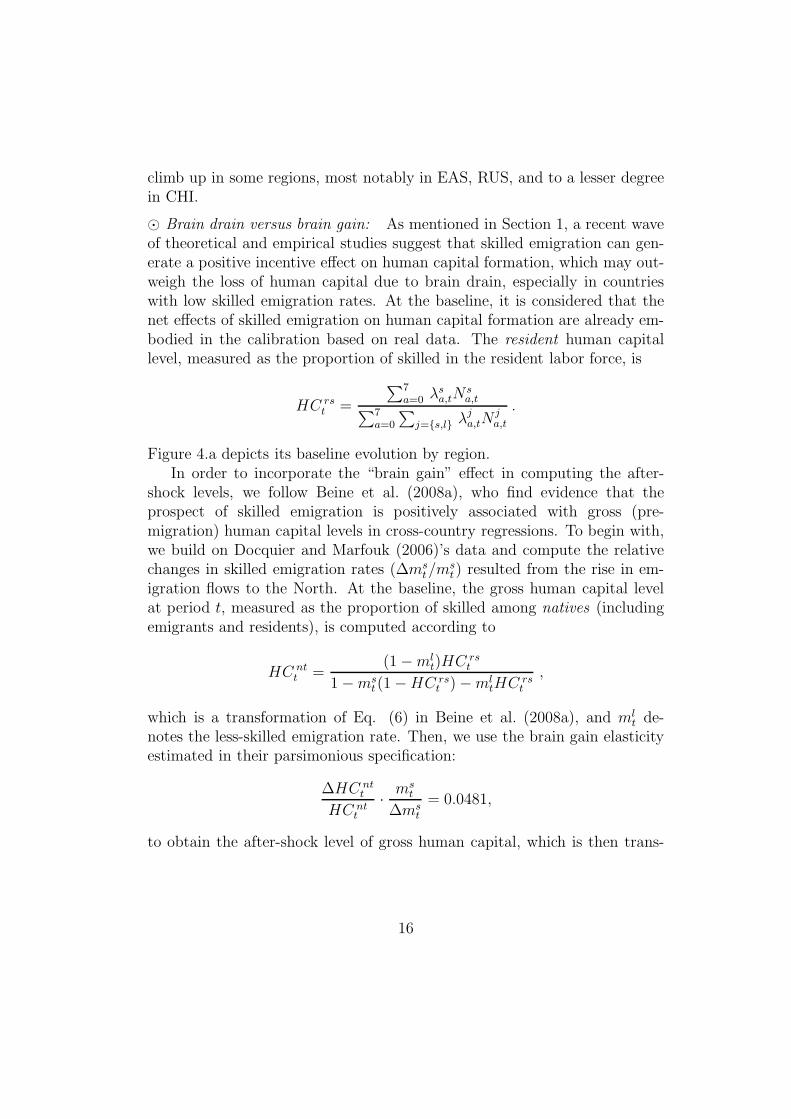
⊙ Brain drain versus brain gain: As mentioned in Section 1, a recent waveof theoretical and empirical studies suggest that skilled emigration can gen-erate a positive incentive effect on human capital formation, which may out-weigh the loss of human capital due to brain drain, especially in countrieswith low skilled emigration rates. At the baseline, it is considered that thenet effects of skilled emigration on human capital formation are already em-bodied in the calibration based on real data. The resident human capitallevel, measured as the proportion of skilled in the resident labor force, is
HC rst =
∑7a=0 λs
a,tNsa,t
∑7a=0
∑
j={s,l} λja,tN
ja,t
.
Figure 4.a depicts its baseline evolution by region.In order to incorporate the “brain gain” effect in computing the after-
shock levels, we follow Beine et al. (2008a), who find evidence that theprospect of skilled emigration is positively associated with gross (pre-migration) human capital levels in cross-country regressions. To begin with,we build on Docquier and Marfouk (2006)’s data and compute the relativechanges in skilled emigration rates (∆ms
t/mst ) resulted from the rise in em-
igration flows to the North. At the baseline, the gross human capital levelat period t, measured as the proportion of skilled among natives (includingemigrants and residents), is computed according to
HC ntt =
(1 − mlt)HC rs
t
1 − mst (1 − HC rs
t ) − mltHC rs
t
,
which is a transformation of Eq. (6) in Beine et al. (2008a), and mlt de-
notes the less-skilled emigration rate. Then, we use the brain gain elasticityestimated in their parsimonious specification:
∆HC ntt
HC ntt
·ms
t
∆mst
= 0.0481,
to obtain the after-shock level of gross human capital, which is then trans-
16
formed back to the after-shock level of resident human capital.24
⊙ Propensity to remit: The calibration strategy for the propensity to remit,or γj in Eq. (5), is based on the officially recorded remittances to GDP ratiofor each developing region (see Table 1). Due to data availability, we donot have information on the potential heterogeneity in propensities to remitbetween skill types.25 Neither do we know about the distributional patternof remittance receipts in migrants’ home country.26 It is assumed at thebaseline that γs = γl and that remittances are distributed equally among allresidents living in the same developing region.27
⊙ Production parameters: The share of gross capital returns in the totaldomestic output, or α in Eq. (6), is set to one-third as estimated in thegrowth accounting literature a la Solow (1957).
The Harrod neutral technological progress (At) is calibrated as follows.North America is assumed to be the technologically leading economy at allperiods considered, with the level of technology denoted by ANAM
t . Its evo-lution is calibrated with real observations up to year 2000, and for futureperiods, the annual growth rate is assumed to be equal to 1.84 percent. Inorder to obtain At for non-leading regions, we use the observed paths of GDPratio, Yt/Y
NAM
t , where Y NAM
t measures the leader’s GDP. We swap the exoge-nous variable At/A
NAM
t for the endogenous variable Yt/YNAM
t and then solve
24Notice that, given the framework of eight overlapping generations, the change in resi-dent human capital at period t needs to be taken into account also in the next periods.
25While Ratha (2003) claims that skilled migrants send more remittances due to higherearnings, empirical evidence put forth by Faini (2007) and Nimii et al. (2008) suggestthat, compared to their less-skilled counterpart, skilled migrants have a lower propensityto remit.
26On the one hand, some studies find that remittances are distributed rather evenlyamong different income groups (e.g., Taylor and Wyatt, 1996) while others identify thatinequality is deepened with migration and remittances (e.g., Barham and Boucher, 1998).On the other hand, the relationship between migration/remittances and inequality maybe characterized by an inverse U-shaped pattern, suggesting that the short- and long-runeffects may be of opposite signs (Stark et al., 1986; McKenzie and Rapoport, 2007; Shenet al., 2009).
27Notice, however, when calibrated to the official remittances data, it turned out to beinfeasible that skilled migrants could have a much lower propensity to remit. Otherwise,remittances from less-skilled migrants will have to account for an unreasonably large shareof total remittance receipts, which would then require that they remit an extremely largeshare of their total income.
17
the identification steps.28 The ratios of GDP’s are computed by employingthe WDI data of GDP per purchasing power parity for years 1980, 1990,and 2000, and the values in 1980 are adopted for the periods preceding 1980.For the periods following 2000, the calibration of the forecast technologicalprogress will be discussed later when changes in resident human capital andtechnology diffusion are explicitly taken into account.29
Following Acemoglu (2002), the elasticity of substitution between skilledand less-skilled labor (ǫ) is set to 1.4, so the corresponding parameter σ inEq. (8) is equal to 0.2857. Regarding the skill-biased technical change (υt),the exogenous variable υt/(1 − υt) is swapped for the endogenous variablews
t/wlt in Eq. (9) using the aforementioned procedure. Skill premiums in
2000 are arbitrarily fixed for each region.30 For the periods preceding 2000,the values vary according to the 1950-2000 pattern of college wage premiumsin the United States (Acemoglu, 2003). For the periods following 2000, thevalues in 2000 are adopted.
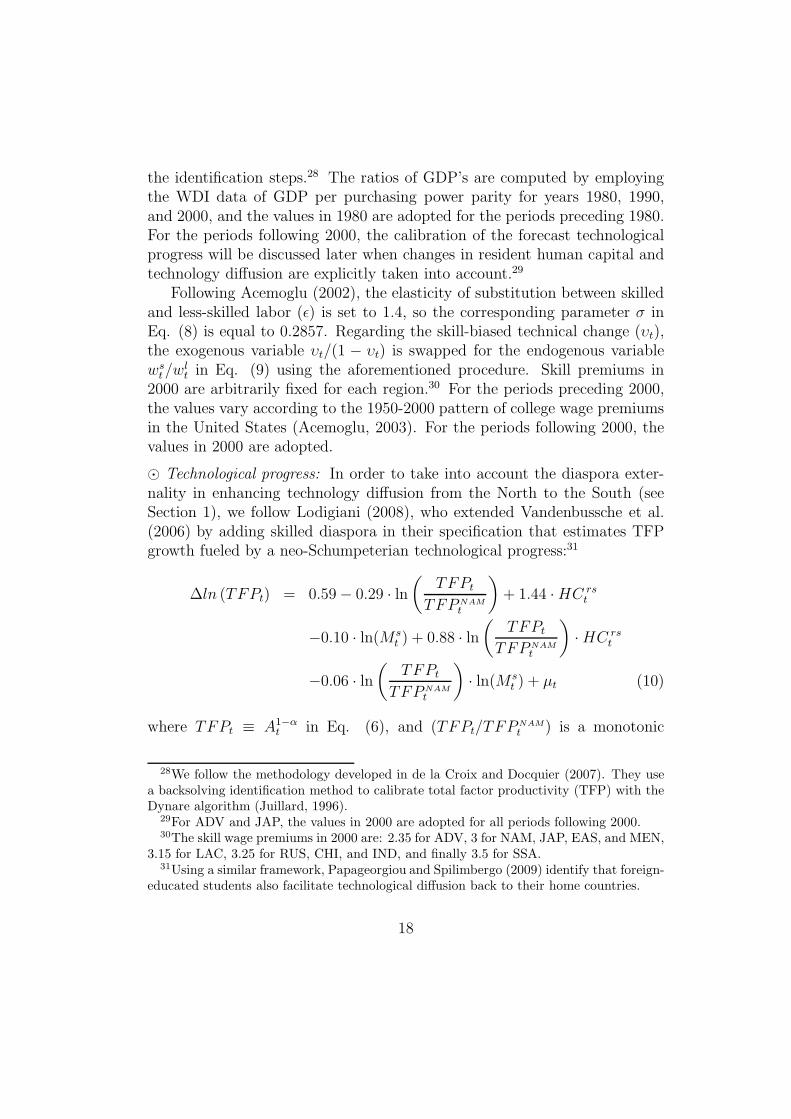
⊙ Technological progress: In order to take into account the diaspora exter-nality in enhancing technology diffusion from the North to the South (seeSection 1), we follow Lodigiani (2008), who extended Vandenbussche et al.(2006) by adding skilled diaspora in their specification that estimates TFPgrowth fueled by a neo-Schumpeterian technological progress:31
∆ln (TFPt) = 0.59 − 0.29 · ln
(
TFPt
TFP NAMt
)
+ 1.44 · HC rst
−0.10 · ln(Mst ) + 0.88 · ln
(
TFPt
TFP NAMt
)
· HC rst
−0.06 · ln
(
TFPt
TFP NAMt
)
· ln(Mst ) + µt (10)
where TFPt ≡ A1−αt in Eq. (6), and (TFPt/TFP NAM
t ) is a monotonic
28We follow the methodology developed in de la Croix and Docquier (2007). They usea backsolving identification method to calibrate total factor productivity (TFP) with theDynare algorithm (Juillard, 1996).
29For ADV and JAP, the values in 2000 are adopted for all periods following 2000.30The skill wage premiums in 2000 are: 2.35 for ADV, 3 for NAM, JAP, EAS, and MEN,
3.15 for LAC, 3.25 for RUS, CHI, and IND, and finally 3.5 for SSA.31Using a similar framework, Papageorgiou and Spilimbergo (2009) identify that foreign-
educated students also facilitate technological diffusion back to their home countries.
18
transformation of a region’s distance to the technology frontier (At/ANAM
t ).∆ln (TFPt) denotes the rate of TFP growth between year t and year t + 5.Ms
t is a developing region’s stock of skilled emigrants living in the North.32
Finally, µt captures the exogenous time trend. The basic idea lying behindthis specification is that TFP growth is determined by a region’s capacityto innovate or to adopt modern technologies. On the one hand, in a tech-nologically less-advanced region that rely on the adoption of technologiesinnovated in the North, skilled emigrants facilitate technology diffusion backto the South; thus, it helps to augments TFP growth. On the other hand,however, skilled human capital is crucial for technology innovation but alsofor the adoption of technologies diffused from the North; therefore, braindrain negatively affects TFP growth, and this effect is especially pessimisticfor regions far from the technological frontier because of its inability to in-novate and lack of skilled workers to adopt modern technologies.
As mentioned earlier, changes in resident human capital and the diasporaexternality in technology diffusion are explicitly taken into account for theforecast of the Harrod neutral technological progress, i.e., from period 2000onwards.33 The forecasts of migration and of resident human capital areplugged into the above estimation in order to predict the evolution of TFPt,which is then transformed into At; moreover, we consider that µt is equal tozero everywhere except in EAS, CHI, and IND, where the exogenous trendsremain positive until 2050. The baseline evolution of At/A
NAM
t is depicted inFigure 5.a.
⊙ Risk premium: As discussed in Section 1, skilled diaspora may contributeto reducing information-related risks for capital investments in the migrants’home countries, and thus attracting more FDI inflows in the South. Thisdynamic complementarity is captured in the following equation:
∀t ≥ 2000, (1 + πt+1) = (1 + π2000) (Mst )−φ φ > 0 ,
32It is implicitly assumed that, as the skilled diaspora located in NAM, skilled emigrantsliving in JAP and in ADV have the same externality in diffusing modern technologies. Weregard it as a safe assumption given their narrow technology gaps to NAM.
33Over the period 1950-2000, we calibrate µt so that the baseline simulations perfectlymatch the observations of GDP ratios, Yt/Y NAM
t . The calibrated path for µt is ratherstationary and distributed around zero in all regions except for EAS, CHI, and IND,where positive trends are observed. Due to data availability in calibration, ARUS
t /ANAM
t isassumed to remain constant from 2000 onwards.
19
where π2000 denotes the risk premium in 2000, and it is calibrated withOECD’s Country Risk Classification.34 -φ is the elasticity of risk premium tothe lagged size of skilled diaspora. Combined with Eq. (7), the three-perioddynamics is derived:
(1 + πt+1) = (1 + πt) ·
(
1 − φ ·Ms
t − Mst−1
Mst−1
)
, (11)
where φ = θ(1 − α)(FDIt/Kt). θ is defined and estimated in Docquier andLodigiani (2009)’s panel regression as
∆fditfdit
·Ms
t−1
∆Mst−1
= 0.025 ,
with fdit denoting FDI per worker, so θ is its elasticity to the lagged size ofskilled diaspora. (FDIt/Kt) is set to 12.5 percent, which is approximatelythe average share of FDI among total investments in developing countries.
For the periods preceding 2000, the values in 2000 are adopted. For theperiods following 2000, the migration forecast is plugged into Eq. (11) toobtain the evolution of risk premium, which is then depicted in Figure 6.a.35
2.3. The demographic shock of additional skilled emigration
Starting from the U.N. forecasts, in each decennial period from 2010-20 to2050-60, the demographic shock constitutes a 20 percent increase in the fore-cast flow of skilled migrants from every developing region to each developed
34It is based on the Knaepen Package, a system for assessing country credit risk andclassifies countries into eight country risk categories, from no risk (0) to high risk (7).Basically, it measures the credit risk of a country. There are no risks for the three developedregions whereas the risk classifications in 2000 for each of the seven developing regions areas follows: 3.4 for EAS, 4.0 for MEN, 5.2 for LAC, 6.4 for SSA, 6.2 for RUS, 3.2 forCHI, and 4.9 for IND. In order to transform these values into risk premiums, we usethe formula: π2000 = 0.37 · (RC/7), where RC denotes a region’s risk classification andmax(π2000) = 0.37 is based on the calibration to Caselli (2007), who finds that the averagereturns to capital are about 1.25 times higher in developing than in developed economies,after correction for price differences.
35Notice that the stock of skilled emigrants does not increase monotonically overtime.In the calibration, it is assumed that φ = 0 if M s
t < M st−1
. In other words, while anenlarged diaspora reduces information-reduced risk, this reduction will not be reversedeven if the future size becomes smaller.
20
region. Consistent with the model assumption, the additional migrants areconsidered to belong to the age class a = 0, or aged 15-24.36 Notice, however,it is implicitly assumed in our aggregate approach that all changes inducedby the five waves of emigration shocks are homogeneously experienced byevery country within the same region. Hence, the simulated changes perdeveloping region are in effect more indicative of those experienced by largecountries, due to their heavier weight in the aggregation. Below, we discusshow the demographic shock changes some key regional characteristics fromthe baseline. We focus on the transitional period 2000-2100, or the periodbefore the first wave of additional migrants is introduced until the periodwhen the additional migrants of the last wave are entirely retired.
Figure 3.b shows the relative changes in support ratio (SRt). As expected,all regions are adversely affected by the loss of working-age population causedby the demographic shock that alters population dynamics via mt in Eq. (2).However, EAS experiences the greatest impact due to the combination of arelatively large share of aged (hence non-working-age) population and a highskilled emigration rate among its rather educated populace. The impactsreach their respective maxima in 2060, with EAS confronted by a decline of0.65%.
Regarding resident human capital (HC RSt ), Figure 4.b depicts its relative
changes. It is observed that, after the initial shocks, increased skill outflowsnegatively affect the skill composition among the young generation, or φt
in Eq. (3). Hence, resident human capital is decreased, in particular forregions characerized by distintively high skilled emigration rates, namelyEAS, LAC, and SSA (see Table 1). However, the incentive effect of betterskilled migration prospects on human capital formation (or the brain gaineffect) eventually benefit all regions, enhancing resident human capital bymaximally 2-3%.37
As discussed earlier, resident human capital and skilled diaspora are cru-cial determinants of technological progress (see Eq. (10)). Figure 5.b plotsthe relative changes in the Harrod neutral technological progress with re-spect to the leader’s (At/A
NAM
t ). Small positive effects are observed in MEN
36A skilled young migrant is a young adult who is forecast to complete post-secondaryeducation, regardless of where the degree is awarded.
37As our aggregate approach has the effects in every region dominated by the largecountries, this result is consistent with Beine et al. (2008a)’s findings about winners andlosers of brain drain, where “the most populated countries [. . .] are all among the winners.”
21
and IND, both with relatively low skilled emigration rates and located farfrom the technology frontier. For them, the enlarged skilled diaspora in theNorth acts to facilitate the diffusion of more advanced technology back to theSouth. In comparison, the initial losses of resident human capital observed inEAS, LAC, SSA, and CHI have negative dynamic impacts on their capacityto innovate or to adopt modern technologies;38 meanwhile, the compensatoryrole played by skilled diaspora in technology diffusion is of less importancefor technologically more advanced regions, e.g., EAS as well as CHI in thesecond-half of the 21st century. Although larger than the positive effects, thenegative relative changes still lie well below 1%.
Finally, Figure 6.b describes the relative changes in risk premium (πt) oncapital returns. It is found that, through the enlarged diaspora, all develop-ing regions benefit from reductions in risk premiums, which will then implyceteris paribus greater FDI inflows in the open economy. However, thesedynamic effects are rather small, with the relative changes in 2060 rangingbetween 0.02-0.04%.
3. Results and Analysis
This section presents and analyzes the simulated results of the ten-regioncalibrated OLG model, where all the mechanisms discussed in the previoussection are incorporated into a unified generic framework, with the directeffects of skilled emigration propagated and the indirect effects endogenouslygenerated. By introducing the demographic shock of additional South-to-North brain drain specified above, we would like to answer the followingquestions: (i) What are the impacts on the developing economies when theyare faced with more skill outflows? (ii) Which channels are more dominant?Do they induce positive or negative impacts on the South, and under whichconditions? The assessment of the overall impacts is conducted by comparingthree economic indicators at the baseline and after shocks. These indicatorsare defined as follows:
• GDP per capita: Yt/Nt.
38For CHI, its distance to the technological frontier is not low enough for it to benefitmuch from the diaspora externality on technology diffusion, but it is sufficiently low for itto suffer greatly from the loss of skilled workers. This is why CHI’s technological progressis so adversely affected even though it faces only a slightly negative impact on residenthuman capital after the first wave of migration shock.
22
• GNI per capita: GNIt/Nt,
where GNIt = Yt + remittance receiptst + net capital income inflowst
+ foreign aidt − consumption taxest.39
• Skilled-to-less-skilled income inequality: (GNIst /N s
t )/(GNI lt/N
lt).
40
To begin with, we examine how the shock of additional skilled emigrationaffects GDP per capita through different channels. As a matter of fact,the total impact can be disentangled by the changes in the four regionalcharacteristics discussed in Section 2.3.
3.1. Disentangled effects on GDP per capita
The disentangled effects of the demographic shock on GDP per capita aredepicted in Figure 7 by each channel.
Demography (mt): The loss of working-age population accelerates theaging process and results in a lower support ratio. In other words, with eachmigration shock, it implies a downsized domestic production yet proportionedby the same number of retirees. Hence, GDP per capita is negatively affectedin all regions, with the maximal impacts reached in 2060 and ranged between0.2-0.7%. Consistent with the impact on support ratio, EAS is the hardesthit region through the demography channel.
Human Capital (φt): It is observed that the incentive effect of braindrain, which eventually contributes to “brain gain” in all regions via morehuman capital formation, also improves GDP per capita. For most regions,this positive impact begins to level off in 2060, with RUS benefiting themost at 1% and SSA the least at 0.2%. In line with the relative changesin resident human capital, the adverse short-run impacts are more severe inregions characterized by high skilled emigration rates.41 In comparison, the
39Net capital income inflows are calculated as the value of residents’ assets subtractedby the returns to capital used in domestic production.
40The definition of GNIjt , j = {s, l}, is analogous to GNIt, except that wj
t is used inplace of Yt.
41In order to single out the impact of the incentive effect, all parameter values are heldat the baseline, except φt. Because of the assumption outlined in Section 2 that theskilled youth do not fully participate in the labor market, the initial increases in φt due tomigration shocks imply that there are less efficient labor (Lt) available for production. Thisis why even those regions characterized by low skilled emigration rates are also negativelyimpacted in the beginning of the 21st century in Figure 7.b.
23
medium-to-long-run benefits of the incentive effect are most visible in regionswhere the labor force is better skilled, including EAS and LAC where thenegative short-run impacts are actually the greatest.
Technological progress (At): Since the Harrod neutral technologicalprogress directly affects domestic outputs (see Eq. (6)), its impacts on GDPper capita naturally follow the pattern of relative changes in technologicalprogress discussed in Section 2.3, with MEN and IND seeing positive ef-fects up to 0.1% and 0.3% respectively thanks to technology diffusion thatincreases the efficiency of the production factors. In the mean time, thoseregions suffering initially from the loss of resident human capital have to copewith long-lasting negative dynamic impacts on their capacities to innovateor to adopt modern technologies; therefore, with the undermined productionefficiencies, returns to capital decline, which discourages capital investmentsin these regions. LAC and CHI are most seriously affected in this respect,with their GDP per capita dwindled by about 0.8% maximally.
Risk premium (πt): In an open economy, the level of risk premium is oneof the crucial factors that determine the volume of physical capital investedin domestic production. As every region experiences reduced risk premiumwith the enlargement of diaspora, they also enjoy increases in GDP per capitathrough this channel. It is observed that the positive effects impact nearly allregions with similar magnitudes, of around 0.2% in 2060 and 0.4% in 2100.EAS benefits slightly less because, under the migration shocks, its diasporahas a smaller relative increase in size (see Eq. (11)).
Now that we have understood better the channels through which thedemographic shock of additional brain drain impacts GDP per capita. Weproceed further to the discussion of total impacts on the three economicindicators.
3.2. Total impacts on GDP per capita
Figure 8.a presents the total impacts of the demographic shock on GDPper capita. In the medium-to-long-run, it is found that all the seven develop-ing regions enjoy increased GDP per capita, thanks to the dynamic impactsof the incentive effect on human capital formation and to the gradual reduc-tions of risk premium. Nevertheless, while some experience positive impactsalready in the short-run (i.e., MEN, RUS, IND, with 0.5-0.8% increases in2060), others have to first undergo certain periods of economic downturnalong the transitional path (i.e., EAS, LAC, SSA, and CHI, with 0.2-0.6%
24
decreases in 2060). Except for RUS, what distinguishes the winners fromthe losers in the short-run is the impacts working through the technologychannel, which is closely related to a region’s resident human capital and itsdistance to the technological frontier. It is observed that all the loser regionssuffer from the dynamic impacts on technological progress originating fromthe initial losses of their resident human capital as depicted in Figure 4. Be-sides CHI, all other loser regions have distinctively high skilled emigrationrates, which are also the characteristics of regions that are less likely to enjoybrain gain according to Beine et al. (2008a).
Hence, in Figure 8.b, we run an alternative simulation where we abstractfrom the incentive effect on human capital formation. The total impactsare far more pessimistic, with all regions benefit less/ suffer more from themigration shocks (with 0.2-0.5% increases and 0.2-1.9% decreases in 2060).Moreover, EAS, LAC, SSA, and CHI have to undergo prolonged periods ofeconomic downturn, while MEN and IND still benefit, yet to a lesser extent,from technology diffusion through the enlarged skilled diaspora.
However, human capital, or labor inputs in general, is not the only factorused in the production of goods, but physical capital also plays an indispens-able role. As mentioned in Section 1, the traditional trade theory predictsthat in an open economy skill outflows are accompanied by capital flight,whereas the recent empirical literature suggests a dynamic complementarylink between migration and FDI inflows. Thus, it is important to gaugethe effect that is attributed to international capital flows, which respond en-dogenously to the migration shocks and their direct impacts. In order toachieve this aim, an alternative simulation is run with restricted flows ofphysical capital, which means that the demographic shock has no impacts onthe amount of physical capital available in each region nor on risk premiumsthat are associated with FDI inflows.42 Figure 8.c presents the after-shockconsequences under this scenario. The total impacts are now dictated by thechannels of demography and of human capital, which jointly determine thetotal efficient labor available for domestic production. Moreover, whetherpositive or negative, the impacts become of smaller magnitudes, with EASbeing the salient loser in the short-run mainly due to its large share of seniorresidents.
It is worth being pointed out, however, that in this scenario the relative
42In other words, Kt and πt are held at the baseline levels.
25
changes in technological progress remain the same as calibrated before.43
Its loss of influence when capital flows are restricted thus suggests that thetechnology channel works mainly through changes in capital investments indomestic production. Take LAC and CHI for example, the two regions mostadversely impacted in terms of relative changes in technological progress andalso the top two short-run losers in the usual calibration shown in Figure8.a. It is found that, when capital flows do not react to changes in inter-regional differences in returns to capital caused by changes in productionefficiency, the negative impact on LAC’s GDP per capita is downsized from0.6% to 0.1% in 2060, and for CHI, the negative impact of 0.5% is entirelyannulled. This alternative scenario teaches us a very important lesson, as itindicates that studies of brain drain in globalization shall not merely look atits direct implications on human capital and other economic determinants onwhich human capital have causal effects. As brain drain affects the economicenvironment in the South, other factor flows will respond to these changes andmay act to magnify the total impacts of brain drain (e.g., through changesin technological progress) or to alleviate the negative effects (e.g., throughincreased FDI inflows attracted by lower risk premiums).
Finally, given the recent evidence that the skilled may have lower propen-sity to remit (see Section 2.2), another alternative simulation is conductedassuming the shock of additional skilled emigration does not add to theamount of remittance receipts. As shown in Figure 8.d, the total impactsare very much identical to the results with the usual calibration.44 In otherwords, in terms of domestic production in the developing regions, the im-pacts of brain drain and its direct and indirect effects are hardly altered byremittance receipts. This is not a surprising outcome because: first, notall remittances are invested in productive activities; second, capital mobilityimplies that the remittance-funded investments do not necessarily take placein the South, but conform to international arbitrage.
3.3. Total impacts on GNI per capita
The total impacts of the demographic shock on GNI per capita are de-picted in Figure 9.a. Compared to the total impacts on GDP per capita, thegeneral picture is slightly more optimistic. While the short-run winners and
43See Figure 5.b.44In fact, the total impacts do become slightly more pessimistic when the additional
skilled emigrants send back no remittances, but the magnitudes are nearly undetectable.
26
losers remain the same, the magnitudes of negative impacts are decreased(from 0.2-0.6% to 0.0-0.4% in 2060) whereas the scale of positive impacts areincreased (from 0.5-0.8% to 0.7-1.0% in 2060). Recall the definition of GNIthat it comprises of domestic outputs, remittances receipts, residents’ foreignassets, and so on. Hence, the similar patterns between the total impacts onGNI per capita and on GDP per capita suggest that the dominant channelsremain the same as those dictate the impacts on domestic production, i.e.,the major effects work through changes in resident human capital and intechnological progress. This can be confirmed by the results shown in thetwo alternative simulations: one lacks the incentive effect on human capi-tal formation (see Figure 9.b) and the other has restricted flows of physicalcapital that buffer the South from the impacts on production efficiency (seeFigure 9.c).
However, the additional remittance receipts, which have a dynamic effectto raise residents’ assets via saving, act to improve the welfare of those leftbehind. The importance of the role played by remittances can be gaugedin Figure 9.d. It is observed that, when compared to the simulation withusual calibration, all regions are negatively affected in the alternative sce-nario where the skilled have lower propensity to remit, although some suffermore and others less. Take the period 2060 for example. MEN and SSAare the hardest hit regions because they receive relatively large amounts ofremittances with respect to their GDP (see Table 1). While MEN sees thepositive impact on its GNI per capita dwindled from 0.7% to 0.5%, SSA hasthe total impact changed from nil to -0.1%.
3.4. Total impacts on skilled-to-less-skilled income inequality
Since brain drain does not only impact the overall economic outcome butentails distributional effects, it is important to study how the skilled-to-less-skilled income inequality is affected by the migration shocks. Figure 10.adepicts the total impacts with the usual calibration, while Figures 10.c to dpresent the results under the alternative simulations as described before.
Consistent with the model where skilled and less-skilled labor are imper-fect substitutes (see Eq. (8)), it is found that the total impacts on inequalityis solely determined by the human capital channel: income inequality de-creases (by 0.6-1.8% in 2060) due to the declined skill wage premiums re-sulted from a positive change in resident human capital, and vice versa. Thisis specifically confirmed in the alternative scenario that lacks the incentiveeffect on human capital formation: in Figure 10.b, all developing regions
27
experience rising income inequality (by 0.2-1.0% in 2060) due to larger skilloutflows, which is in contrary to all other scenarios where “brain gain” even-tually leads to a smaller income gap between skill types. Moreover, sinceregions with high skilled emigration rates (e.g., EAS, LAC, and SSA) areless likely to benefit from brain gain at least in the short-run, they are alsothe regions witnessing short-run rises in income inequality when the incentiveeffect is present.
4. Conclusion
Many concerns as well as hopes have been raised over the issue of braindrain, in particular skill outflows from the developing South to the developedNorth. On the one hand, the direct impact of losing skilled human capitaland its potentially negative externality may do harms to domestic productionand adversely affect those left behind in the developing economies. On theother hand, recent empirical studies have demonstrated a series of positivefeedback effects, suggesting that skilled emigration may inspire more humancapital formation and that, on top of remittances, emigrants may contributeto the home economy through diaspora externalities.
The novelty of this paper is to construct a unified generic frameworkthat is capable of combining many direct impacts of brain drain; moreover,their interactions and other indirect effects are also endogenously generated.In this fashion, the framework is able to assess the global effects of braindrain on developing economies and to quantify the relative sizes of variousstatic and dynamic impacts. Furthermore, it allows us to incorporate manyessential channels, such as age structure and capital flows, through whichbrain drain directly or indirectly impacts the developing economies, yet theyare usually not studied in a less comprehensive partial equilibrium setting.
It is identified that the short-run impact of brain drain on resident humancapital is extremely crucial, since it does not only determine the number ofskilled workers available for domestic production, but it also affects an econ-omy’s capacity to innovate or to adopt modern technologies, which acts todetermine the production efficiency and greatly influence the volume of cap-ital in- and out-flows. Therefore, it follows that, when the incentive effect onhuman capital formation is absent, economies in all the sending regions be-come very much worse off (see Figure 11.a). Moreover, the impacts workingthrough the technology channel are magnified in the open economy wherecapital investments conform to international arbitrage. Thus, when flows of
28
physical capital are restricted, it is observed that those regions experiencingpositive impacts on GDP per capita now enjoy more limited benefits, whereasthe regions suffering from slowdowns in technological progress are more insu-lated from foreign capital retreat and native capital flight (see Figure 11.b).
Moreover, although not all remittance receipts are invested in the do-mestic production, the extra income received from migrants abroad is non-negligible in improving the welfare of those left behind. Consequently, ifskilled migrants have a lower propensity to remit than their less-skilled coun-terpart as concluded by some empirical studies, the beneficial effect of braindrain through remittances on GNI per capita will then be reduced (see Fig-ure 11.c), and the impact scales of brain drain on income in the South will belargely dictated by its impacts on GDP per capita. Regarding the impactsof brain drain on the skilled-to-less-skilled income inequality, it is mainlydetermined by the skill composition of resident human capital; as a result,whether a region enjoys “brain gain” also implies whether its income inequal-ity is decreased or not. Without the presence of the incentive effect on humancapital formation, every region will witness an enlarging income gap betweenskilled and less-skilled workers (see Figure 11.d).
As mentioned in Section 2.3, our aggregate regional approach has thesimulated results more indicative of those experienced by large countries.Despite this disadvantage, the aggregate results still provide significant im-plications also on the per country basis. Given the importance of how braindrain impacts resident human capital in the short-run and its ensuing dy-namic effects on technological progress, it is concluded that countries withhigh skilled emigration rates are the most vulnerable to increased skilled em-igration, as Beine et al. (2008a) provides evidence that they are the leastlikely to benefit from “brain gain” out of brain drain. They are composed ofa long list of developing countries, especially in sub-Saharan Africa, CentralAmerica, and also many small states. Moreover, although international cap-ital mobility rewards the developing economies with enhanced technologicalprogress, it also magnifies the harms done by brain drain to the sending econ-omy by discouraging capital investments away from the negatively impactedregion in terms of technology.
Hence, is brain drain a curse or a boon? There is not a uniform an-swer, which varies with the sending country’s characteristics. For example,in Eastern European countries, brain drain does not only negatively affectsits short-run huamn capital, but it also significantly increases the burdenof their working-age residents to support the relatively large share of re-
29
tirees. Besides, for the technologically less-advanced countries where skilledemigration is not a prevalent phenomenon, brain drain may not be an un-welcome event not only because it has the potential to raise resident humancapital, but also because their skilled diaspora may facilitate the diffusionof up-to-date technologies, which accelerates technological progress in theseeconomies. However, the certain losers of brain drain are those countries thathave already experienced large outflows of their skilled, and their loss is notalleviated but magnified as it takes place in a globalized world where skilloutflows generate influences also upon other flows of factors, most notablyphysical capital.
Acknowledgements The authors gratefully acknowledge financial sup-port from the Belgian Federal Government (PAI grant P6/07, “EconomicPolicy and Finance in the Global Economy: Equilibrium Analysis and So-cial Evaluation”), from the Belgian French-speaking community (Grant ARC03/08-302 “New Macroeconomic Approaches to the Development Problem”),and from the European Commission (Marie Curie Research Training Net-work “Transnationality of Migrants”). We thank Hillel Rapoport for manyinsightful and valuable comments. All remaining errors are of course ours.
References
Acemoglu, D., 2002. Technical changes, inequaility, and the labor market.Journal of Economic Literature 40 (1), 7–72.
Acemoglu, D., 2003. Patterns of skill premia. Review of Economic Studies70 (2), 199–230.
Aglietta, M., Arezki, R., Breton, R., Chateau, J., Fayolle, J., Juillard, M.,Lacu, C., Cacheux, J. L., Rzepkowski, B., Touze, V., 2005. Scenariosfor global ageing: an investigation with the INGENUE 2 world model,ENEPRI Research Report No. 9.
Baffes, J., Mitchell, D., Riordan, E. M., Streifel, S., Timmer, H., Shaw, W.,2009. Global economic prospects 2009: commodities at the crossroads.The International Bank for Reconstruction and Development / The WorldBank, Washington DC.
30
Barham, B., Boucher, S., 1998. Migration, remittances and inequality: es-timating the net effects of migration on income distribution. Journal ofDevelopment Economics 55 (2), 307–331.
Barro, R. J., Lee, J.-W., 2001. International data on educational attainment:updates and implications. Oxford Economic Papers 53 (3), 541–563.
Beine, M., Docquier, F., Rapoport, H., 2001. Brain drain and economicgrowth: theory and evidence. Journal of Development Economics 64 (1),275–289.
Beine, M., Docquier, F., Rapoport, H., 2008a. Brain drain and human capitalformation in developing countries: winners and losers. Economic Journal118 (528), 631–652.
Beine, M., Docquier, F., Schiff, M., 2008b. International migration, transfersof norms and home country fertility, IZA Discussion Papers No. 3912.
Bhagwati, J. N., 1972. The united states in the nixon era: the end of inno-cence. Daedalus, 25–47.
Bhagwati, J. N. (Ed.), 1976a. The Brain Drain and Taxation, Vol. 2: Theoryand Empricial Analysis. North-Holland, Amsterdam.
Bhagwati, J. N. (Ed.), 1976b. Taxing the Brain Drain, Vol. 1: A Proposal.North-Holland, Amsterdam.
Bhagwati, J. N., Hamada, K., 1974. The brain drain, international inte-gration of markets for professionals and unemployment : A theoreticalanalysis. Journal of Development Economics 1 (1), 19–42.
Bhagwati, J. N., Hamada, K., 1975. Domestic distortions, imperfect infor-mation and the brain drain. Journal of Development Economics 2 (3),265–279.
Card, D., 2009. Immigration and inequality. American Economic Review99 (2), 1–21.
Caselli, F., 2007. The marginal product of capital. Quarterly Journal of Eco-nomics 122 (2), 535–568.
31
Cervellati, M., Sunde, U., 2005. Human capital formation, life expectancy,and the process of development. American Economic Review 95 (5), 1653–1672.
Chiquiar, D., Hanson, G. H., 2005. International migration, self-selection,and the distribution of wages: evidence from mexico and the united states.Journal of Political Economy 113 (2), 239–281.
Clemens, M. A., Pritchett, L., 2008. Income per natural: measuring devel-opment for people rather than places. Population and development review34 (3), 395–434.
Commander, S., Kangasniemi, M., Winters, L. A., 2004. The brain drain:curse or boon? a survey of the literature. In: Baldwin, R. E., Winters,L. A. (Eds.), Challenges to globalization: analyzing the economics. ChicagoUniversity Press, Chicago, Ch. 7, pp. 235–272.
de la Croix, D., Docquier, F., 2007. School attendance and skill premiums infrance and the u.s.: a general equilibrium approach. Fiscal Studies 28 (4),383–416.
Defoort, C., 2008. Tendances de long terme en migrations internationales:analyse a partir de 6 pays receveurs. Population-F 63 (2), 317–352.
Docquier, F., Lodigiani, E., 2009. Skilled migration and business networks.Open Economic Review, in press.
Docquier, F., Lowell, B. L., Marfouk, A., 2009. A gendered assessment ofhighly skilled emigration. Population and Development Review, in press.
Docquier, F., Marfouk, A., 2006. International migration by educational at-tainment (1990-2000). In: Ozden, C., Schiff, M. (Eds.), International mi-gration, remittances and the brain drain. Palgrave-Macmillan, Washing-ton, Ch. 5, pp. 151–199.
Docquier, F., Rapoport, H., 2009. Quantifying the impact of highly-skilledemigration on developing countries, Mimeo, CEPR project, FondazioneRodolfo Debenedetti.
Faini, R., 2007. Remittances and the brain drain: Do more skilled migrantsremit more? World Bank Economic Review 21 (2), 177–191.
32
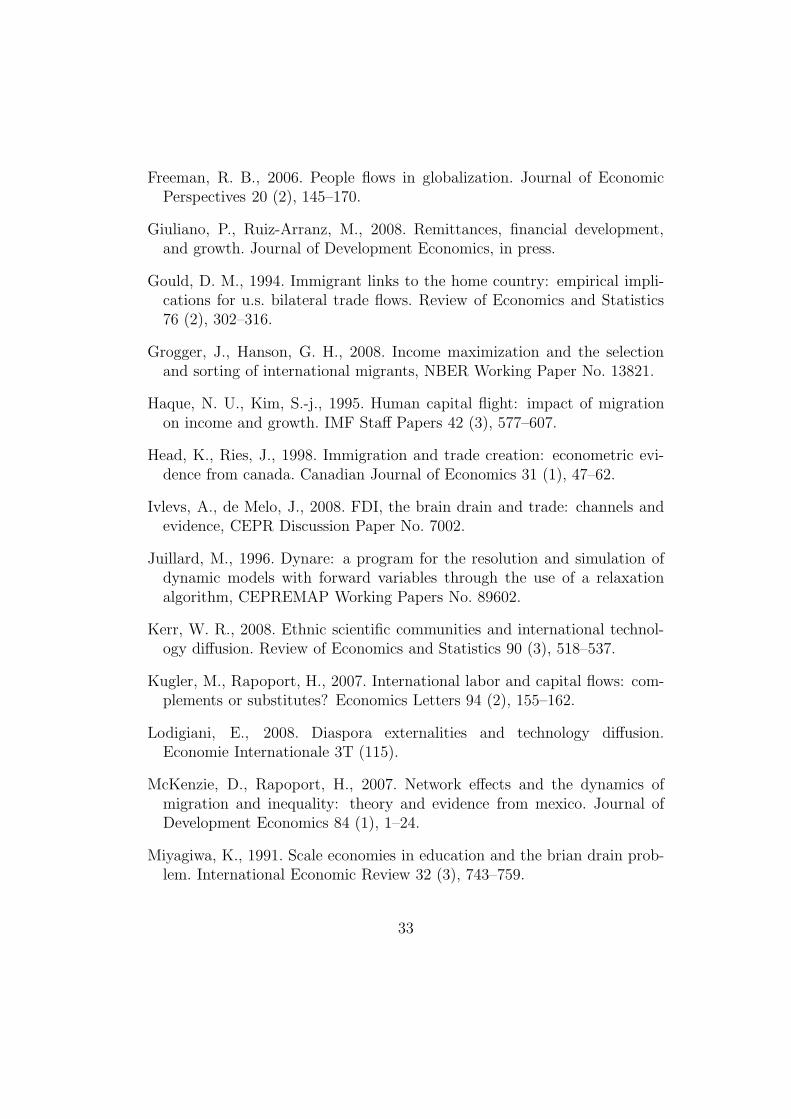
Freeman, R. B., 2006. People flows in globalization. Journal of EconomicPerspectives 20 (2), 145–170.
Giuliano, P., Ruiz-Arranz, M., 2008. Remittances, financial development,and growth. Journal of Development Economics, in press.
Gould, D. M., 1994. Immigrant links to the home country: empirical impli-cations for u.s. bilateral trade flows. Review of Economics and Statistics76 (2), 302–316.
Grogger, J., Hanson, G. H., 2008. Income maximization and the selectionand sorting of international migrants, NBER Working Paper No. 13821.
Haque, N. U., Kim, S.-j., 1995. Human capital flight: impact of migrationon income and growth. IMF Staff Papers 42 (3), 577–607.
Head, K., Ries, J., 1998. Immigration and trade creation: econometric evi-dence from canada. Canadian Journal of Economics 31 (1), 47–62.
Ivlevs, A., de Melo, J., 2008. FDI, the brain drain and trade: channels andevidence, CEPR Discussion Paper No. 7002.
Juillard, M., 1996. Dynare: a program for the resolution and simulation ofdynamic models with forward variables through the use of a relaxationalgorithm, CEPREMAP Working Papers No. 89602.
Kerr, W. R., 2008. Ethnic scientific communities and international technol-ogy diffusion. Review of Economics and Statistics 90 (3), 518–537.
Kugler, M., Rapoport, H., 2007. International labor and capital flows: com-plements or substitutes? Economics Letters 94 (2), 155–162.
Lodigiani, E., 2008. Diaspora externalities and technology diffusion.Economie Internationale 3T (115).
McKenzie, D., Rapoport, H., 2007. Network effects and the dynamics ofmigration and inequality: theory and evidence from mexico. Journal ofDevelopment Economics 84 (1), 1–24.
Miyagiwa, K., 1991. Scale economies in education and the brian drain prob-lem. International Economic Review 32 (3), 743–759.
33
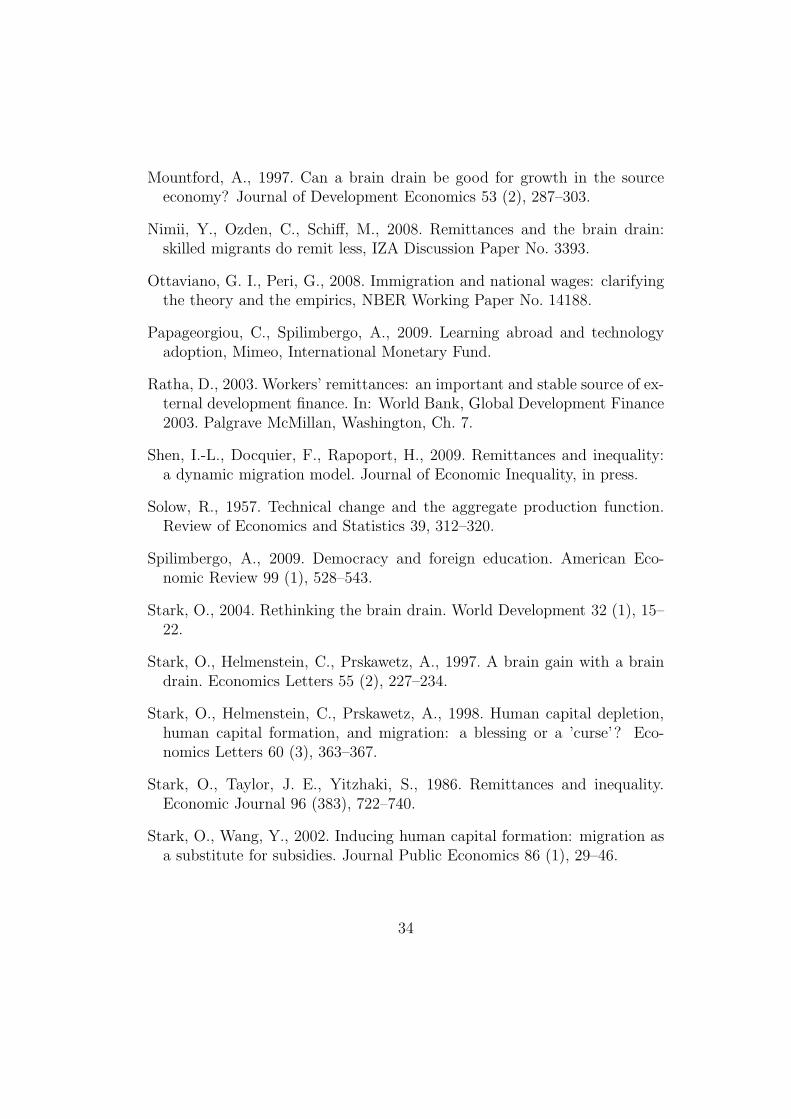
Mountford, A., 1997. Can a brain drain be good for growth in the sourceeconomy? Journal of Development Economics 53 (2), 287–303.
Nimii, Y., Ozden, C., Schiff, M., 2008. Remittances and the brain drain:skilled migrants do remit less, IZA Discussion Paper No. 3393.
Ottaviano, G. I., Peri, G., 2008. Immigration and national wages: clarifyingthe theory and the empirics, NBER Working Paper No. 14188.
Papageorgiou, C., Spilimbergo, A., 2009. Learning abroad and technologyadoption, Mimeo, International Monetary Fund.
Ratha, D., 2003. Workers’ remittances: an important and stable source of ex-ternal development finance. In: World Bank, Global Development Finance2003. Palgrave McMillan, Washington, Ch. 7.
Shen, I.-L., Docquier, F., Rapoport, H., 2009. Remittances and inequality:a dynamic migration model. Journal of Economic Inequality, in press.
Solow, R., 1957. Technical change and the aggregate production function.Review of Economics and Statistics 39, 312–320.
Spilimbergo, A., 2009. Democracy and foreign education. American Eco-nomic Review 99 (1), 528–543.
Stark, O., 2004. Rethinking the brain drain. World Development 32 (1), 15–22.
Stark, O., Helmenstein, C., Prskawetz, A., 1997. A brain gain with a braindrain. Economics Letters 55 (2), 227–234.
Stark, O., Helmenstein, C., Prskawetz, A., 1998. Human capital depletion,human capital formation, and migration: a blessing or a ’curse’? Eco-nomics Letters 60 (3), 363–367.
Stark, O., Taylor, J. E., Yitzhaki, S., 1986. Remittances and inequality.Economic Journal 96 (383), 722–740.
Stark, O., Wang, Y., 2002. Inducing human capital formation: migration asa substitute for subsidies. Journal Public Economics 86 (1), 29–46.
34
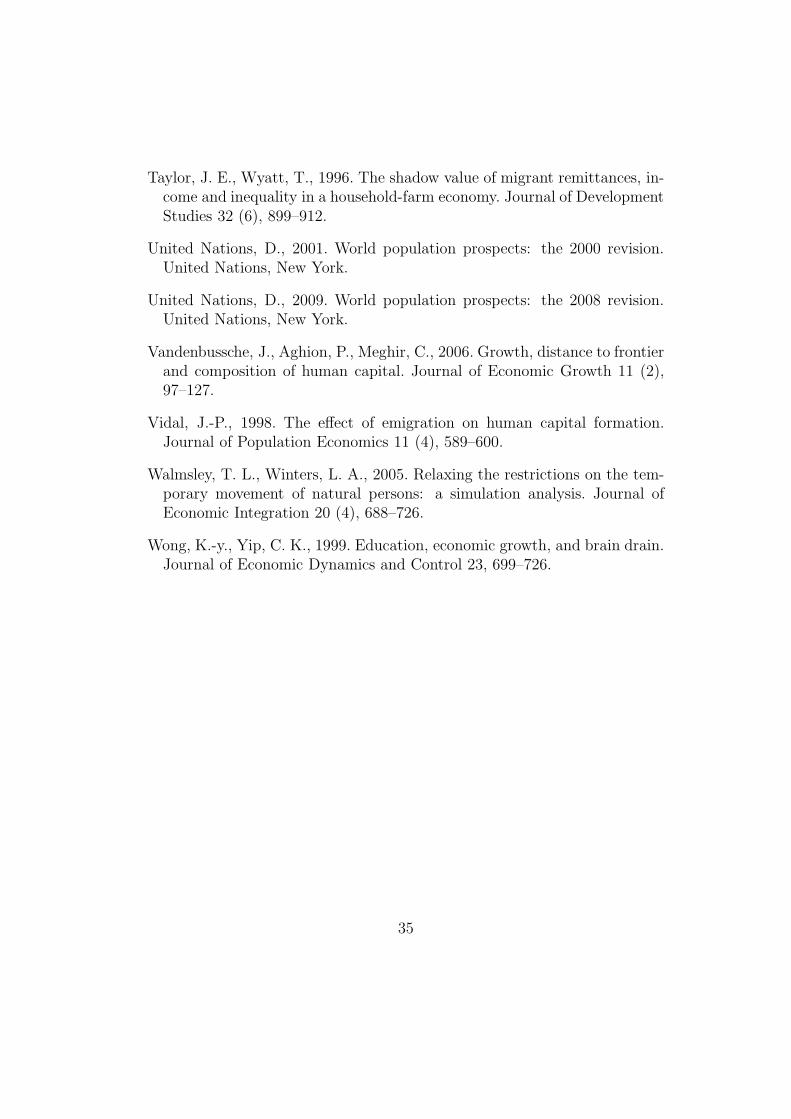
Taylor, J. E., Wyatt, T., 1996. The shadow value of migrant remittances, in-come and inequality in a household-farm economy. Journal of DevelopmentStudies 32 (6), 899–912.
United Nations, D., 2001. World population prospects: the 2000 revision.United Nations, New York.
United Nations, D., 2009. World population prospects: the 2008 revision.United Nations, New York.
Vandenbussche, J., Aghion, P., Meghir, C., 2006. Growth, distance to frontierand composition of human capital. Journal of Economic Growth 11 (2),97–127.
Vidal, J.-P., 1998. The effect of emigration on human capital formation.Journal of Population Economics 11 (4), 589–600.
Walmsley, T. L., Winters, L. A., 2005. Relaxing the restrictions on the tem-porary movement of natural persons: a simulation analysis. Journal ofEconomic Integration 20 (4), 688–726.
Wong, K.-y., Yip, C. K., 1999. Education, economic growth, and brain drain.Journal of Economic Dynamics and Control 23, 699–726.
35
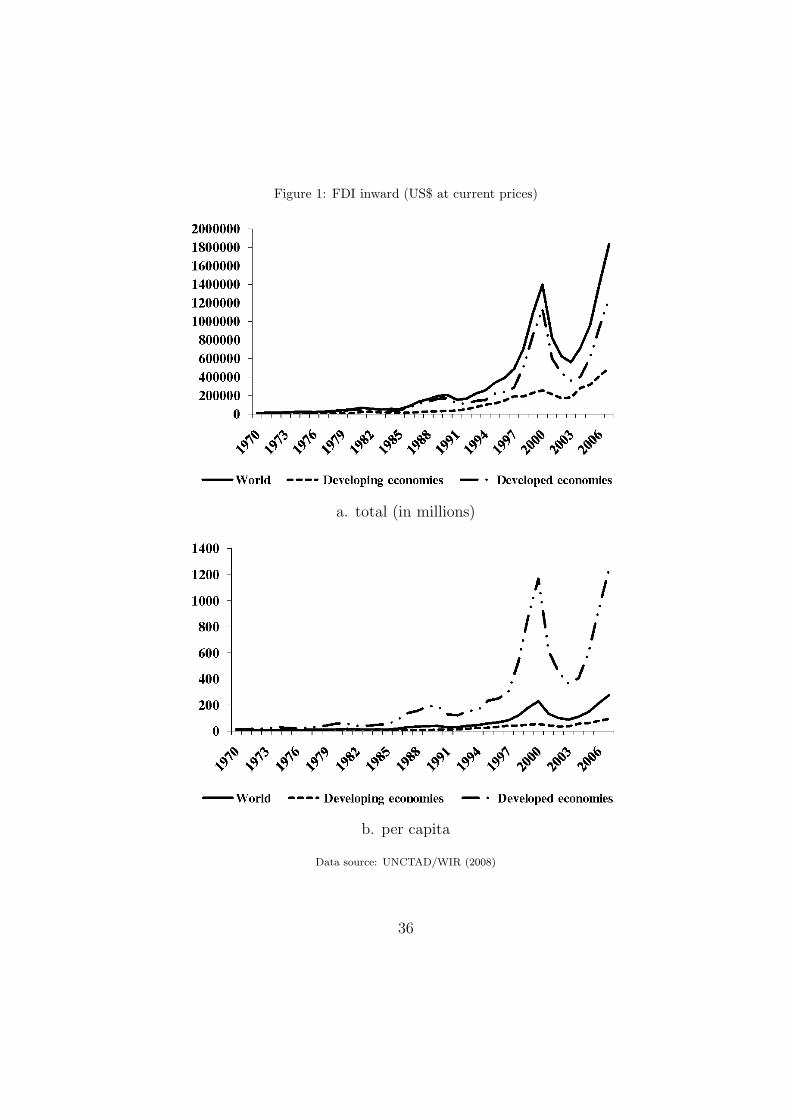
Figure 1: FDI inward (US$ at current prices)
a. total (in millions)
b. per capita
Data source: UNCTAD/WIR (2008)
36
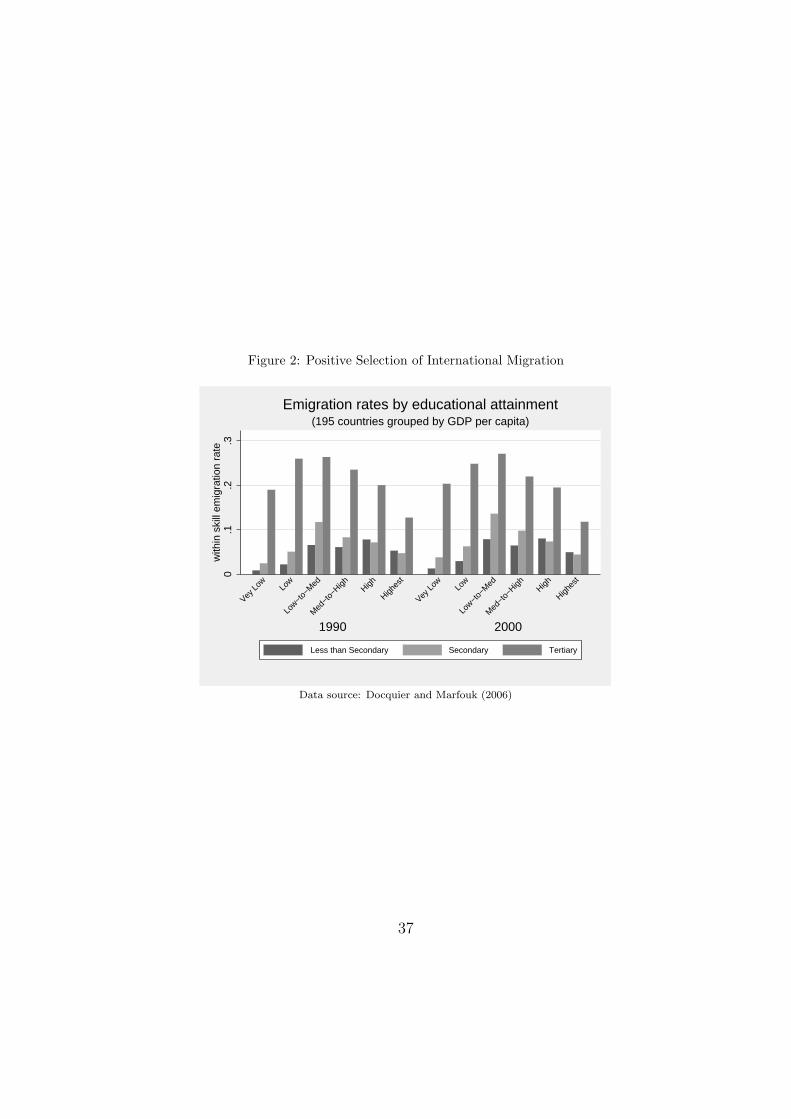
Figure 2: Positive Selection of International Migration
0.1
.2.3
with
in s
kill
emig
ratio
n ra
te
1990 2000
Vey L
ow Low
Low−t
o−M
ed
Med
−to−
High High
Highes
t
Vey L
ow Low
Low−t
o−M
ed
Med
−to−
High High
Highes
t
(195 countries grouped by GDP per capita)Emigration rates by educational attainment
Less than Secondary Secondary Tertiary
Data source: Docquier and Marfouk (2006)
37
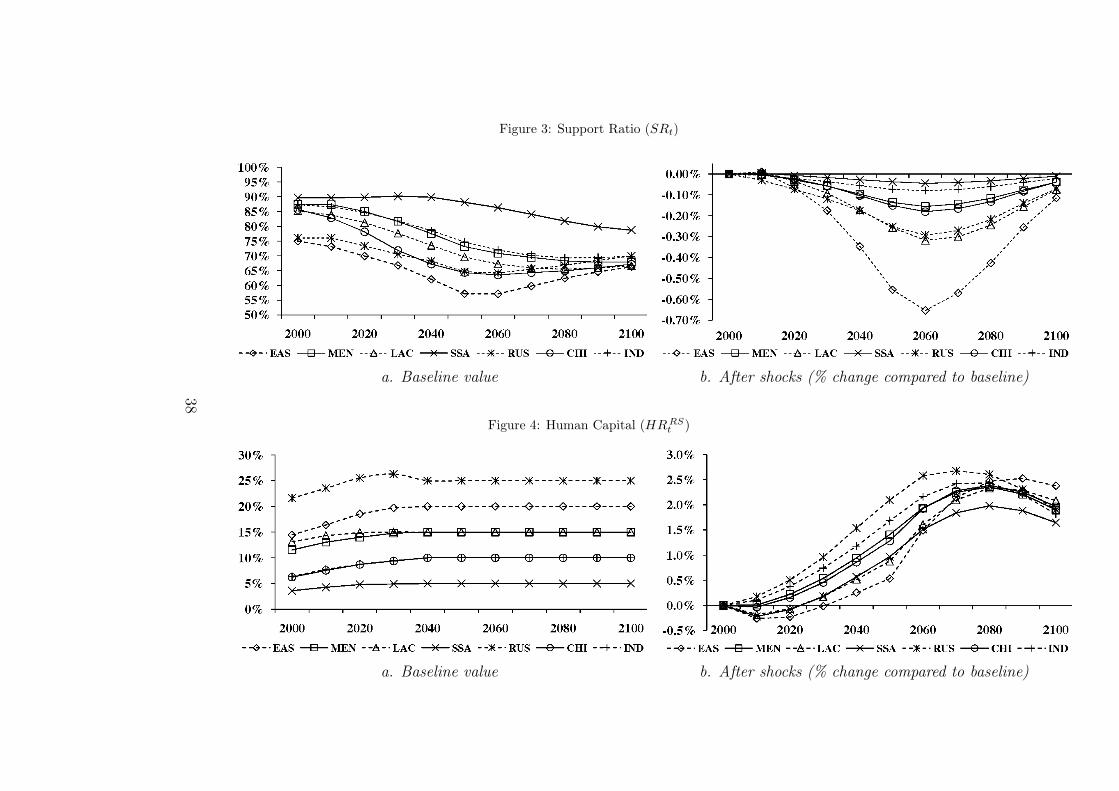
Figure 3: Support Ratio (SRt)
a. Baseline value b. After shocks (% change compared to baseline)
Figure 4: Human Capital (HR RSt )
a. Baseline value b. After shocks (% change compared to baseline)
38
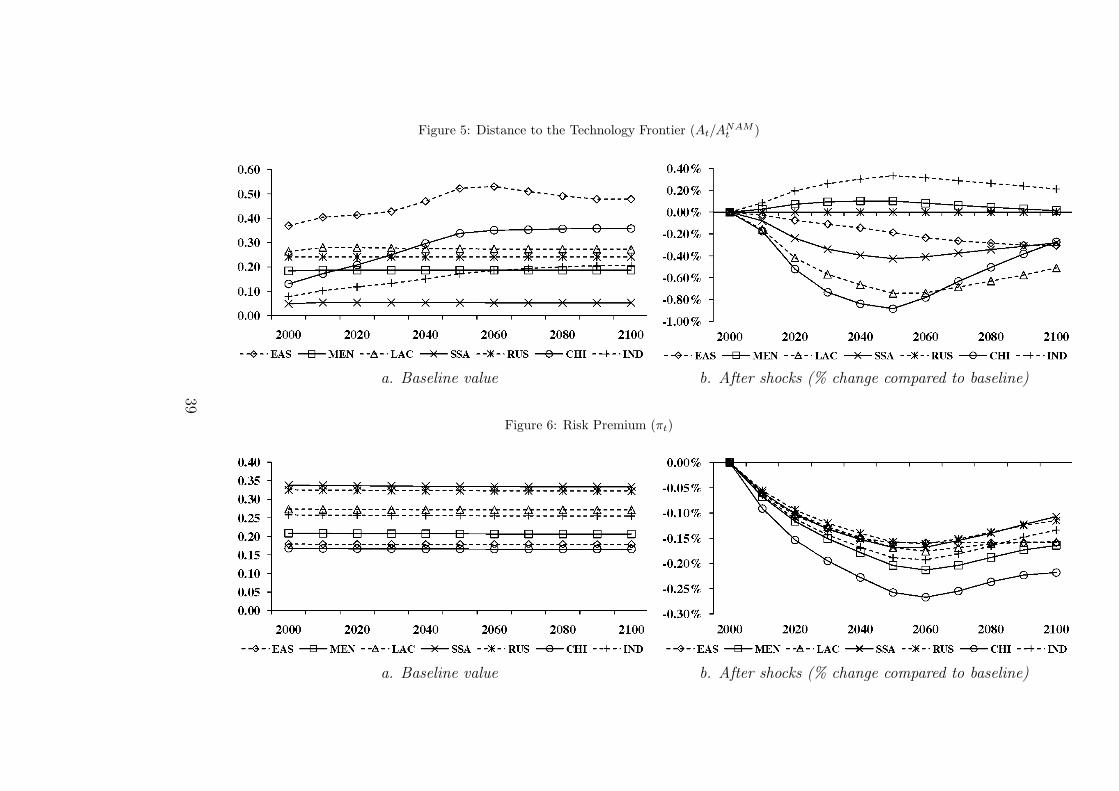
Figure 5: Distance to the Technology Frontier (At/ANAMt )
a. Baseline value b. After shocks (% change compared to baseline)
Figure 6: Risk Premium (πt)
a. Baseline value b. After shocks (% change compared to baseline)
39
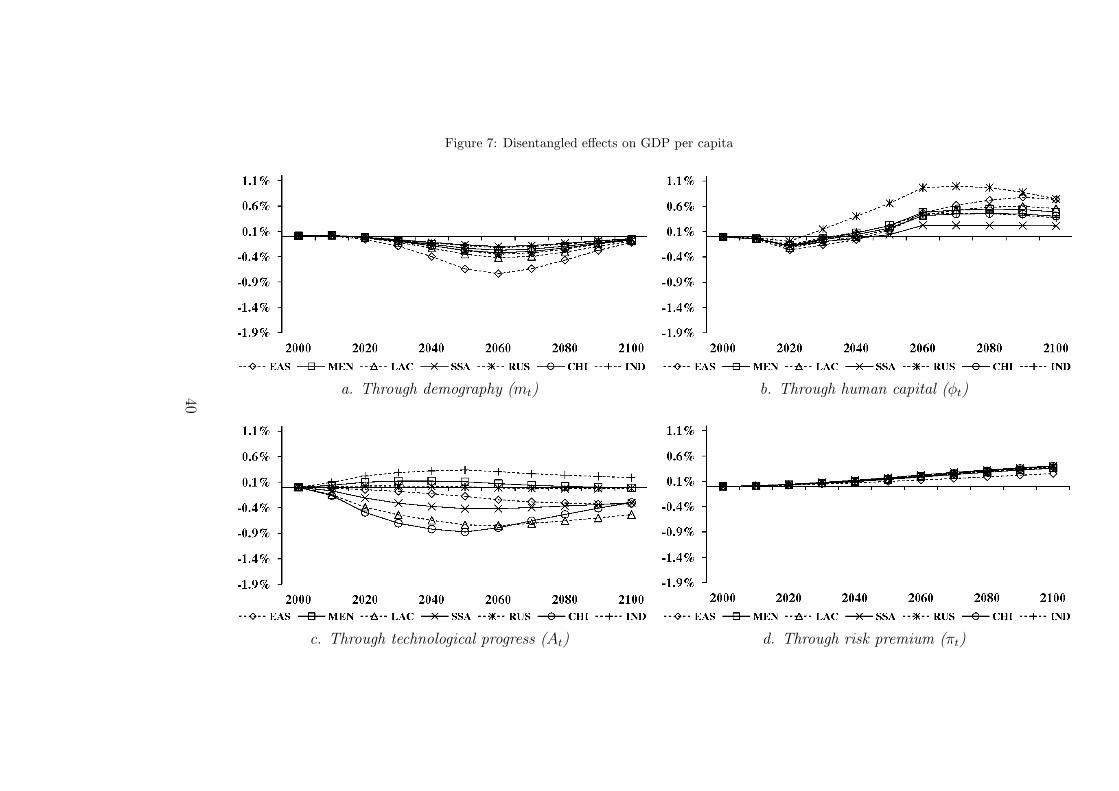
Figure 7: Disentangled effects on GDP per capita
a. Through demography (mt) b. Through human capital (φt)
c. Through technological progress (At) d. Through risk premium (πt)
40
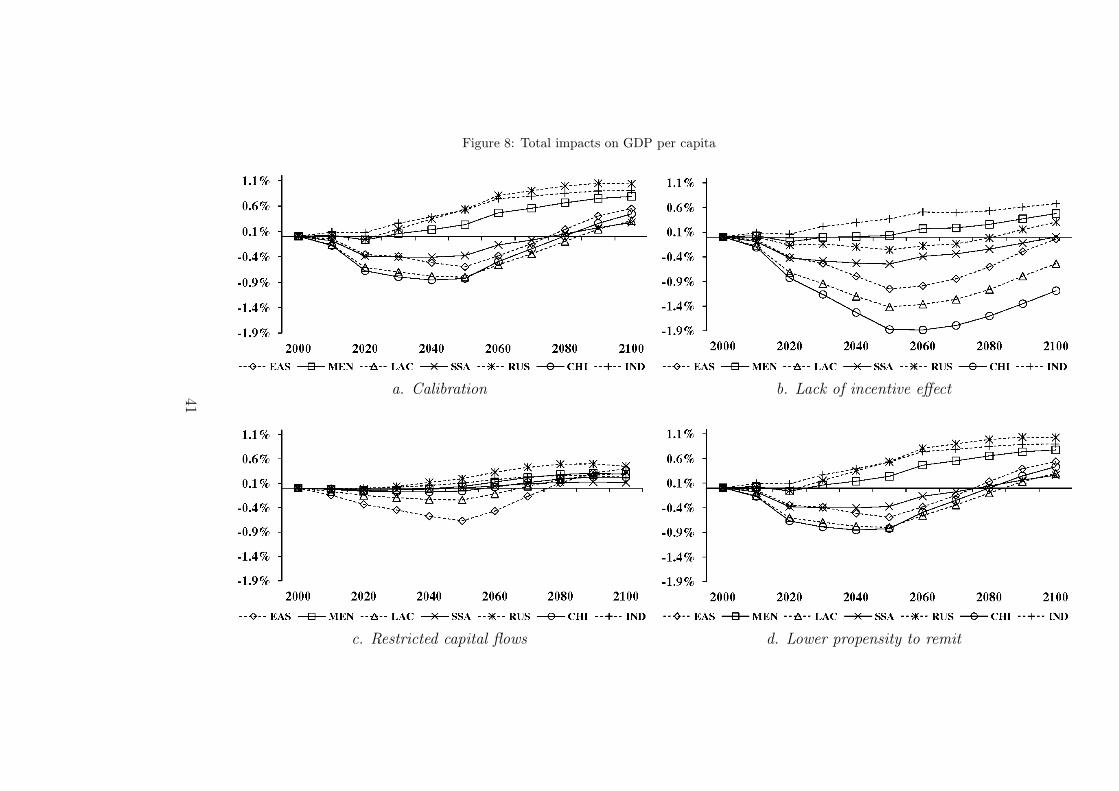
Figure 8: Total impacts on GDP per capita
a. Calibration b. Lack of incentive effect
c. Restricted capital flows d. Lower propensity to remit
41
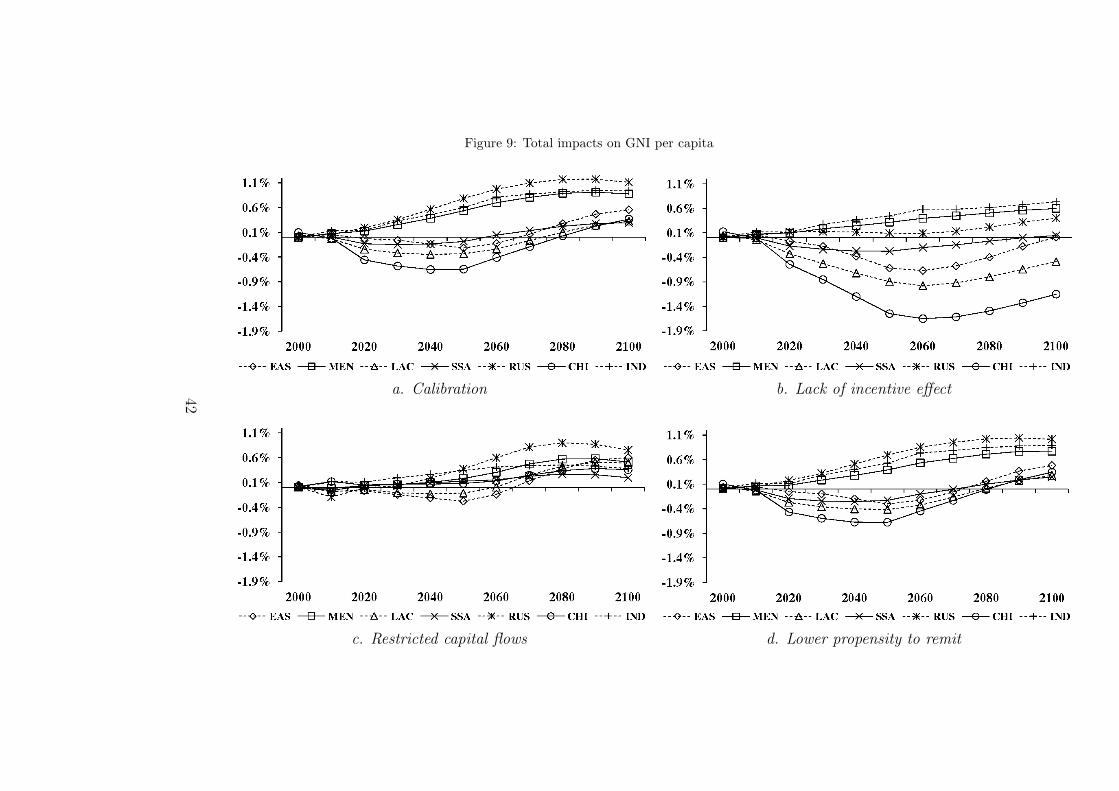
Figure 9: Total impacts on GNI per capita
a. Calibration b. Lack of incentive effect
c. Restricted capital flows d. Lower propensity to remit
42
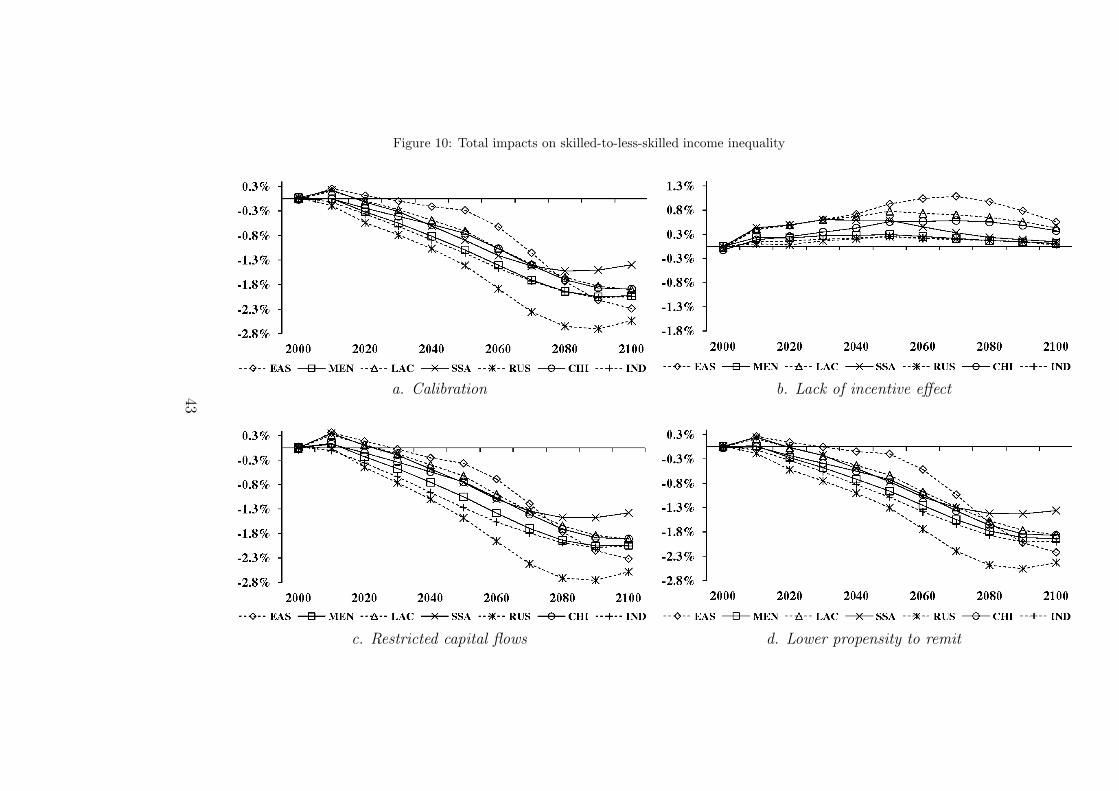
Figure 10: Total impacts on skilled-to-less-skilled income inequality
a. Calibration b. Lack of incentive effect
c. Restricted capital flows d. Lower propensity to remit
43
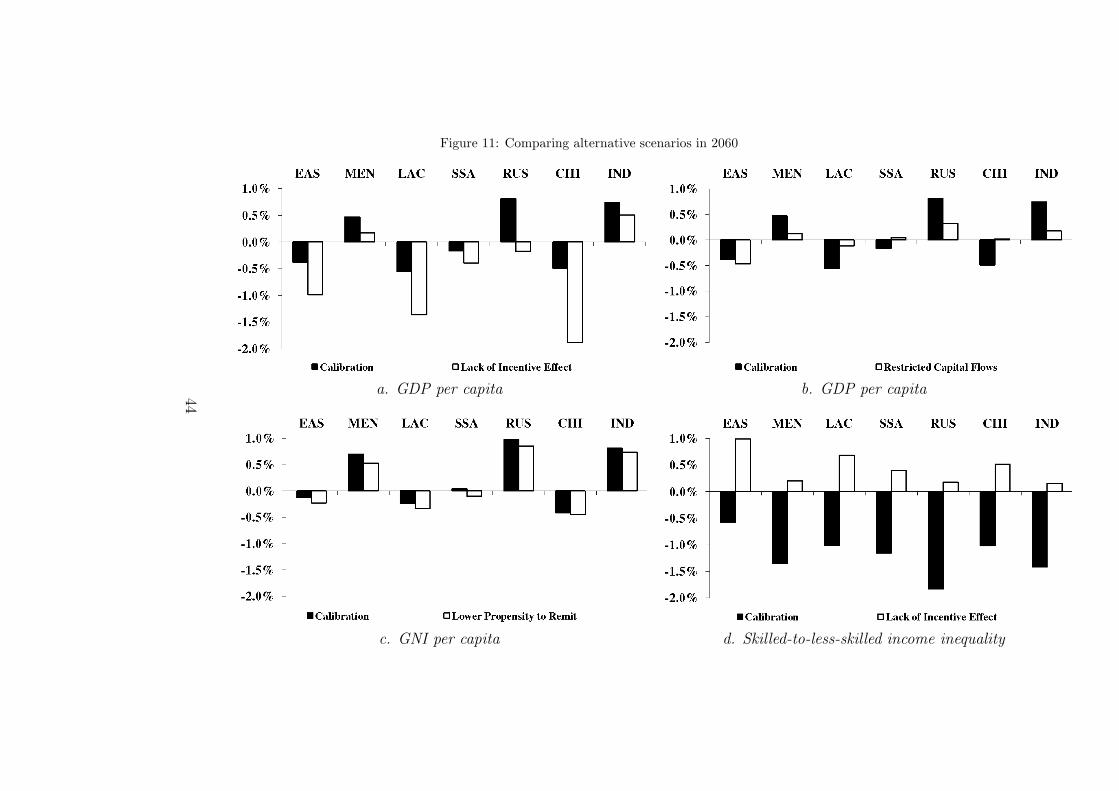
Figure 11: Comparing alternative scenarios in 2060
a. GDP per capita b. GDP per capita
c. GNI per capita d. Skilled-to-less-skilled income inequality
44

Table A.1: List of countries by region
Region
Code
Region
Name
Countries
NAM NorthAmerica
United States, and Canada.
ADV AdvancedCountries
Australia, Austria, Belgium, Denmark, Finland, France, Ger-many, Greece, Iceland, Ireland, Italy, Luxembourg, Netherlands,New Zealand, Norway, Portugal, Spain, Sweden, Switzerland, andUnited Kingdom.
JAP Japan Japan.EAS Eastern
EuropeAlbania, Bosnia and Herzegovina, Bulgaria, Croatia, Czech Re-public, Estonia, Hungary, Latvia, Lithuania, Macedonia, Poland,Romania, Serbia and Montenegro, Slovakia, and Slovenia.
MEN MiddleEast andNorthAfrica
Algeria, Bahrain, Cyprus, Egypt, Iran, Iraq, Israel, Jordan,Kuwait, Lebanon, Libyan Arab Jamahiriya, Malta, Morocco, Oc-cupied Palestinian Territory, Oman, Qatar, Saudi Arabia, Syr-ian Arab Republic, Tunisia, Turkey, United Arab Emirates, andYemen.
LAC LatinAmer-ica andCaribbean
Argentina, Bahamas, Barbados, Belize, Bolivia, Brazil, Chile,Colombia, Costa Rica, Cuba, Dominican Republic, Ecuador, ElSalvador, Guatemala, Guyana, Haiti, Honduras, Jamaica, Mexico,Nicaragua, Panama, Paraguay, Peru, Saint Lucia, Saint Vincentand the Grenadines, Suriname, Trinidad and Tobago, Uruguay,and Venezuela.
SSA Sub-SaharanAfrica
Angola, Benin, Botswana, Burkina Faso, Burundi, Cameroon,Cape Verde, Central African Republic, Chad, Comoros, Congo,Congo Democratic Republic, Djibouti, Equatorial Guinea, Er-itrea, Ethiopia, Ivory Coast, Gabon, Gambia, Ghana, Guinea,Guinea-Bissau, Kenya, Lesotho, Liberia, Madagascar, Malawi,Mali, Mauritania, Mauritius, Mozambique, Namibia, Niger, Nige-ria, Rwanda, Sao Tome and Principe, Senegal, Sierra Leone, So-malia, South Africa, Sudan, Swaziland, Tanzania, Togo, Uganda,Zambia, and Zimbabwe.
RUS FormerSovietUnion
Armenia, Azerbaijan, Belarus, Georgia, Kazakhstan, Kyrgyzstan,Moldova, Russian Federation, Tajikistan, Turkmenistan, Ukraine,and Uzbekistan.
CHI ChineseWorld
Brunei, Burma, Cambodia, China, East Timor, Hong Kong, Ko-rea, Lao People’s Democratic Republic, Macau, Mongolia, Philip-pines, Singapore, Thailand, and Vietnam.
IND IndianWorldandPacificIslands
Afghanistan, Bangladesh, Bhutan, Federated States of Microne-sia, Fiji, India, Indonesia, Malaysia, Maldives, Nepal, Pakistan,Papua New Guinea, Samoa, Solomon Islands, Sri Lanka, Tonga,and Vanuatu.
45