BRAIN DRAIN AND IMPACT ON DEVELOPMENT OAS Special Committee on Migration 13 January 2009 Washington.
30
BRAIN DRAIN AND IMPACT ON DEVELOPMENT OAS Special Committee on Migration 13 January 2009 Washington
-
Upload
vernon-stone -
Category
Documents
-
view
240 -
download
0
Transcript of BRAIN DRAIN AND IMPACT ON DEVELOPMENT OAS Special Committee on Migration 13 January 2009 Washington.
BRAIN DRAIN AND IMPACT ON DEVELOPMENT
OAS Special Committee on Migration13 January 2009
Washington
2
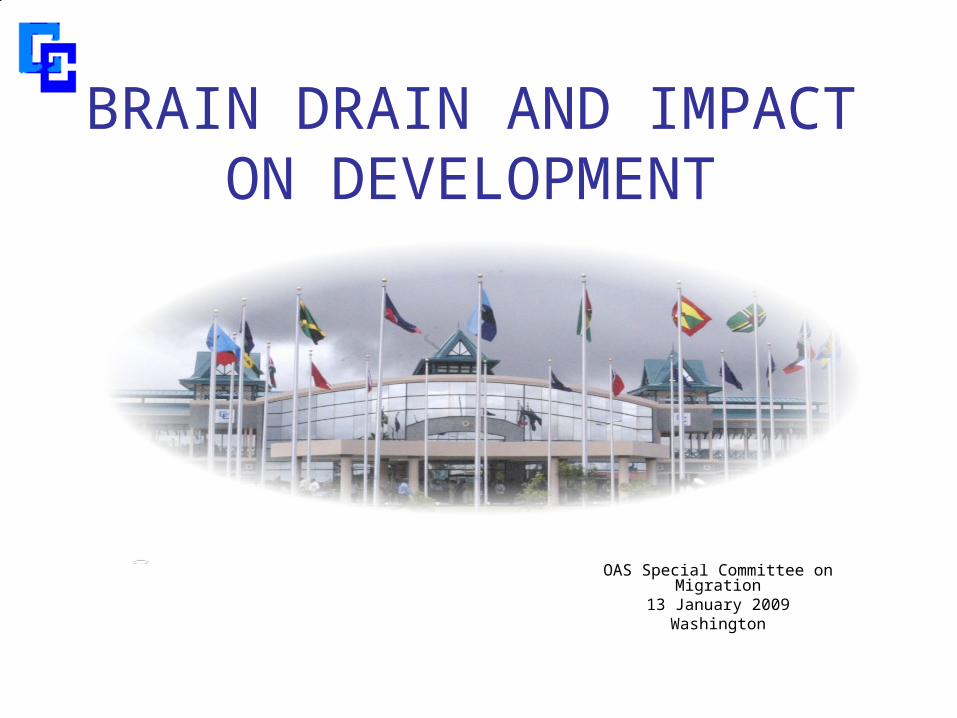
Presentation Outline
Background and Overview
Issues and Impacts
Policy Responses
3
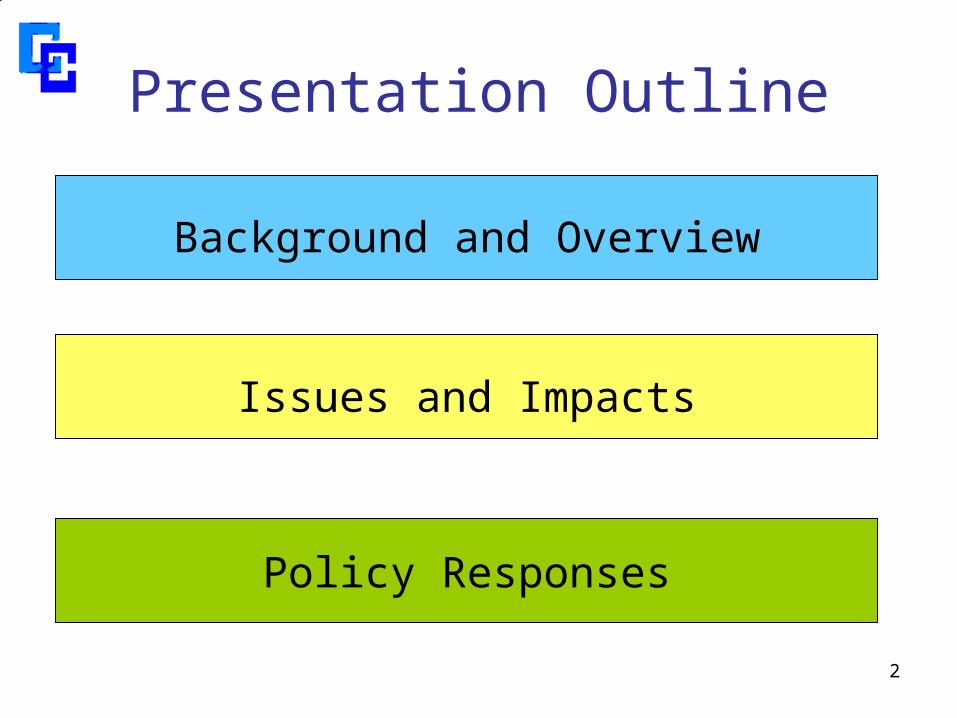
Brain drain• Outflow of persons
– Volume– Relative to the wider economic and social
environment– Compensatory movements
• Cost benefit analysis– Est 5% global liberalization of labour migration
could contribute $300b p.a to world welfare (greater than ODA or FDI)
– Even a more conservative increase by developed countries of 3% of their total workforce would increase world welfare by more than $150b p.a.
4
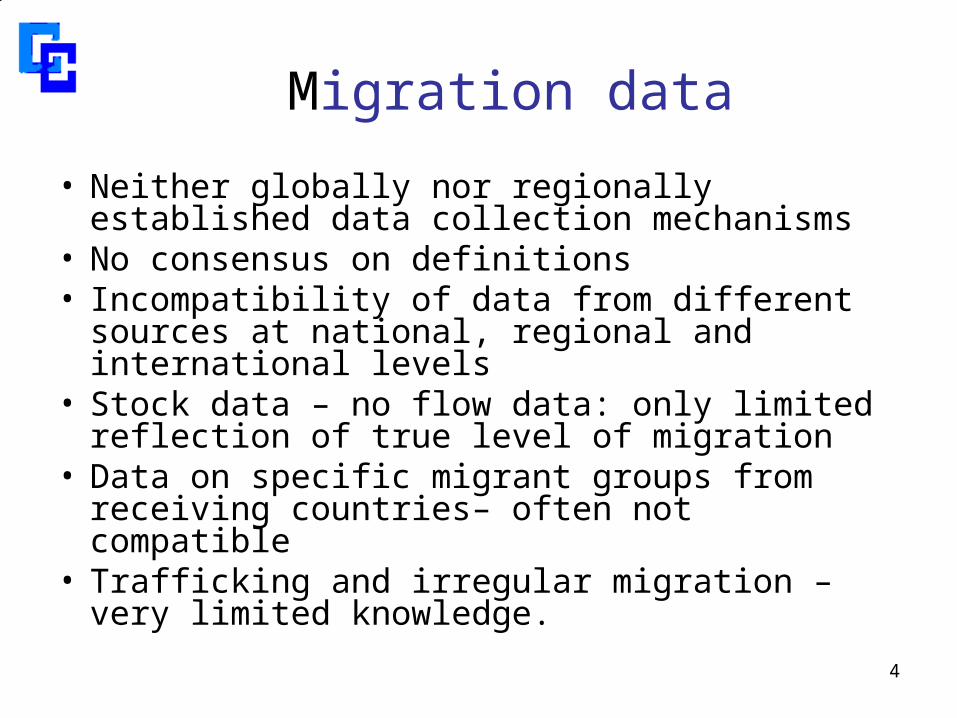
Migration data
• Neither globally nor regionally established data collection mechanisms
• No consensus on definitions• Incompatibility of data from different sources at
national, regional and international levels• Stock data – no flow data: only limited reflection
of true level of migration • Data on specific migrant groups from receiving
countries– often not compatible• Trafficking and irregular migration – very limited
knowledge.
5
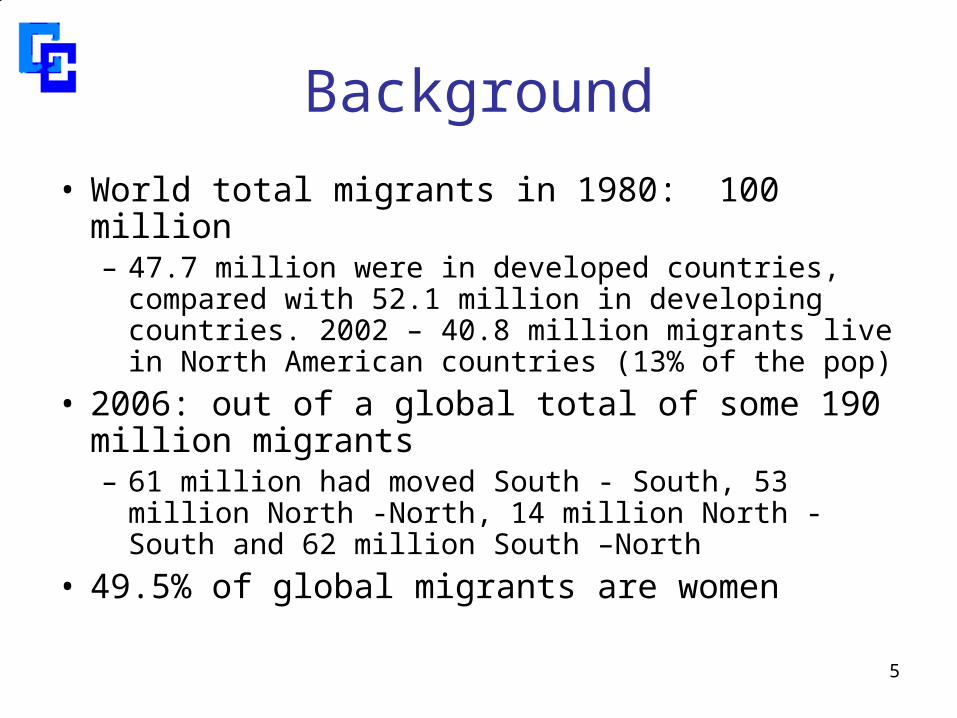
Background
• World total migrants in 1980: 100 million – 47.7 million were in developed countries, compared
with 52.1 million in developing countries. 2002 – 40.8 million migrants live in North American countries (13% of the pop)
• 2006: out of a global total of some 190 million migrants– 61 million had moved South - South, 53 million North -
North, 14 million North -South and 62 million South –North
• 49.5% of global migrants are women
6
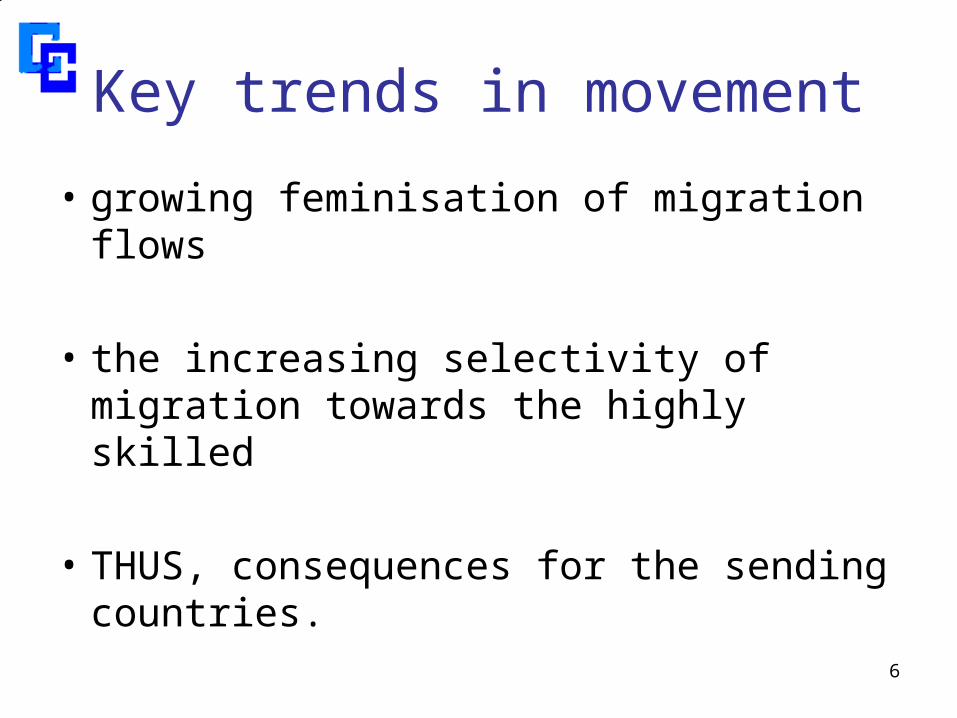
Key trends in movement
• growing feminisation of migration flows
• the increasing selectivity of migration towards the highly skilled
• THUS, consequences for the sending countries.
7
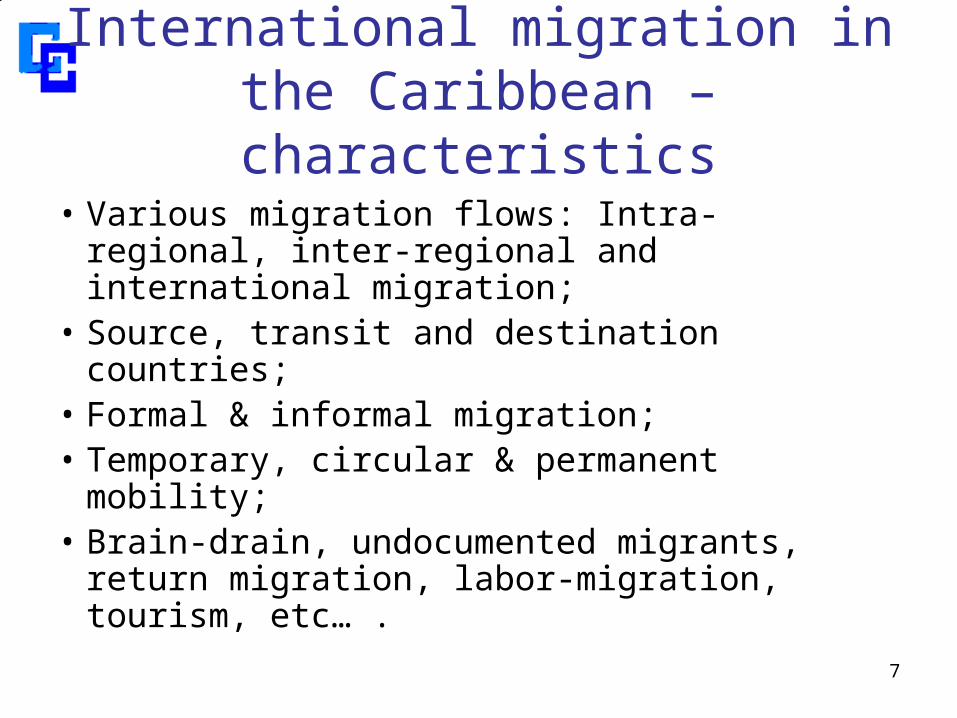
International migration in the Caribbean – characteristics
• Various migration flows: Intra-regional, inter-regional and international migration;
• Source, transit and destination countries; • Formal & informal migration; • Temporary, circular & permanent mobility;• Brain-drain, undocumented migrants,
return migration, labor-migration, tourism, etc… .
8
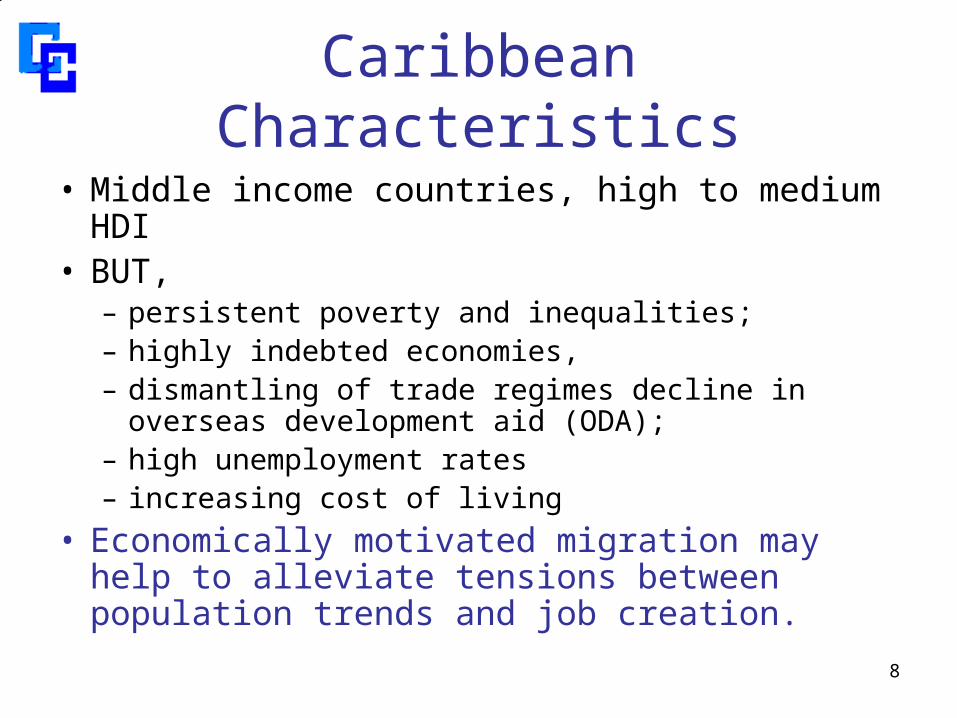
Caribbean Characteristics
• Middle income countries, high to medium HDI• BUT,
– persistent poverty and inequalities; – highly indebted economies, – dismantling of trade regimes decline in overseas
development aid (ODA); – high unemployment rates– increasing cost of living
• Economically motivated migration may help to alleviate tensions between population trends and job creation.

9
Negative Effects
capital outlay that went from primary to tertiary
future taxes which their income would have generated
skills which would contribute to national development
10
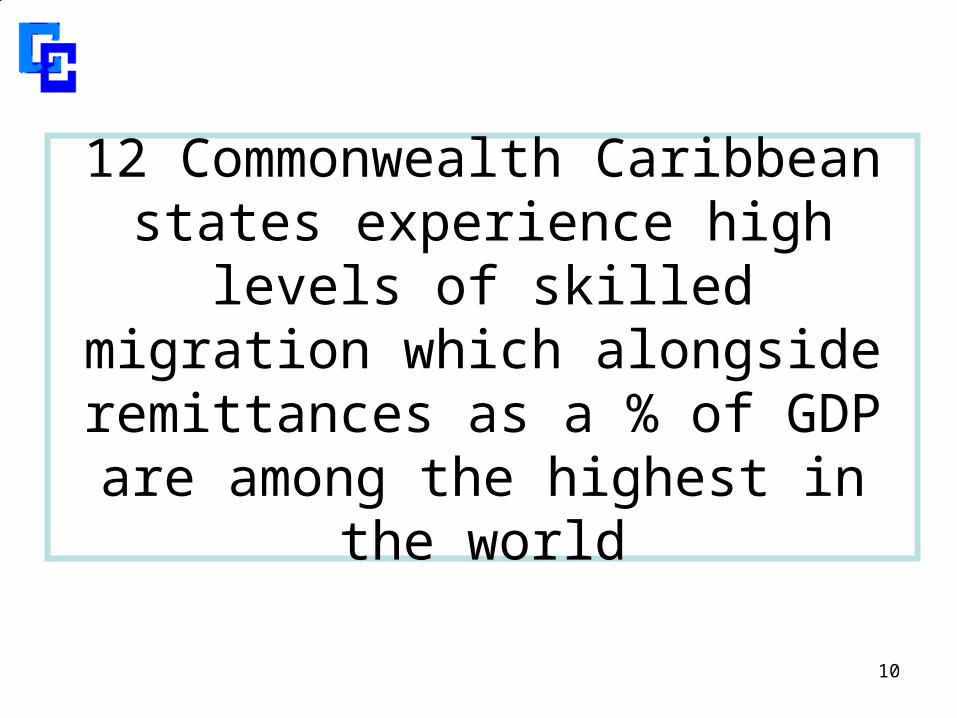
12 Commonwealth Caribbean states experience high levels of
skilled migration which alongside remittances as a % of GDP are among the highest in the world
11
Avoiding the pitfalls
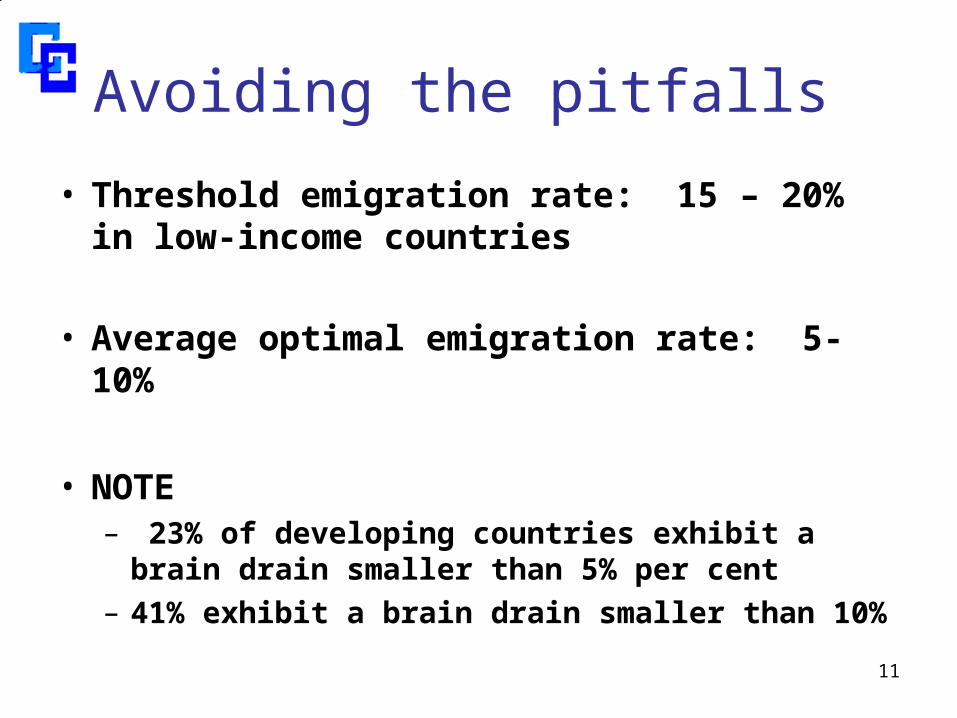
• Threshold emigration rate: 15 – 20% in low-income countries
• Average optimal emigration rate: 5-10%
• NOTE– 23% of developing countries exhibit a brain drain
smaller than 5% per cent – 41% exhibit a brain drain smaller than 10%

So, what is the CARICOM Response?
13
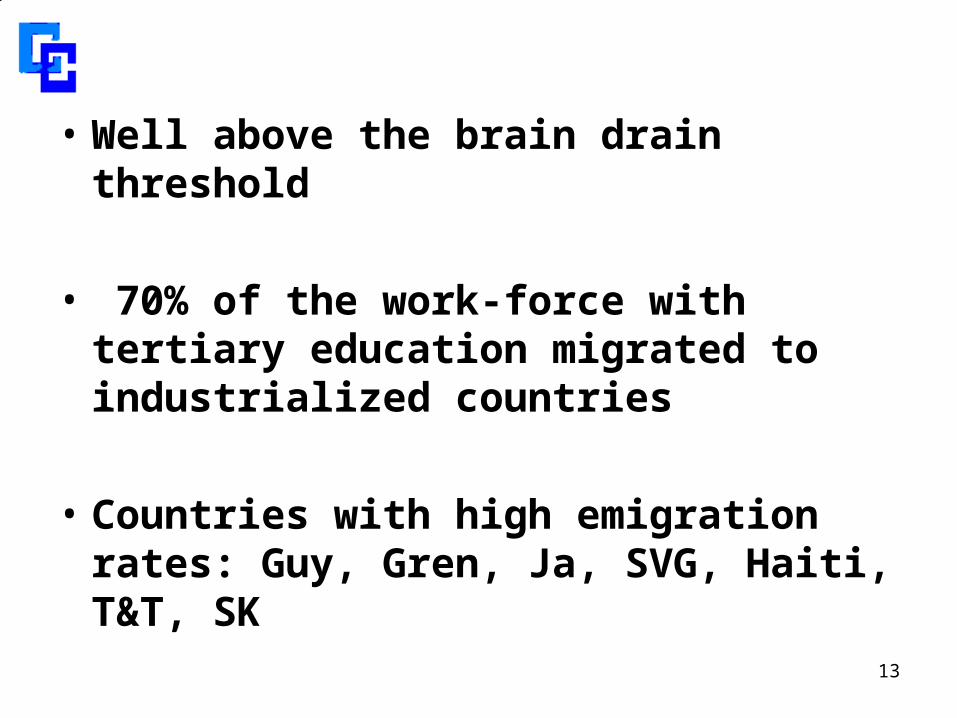
• Well above the brain drain threshold
• 70% of the work-force with tertiary education migrated to industrialized countries
• Countries with high emigration rates: Guy, Gren, Ja, SVG, Haiti, T&T, SK
14
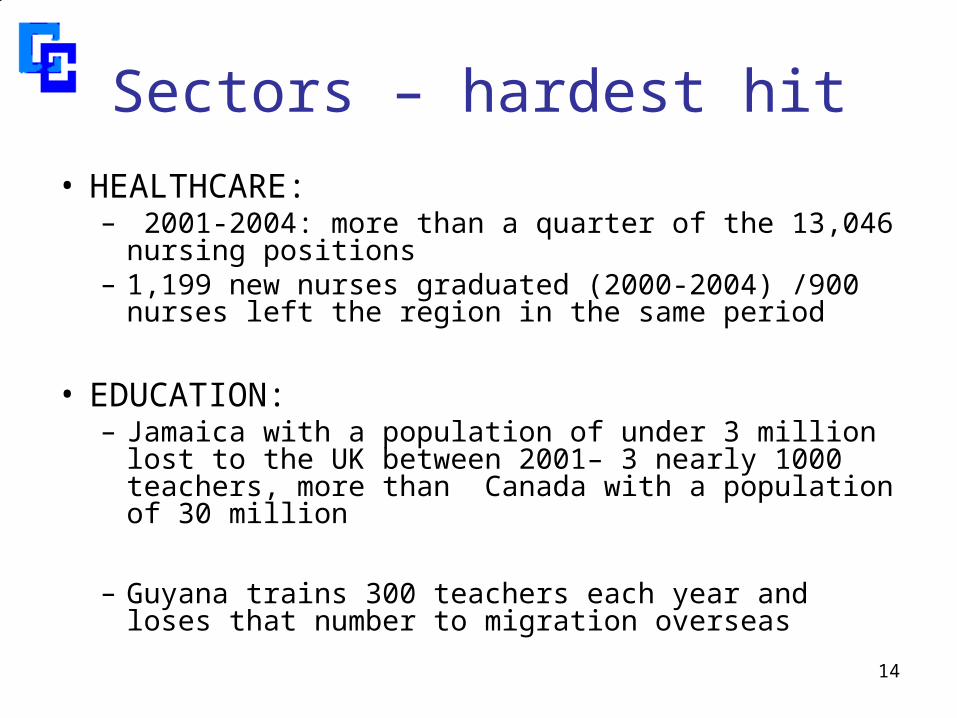
Sectors – hardest hit
• HEALTHCARE:– 2001-2004: more than a quarter of the 13,046
nursing positions – 1,199 new nurses graduated (2000-2004) /900 nurses
left the region in the same period
• EDUCATION:– Jamaica with a population of under 3 million lost to
the UK between 2001– 3 nearly 1000 teachers, more than Canada with a population of 30 million
– Guyana trains 300 teachers each year and loses that number to migration overseas
15
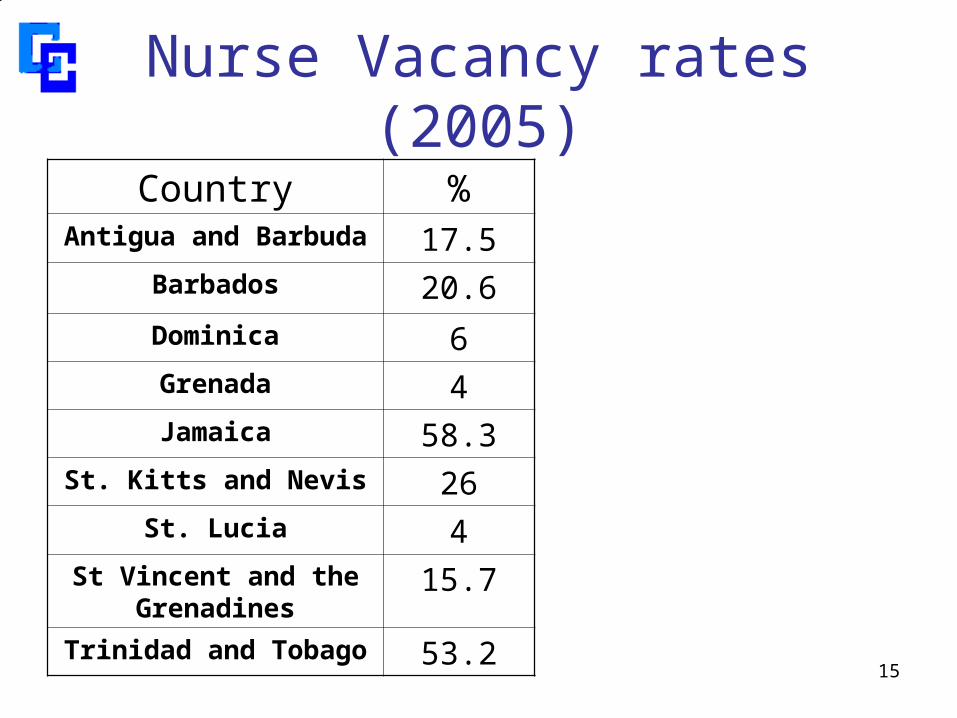
Nurse Vacancy rates (2005)
Country %Antigua and Barbuda 17.5
Barbados 20.6Dominica 6Grenada 4Jamaica 58.3
St. Kitts and Nevis 26St. Lucia 4
St Vincent and the Grenadines
15.7
Trinidad and Tobago 53.2
16
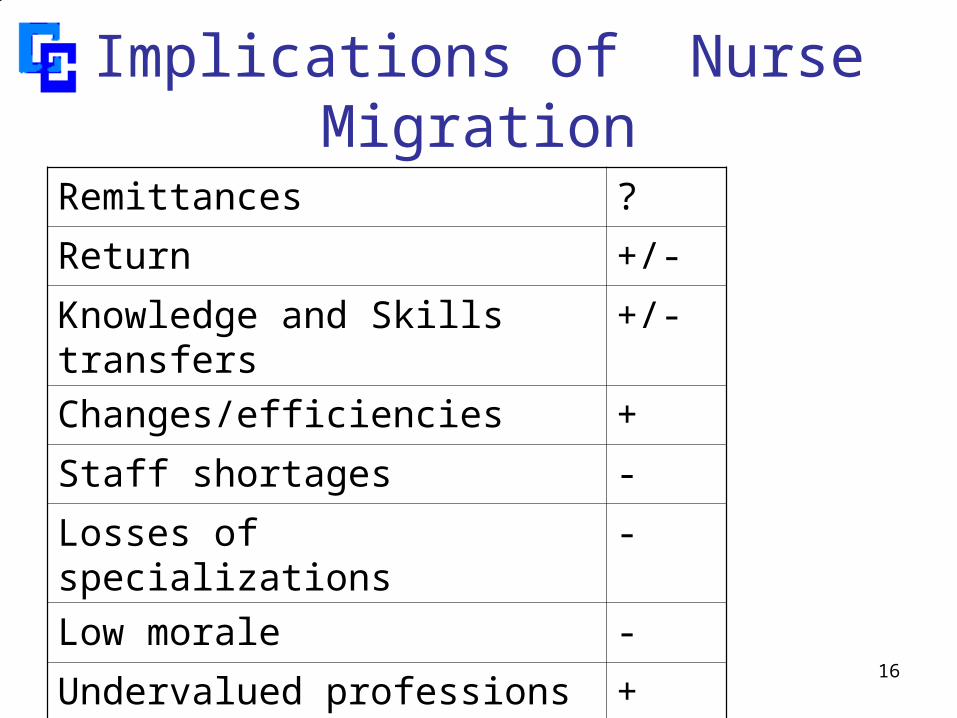
Implications of Nurse Migration
Remittances ?
Return +/-
Knowledge and Skills transfers +/-
Changes/efficiencies +
Staff shortages -
Losses of specializations -
Low morale -
Undervalued professions +
17
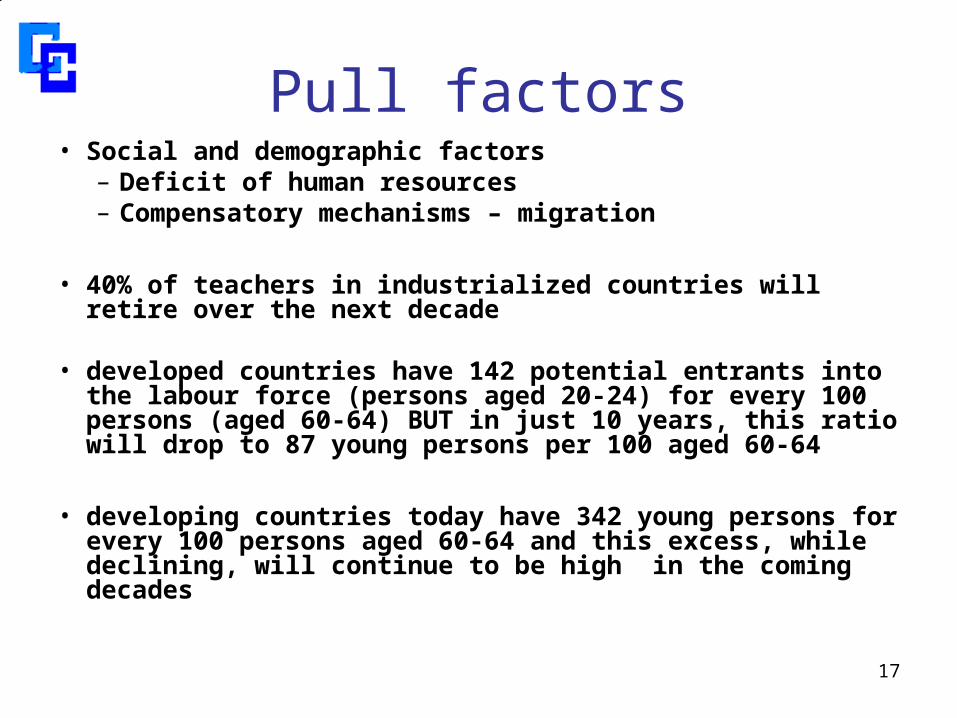
Pull factors• Social and demographic factors
– Deficit of human resources – Compensatory mechanisms – migration
• 40% of teachers in industrialized countries will retire over the next decade
• developed countries have 142 potential entrants into the labour force (persons aged 20-24) for every 100 persons (aged 60-64) BUT in just 10 years, this ratio will drop to 87 young persons per 100 aged 60-64
• developing countries today have 342 young persons for every 100 persons aged 60-64 and this excess, while declining, will continue to be high in the coming decades
18
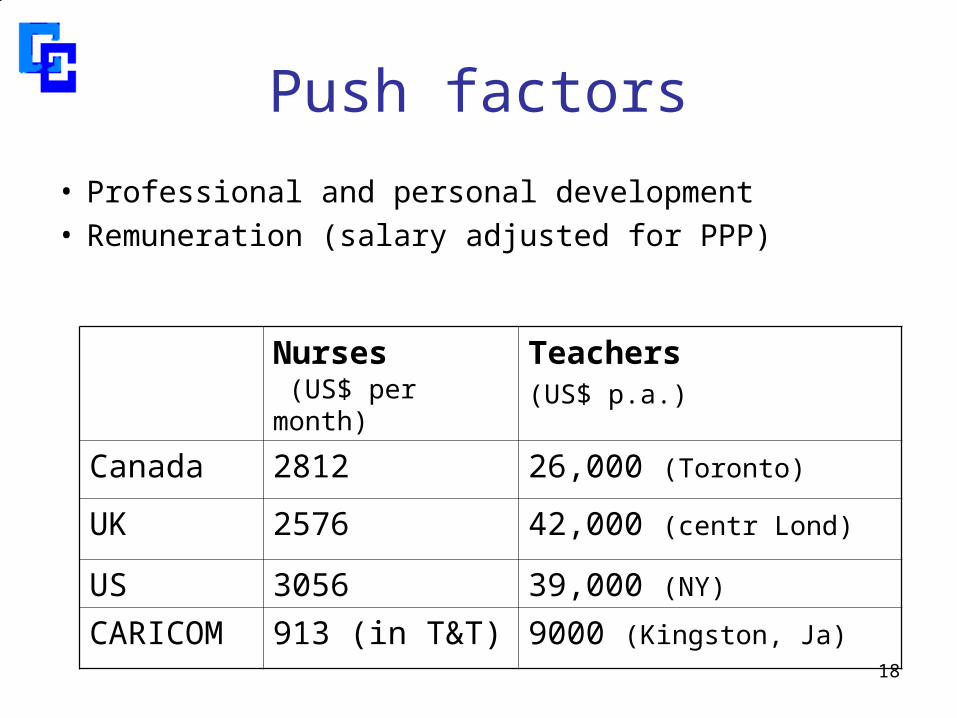
Push factors
• Professional and personal development• Remuneration (salary adjusted for PPP)
Nurses (US$ per month)
Teachers
(US$ p.a.)
Canada 2812 26,000 (Toronto)
UK 2576 42,000 (centr Lond)
US 3056 39,000 (NY)
CARICOM 913 (in T&T) 9000 (Kingston, Ja)
19
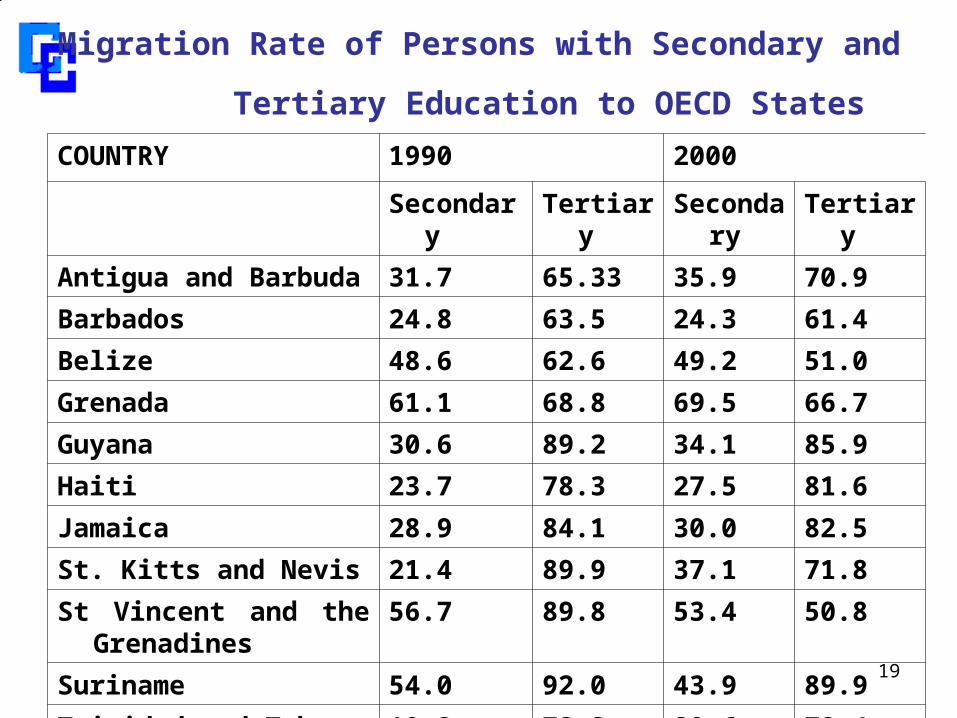
Migration Rate of Persons with Secondary and
Tertiary Education to OECD States COUNTRY 1990 2000
Secondary Tertiary Secondary Tertiary
Antigua and Barbuda 31.7 65.33 35.9 70.9
Barbados 24.8 63.5 24.3 61.4
Belize 48.6 62.6 49.2 51.0
Grenada 61.1 68.8 69.5 66.7
Guyana 30.6 89.2 34.1 85.9
Haiti 23.7 78.3 27.5 81.6
Jamaica 28.9 84.1 30.0 82.5
St. Kitts and Nevis 21.4 89.9 37.1 71.8
St Vincent and the Grenadines
56.7 89.8 53.4 50.8
Suriname 54.0 92.0 43.9 89.9
Trinidad and Tobago 19.3 72.2 20.6 78.4
20
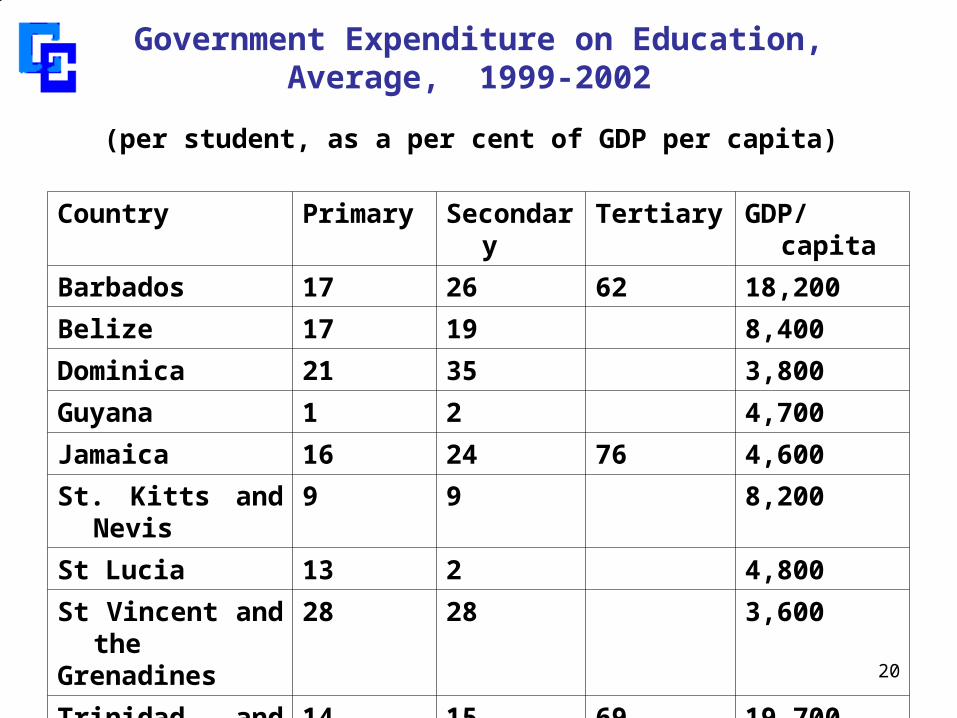
Government Expenditure on Education, Average, 1999-2002
(per student, as a per cent of GDP per capita)
Country Primary Secondary Tertiary GDP/capita
Barbados 17 26 62 18,200
Belize 17 19 8,400
Dominica 21 35 3,800
Guyana 1 2 4,700
Jamaica 16 24 76 4,600
St. Kitts and Nevis 9 9 8,200
St Lucia 13 2 4,800
St Vincent and theGrenadines
28 28 3,600
Trinidad and Tobago 14 15 69 19,700
21
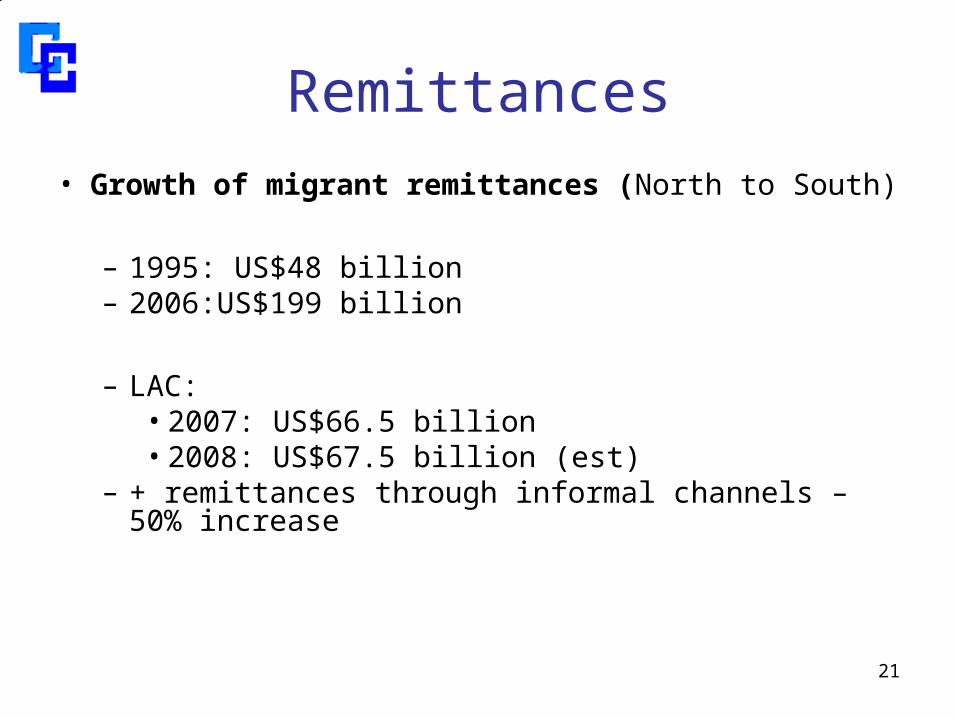
Remittances
• Growth of migrant remittances (North to South)
– 1995: US$48 billion – 2006:US$199 billion
– LAC:• 2007: US$66.5 billion • 2008: US$67.5 billion (est)
– + remittances through informal channels – 50% increase
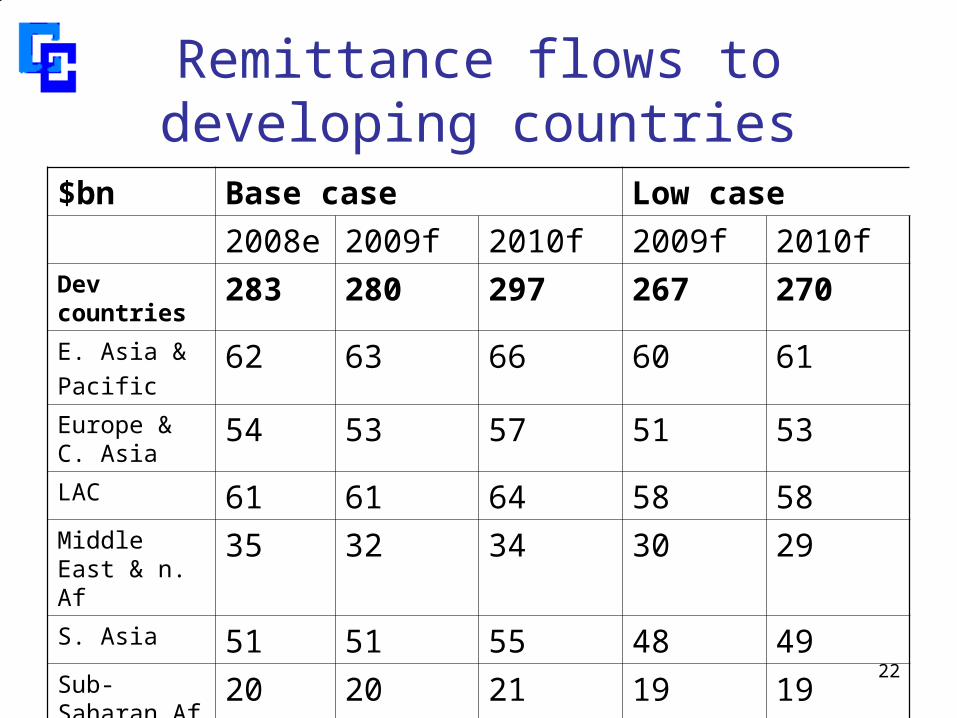
22
Remittance flows to developing countries
$bn Base case Low case
2008e 2009f 2010f 2009f 2010fDev countries
283 280 297 267 270
E. Asia &
Pacific62 63 66 60 61
Europe & C. Asia
54 53 57 51 53
LAC 61 61 64 58 58Middle East & n. Af
35 32 34 30 29
S. Asia 51 51 55 48 49Sub-Saharan Af
20 20 21 19 19
23
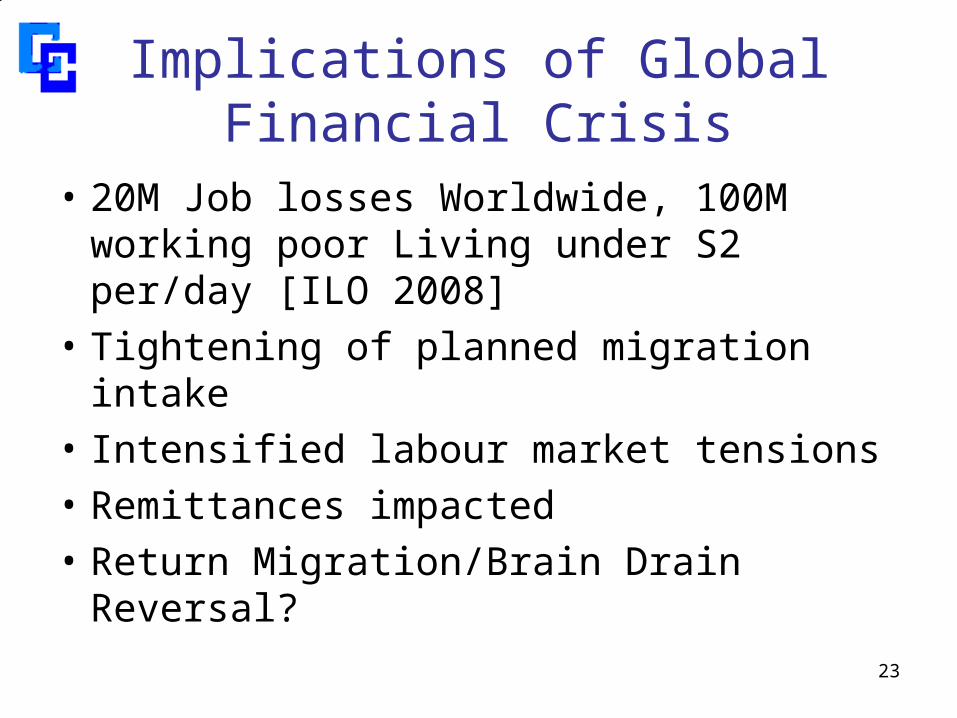
Implications of Global Financial Crisis
• 20M Job losses Worldwide, 100M working poor Living under S2 per/day [ILO 2008]
• Tightening of planned migration intake
• Intensified labour market tensions
• Remittances impacted
• Return Migration/Brain Drain Reversal?

24
Brain waste
• Non-recognition of qualifications, parity, transferability– Devaluation of skills and competentices– Compensation
• E.g.– Teachers not holding European qualifications do have
“qualified teacher status” – paid less– Nurses are obliged to pursue 3-6 month prog before they
carry out their professional duties
• IMPACT:– Source– Destination
25
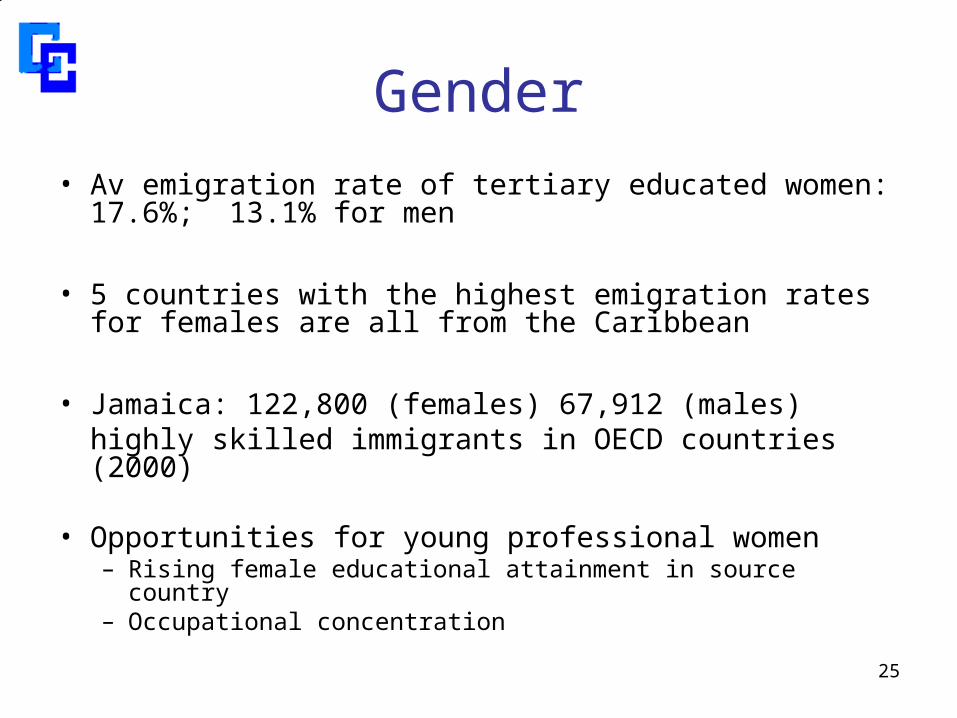
Gender
• Av emigration rate of tertiary educated women: 17.6%; 13.1% for men
• 5 countries with the highest emigration rates for females are all from the Caribbean
• Jamaica: 122,800 (females) 67,912 (males)highly skilled immigrants in OECD countries (2000)
• Opportunities for young professional women– Rising female educational attainment in source country– Occupational concentration
26
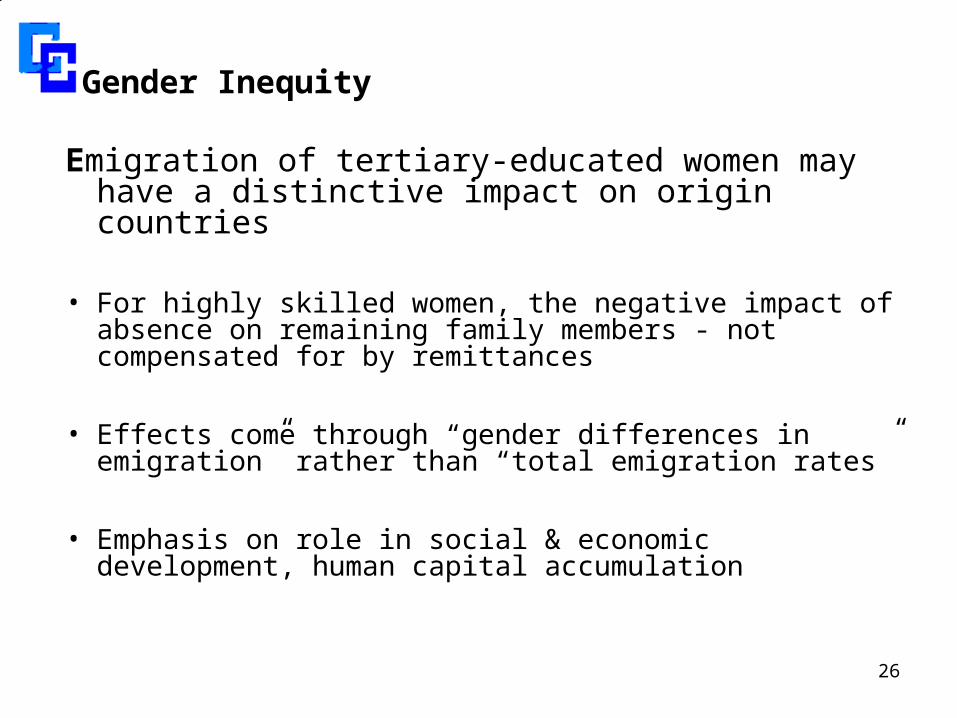
Gender Inequity
Emigration of tertiary-educated women may have a distinctive impact on origin countries
• For highly skilled women, the negative impact of absence on remaining family members - not compensated for by remittances
• Effects come through “gender differences in emigration” rather than “total emigration rates”
• Emphasis on role in social & economic development, human capital accumulation
27
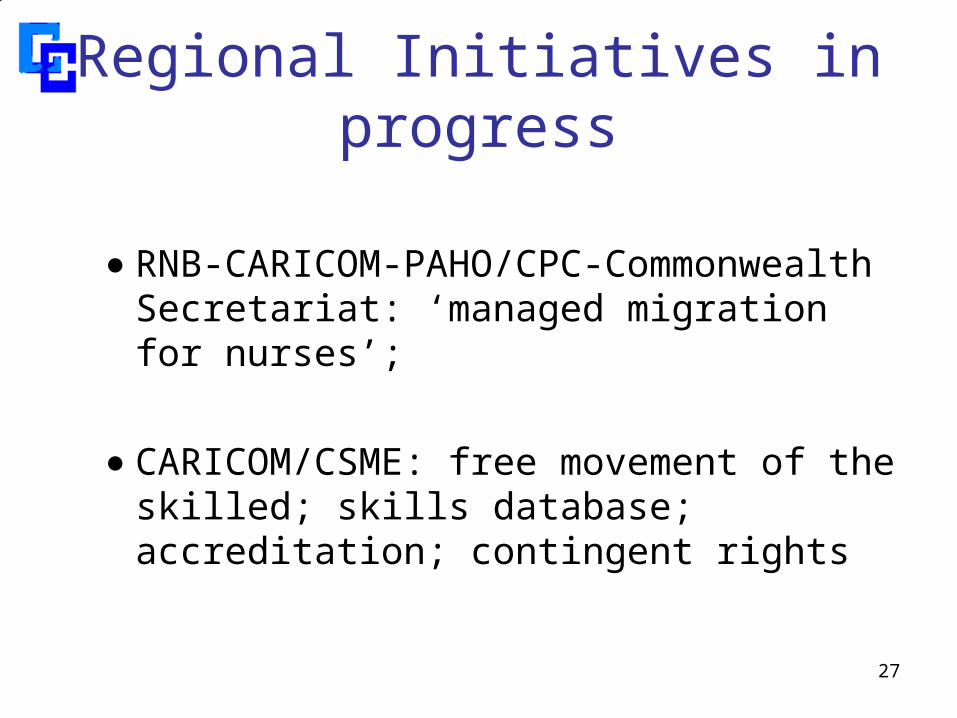
Regional Initiatives in progress
● RNB-CARICOM-PAHO/CPC-Commonwealth Secretariat: ‘managed migration for nurses’;
● CARICOM/CSME: free movement of the skilled; skills database; accreditation; contingent rights
28
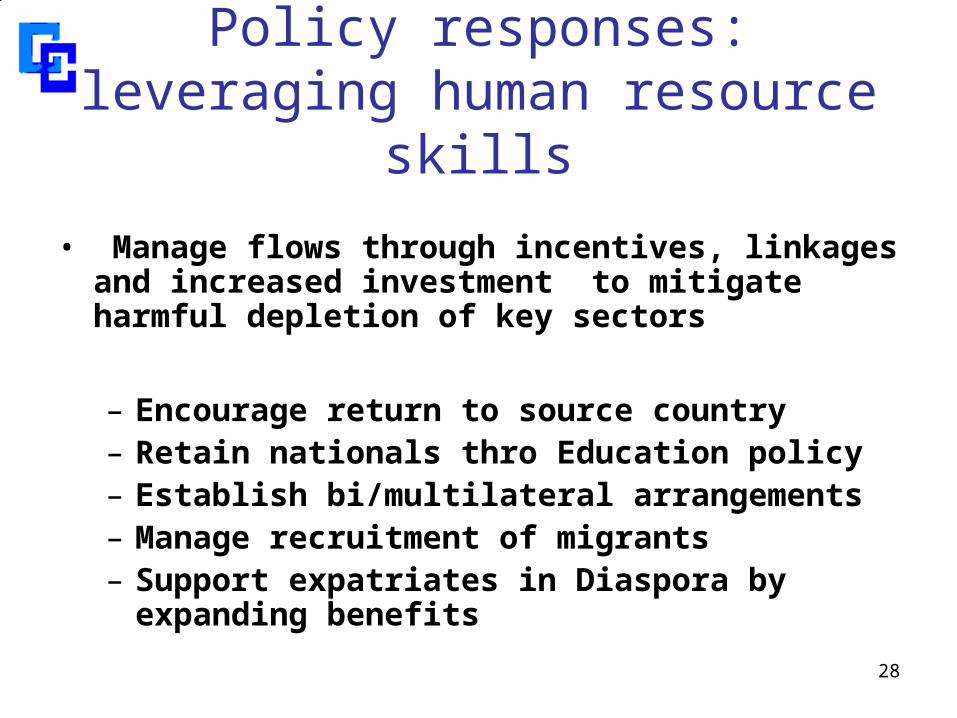
Policy responses: leveraging human resource skills
• Manage flows through incentives, linkages and
increased investment to mitigate harmful depletion of key sectors
– Encourage return to source country– Retain nationals thro Education policy– Establish bi/multilateral arrangements– Manage recruitment of migrants– Support expatriates in Diaspora by expanding
benefits
29
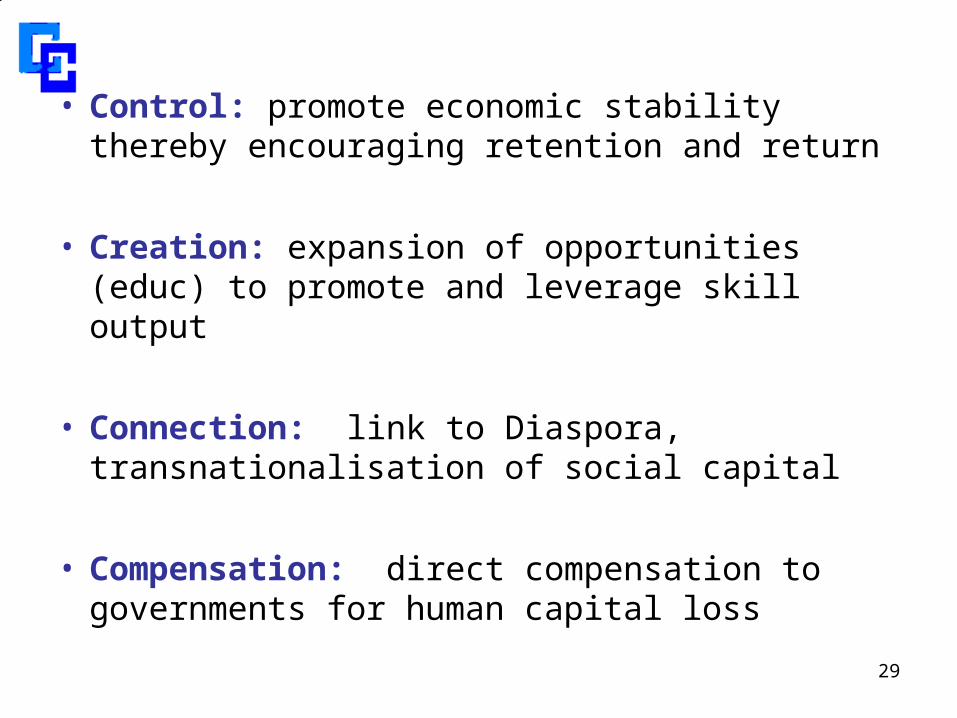
• Control: promote economic stability thereby encouraging retention and return
• Creation: expansion of opportunities (educ) to promote and leverage skill output
• Connection: link to Diaspora, transnationalisation of social capital
• Compensation: direct compensation to governments for human capital loss

Thank you!
CP21497T