Kentucky Traumatic Brain Injury Programs Overview - April 2014

BRAINA JOURNAL OF NEUROLOGY
Large scale screening of neural signatures ofconsciousness in patients in a vegetative orminimally conscious stateJacobo Diego Sitt,1,2,3,* Jean-Remi King,1,2,3,* Imen El Karoui,3 Benjamin Rohaut,3,4
Frederic Faugeras,3,5 Alexandre Gramfort,2,6 Laurent Cohen,3,4 Mariano Sigman,7,8
Stanislas Dehaene1,2,9,10 and Lionel Naccache3,5
1 Cognitive Neuroimaging Unit, Institut National de la Sante et de la Recherche Medicale, U992, F-91191 Gif/Yvette, France
2 NeuroSpin Centre, Institute of BioImaging Commissariat a l’Energie Atomique, F-91191 Gif/Yvette, France
3 Inserm U 1127, CNRS UMR 7225, Sorbonne Universites, UPMC Univ Paris 06 UMR S 1127, Institut du Cerveau et de la Moelle epiniere, ICM,
F-75013, Paris, France
4 AP-HP, Groupe hospitalier Pitie-Salpetriere, Department of Neurology, Intensive Care Unit, Paris, France
5 AP-HP, Groupe hospitalier Pitie-Salpetriere, Department of Neurophysiology, Paris, France
6 Institut Mines-Telecom, Telecom ParisTech, CNRS LTCI, France
7 Integrative Neuroscience Laboratory, Physics Department, Facultad de Ciencias Exactas y Naturales, Universidad de Buenos Aires, Buenos Aires,
Argentina
8 Universidad Torcuato Di Tella, Almirante Juan Saenz Valiente 1010, C1428BIJ Buenos Aires, Argentina
9 Universite Paris 11, Orsay, France
10 College de France, F-75005 Paris, France
*These authors contributed equally to this work.
Correspondence to: Jacobo Diego Sitt, MD, PhD,
INSERM U992CEA/Saclay, NeuroSpin Bat 145,
CEA - Saclay, France
Point Courrier 156, 91191 Gif/Yvette Cedex
E-mail: [email protected]
Correspondence may also be addressed to: Jean-Remi King, E-mail: [email protected]
In recent years, numerous electrophysiological signatures of consciousness have been proposed. Here, we perform a systematic
analysis of these electroencephalography markers by quantifying their efficiency in differentiating patients in a vegetative state
from those in a minimally conscious or conscious state. Capitalizing on a review of previous experiments and current theories,
we identify a series of measures that can be organized into four dimensions: (i) event-related potentials versus ongoing
electroencephalography activity; (ii) local dynamics versus inter-electrode information exchange; (iii) spectral patterns versus
information complexity; and (iv) average versus fluctuations over the recording session. We analysed a large set of 181 high-
density electroencephalography recordings acquired in a 30 minutes protocol. We show that low-frequency power, electroen-
cephalography complexity, and information exchange constitute the most reliable signatures of the conscious state. When
combined, these measures synergize to allow an automatic classification of patients’ state of consciousness.
Keywords: consciousness; vegetative state; unresponsive wakefulness syndrome; minimally conscious state; EEG
Abbreviations: AUC = area under the curve; CRS-R = Coma Recovery Scale Revised; CS = conscious state; MCS = minimally con-scious state; VS = vegetative state
doi:10.1093/brain/awu141 Brain 2014: Page 1 of 13 | 1
Received February 3, 2014. Revised March 31, 2014. Accepted April 13, 2014.
� The Author (2014). Published by Oxford University Press on behalf of the Guarantors of Brain. All rights reserved.
For Permissions, please email: [email protected]
Brain Advance Access published June 16, 2014 by guest on June 20, 2014
http://brain.oxfordjournals.org/D
ownloaded from
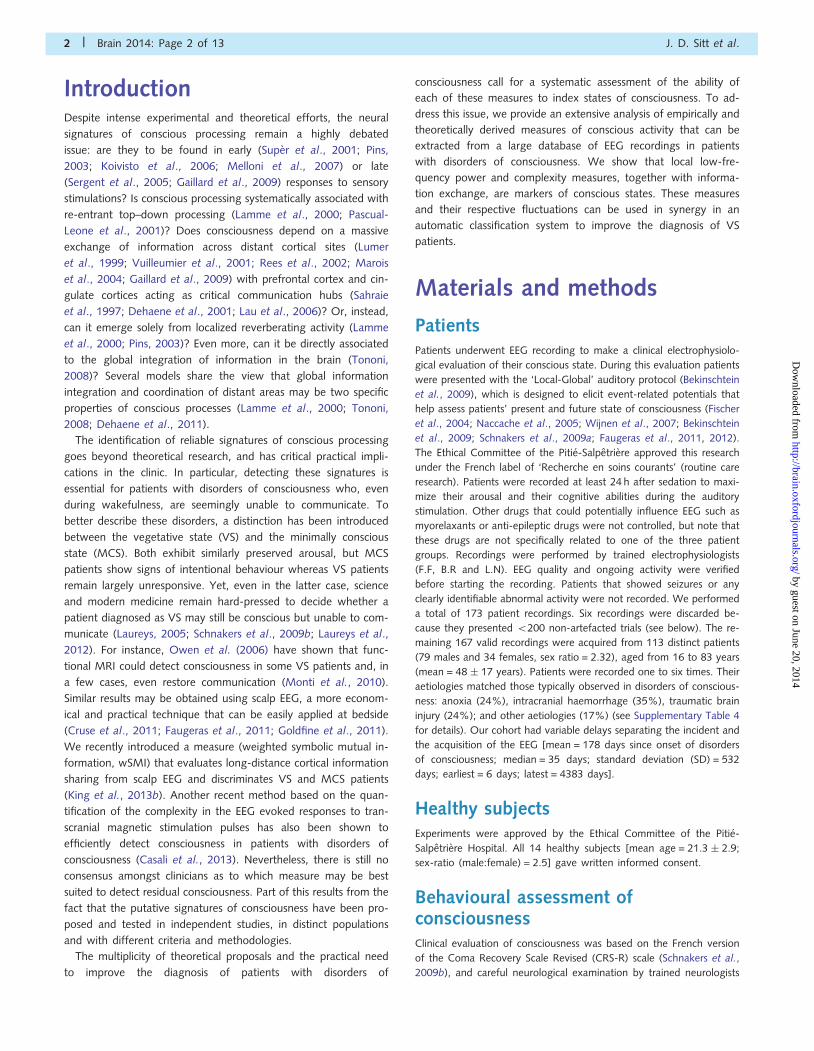
IntroductionDespite intense experimental and theoretical efforts, the neural
signatures of conscious processing remain a highly debated
issue: are they to be found in early (Super et al., 2001; Pins,
2003; Koivisto et al., 2006; Melloni et al., 2007) or late
(Sergent et al., 2005; Gaillard et al., 2009) responses to sensory
stimulations? Is conscious processing systematically associated with
re-entrant top–down processing (Lamme et al., 2000; Pascual-
Leone et al., 2001)? Does consciousness depend on a massive
exchange of information across distant cortical sites (Lumer
et al., 1999; Vuilleumier et al., 2001; Rees et al., 2002; Marois
et al., 2004; Gaillard et al., 2009) with prefrontal cortex and cin-
gulate cortices acting as critical communication hubs (Sahraie
et al., 1997; Dehaene et al., 2001; Lau et al., 2006)? Or, instead,
can it emerge solely from localized reverberating activity (Lamme
et al., 2000; Pins, 2003)? Even more, can it be directly associated
to the global integration of information in the brain (Tononi,
2008)? Several models share the view that global information
integration and coordination of distant areas may be two specific
properties of conscious processes (Lamme et al., 2000; Tononi,
2008; Dehaene et al., 2011).
The identification of reliable signatures of conscious processing
goes beyond theoretical research, and has critical practical impli-
cations in the clinic. In particular, detecting these signatures is
essential for patients with disorders of consciousness who, even
during wakefulness, are seemingly unable to communicate. To
better describe these disorders, a distinction has been introduced
between the vegetative state (VS) and the minimally conscious
state (MCS). Both exhibit similarly preserved arousal, but MCS
patients show signs of intentional behaviour whereas VS patients
remain largely unresponsive. Yet, even in the latter case, science
and modern medicine remain hard-pressed to decide whether a
patient diagnosed as VS may still be conscious but unable to com-
municate (Laureys, 2005; Schnakers et al., 2009b; Laureys et al.,
2012). For instance, Owen et al. (2006) have shown that func-
tional MRI could detect consciousness in some VS patients and, in
a few cases, even restore communication (Monti et al., 2010).
Similar results may be obtained using scalp EEG, a more econom-
ical and practical technique that can be easily applied at bedside
(Cruse et al., 2011; Faugeras et al., 2011; Goldfine et al., 2011).
We recently introduced a measure (weighted symbolic mutual in-
formation, wSMI) that evaluates long-distance cortical information
sharing from scalp EEG and discriminates VS and MCS patients
(King et al., 2013b). Another recent method based on the quan-
tification of the complexity in the EEG evoked responses to tran-
scranial magnetic stimulation pulses has also been shown to
efficiently detect consciousness in patients with disorders of
consciousness (Casali et al., 2013). Nevertheless, there is still no
consensus amongst clinicians as to which measure may be best
suited to detect residual consciousness. Part of this results from the
fact that the putative signatures of consciousness have been pro-
posed and tested in independent studies, in distinct populations
and with different criteria and methodologies.
The multiplicity of theoretical proposals and the practical need
to improve the diagnosis of patients with disorders of
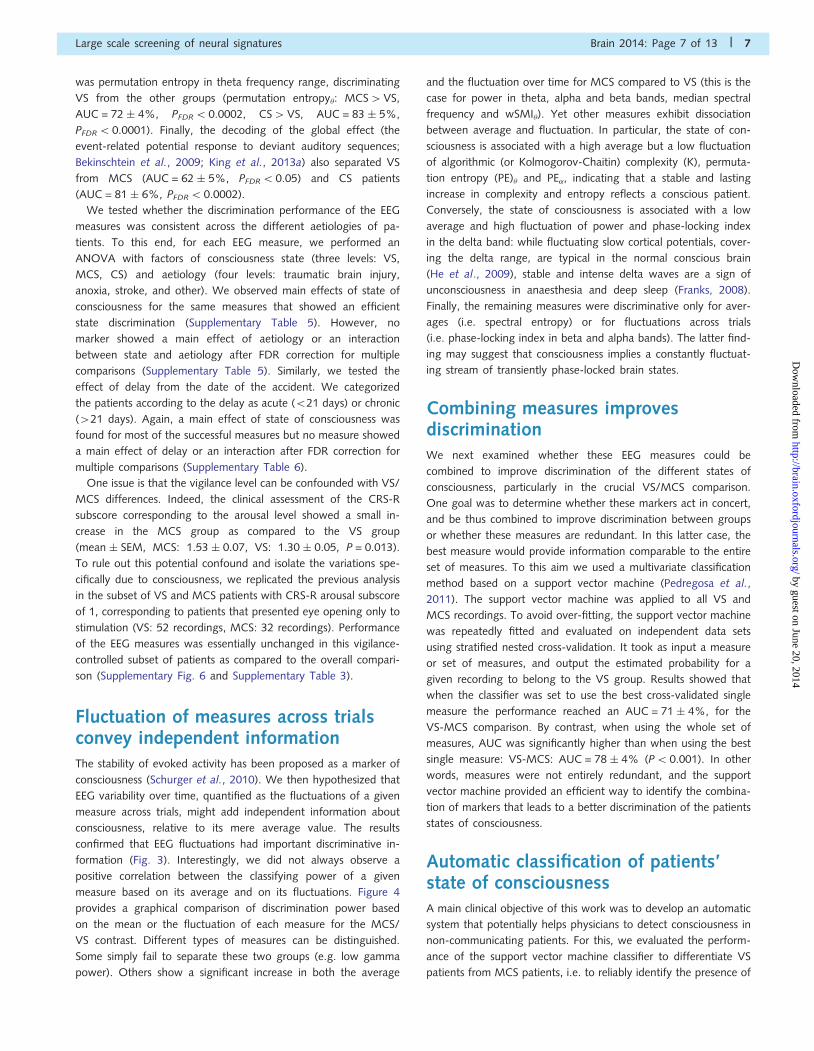
consciousness call for a systematic assessment of the ability of
each of these measures to index states of consciousness. To ad-
dress this issue, we provide an extensive analysis of empirically and
theoretically derived measures of conscious activity that can be
extracted from a large database of EEG recordings in patients
with disorders of consciousness. We show that local low-fre-
quency power and complexity measures, together with informa-
tion exchange, are markers of conscious states. These measures
and their respective fluctuations can be used in synergy in an
automatic classification system to improve the diagnosis of VS
patients.
Materials and methods
PatientsPatients underwent EEG recording to make a clinical electrophysiolo-
gical evaluation of their conscious state. During this evaluation patients
were presented with the ‘Local-Global’ auditory protocol (Bekinschtein
et al., 2009), which is designed to elicit event-related potentials that
help assess patients’ present and future state of consciousness (Fischer
et al., 2004; Naccache et al., 2005; Wijnen et al., 2007; Bekinschtein
et al., 2009; Schnakers et al., 2009a; Faugeras et al., 2011, 2012).
The Ethical Committee of the Pitie-Salpetriere approved this research
under the French label of ‘Recherche en soins courants’ (routine care
research). Patients were recorded at least 24 h after sedation to maxi-
mize their arousal and their cognitive abilities during the auditory
stimulation. Other drugs that could potentially influence EEG such as
myorelaxants or anti-epileptic drugs were not controlled, but note that
these drugs are not specifically related to one of the three patient
groups. Recordings were performed by trained electrophysiologists
(F.F, B.R and L.N). EEG quality and ongoing activity were verified
before starting the recording. Patients that showed seizures or any
clearly identifiable abnormal activity were not recorded. We performed
a total of 173 patient recordings. Six recordings were discarded be-
cause they presented 5200 non-artefacted trials (see below). The re-
maining 167 valid recordings were acquired from 113 distinct patients
(79 males and 34 females, sex ratio = 2.32), aged from 16 to 83 years
(mean = 48 � 17 years). Patients were recorded one to six times. Their
aetiologies matched those typically observed in disorders of conscious-
ness: anoxia (24%), intracranial haemorrhage (35%), traumatic brain
injury (24%); and other aetiologies (17%) (see Supplementary Table 4
for details). Our cohort had variable delays separating the incident and
the acquisition of the EEG [mean = 178 days since onset of disorders
of consciousness; median = 35 days; standard deviation (SD) = 532
days; earliest = 6 days; latest = 4383 days].
Healthy subjectsExperiments were approved by the Ethical Committee of the Pitie-
Salpetriere Hospital. All 14 healthy subjects [mean age = 21.3 � 2.9;
sex-ratio (male:female) = 2.5] gave written informed consent.
Behavioural assessment ofconsciousnessClinical evaluation of consciousness was based on the French version
of the Coma Recovery Scale Revised (CRS-R) scale (Schnakers et al.,
2009b), and careful neurological examination by trained neurologists
2 | Brain 2014: Page 2 of 13 J. D. Sitt et al.
by guest on June 20, 2014http://brain.oxfordjournals.org/
Dow
nloaded from

(F.F., B.R., L.N.). This scale consists of 23 items forming six subscales
addressing auditory, visual, motor, oromotor, communication and
arousal functions. CRS-R subscales are comprised of hierarchically
arranged items. The scale enables a distinction between conscious
states (CS), MCS and VS (Schnakers et al., 2009b). Clinical examin-
ation and behavioural assessment were systematically performed
immediately before EEG recording.
Auditory stimulationSubjects were stimulated auditorily using the ‘Local-Global’ protocol
(Bekinschtein et al., 2009). In this protocol, patients were presented
with a series of sounds that contain regularities at two different hier-
archical levels. The deviations from these regularities evoke event-
related potentials that are useful to evaluate the cognitive state of
the patients. See Supplementary material for a complete description
of the protocol.
High-density scalp electroencephalo-graphy recordingsEEG recordings were sampled at 250 Hz with a 256-electrode geodesic
sensor net (EGI) referenced to the vertex. Recordings were band-pass
filtered (from 0.2 to 45 Hz). Trials were then segmented from
�200 ms to + 1336 ms relative to the onset of the first sound. Trials
with voltages exceeding �150mV, eye-movements activity exceeding
�80 mV and eye-blinks exceeding �150mV were rejected. Trials were
baseline corrected over the first 200 ms window preceding the onset of
the first sound. Electrodes with a rejection rate superior to 20% across
trials were rejected and were interpolated. Trials with 420 corrected
electrodes were rejected. The remaining trials were digitally
transformed to an average reference. All these processing stages
were performed using the EGI Waveform Tools Package.
Connectivity measures were based on a spatial Laplacian transform-
ation of the EEG—a computation also known as the Current Source
Density estimate (Kayser et al., 2006). This transformation roughly
consists, in subtracting from each electrode, the activity of its neigh-
bouring electrodes. This has the main advantage of increasing spatial
resolution and minimizing the influence of common sources on
multiple distant electrodes.
Calculation of putative electroencepha-lography measures of consciousnessWe calculated the entire set of EEG measures independently for each
individual subject, trial and for every electrode (n = 256) or pair of
electrodes (n = 32 640). Connectivity measures were summarized by
calculating the median value from each electrode to all of the other
scalp (non-facial) electrodes. Note that, given the spatial distribution of
the electrodes, this procedure enhances the weight of long-distance
connections on the computed measure. As a final result, all measure
distributions ended up with the same number of values per subject and
trial. Finally, for each subject, these values were again collapsed to two
scalars by considering the mean and the standard deviation across
trials.
Except for event-related potential measures, analyses were per-
formed on EEG data recorded during the time period when subjects
were presented with undifferentiated series of tones (from 200 ms
before the onset of the first tone to the onset of the fifth tone).
Thus, all trials were pooled independently of the condition of auditory
stimulation.
See Supplementary material for a detailed description of each meas-
ure and its computation.
Statistics
Topographical analysis
Topographical analyses were performed using a similar approach to
the method above. Pair-wise comparisons across clinical states were
performed with Mann-Whitney U-tests on each electrode separately.
Robust regression analyses were performed across the four groups
(VS, MCS, CS, and healthy controls) to test for the monotony of
the changes observed across states of consciousness. Statistical signifi-
cance is reported at two levels of significance (P5 0.01 and P5 0.05,
uncorrected for the number of electrodes tested).
Univariate receiver operating characteristic
Pair-wise comparisons were performed across the three clinical groups
(VS, MCS and CS), leading, for each measure, to three statistical com-
parisons (VS/MCS, MCS/CS, and VS/CS). We implemented a non-
parametric statistical method (Mann-Whitney U-test) and report the
effect size as the empirical area under the curve (AUC) from an em-
pirical receiver operating curve analysis. See Supplementary methods
for the computation of the AUC.
Multivariate pattern analyses
In the present case, each analysis aimed at predicting the clinically-
defined state of consciousness (VS, MCS or CS) of each subject from
the EEG-based measures of conscious processing. For this purpose, we
used a linear Support Vector Classifier (Pedregosa et al., 2011) with a
probabilistic output calibration. See Supplementary material for a de-
tailed description of the computational steps.
ResultsWe analysed a large set of 181 high-density 256-channel EEG record-
ings, corresponding to all 167 patients admitted at the Pitie-Salpetriere
Hospital and referred to us in the 2008–10 period for a clinical evalu-
ation of their state of consciousness. In total, 75 VS recordings, 68
MCS recordings, and 24 brain-injured but conscious patients (CS)
were recordings were acquired. Fourteen additional recordings were
obtained from healthy control subjects. Recordings were acquired in
the ‘Local Global’ protocol, a 30-min experimental protocol designed
to probe the depth of processing of auditory regularities (Bekinschtein
et al., 2009) (Fig. 1). This procedure allowed us to jointly quantify the
event-related potentials evoked by exogenous stimuli and the pres-
ence of endogenous fluctuations in the EEG, while maximizing and
homogenizing the patients’ attention and vigilance. For each record-
ing, we systematically extracted a set of measures organized according
to a theory-driven taxonomy (Table 1). Full details and motivations for
each measure can be found in the Supplementary material. Here we
briefly describe the most relevant aspects of each measure.
We propose to organize EEG measures according to several major
dimensions (Table 1). A first distinction separates measures of the
processing of external stimuli (auditory event-related potentials)
from measures that are not locked to the stimuli and rather reflect
ongoing brain activity. Current theories of consciousness differ in
their attribution of conscious awareness of an external stimulus to
early or late brain responses (Dehaene et al., 2011). Therefore, we
Large scale screening of neural signatures Brain 2014: Page 3 of 13 | 3
by guest on June 20, 2014http://brain.oxfordjournals.org/
Dow
nloaded from

classified event-related potentials according to their latency (early,
5250 ms versus late, 4300 ms). Measures of ongoing EEG activity
were further classified based on: (i) dynamics of brain signals at a
single electrode site versus assessment of functional connectivity
between two brain sites; and (ii) whether the measure is based
on spectral frequency content or on information-theoretic estimates
of signal complexity, which do not presume strong specific hypoth-
eses about the frequency content of the signal. For each measure
we computed, the intertrial average, which reflects the overall mean
value during the half-hour recording session, and the fluctuation of
this measure (SD) during the recording period, which tests the hy-
pothesis that stability may be a hallmark of consciousness (Schurger
et al., 2010).
Topographical differences acrossmeasures and groupsFirst we inspected whether differences in amplitude and spatial
distribution of the computed measures could discriminate patients’
state of consciousness. This analysis also aims at evaluating
whether different measures present specific scalp topographies,
and thus (i) highlight optimal recording regions for clinical practice;
and (ii) suggest different underlying neural systems. Figure 2 de-
picts a representative set of measures; the full set of topographies
is presented in Supplementary Figs 1–4. The specific results ob-
tained for each marker is discussed below.
Event-related topographies show lowsensitivity to discriminate patientgroupsOnly two of seven sound-related potentials (Bekinschtein et al.,
2009) differed significantly between VS and CS patients
(Supplementary Fig. 1). None of them could significantly discrim-
inate VS and MCS patients. The MMN and the P300, two event-
related potentials, which both signal the detection of violations of
auditory regularities, only showed modest differences between the
groups of patients. Although the MMN discriminated VS from CS
and MCS from CS, confirming that it increases when conscious-
ness recovers (Wijnen et al., 2007), it did not discriminate VS from
MCS. More surprisingly, univariate, electrode-by-electrode statis-
tics of the P300 topography also failed to reveal any discrimination
of VS from MCS. This finding, which partially contradicts earlier
results with smaller patient samples (Bekinschtein et al., 2009),
may be ascribed to large interindividual variability in EEG topog-
raphy (King et al., 2013a), as discrimination improves when using
multivariate decoding (see below).
Theta and alpha band power efficientlyindex the state of consciousnessContrary to event-related potentials, most of the power spectrum
measures seemed to be efficient indices of consciousness states.
These measures appeared maximally informative for electrodes
over the parietal region (Supplementary Fig. 2). All spectral meas-
ures showed monotonic effects from VS to CS patients groups,
and 6 of 10 succeeded in discriminating VS from MCS. Within the
lower frequencies, normalized delta (1–4 Hz) showed decreasing
power from VS to CS, significantly separating VS from non-VS
Table 1 Taxonomy of EEG-derived measures used to categorize states of consciousness
Event-related potentials ‘Ongoing’ activity
Earlycomponents
Latecomponents
Single electrode Across electrodes
Spectrum Informationtheory
Spectrum Informationtheory
P1 P3a Power in frequencybands
Permutationentropy
Phase lag index Weighted sym-bolic mutualinformation
MMN P3b Spectral summaries K complexity Amplitude enve-lope correlation
CNV Spectral entropy Imaginarycoherence
Measures can be conceptually organized along several dimensions: first, we distinguish measures of stimulus processing from measures computed from ongoing EEGactivity. The former (event-related potentials) are further subdivided into early versus late components. The latter are classified according to the theoretical background usedto derive the measure: (i) local dynamics versus connectivity: some measures are computed within each electrode, whereas others index the interactions between electrodes;and (ii) spectral (Fourier frequency analysis) versus Information Theory. Finally, for each measure, intertrial average (computed as the mean across trials) or intertrial
fluctuations (computed as the standard deviation) were studied.
Figure 1 A multi-dimensional approach to categorize states of
consciousness. Description of the experimental protocol used for
patient auditory stimulation. Spectral and information-theory
measures were computed in the early time window (which is
identical for all trials), whereas event-related potentials were
computed on the late window (response specific to the trial
condition).
4 | Brain 2014: Page 4 of 13 J. D. Sitt et al.
by guest on June 20, 2014http://brain.oxfordjournals.org/
Dow
nloaded from

Figure 2 Scalp topography of the most discriminatory measures. The topographical 2D projection (top = front) of each measure [con-
tingent negative variation (CNV), mismatch negativity (MMN) and P300b (�P3b), normalized power in delta (|�|n) and alpha (|�|n) bands,
spectral entropy (SE), permutation entropy in theta band (PE�), Komolgorov-Chaitin Complexity (K) and weighted symbolic mutual
information (wSMI�)] is plotted for each state of consciousness (columns). The fifth column indicates whether the VS and MCS patients
were significantly different from one another (black = P5 0.01, light grey = P50.05, white = not significant, uncorrected for the number
of electrodes tested). The sixth column shows the statistics of a regression analysis of the measure across the four states of consciousness
(VS5MCS5CS5healthy controls (H). Black: P50.01, light grey: P50.05, white: not significant, uncorrected for the number of
electrodes tested).
Large scale screening of neural signatures Brain 2014: Page 5 of 13 | 5
by guest on June 20, 2014http://brain.oxfordjournals.org/
Dow
nloaded from

patients. On the contrary, normalized theta (4–8 Hz) and normal-
ized alpha power (8–13 Hz) increased significantly from VS to CS.
Both frequency bands showed increasing power in parietal regions
and significantly discriminated VS from the other groups of
patients. Normalized beta power failed to discriminate between
VS and MCS patients, but significantly discriminated CS from
the other groups of patients.
Because of these opposing variations of low (delta) and higher
(alpha and above) frequencies, spectral summaries such as the
median spectral frequency, which summarize the relative distribu-
tion of power in the frequency spectrum, were particularly
efficient. The spectral entropy analysis showed that CS and MCS
patients presented a less predictable spectral structure (higher
entropy) than VS patients.
Electroencephalography complexityincreases with conscious stateAlgorithmic (or Kolmogorov-Chaitin) complexity (K) estimates the
complexity of a sequence based on its compressibility. Several
theories predict that the complexity of information integration
(Tononi, 2008) or distributed processing (Dehaene et al., 2011)
is elevated during conscious states. In agreement with this predic-
tion, we found that the computed measure of complexity, based
on EEG compression, increased in patients with a higher clinical
state of consciousness. This measure significantly discriminated VS
from MCS patients, particularly for a set of electrodes over the
parietal region (Supplementary Fig. 3). A complementary mathem-
atical approach is permutation entropy, which evaluates the
regularity of the probabilistic distributions of temporal patterns in
the signal (Bandt and Pompe, 2002). Permutation entropy can be
computed in distinct frequency bands; we found that permutation
entropy-based measures were particularly efficient in the theta
frequency range, discriminating VS from the other groups.
Again, a greater value of permutation entropy, especially over
centro-posterior regions (Fig. 2), indicating a more complex and
unpredictable distribution, indexed a higher state of consciousness.
Information sharing across brain regionsindexes conscious stateSimilar to the spectral measures at a single recording site, meas-
ures of functional connectivity between two recording sites proved
particularly efficient at lower frequencies (Supplementary Fig. 4).
Amongst the spectral connectivity measures, only the phase-
locking index in the delta band was significant, progressive deficits
in consciousness being accompanied by greater delta synchrony.
Connectivity measures based on information theory, such as
weighted symbolic mutual information, demonstrated a higher
sensitivity, as previously reported (King et al., 2013b), inter-elec-
trode information exchanges increased from VS to CS. VS patients
presented significant lower weighted symbolic mutual information
than both MCS and CS patients in the theta and alpha bands,
consistent with the theoretical notion that loss of consciousness in
VS reflects an impaired exchange of information across brain
areas, and particularly over medium-to-long cortico-cortical
distances (King et al., 2013b).
Quantifying the electroencephalogra-phy differences between groups ofpatients with disorders ofconsciousnessAlthough the above analysis evaluated the topographical differ-
ences across groups, judging discrimination capacity in sensor
space while correcting for multiple comparisons over the large
number of available electrodes poses a difficult statistical problem.
To reduce dimensionality and quantify the discriminative power of
each measure, we summarized spatial information by considering
the average over all scalp electrodes or, in the case of event-
related potentials, over predefined electrodes forming a priori
regions of interest (see Supplementary material for details of
region of interest selection). All individual trial measures were
summarized in their intertrial average and in their fluctuation
(SD) during the recording period. In the case of event-related
measures, we also applied a systematic within-subject decoding
approach for local and global responses to auditory novelty,
following the procedure described in King et al. (2013a), which
enhanced the discrimination of these conditions. This approach
ultimately yielded a total of 92 measures per subject (see
Supplementary Tables 1 and 2 for numerical summaries of each
measure in each group).
To investigate which measures showed significant differences
across groups of patients, we implemented receiver operator
curves (Supplementary Fig. 5) and quantified classification per-
formance with the AUC. A strict criterion based on false discovery
rate (FDR) was applied to correct for multiple comparisons (92
values � three tests: VS–MCS, MCS–CS and VS-CS). An AUC of
50% corresponds to chance classification. An AUC 450% implies
that the measure increases with conscious state (i.e. MCS4VS),
whereas AUC 550% implies a decrease with conscious state (i.e.
MCS5VS).
Average spectrum, complexity,connectivity, and global responsesto novelty provide efficient signaturesof consciousnessAnalysis of the discrimination performance of the EEG measures
revealed that the most discriminative measure was weighted sym-
bolic mutual information, which separated VS from MCS (wSMI�:
AUC = 74 � 4%, PFDR50.0001) and CS patients (wSMI�:
AUC = 78 � 6%, PFDR50.001). Power spectrum measures also
performed well: increased normalized delta power separated VS
from MCS (AUC = 31 � 4%, PFDR5 0.001) and from CS patients
(AUC = 19 � 4%, PFDR50.0002), whereas the converse occurred
in higher frequency bands, with decreased normalized alpha
power segregating VS from MCS (AUC = 72 � 4%,
PFDR50.0002) and from CS patients (AUC = 85 � 5%,
PFDR50.0001). A third variable affording accurate classification
6 | Brain 2014: Page 6 of 13 J. D. Sitt et al.
by guest on June 20, 2014http://brain.oxfordjournals.org/
Dow
nloaded from
was permutation entropy in theta frequency range, discriminating
VS from the other groups (permutation entropy�: MCS4VS,
AUC = 72 � 4%, PFDR50.0002, CS4VS, AUC = 83 � 5%,
PFDR50.0001). Finally, the decoding of the global effect (the
event-related potential response to deviant auditory sequences;
Bekinschtein et al., 2009; King et al., 2013a) also separated VS
from MCS (AUC = 62 � 5%, PFDR50.05) and CS patients
(AUC = 81 � 6%, PFDR5 0.0002).
We tested whether the discrimination performance of the EEG
measures was consistent across the different aetiologies of pa-
tients. To this end, for each EEG measure, we performed an
ANOVA with factors of consciousness state (three levels: VS,
MCS, CS) and aetiology (four levels: traumatic brain injury,
anoxia, stroke, and other). We observed main effects of state of
consciousness for the same measures that showed an efficient
state discrimination (Supplementary Table 5). However, no
marker showed a main effect of aetiology or an interaction
between state and aetiology after FDR correction for multiple
comparisons (Supplementary Table 5). Similarly, we tested the
effect of delay from the date of the accident. We categorized
the patients according to the delay as acute (521 days) or chronic
(421 days). Again, a main effect of state of consciousness was
found for most of the successful measures but no measure showed
a main effect of delay or an interaction after FDR correction for
multiple comparisons (Supplementary Table 6).
One issue is that the vigilance level can be confounded with VS/
MCS differences. Indeed, the clinical assessment of the CRS-R
subscore corresponding to the arousal level showed a small in-
crease in the MCS group as compared to the VS group
(mean � SEM, MCS: 1.53 � 0.07, VS: 1.30 � 0.05, P = 0.013).
To rule out this potential confound and isolate the variations spe-
cifically due to consciousness, we replicated the previous analysis
in the subset of VS and MCS patients with CRS-R arousal subscore
of 1, corresponding to patients that presented eye opening only to
stimulation (VS: 52 recordings, MCS: 32 recordings). Performance
of the EEG measures was essentially unchanged in this vigilance-
controlled subset of patients as compared to the overall compari-
son (Supplementary Fig. 6 and Supplementary Table 3).
Fluctuation of measures across trialsconvey independent informationThe stability of evoked activity has been proposed as a marker of
consciousness (Schurger et al., 2010). We then hypothesized that
EEG variability over time, quantified as the fluctuations of a given
measure across trials, might add independent information about
consciousness, relative to its mere average value. The results
confirmed that EEG fluctuations had important discriminative in-
formation (Fig. 3). Interestingly, we did not always observe a
positive correlation between the classifying power of a given
measure based on its average and on its fluctuations. Figure 4
provides a graphical comparison of discrimination power based
on the mean or the fluctuation of each measure for the MCS/
VS contrast. Different types of measures can be distinguished.
Some simply fail to separate these two groups (e.g. low gamma
power). Others show a significant increase in both the average
and the fluctuation over time for MCS compared to VS (this is the
case for power in theta, alpha and beta bands, median spectral
frequency and wSMI�). Yet other measures exhibit dissociation
between average and fluctuation. In particular, the state of con-
sciousness is associated with a high average but a low fluctuation
of algorithmic (or Kolmogorov-Chaitin) complexity (K), permuta-
tion entropy (PE)� and PE�, indicating that a stable and lasting
increase in complexity and entropy reflects a conscious patient.
Conversely, the state of consciousness is associated with a low
average and high fluctuation of power and phase-locking index
in the delta band: while fluctuating slow cortical potentials, cover-
ing the delta range, are typical in the normal conscious brain
(He et al., 2009), stable and intense delta waves are a sign of
unconsciousness in anaesthesia and deep sleep (Franks, 2008).
Finally, the remaining measures were discriminative only for aver-
ages (i.e. spectral entropy) or for fluctuations across trials
(i.e. phase-locking index in beta and alpha bands). The latter find-
ing may suggest that consciousness implies a constantly fluctuat-
ing stream of transiently phase-locked brain states.
Combining measures improvesdiscriminationWe next examined whether these EEG measures could be
combined to improve discrimination of the different states of
consciousness, particularly in the crucial VS/MCS comparison.
One goal was to determine whether these markers act in concert,
and be thus combined to improve discrimination between groups
or whether these measures are redundant. In this latter case, the
best measure would provide information comparable to the entire
set of measures. To this aim we used a multivariate classification
method based on a support vector machine (Pedregosa et al.,
2011). The support vector machine was applied to all VS and
MCS recordings. To avoid over-fitting, the support vector machine
was repeatedly fitted and evaluated on independent data sets
using stratified nested cross-validation. It took as input a measure
or set of measures, and output the estimated probability for a
given recording to belong to the VS group. Results showed that
when the classifier was set to use the best cross-validated single
measure the performance reached an AUC = 71 � 4%, for the
VS-MCS comparison. By contrast, when using the whole set of
measures, AUC was significantly higher than when using the best
single measure: VS-MCS: AUC = 78 � 4% (P50.001). In other
words, measures were not entirely redundant, and the support
vector machine provided an efficient way to identify the combina-
tion of markers that leads to a better discrimination of the patients
states of consciousness.
Automatic classification of patients’state of consciousnessA main clinical objective of this work was to develop an automatic
system that potentially helps physicians to detect consciousness in
non-communicating patients. For this, we evaluated the perform-
ance of the support vector machine classifier to differentiate VS
patients from MCS patients, i.e. to reliably identify the presence of
Large scale screening of neural signatures Brain 2014: Page 7 of 13 | 7
by guest on June 20, 2014http://brain.oxfordjournals.org/
Dow
nloaded from

a clinically detectable state of consciousness. The classifier achieved
above-chance levels of accuracy [�2 (2, n = 143) = 26.7, P = 10�7]:
67% (50 of 75) of VS-diagnosed patients and 76% (52 of 68) of
MCS-diagnosed patients were classified in their respective clinical
categories solely from their brain activity (Fig. 5). To test for robust-
ness, we also evaluated whether the same classifier, trained to distin-
guish VS from MCS patients, generalized to CS patients and healthy
subjects. The great majority of these recordings (89%, 34 of 38) were
classified as conscious (MCS rather than VS).
To train our classifier, we relied on clinical labels (VS and MCS)
that derive solely from behavioural observations and need not
provide a perfect ‘gold standard’ (Owen et al., 2006). A
disagreement between the automatic classification and the clinical
label may represent an error of the classifier, but it may also in-
dicate the presence of EEG-based information not accessible to the
clinician. To investigate whether the information derived from
neurophysiological activity may improve diagnosis, we tested
whether VS patients classified as MCS from their EEG activity
would later show signs of intentional behaviour that may have
been missed at the time of the recording. Most patients classified
as VS on both clinical and EEG-based criteria showed no signs of
regaining consciousness in the six weeks following EEG recording
[recovery 521 days: 10 (20%); recovery within 21–42 days: 1
(2%); no recovery: 39 (78%)]. By contrast, among the clinically
Figure 3 Discrimination power for all measures. Each line provides a summary report of its respective measure. The meaning of each
acronym can be found in the Supplementary material. The measures are ordered according to the taxonomy presented in Table 1. The
location of each dot corresponds to the AUC for a pair-wise comparison between two states of consciousness (see ‘Materials and methods’
section). Chance level corresponds to AUC = 50% (central vertical line). An AUC450% suggests that the corresponding measure is
correlated with the state of consciousness (from VS to MCS and CS). An AUC 550% suggests that the corresponding measure is anti-
correlated with the state of consciousness. Dot colour and size indicate the type and significance of the comparison (see legend). The red
colour highlights the minimal contrast between the MCS and VS states of consciousness. As the contingent negative variation and MMN
are negative EEG components, their respective AUC was computed after changing the sign of their amplitudes.
8 | Brain 2014: Page 8 of 13 J. D. Sitt et al.
by guest on June 20, 2014http://brain.oxfordjournals.org/
Dow
nloaded from

VS patients classified as MCS based on their EEG activity, the
proportion of those who later showed signs of consciousness sig-
nificantly increased [recovery 521 days: 8 (32%); recovery within
21–42 days: 3 (12%); no recovery: 12 (48%); unknown: 2
(8%)].The number of subjects who recovered consciousness was
significantly higher for VS patients classified as MCS than for those
classified as VS [�2(2, n = 73) = 4.99, P = 0.025]. It should be
emphasized that clinical assessment at the time of the recording,
based on the full CRS-R or its subscores, neither predicted the VS
patients’ recovery nor the automatic classification category
(Supplementary material). We then investigated which of the
EEG measures that successfully identified the state of conscious-
ness were also efficient in predicting the recovery of VS patients.
Results show that the patients recovering from VS (recovery 542
days), relative to non-recovering ones, tended to exhibit a higher
contingent negative variation, higher normalized power in the
theta frequency band, and smaller phase-locking index in the
delta frequency band. These results should be considered explora-
tory, however, given that these results achieved significance only
at an uncorrected P50.05 level (Supplementary Table 7).
In summary, within a behaviourally indistinguishable group of
clinical VS patients, neurophysiological measures provided infor-
mation about the future improvement of consciousness, suggest-
ing a better functional status at the time of recording than the one
indicated by the clinical diagnosis.
DiscussionWe systematically evaluated putative signatures of consciousness
in a large data set of high-density bedside EEG recordings of
patients suffering or recovering from disorders of consciousness.
An important feature of our study is that we included all patients
with disorders of consciousness within a �2-year period, thus
ensuring an unbiased sampling and maximizing clinical relevance.
By testing 92 candidate measures arising from previous empirical
and theoretical research, we showed that patients’ EEG contains
many useful features that discriminate between VS and CS. Each
of these measures can thus index consciousness, either directly, or
indirectly through its consequences on arousal, instruction under-
standing, active maintenance of stimuli and instructions in working
memory, and task monitoring, etc. Crucially, only a few of these
measures were effective in discriminating the minimal contrast be-
tween VS and MCS patients. We focus the discussion on this
subset of measures, which seem most relevant to the objective
identification of conscious processing from the patterns of EEG
activity.
Figure 5 Comparison of EEG-based classification with clinical
diagnosis and patients’ outcome. (A) Confusion matrix showing,
on the y-axis, the clinical diagnosis (VS, MCS or CS/Healthy),
and on the x-axis, the prediction using the automatic classifier
based on EEG measures (VS or MCS). The number of recordings
and their respective percentages within each clinical state cate-
gory are reported in each cell. For VS and MCS patients
EEG-based classification matches the clinical diagnosis in a ma-
jority of cases. Using the same classifier (trained to predict VS or
MCS state) the top cells show the predicted condition for CS and
healthy subjects. The majority of these recordings were classified
as MCS. Non-matching cells can suggest inappropriate classifi-
cations, but may also indicate that EEG measures are detecting
information unseen by clinicians. (B) The pie charts show the
clinical outcome of the VS patients, as a function of whether EEG
measures classified them as VS or in a higher state of con-
sciousness (MCS or CS). The probability of recovery was sig-
nificantly higher (P = 0.02) for patients classified into a higher
state of consciousness than for patients predicted to be truly VS.
Figure 4 Summary of the measures discriminating VS and MCS
patients. Each measure is plotted in a 2D graph. Acronyms
meanings can be found in the Supplementary material.
The x-axis indicates discriminatory power for each measure’s
average across trials, whereas the y-axis indicates discriminatory
power for their respective fluctuations across trials. For instance,
the Kolmogorov-Chaitin complexity (K) measure appears in the
bottom right quadrant, suggesting that its average value is
significantly higher in MCS than in VS, whereas its standard
deviation, conversely, is higher in VS than in MCS. Large circles
indicate significant measures (PFDR50.05). Non-significant
measures are indicated with small dots.
Large scale screening of neural signatures Brain 2014: Page 9 of 13 | 9
by guest on June 20, 2014http://brain.oxfordjournals.org/
Dow
nloaded from

Spectral power analysis revealed that alpha and theta power
was significantly lower in VS than in MCS patients, whereas
delta power showed the opposite pattern. Similar increases in
low-frequency oscillations are a classical observation in coma
and deep sleep (Posner et al., 2007). Here we demonstrate their
relevance to distinguish VS from MCS patients, as recently re-
ported in smaller groups of patients (Fellinger et al., 2011;
Lehembre et al., 2012; Lechinger et al., 2013). The fronto-parietal
topography of these spectral effects is consistent with a crucial
role of fronto-parietal networks in a ‘global workspace’ mediating
a serial stream of conscious states at theta-like frequencies (100–
300 ms per state) (Alkire et al., 2008; Vanhaudenhuyse et al.,
2010; Dehaene et al., 2011; Laureys et al., 2012). This regional
hypothesis should be confirmed with cortical source analysis,
which was not attempted here given the difficulty of obtaining
an accurate source model in patients with massive brain and skull
damage (King et al., 2011).
Spectral measures also exhibited greater fluctuations in MCS
than in VS patients. This finding agrees with the definition of
MCS as a fluctuating state (Giacino et al., 2005) and shows
that, contrariwise, a stable state of increased delta and reduced
alpha-theta power is a solid sign of unconsciousness. Finally, the
structure of the EEG spectrum, as measured by spectral entropy,
was increased in MCS and CS as opposed to VS patients. This
finding was previously reported to be relevant only in the acute
stage and in a much smaller subset of patients (14 VS versus 9
MCS) (Gosseries et al., 2011).
Multiple EEG measures of signal complexity (spectral entropy,
permutation entropy, algorithmic complexity) discriminated VS
from MCS patients. Indeed, both the average and the intertrial
stability of EEG complexity increased monotonically with the pa-
tients’ state of consciousness. This result confirms that the com-
plexity of cortical activity indexes consciousness, as explicitly
formulated for instance by the dynamic core model of Tononi
(2008). According to this model and related ones (Seth et al.,
2011), a minimal level of complexity in neuronal signals is required
to encode a rich and differentiated representation, thus singling it
out from the vast repertoire of potential contents of conscious-
ness. Regions specifically implicated in the coding of conscious
representations would thus show higher complexity during con-
scious than during unconscious states, as observed here.
We found that consciousness was indexed not only by a high
information complexity, but also by a stability of this complexity,
with reduced fluctuations during the 30-min recording. This result
extends to spontaneous EEG the findings of a recent functional
MRI study showing that neural activation patterns are more re-
producible when evoked by a visible than by an invisible stimulus
(Schurger et al., 2010). We hypothesize that this phenomenon
reflects one property of the conscious brain, which is to achieve
both a reproducible perception of identical sensory stimuli while
keeping an internal stream of computations of roughly constant
complexity even in the absence of sensory stimulation.
One of the most striking differences between patients was an
increase in functional connectivity measures around the theta (4–
8 Hz) frequency band (wSMI�) in MCS as compared to VS patients
(also see King et al., 2013b). This result strengthens previous
findings relating long-distance synchronization with conscious
states in patients with disorders of consciousness in similar fre-
quency bands (Schiff et al., 2005; Lehembre et al., 2012; Leon-
Carrion et al., 2012). In addition to generalizing this finding to a
large data set, our results clarify the topography of this large-scale
increase in communication. We observed a maximal effect over
mesio-parietal areas, in close agreement with recent work showing
the crucial role of precuneus and posterior cingulate as ‘hubs’ in a
long-distance cortical network that may underlie conscious inte-
gration (Schiff et al., 2005; Vogt and Laureys, 2005). Future re-
search should investigate whether a more detailed description of
this functional connectivity network, possibly aided by directional
connectivity analyses such as Granger causality (Gaillard et al.,
2009; Barrett et al., 2012; Lee et al., 2013), may also help to
distinguish these clinical groups.
The importance of long-distance cortical communication and
signal complexity in consciousness fits with a set of perturbational
transcranial magnetic stimulation-EEG studies conducted in pa-
tients with disorders of consciousness (Rosanova et al., 2012),
sleep (Massimini et al., 2005) and anaesthesia (Ferrarelli et al.,
2010), which revealed that the prolonged propagation of transcra-
nial magnetic stimulation-induced activation to distant sites sys-
tematically correlates with consciousness. More recently a
quantification of the structure of EEG-evoked responses to the
transcranial magnetic stimulation pulse has been presented
(Casali et al., 2013). In a small cohort of normal subjects and
patients, this measure, coined pertubational complexity index,
was found to discriminate conscious state across a broad range
of physiological, pharmacological and pathological conditions.
Further research should test whether a similar measure can be
obtained without the transcranial magnetic stimulation excitation
(Sitt et al., 2013). It may not be irrelevant that, in the present
study, long-distance communication and complexity were mea-
sured while patients were stimulated with a series of auditory
tones. Our results may partially reflect the brain state evoked by
these stimuli, thus paralleling those triggered by a transcranial
magnetic stimulation pulse. Recording EEG while patients are sti-
mulated with a challenging set of auditory stimuli, as we did here,
presents several advantages, including increased vigilance and the
capacity to simultaneously evaluate evoked and spontaneous brain
activity patterns. Nevertheless, future research will be needed to
disentangle which of our measures would continue to be discrim-
inative when applied to resting-state EEG.
We also found larger fluctuations of functional connectivity in
MCS than in VS patients, in particular in phase-locking index (from
delta to beta) and in weighted symbolic mutual information
(wSMI�). Recent studies conducted with epileptic patients with
implanted electrodes (SEEG) for presurgical mapping reported
that loss of consciousness during the transition from partial
simple to partial complex seizures was marked by a sudden exces-
sive increase in cortico-cortical and thalamo-cortical synchrony
(Lambert et al., 2012; Arthuis et al., 2009). Our results lead to
the testable prediction that this excessive synchrony, also observed
in propofol anaesthesia (Supp et al., 2011), would cause a marked
decrease of information complexity, which would in turn mark the
loss of consciousness.
EEG studies using active cognitive tasks to probe conscious
states often use event-related potentials as their main outcome
10 | Brain 2014: Page 10 of 13 J. D. Sitt et al.
by guest on June 20, 2014http://brain.oxfordjournals.org/
Dow
nloaded from

measure (Bekinschtein et al., 2009; Schnakers et al., 2009a).
Indeed, the auditory regularities violation task used here was de-
signed to dissociate the automatic and supposedly unconscious
MMN from the P3b complex associated with conscious access.
We previously demonstrated that this P3b component, which
indexes the detection of the violation of a global regularity, can
be useful as a specific marker of consciousness in individual pa-
tients, sometimes in advance of a clinical diagnosis (Faugeras
et al., 2011, 2012). The present results, however, indicate that
this traditional event-related potential averaging approach lacks
sensitivity in comparison with other EEG-based measures. Event-
related potential components may still contribute importantly to
diagnosis, but mostly when analysed with a multivariate pattern
analysis procedure that deals with interindividual differences (King
et al., 2013a), particularly in patients whose event-related poten-
tial topography may be significantly distorted relative to the
normal population.
The present results also show that event-related potential
fluctuations across trials provide a sensitive measure of conscious
state. Consistent with a previous functional MRI study (Schurger
et al., 2010), consciousness was characterized by more stereo-
typed responses to external stimuli. This result could also reflect
the fact that VS patients presented a greater power of spontan-
eous low-frequency EEG signals, non-phase-locked with incoming
stimuli and thus interfering with the reproducibility of evoked
signals.
Our conclusions are supported by a large sample of patients
with various aetiologies, robust methods controlling for multiple
comparisons, and a focus on the minimal contrast between VS and
MCS patients. It could be argued that differences in vigilance,
rather than consciousness, also distinguish MCS and VS patients.
Indeed, the CRS-R subscore of vigilance, measured just before the
recording session, was slightly larger in MCS than in VS patients.
However, most of the identified measures that distinguished VS
from MCS patients remained significant when contrasting individ-
uals with matched levels of vigilance. Thus, vigilance per se is
unlikely to contribute to the identification of the relevant
measures.
A significant gain in discrimination was obtained by combining
several EEG measures. This is an important result for both theor-
etical and clinical reasons. Theoretically, this gain of information
suggests that our markers tap onto distinct and dissociable fea-
tures of conscious states. From the medical perspective, our results
stress the usefulness of combining a subset of EEG measures
(spectral, informational and connectivity-based).
Although most patients were correctly decoded on the basis of
their EEG measures, the number of disagreements between the
automated and clinical diagnoses remained too high for individual
diagnosis. In particular, 24% of MCS patients, who manifested
clear-cut behavioural signs of consciousness on some occasions,
were classified as VS. We note, however, that the present study
was based on a single half-hour EEG recording. As the minimal
conscious state is defined by the presence of fluctuating signs,
assessed by repeated clinical evaluation, it seems entirely possible
that our examination was performed at a moment when these
patients’ consciousness lapsed. In the future, multiple sessions or
even 24-h EEG recordings might yield an improved clinical
discrimination. Although our accuracy in discriminating patients
is roughly comparable to that reported by other groups
(Schnakers et al., 2008; Fellinger et al., 2011; Gosseries et al.,
2011; Fingelkurts et al., 2012; Lehembre et al., 2012), these pre-
vious studies used smaller sample sets and were focused on quan-
tifying the power of a single EEG measure in discriminating pre-
selected groups of well-differentiated patients (e.g. non-overlap-
ping CRS-R scores for MCS and VS groups). The present study, by
contrast, tackles the more difficult problem of identifying residual
consciousness in a serial cohort of all patients admitted to our
clinic. Structural MRI was also reported to be efficient in discrimi-
nating patients (Fernandez-Espejo et al., 2011). Further work will
explore if the combination of multimodal (MRI + EEG) information
can achieve a better performance.
Conversely, 33% of clinically VS patients were classified as MCS
by their EEG patterns. Not all of these misclassifications may be
errors, however. Rather, in a subset of clinically defined VS pa-
tients, our decoder demonstrably discovered information indicating
a better functional status, as indicated by a higher rate of clinically
detectable recovery in the months after EEG recording. This result
fits with previous functional MRI findings indicating that the vege-
tative state is not a homogeneous category, and that some VS
patients may actually be minimally or even fully conscious (Owen
et al., 2006).
In conclusion, because EEG is a time-resolved, low-cost, wide-
spread, and easily repeatable method, it may supplement MRI or
functional MRI to identify VS patients with residual consciousness
or with a potential for future recovery. Our results point to the
possibility that a reduced set of EEG measures, selected for ex-
ample on the basis of their individual discrimination power, and
potentially computed from a few scalp electrodes, could ultimately
serve as a reliable bedside tool to probe consciousness in patients
with disorders of consciousness.
AcknowledgementsThe authors would like to thank to Gael Varoquaux, Marcello
Massimini and Aaron Schurger for useful discussions. This study
is dedicated to the patients and to their close relatives.
FundingThis work was supported by INSERM, CEA, by a senior ERC grant
‘NeuroConsc’ and the Spoelbech foundation (S.D.), by the James
S. McDonnell Foundation (collaborative activity award), by the
Fondation pour la Recherche Medicale (FRM) (‘Equipe FRM
2010’ grant to L.N.), Institut pour le Cerveau et la Moelle epiniere
(ICM Institute, Paris, France), by the program ‘‘Investissements
d’avenir’’ ANR-10-IAIHU-06 and by A-HP, by the Direction
Generale de l’Armement (DGA) (J.-R.K.), by Stic-Amsud grant
‘RTBRAIN’ (J.D.S.), by the James McDonell Foundation 21st
Century Science Initiative in Understanding Human Cognition-
Scholar Award (M.S.) and AXA Research Fund to I.E.K.
Large scale screening of neural signatures Brain 2014: Page 11 of 13 | 11
by guest on June 20, 2014http://brain.oxfordjournals.org/
Dow
nloaded from

Supplementary materialSupplementary material is available at Brain online.
ReferencesAlkire MT, Hudetz AG, Tononi G. Consciousness and anesthesia. Science
2008; 322: 876–80.
Arthuis M, Valton L, Regis J, Chauvel P, Wendling F, Naccache L, et al.
Impaired consciousness during temporal lobe seizures is related to
increased long-distance corticalsubcortical synchronization. Brain
2009; 132: 2091–101.Bandt C, Pompe B. Permutation entropy: a natural complexity measure
for time series. Phys Rev Lett 2002; 88: 1–4.
Barrett AB, Murphy M, Bruno MA, Noirhomme Q, Boly M, Laureys S,
et al. Granger causality analysis of steady-state electroencephalo-
graphic signals during propofol-induced anaesthesia. PLoS One
2012; 7: e29072.
Bekinschtein TA, Dehaene S, Rohaut B, Tadel F, Cohen L, Naccache L.
Neural signature of the conscious processing of auditory regularities.
Proc Natl Acad Sci USA 2009; 106: 1672–7.Casali AG, Gosseries O, Rosanova M, Boly M, Sarasso S, Casali KR, et al.
A theoretically based index of consciousness independent of sensory
processing and behavior. Sci Transl Med 2013; 5: 198ra105.
Cruse D, Chennu S, Chatelle C, Bekinschtein TA, Fernandez-espejo D,
Pickard JD, et al. Bedside detection of awareness in the vegetative
state: a cohort study. Lancet 2011; 378: 2088–94.
Dehaene S, Changeux JP. Experimental and theoretical approaches to
conscious processing. Neuron 2011; 70: 200–27.
Dehaene S, Naccache L. Towards a cognitive neuroscience of conscious-
ness: basic evidence and a workspace framework. Cognition 2001; 79:
1–37.
Faugeras F, Rohaut B, Weiss N, Bekinschtein TA, Galanaud D,
Puybasset L, et al. Probing consciousness with event-related potentials
in the vegetative state. Neurology 2011; 77: 264–8.Faugeras F, Rohaut B, Weiss N, Bekinschtein T, Galanaud D,
Puybasset L, et al. Event related potentials elicited by violations of
auditory regularities in patients with impaired consciousness.
Neuropsychologia 2012; 50: 403–18.
Fellinger R, Klimesch W, Schnakers C, Perrin F, Freunberger R,
Gruber W, et al. Cognitive processes in disorders of consciousness as
revealed by EEG time-frequency analyses. Clin Neurophysiol 2011;
122: 2177–84.
Fernandez-Espejo D, Bekinschtein T, Monti MM, Pickard JD, Junque C,
Coleman MR, et al. Diffusion weighted imaging distinguishes the
vegetative state from the minimally conscious state. Neuroimage
2011; 54: 103–12.
Ferrarelli F, Massimini M, Sarasso S, Casali A, Riedner BA, Angelini G,
et al. Breakdown in cortical effective connectivity during midazolam-
induced loss of consciousness. Proc Natl Acad Sci USA 2010; 107:
2681–6.
Fingelkurts AA, Bagnato S, Boccagni C, Galardi G. EEG oscillatory states
as neuro-phenomenology of consciousness as revealed from patients
in vegetative and minimally conscious states. Conscious Cogn 2012;
21: 149–69.Fischer C, Luaute J, Adeleine P, Morlet D. Predictive value of sensory and
cognitive evoked potentials for awakening from coma. Neurology
2004; 63: 669–73.
Franks NP. General anaesthesia: from molecular targets to neur-
onal pathways of sleep and arousal. Nat Rev Neurosci 2008; 9:
370–86.
Gaillard R, Dehaene S, Adam C, Clemenceau S, Hasboun D, Baulac M,
et al. Converging intracranial markers of conscious access. PLoS Biol
2009; 7: e1000061.
Giacino JT, Kalmar K. Diagnostic and prognostic guidelines for the vege-
tative and minimally conscious states. Neuropsychol Rehabil 2005; 15:
166–74.
Goldfine AM, Victor JD, Conte MM, Bardin JC, Schiff ND.
Determination of awareness in patients with severe brain injury
using EEG power spectral analysis. Clin Neurophysiol 2011; 122:
2157–68.Gosseries O, Schnakers C, Ledoux D, Vanhaudenhuyse A, Bruno MA,
Demertzi A, et al. Automated EEG entropy measurements in coma,
vegetative state/unresponsive wakefulness syndrome and minimally
conscious state. Funct Neurol 2011; 26: 25–30.
He BJ, Raichle ME. The fMRI signal, slow cortical potential and con-
sciousness. Trends Cogn Sci 2009; 13: 302–9.
Kayser J, Tenke CE. Principal components analysis of Laplacian wave-
forms as a generic method for identifying ERP generator patterns: I.
Evaluation with auditory oddball tasks. Clin Neurophysiol 2006; 117:
348–68.King JR, Bekinschtein T, Dehaene S. Comment on “Preserved feedfor-
ward but impaired top-down processes in the vegetative state”.
Science 2011; 334: 1203.
King JR, Faugeras F, Gramfort A, Schurger A, El Karoui I, Sitt JD, et al.
Single-trial decoding of auditory novelty responses facilitates the de-
tection of residual consciousness. Neuroimage 2013a; 83: 726–38.
King JR, Sitt JDD, Faugeras F, Rohaut B, El Karoui I, Cohen L, et al.
Information sharing in the brain indexes consciousness in noncommu-
nicative patients. Curr Biol 2013b; 23: 1914–9.
Koivisto M, Revonsuo A, Lehtonen M. Independence of visual awareness
from the scope of attention: an electrophysiological study. Cereb
Cortex 2006; 16: 415–24.Lambert I, Arthuis M, McGonigal A, Wendling F, Bartolomei F. Alteration
of global workspace during loss of consciousness: a study of parietal
seizures. Epilepsia 2012; 53: 2104–10.
Lamme VA, Roelfsema PR. The distinct modes of vision offered by feed-
forward and recurrent processing. Trends Neurosci 2000; 23: 571–579.
Lau HC, Passingham RE. Relative blindsight in normal observers and the
neural correlate of visual consciousness. Proc Natl Acad Sci USA 2006;
103: 18763–8.
Laureys S. The neural correlate of (un)awareness: lessons from the vege-
tative state. Trends Cogn Sci 2005; 9: 556–9.
Laureys S, Schiff ND. Coma and consciousness: paradigms (re)framed by
neuroimaging. Neuroimage 2012; 61: 478–91.
Lechinger J, Bothe K, Pichler G, Michitsch G, Donis J, Klimesch W, et al.
CRS-R score in disorders of consciousness is strongly related to spectral
EEG at rest. J Neurol 2013; 260: 2348–56.
Lee U, Ku S, Noh G, Baek S, Choi B, Mashour GA. Disruption of frontal-
parietal communication by ketamine, propofol, and sevoflurane.
Anesthesiology 2013; 118: 1264–75.Lehembre R, Marie-Aurelie B, Vanhaudenhuyse A, Chatelle C,
Cologan V, Leclercq Y, et al. Resting-state EEG study of comatose
patients: a connectivity and frequency analysis to find differences be-
tween vegetative and minimally conscious states. Funct Neurol 2012;
27: 41–7.
Leon-Carrion J, Leon-Dominguez U, Pollonini L, Wu M-H, Frye RE,
Dominguez-Morales MR, et al. Synchronization between the anterior
and posterior cortex determines consciousness level in patients with
traumatic brain injury (TBI). Brain Res 2012; 1476: 22–30.
Lumer ED, Rees G. Covariation of activity in visual and prefrontal cortex
associated with subjective visual perception. Proc Natl Acad Sci USA
1999; 96: 1669–1673.
Marois R, Yi DJ, Chun MM. The neural fate of consciously
perceived and missed events in the attentional blink. Neuron 2004;
41: 465–472.
Massimini M, Ferrarelli F, Huber R, Esser SK, Singh H, Tononi G.
Breakdown of cortical effective connectivity during sleep. Science
2005; 309: 2228–32.Melloni L, Molina C, Pena M, Torres D, Singer W, Rodriguez E.
Synchronization of neural activity across cortical areas correlates with
conscious perception. J Neurosci 2007; 27: 2858–65.
12 | Brain 2014: Page 12 of 13 J. D. Sitt et al.
by guest on June 20, 2014http://brain.oxfordjournals.org/
Dow
nloaded from

Monti MM, Vanhaudenhuyse A, Coleman MR, Boly M, Pickard JD,Tshibanda L, et al. Willful modulation of brain activity in disorders of
consciousness. N Engl J Med 2010; 362: 579–89.
Naccache L, Puybasset L, Gaillard R, Serve E, Willer JC. Auditory mis-
match negativity is a good predictor of awakening in comatosepatients: a fast and reliable procedure. Clin Neurophysiol 2005; 116:
988–89.
Owen AM, Coleman MR, Boly M, Davis MH, Laureys S, Pickard JD.
Detecting awareness in the vegetative state. Science 2006; 313: 1402.Pascual-Leone A, Walsh V. Fast backprojections from the motion to the
primary visual area necessary for visual awareness. Science 2001; 292:
510–2.Pedregosa F, Varoquaux G, Gramfort A, Michel V, Thirion B, Grisel O,
et al. Scikit-learn: machine learning in python. J Mach Learn Res 2011;
12: 2825–2830.
Pins D. The neural correlates of conscious vision. Cereb Cortex 2003; 13:461–74.
Posner JB, Saper CB, Schiff N, Plum F. Plum and Posner’s diagnosis of
stupor and coma. New York, NY: Oxford University Press; 2007.
Rees G, Kreiman G, Koch C. Neural correlates of consciousness inhumans. Nat Rev Neurosci 2002; 3: 261–70.
Rosanova M, Gosseries O, Casarotto S, Boly M, Casali AG, Bruno MA,
et al. Recovery of cortical effective connectivity and recovery
of consciousness in vegetative patients. Brain 2012; 135 (Pt 4):1308–20.
Sahraie A, Weiskrantz L, Barbur JL, Simmons A, Williams SCR,
Brammer MJ. Pattern of neuronal activity associated with consciousand unconscious processing of visual signals. Proc Natl Acad Sci USA
1997; 94: 9406–11.
Schiff ND, Rodriguez-Moreno D, Kamal A, Kim KHS, Giacino JT, Plum F,
et al. fMRI reveals large-scale network activation in minimally con-scious patients. Neurology 2005; 64: 514–23.
Schnakers C, Ledoux D, Majerus S, Damas P, Damas F, Lambermont B,
et al. Diagnostic and prognostic use of bispectral index in coma, vege-
tative state and related disorders. Brain Inj 2008; 22: 926–31.Schnakers C, Perrin F, Schabus M, Hustinx R, Majerus S, Moonen G,
et al. Detecting consciousness in a total locked-in syndrome: an active
event-related paradigm. Neurocase 2009a; 15: 271–7.
Schnakers C, Vanhaudenhuyse A, Giacino J, Ventura M, Boly M,
Majerus S, et al. Diagnostic accuracy of the vegetative and minimally
conscious state: clinical consensus versus standardized neurobehavioral
assessment. BMC Neurol 2009b; 9: 35.
Schurger A, Pereira F, Treisman A, Cohen JD. Reproducibility distin-
guishes conscious from non-conscious neural representations. Science
2010; 327: 97–9.
Sergent C, Baillet S, Dehaene S. Timing of the brain events underlying
access to consciousness during the attentional blink. Nat Neurosci
2005; 8: 1391–400.
Seth AK, Barrett AB, Barnett L. Causal density and integrated information
as measures of conscious level. Philos Trans A Math Phys Eng Sci
2011; 369: 3748–67.
Sitt JD, King JR, Naccache L, Dehaene S. Ripples of consciousness.
Trends Cogn Sci 2013; 17: 552–4.
Super H, Spekreijse H, Lamme VA. Two distinct modes of sensory pro-
cessing observed in monkey primary visual cortex (V1). Nat Neurosci
2001; 4: 304–10.
Supp GG, Siegel M, Hipp JF, Engel AK. Cortical hypersynchrony predicts
breakdown of sensory processing during loss of consciousness. Curr
Biol 2011; 21: 1988–93.
Tononi G. Consciousness as integrated information: a provisional mani-
festo. Biol Bull 2008; 215: 216–42.Vanhaudenhuyse A, Noirhomme Q, Tshibanda LJ, Bruno MA,
Boveroux P, Schnakers C, et al. Default network connectivity reflects
the level of consciousness in non-communicative brain-damaged pa-
tients. Brain 2010; 133 (Pt 1): 161–71.
Vogt BA, Laureys S. Posterior cingulate, precuneal and retrosplenial cor-
tices: cytology and components of the neural network correlates of
consciousness. Prog Brain Res 2005; 150: 205–17.
Vuilleumier P, Sagiv N, Hazeltine E, Poldrack RA, Swick D, Rafal RD,
et al. Neural fate of seen and unseen faces in visuospatial neglect: a
combined event-related functional MRI and event-related potential
study. Proc Natl Acad Sci USA 2001; 98: 3495–500.
Wijnen VJM, van Boxtel GJM, Eilander HJ, de Gelder B. Mismatch nega-
tivity predicts recovery from the vegetative state. Clin Neurophysiol
2007; 118: 597–605.
Large scale screening of neural signatures Brain 2014: Page 13 of 13 | 13
by guest on June 20, 2014http://brain.oxfordjournals.org/
Dow
nloaded from