BQI 2010 - Executive Summary
10
Boston Quality Inventory 2010: Community Early Care and Education Programs Executive Summary Report Prepared for Boston EQUIP by Nancy L. Marshall, Ed.D. Julie Dennehy, M.M. Wendy Wagner Robeson, Ed.D. Joanne Roberts, Ph.D. Work, Families and Children Research Group October 29, 2010
-
Upload
boston-equip -
Category
Documents
-
view
212 -
download
0
description
Â
Transcript of BQI 2010 - Executive Summary

Boston Quality Inventory – 2010
Boston Quality Inventory 2010:
Community Early Care and Education Programs
Executive Summary
Report Prepared for Boston EQUIP by
Nancy L. Marshall, Ed.D. Julie Dennehy, M.M.
Wendy Wagner Robeson, Ed.D. Joanne Roberts, Ph.D.
Work, Families and Children Research Group
October 29, 2010

Boston Quality Inventory – 2010
Preface The Boston Quality Inventory – 2010 was conducted by a team of researchers, led by Dr. Nancy
Marshall, of the Work, Families and Children Research Group at the Wellesley Centers for
Women. We wish to thank the program directors, providers, teachers and staff who welcomed
us into their programs and classrooms, and the many families who participated in this study. We
also wish to thank our research staff and colleagues who brought their skills and experience in
early education and care programs to the Boston Quality Inventory 2010. The research team
worked in collaboration with Boston EQUIP in the conduct of this study.1 The study was funded
by the Barr Foundation. However, the findings of this report and the views and opinions
expressed herein do not necessarily reflect those of Associated Early Care and Education,
Boston EQUIP or the Barr Foundation. Any errors are the sole responsibility of the authors.
Nancy L. Marshall, Ed.D., Julie Dennehy, M.M., Wendy Wagner Robeson, Ed.D., and Joanne
Roberts, Ph.D.
October 29, 2010
Recommended citation: Marshall, NL, Dennehy, J., Robeson, WW. & Roberts, J. 2010. Boston Quality Inventory 2010: Community Early Care and Education Programs. Executive Summary. Wellesley Centers for Women, Wellesley College, Wellesley, MA
1 For more information about The Boston Early Education Quality Improvement Project (Boston EQUIP), a project of Associated Early Care and Education, please visit their website: http://www.bostonequip.org/.

1
Boston Quality Inventory – 2010
Executive Summary
The research evidence is clear – the early years are essential to children’s school readiness. The existing research from multiple disciplines clearly indicates that early childhood is a critical time for children to develop the foundations that they need, so that all children enter first grade ready to learn.D
1D While families play the most important role, early care and education programs
have a significant effect on children’s growth and development. High quality early childhood programs are related to children’s cognitive and school outcomes, especially for children from low-income families.2,3,4 High-quality early childhood education has been found to produce lasting gains on achievement tests, and reduced rates of grade retention or placement in special education services.5
The early years are also crucial years for the development of social skills – the ability to make friends, to get along well with others, to cooperate in group activities, to understand others’ perspectives – skills that are necessary to the development of self-esteem and social relationships, and to later school success. Research has found that higher quality early care and education is associated with young children’s social and emotional development.6
The No Child Left Behind Act (NCLB) brought national attention to the achievement gap that exists for children from economically disadvantaged families, different race and ethnic groups and linguistic minority families. The National Governors Association Program for Best Practices recommended that education policies address early childhood education as one way to close the achievement gap.7
Early care and education programs also provide important support to working families. Formal early childhood programs both keep children safe while parents are at work and provide the developmental supports that young children need to learn and grow. High quality early care and education programs have the potential to facilitate parents’ employment and prepare all children for formal schooling, by supporting their cognitive and social development.
Thrive in 5, a citywide initiative, developed a School Readiness Roadmap for Boston, which was released in 2008. One of the goals of the Thrive in 5 Roadmap is for Boston to “become the city with the highest quality early education and care system for all young children – infants, toddlers, preschoolers and kindergartners – in all settings: family child care, private/community-based centers, Head Start/Early Head Start, and school-based early education.” To meet this goal, Thrive in 5 identified a variety of strategies, including accreditation of early education and care programs, professional development of educators, improvement of the quality of all early education and care programs to ensure safe, stimulating learning environments, improved access to early education and care, and greater integration of health and social services, and family engagement, into models of quality early education and care.
The Boston Quality Inventory - 2010 The Boston Quality Inventory 2010 (BQI-2010) provides an assessment of Boston’s early education and care programs, with data collected from random samples of licensed programs (68 center-based programs serving infants, toddlers and/or preschoolers, and 51 family child care homes). Of the 68 licensed centers participating in the BQI-2010, three-quarters (76%) were not-for-profit, non-religiously affiliated, programs and 9% were religiously affiliated not-for-profit programs. Another 9% of centers were for-profit programs that were part of a local or national chain, and 6% independently owned/operated programs. About 15% of center-based

2
Boston Quality Inventory – 2010
programs were Head Start or Early Head Start Programs. Most of the center-based programs (85%) offer full-year early care and education – open 5 days per week and at least 50 weeks a year. Two sample programs were open 7 days a week. Only 3% were open fewer than 40 weeks (9 months) per year and 7% of programs were open fewer than 6 hours per day.
Among the 51 licensed family child care providers participating in the BQI-2010, almost half (44%) of providers were licensed for Regular Family Child Care (up to 6 children); 25% were licensed as Family Child Care Plus (6 children under age 7, and 2 children over age 7), and 31% were licensed as Large Family Child Care (up to 10 children, with an EEC-approved Assistant). Two-thirds of all providers reported that they belonged to a family child care system. Providers offered child care year-round; 80% offered care 50-52 weeks a year and 20% offered care for 48-49 weeks a year. Providers offered care for 8.5 to 15.5 hours per day, 5 days a week. Four providers (8%) occasionally or regularly offered overnight care, none of the providers regularly offered weekend care.
The Boston Quality Inventory 2010 used a set of program assessment tools developed specifically for use in early care and education settings – the Early Childhood Environment Rating Scale-Revised (ECERS-R) for center-based preschool classrooms; the Infant-Toddler Environment Rating Scale (ITERS), 8 developed specifically for use in infant and toddler classrooms; and the Family Child Care Environment Rating Scale–Revised Edition (FCCERS–R), developed for family child care homes. The ECERS-R, ITERS and FCCERS provide benchmarks for different levels of quality, labeled Inadequate, Adequate, Good and Excellent. Programs that meet or exceed the Good benchmark are generally consistent with the National Association for the Education of Young Children (NAEYC) Early Childhood Program Standards and the National Association for Family Child Care (NAFCC) Quality Standards. Assessments of preschool classrooms were supplemented with the Classroom Assessment Scoring System (CLASS) and the Early Language and Literacy Classroom Observation (ELLCO). Assessments of infant/toddler classrooms and family child care homes, were supplemented with the Global Caregiving Rating Scale.9 All measures are described in detail in the Appendix. In addition, the Boston Quality Inventory included brief interviews with classroom teachers, surveys completed by program directors and family child care providers, and surveys completed by families with children in the selected programs.
Findings and Recommendations One of the goals of the Thrive in 5 Roadmap is for Boston to “become the city with the highest quality early education and care system for all young children – infants, toddlers, preschoolers and kindergartners – in all settings: family child care, private/community-based centers, Head Start/Early Head Start, and school-based early education.” The Boston Quality Inventory 2010 provides a picture of the current quality of family child care homes and center-based programs serving infants, toddlers and preschoolers.
The Quality of Early Education and Care Programs o More than half of preschool classrooms met the Good benchmark on the Curriculum Index
(62%) and the Emotional & Social Support Index (68%). However, only 40% of preschool classrooms met the Good benchmark on the Literacy Index, and only 16% met the Good benchmark on the Instructional Supports Index, a measure of effective teaching strategies.
3
Boston Quality Inventory – 2010
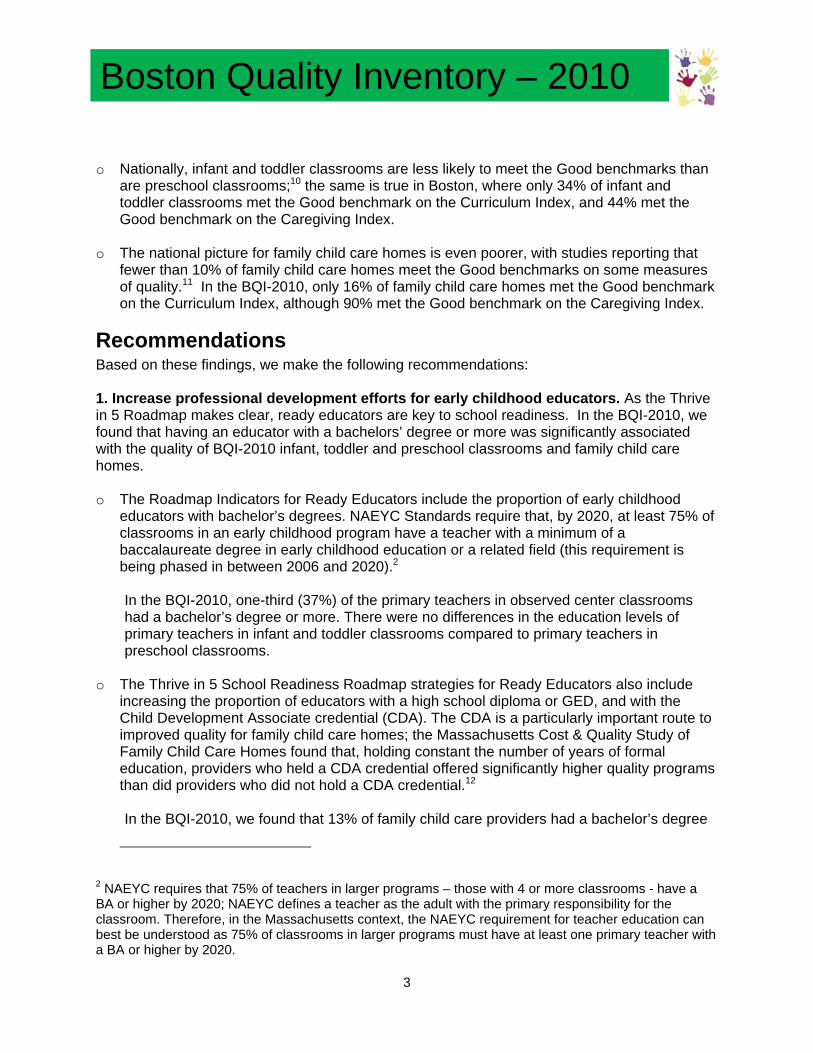
o Nationally, infant and toddler classrooms are less likely to meet the Good benchmarks than
are preschool classrooms;10 the same is true in Boston, where only 34% of infant and toddler classrooms met the Good benchmark on the Curriculum Index, and 44% met the Good benchmark on the Caregiving Index.
o The national picture for family child care homes is even poorer, with studies reporting that
fewer than 10% of family child care homes meet the Good benchmarks on some measures of quality.11 In the BQI-2010, only 16% of family child care homes met the Good benchmark on the Curriculum Index, although 90% met the Good benchmark on the Caregiving Index.
Recommendations Based on these findings, we make the following recommendations: 1. Increase professional development efforts for early childhood educators. As the Thrive in 5 Roadmap makes clear, ready educators are key to school readiness. In the BQI-2010, we found that having an educator with a bachelors’ degree or more was significantly associated with the quality of BQI-2010 infant, toddler and preschool classrooms and family child care homes. o The Roadmap Indicators for Ready Educators include the proportion of early childhood
educators with bachelor’s degrees. NAEYC Standards require that, by 2020, at least 75% of classrooms in an early childhood program have a teacher with a minimum of a baccalaureate degree in early childhood education or a related field (this requirement is being phased in between 2006 and 2020).2
In the BQI-2010, one-third (37%) of the primary teachers in observed center classrooms had a bachelor’s degree or more. There were no differences in the education levels of primary teachers in infant and toddler classrooms compared to primary teachers in preschool classrooms.
o The Thrive in 5 School Readiness Roadmap strategies for Ready Educators also include
increasing the proportion of educators with a high school diploma or GED, and with the Child Development Associate credential (CDA). The CDA is a particularly important route to improved quality for family child care homes; the Massachusetts Cost & Quality Study of Family Child Care Homes found that, holding constant the number of years of formal education, providers who held a CDA credential offered significantly higher quality programs than did providers who did not hold a CDA credential.12
In the BQI-2010, we found that 13% of family child care providers had a bachelor’s degree
2 NAEYC requires that 75% of teachers in larger programs – those with 4 or more classrooms - have a BA or higher by 2020; NAEYC defines a teacher as the adult with the primary responsibility for the classroom. Therefore, in the Massachusetts context, the NAEYC requirement for teacher education can best be understood as 75% of classrooms in larger programs must have at least one primary teacher with a BA or higher by 2020.

4
Boston Quality Inventory – 2010
or more, 19% held a CDA, 15% had an Associate’s degree, and 21% had some college. Only one provider had less than a high school education, and 14 providers (29%) only had their high school diploma or GED.
o The Thrive in 5 strategies for professional development included goals for the use of child
assessments by educators (which requires professional development). We found continuing high rates of child assessments by centers, compared to 2007, and a significant increase in the proportion of family child care providers conducting child assessments, either themselves or through their FCC system.
Over three-quarters of centers conduct their own cognitive/developmental and social-emotional assessments and screenings of children, or offer assessments through consultation. Over three-quarters of family child care providers are conducting their own cognitive/developmental and social-emotional assessments and screenings of children, or offer assessments through their FCC system; this is a significant increase over 2007, when fewer than half of all FCCs conducted child assessments.
2. Provide additional training for Boston early childhood educators. The BQI-2010 found specific areas where educators would benefit from additional training. Some of this training may be available through formal education, but even when teachers and providers have a BA degree, additional training has been found to be associated with higher quality.13
D
Specific areas of needed training include:
Preschool Classrooms o Strategies to promote reasoning skills and creativity through problem-solving and classroom
instruction, and to improve the quality of verbal feedback to children on their interactions, comments and ideas.
o Strategies to facilitate language and literacy development in the classroom and at home. Infant and Toddler Classrooms o Strategies to promote language development in infants and toddlers, through responses to
children’s attempts to communicate, talking to children frequently throughout the day, and reading books to interested children.
o Effective group management and discipline methods, such as maintaining awareness of the whole group even when with one or two children, responding quickly to problems, re-directing children from a negative situation to another activity, and attending to children when they are behaving well by communicating interest in what children do.
Family Child Care Homes o Strategies to promote language development in young children, through responses to
children’s attempts to communicate, talking to children frequently throughout the day. o Age-appropriate use of TV and other media, including monitoring the content of media,
providing alternative activities when the TV is on, and setting limits on the amount of media exposure.
o Methods for incorporating physical activity, both indoors and outdoors, into the program.

5
Boston Quality Inventory – 2010
3. Provide all classrooms and family child care homes with the materials needed to provide a high-quality early care and education program. Children in many programs had access to a range of materials, including fine motor materials, art materials, dramatic play materials, blocks, math/number materials, nature and science activities and materials, art materials, and sand and water play. However, many programs did not have the quantity and variety of materials needed to support a stimulating learning environment. In particular, preschool classrooms need a greater quantity and variety of materials for nature and science, math and number activities, art, and fine motor activities. Infant and toddler classrooms need an increased quantity and variety of materials for fine motor, music, nature and science activities, and blocks for children 12 months and older. Family Child Care Homes need increased supplies of blocks and increased quantity and variety of materials for nature and science, art, and music activities. 4. Improve health and safety practices in centers and family child care homes. Basic standards of health and safety are important to children’s learning environments. Because young children are still developing their own health and safety behaviors, early childhood classrooms face additional requirements when protecting the health and safety of young children. While classroom teachers and FCC providers followed many of the recommended health and safety practices at meal times, nap/rest times and throughout the day, there were problems in key areas, including hand washing and sanitary procedures to reduce the spread of germs, safety hazards in infant/toddler classrooms and family child care homes, and the lack of safe outdoor play space for many programs. Hand washing. The NAEYC and NAFCC standards require routine cleaning and sanitizing of tables and food preparation areas, clean bedding for each child for naps, and hand-washing by children and adults after toileting, before meals or snacks, and after eating finger foods. In the majority of classrooms and family child care homes, educators did not usually follow practices that would cut down on the spread of germs. Hand washing at meal time was inconsistent, with many adults failing to wash their hands while preparing meals or bottles and inconsistently ensuring that children washed their hands at meal times. In infant and toddler classrooms, and in family child care homes, hand washing after diaper changing was done either inconsistently or at inappropriate times to reduce the spread of contamination. These problems can be addressed through training. Safety hazards. Most infant and toddler classrooms and family child care homes had one or more safety hazards on the day of the observation visit. In infant and toddler classrooms, the most common hazards were exposed electric outlets, babies or toddlers being pulled up by the arms, staff cleaning tables with bleach or cleaners while children were still at the table, and toys that posed choking hazards. In family child care homes, the most common indoor hazards were infants sleeping on adult beds, cleaning supplies within reach, tripping hazards or unsafe stairs, and choking hazards from small toys or toys hung over cribs within reach of young children. All of these problems can be addressed through training. Outdoor play areas. NAEYC Standards require specific safety practices outdoors, including fencing or natural barriers for outdoor space to prevent access to streets and to avoid other dangers. Almost 20% of preschool classrooms, 48% of infant and toddler classrooms, and 65%

6
Boston Quality Inventory – 2010
of family child care homes, lacked easy access to safe, age-appropriate outdoor space and equipment. Many of these programs did not have their own outdoor space and relied instead on public playgrounds, which often lacked adequate fencing or well-maintained equipment, or required young children to walk along busy city streets to reach them. Improving public playgrounds, and providing on-site outdoor space for programs not located near improved playgrounds, would improve the health and safety of these programs. 5. Increase accreditation of programs by professional associations. The Thrive in 5 School Readiness Roadmap identifies program accreditation as one of the strategies to meet the goal of Ready Educators. Accreditation rates for family child care providers in the BQI-2010 are low; 11% were currently accredited or awaiting a NAFCC visit or decision. However, an additional 13% were in the process of self-study or interested in becoming accredited. Still, over three-quarters of providers (77%) had no plans to be NAFCC-accredited. Almost three-quarters of centers in the BQI-2010 were NAEYC-accredited or in the process of becoming accredited (62% currently accredited, 3% awaiting accreditation visit or NAEYC decision, 9% in self-study for less than 2 years). Another 16% were interested in accreditation, and 3% have been in self-study for more than 2 years. While the BQI-2010 found that accreditation, per se, did not predict levels of observed quality, the accreditation process supports programs’ investment in teacher qualifications, a significant predictor of quality in the BQI-2010. It is possible that, because accreditation is so wide-spread among Boston center-based programs, much of the improvements that other studies have found with accreditation have spread to Boston’s non-accredited programs as well, such as teacher qualifications and improved curriculum practices. In fact, classrooms in non-accredited programs are as likely as classrooms in accredited programs to have teachers with a BA. 6. Improve integration of physical and mental health services with early education and care. One of the indicators of program quality in the Thrive in 5 School Readiness Roadmap is the integration of health and social services with early education and care. While 43% of centers and 47% of family child care homes offer physical health screening, other programs offer it only by referral; physical health screening is not available even by referral in 24% of centers and 13% of family child care homes. Similarly, 39% of centers and 81% of family child care homes offer mental health screening; mental health screening is not available even by referral in 20% of FCC homes and 4% of centers, and is only available by referral in 53% of centers. While most centers and FCC homes either provide services or offer referrals for language and speech therapy, early intervention or physical and occupational therapy, there are still some programs that do not offer referrals for these important services – 9% of FCC homes do not offer referrals for language and speech therapy, 11% do not offer referrals for early intervention services; 6% of centers do not offer referrals for early intervention services.

7
Boston Quality Inventory – 2010
7. Provide information and support to centers and family child care homes not currently offering family education and connections for families to social services. One of the indicators of program quality in the Thrive in 5 School Readiness Roadmap is family engagement. Programs can increase family engagement by offering family education, as well as connections to social services. The majority of programs offer family education (68% of centers, 65% of family child care homes); however, 18% of centers and 22% of FCC homes do not offer family education. The majority (51%) of family child care homes offer connections to social services, such as WIC, another 32% of FCC homes offer referrals. However, only 23% of centers provide these connections themselves, 43% of centers offer referrals to social services. Programs can also support family engagement through daily communication between educators and families. Two-thirds of center families (67%), and 90% of FCC families, reported that they talk to their child’s teacher or provider almost every day; another 23% of center families and 8% of FCC families talk at least once or twice a week. 8. Improve the access of lower-income families to safe and stimulating learning environments for their children. Quality early care and education programs for low-income children can help to prepare children for formal schooling and thereby help to close the achievement gap. For early care and education programs to play this role in Boston, low-income children must have equal access to high quality programs. We found that the quality of preschool classrooms varied significantly with the incomes of the families using those programs. Preschool classrooms in Head Start programs, which serve low-income families, and in centers that served predominantly moderate and higher income families, were of higher quality than were preschool classrooms in non-Head Start centers that served primarily lower income families. We found similar patterns for the quality of infant and toddler classrooms, and family child care homes, although the differences between programs serving lower-income families and other programs were not statistically significant. To improve the access of lower-income families to quality programs, priority for implementing the recommendations in this report should be given to those programs serving lower-income families. In addition, given the high quality of Boston’s Head Start programs, which also serve low-income families, we recommend a review of the factors in these programs that contribute to higher quality early care and education.
8
Boston Quality Inventory – 2010
References
1 National Research Council and Institute of Medicine. 2000. From Neurons to Neighborhoods: The Science of Early Childhood Development. Shonkoff & Phillips, eds. Board of Children, Youth, and Families, Commission on Behavioral and Social Sciences and Education. Washington, D.C.: National Academy Press.
2 Barnett, W.S. 2002. Early childhood education. In A. Molnar (Ed.), School reform proposals: The research evidence (pp.1-26). Greenwich, CT: Information Age Publishing.
3 Bowman, B., Donovan, M, & Burns, M. (Eds.) 2001. Eager to Learn: Educating our preschoolers. Washington, DC: National Academy Press.
4 Love, M., Schochet, P., & Meckstroth, A. 1996. Are they in any real danger: What research does – and doesn’t -- tell us about child care quality and children’s well being. Princeton, NJ: Mathematica Policy Research.
5 Barnett, W.S., & Camilli, G. 2002. Compensatory preschool education, cognitive development and “race.” In J.M. Fish (Ed.), Race and intelligence: Separating science from myth (pp. 369-406). Mahwah, NJ: Erlbaum.
6 National Research Council and Institute of Medicine. 2000. Op Cit. 7 Closing the Achievement Gap. NGA Program for Best Practices. Op. cit. 8 Harms, T., Clifford, R.M., & Cryer, D. 1998. Early childhood environment rating scale - Revised edition
(ECERS-R). New York: Teachers College Press. 9 Arnett, J. (1989). Caregivers in day-care centers: Does training matter? Journal of Applied
Developmental Psychology, 10(4), 541-552. 10 Cost, Quality, and Child Outcomes Study Team 1995. Cost, quality, and child outcomes in child care
centers public report. Denver: Economics Department, University of Colorado-Denver.; NICHD Early Child Care Research Network. 2000. Characteristics and Quality of Child Care for Toddlers and Preschoolers. Applied Developmental Science, 4(3), 116-135.
11 Helburn, SW & Howes, C, 1996. Child care cost and quality. The Future of Children, 6(2), 62-82; Kontos, S, Howes, C, Shinn, M & Galinsky, E, 1995. Quality in family child care and relative care. New York: Teachers College Press.
12 Marshall, NL, Dennehy, J, Starr, E. & Robeson, WW. 2005. Preparing the Early Education and Care Workforce: The Capacity of Massachusetts’ Institutions of Higher Education. Wellesley Centers for Women.
13 For example, Marshall, NL, Creps, CL, Burstein, NR, Glantz, FB, Robeson, WW, Barnett, S, Schimmenti, J & Keefe, N. 2002. Early Care and Education in Massachusetts Public School Preschool Classrooms. Wellesley Centers for Women and Abt Associates Inc.


![Food security and nutrition: building a global narrative ... · EXECUTIVE SUMMARY EXECUTIVE SUMMARY EXECUTIVE SUMMARY EXECUTIVE SUMMAR Y [ 2 ] This document contains the Summary and](https://static.fdocuments.in/doc/165x107/5ff5433612d22125fb06e6b5/food-security-and-nutrition-building-a-global-narrative-executive-summary-executive.jpg)