
bpost reports a strong third quarter/media/Files/B/Bpost/...first half of 2013. This additional tax...
28
Third quarter 2014 Interim Financial Report Press Release – Brussels, 03/11/2014 – 17:45pm (CET) Regulated information www.bpost.be/ir Page 1 of 28 bpost reports a strong third quarter Third quarter 2014 highlights • Operating income (revenues) at EUR 569.2m, stable organically versus last year but negatively impacted by building sales being EUR 7.7m lower than the same quarter last year during which a sizeable property was sold. • Improved underlying Domestic Mail volume decline at -4.3% (-4.9% in the first half) helped in part by one-off mailings by some customers but still impacted by trends already observed in e-substitution and advertising mail sales, resulting in -4.7% year-to-date. Reported decline for the quarter stood at -4.6% (the underlying figure eliminates the impact of one less working day in the quarter). • Domestic parcels volume up 10.3% (+5.2% in the first half) helped by strong performance of e-commerce customers, first signs of recovery in C2C and some one-off actions. International parcels grew solidly by EUR 10.6m, bringing total organic parcels growth to EUR 13m. • Slight organic growth in Additional sources of revenues of EUR 1.4m. • Costs (excluding transport) down EUR 7.2m organically compared to last year. Underlying FTE reduction of 840, in line with expectations. • EBITDA margin stable versus 3Q13 at EUR 104.4m or 18.3%, in line with expectations, impacted by non-operational items such as lower building sales and restructuring charges. • Net profit of bpost S.A./N.V. under BGAAP for the first 9 months at EUR 218.1m. CEO quote Koen Van Gerven, CEO, commented: “I’m pleased with the strong performance of parcels and the solid results bpost recorded in the third quarter. Results were also helped by a softer volume decline in mail volumes but we remain cautious as the underlying trends of e-substitution and weak sales in advertising mail remain unchanged. We therefore continue to prepare ourselves to react if more adverse conditions would happen. Operational results (EBITDA) were also impacted by some non- operational items, which resulted in a marginal increase by 0.6%.” “I’m also happy with the new initiatives launched this quarter: the delivery of groceries at home and the improvements in our parcels offering, in particular the launch of our parcels lockers and improved convenience for senders and receivers of parcels. I’m convinced that these initiatives will strengthen our leadership in the last mile delivery.” Outlook Outlook remains broadly unchanged versus the second quarter of 2014. However, persisting underlying volume trends in Domestic Mail partially helped by a better third quarter, make us return to our initial volume decline outlook of around -5% for the full year.
Transcript of bpost reports a strong third quarter/media/Files/B/Bpost/...first half of 2013. This additional tax...

Third quarter 2014 Interim Financial Report
Press Release – Brussels, 03/11/2014 – 17:45pm (CET) Regulated information
www.bpost.be/ir
Page 1 of 28
bpost reports a strong third quarter Third quarter 2014 highlights
• Operating income (revenues) at EUR 569.2m, stable organically versus last year but negatively impacted by building sales being EUR 7.7m lower than the same quarter last year during which a sizeable property was sold.
• Improved underlying Domestic Mail volume decline at -4.3% (-4.9% in the first half) helped in part by one-off mailings by some customers but still impacted by trends already observed in e-substitution and advertising mail sales, resulting in -4.7% year-to-date. Reported decline for the quarter stood at -4.6% (the underlying figure eliminates the impact of one less working day in the quarter).
• Domestic parcels volume up 10.3% (+5.2% in the first half) helped by strong performance of e-commerce customers, first signs of recovery in C2C and some one-off actions. International parcels grew solidly by EUR 10.6m, bringing total organic parcels growth to EUR 13m.
• Slight organic growth in Additional sources of revenues of EUR 1.4m. • Costs (excluding transport) down EUR 7.2m organically compared to last year.
Underlying FTE reduction of 840, in line with expectations. • EBITDA margin stable versus 3Q13 at EUR 104.4m or 18.3%, in line with
expectations, impacted by non-operational items such as lower building sales and restructuring charges.
• Net profit of bpost S.A./N.V. under BGAAP for the first 9 months at EUR 218.1m.
CEO quote
Koen Van Gerven, CEO, commented: “I’m pleased with the strong performance of parcels and the solid results bpost recorded in the third quarter. Results were also helped by a softer volume decline in mail volumes but we remain cautious as the underlying trends of e-substitution and weak sales in advertising mail remain unchanged. We therefore continue to prepare ourselves to react if more adverse conditions would happen. Operational results (EBITDA) were also impacted by some non-operational items, which resulted in a marginal increase by 0.6%.” “I’m also happy with the new initiatives launched this quarter: the delivery of groceries at home and the improvements in our parcels offering, in particular the launch of our parcels lockers and improved convenience for senders and receivers of parcels. I’m convinced that these initiatives will strengthen our leadership in the last mile delivery.” Outlook
Outlook remains broadly unchanged versus the second quarter of 2014. However, persisting underlying volume trends in Domestic Mail partially helped by a better third quarter, make us return to our initial volume decline outlook of around -5% for the full year.

Third quarter 2014 Interim Financial Report
Press Release – Brussels, 03/11/2014 – 17:45pm (CET) Regulated information
www.bpost.be/ir
Page 2 of 28
Key figures1
3rd quarter (in million EUR)
Reported Normalized
2013 2014 2013 2014 %
change Total operating income (revenues) 566.6 569.2 566.6 569.2 0.5%
Operating expenses 462.7 464.7 462.7 464.7 -0.4%
EBITDA 103.9 104.4 103.9 104.4 0.6%
Margin (%) 18.3% 18.3% 18.3% 18.3%
EBIT 81.5 82.9 81.5 82.9 1.8%
Margin (%) 14.4% 14.6% 14.4% 14.6%
Profit before tax 80.6 79.8 80.6 79.8 -1.0%
Income tax expense 26.9 27.0 26.9 27.0
Net profit 53.8 52.7 53.8 52.7 -1.9%
FCF (2.5) (38.5) (2.5) (38.5) -
bpost S.A./N.V. net profit (BGAAP) 44.9 46.6 44.9 46.6 3.9%
Net Debt/(Net Cash), at 30 September (535.4) (645.9) (535.4) (645.9) 20.6% In the third quarter of 2013 and 2014, there are no differences between reported and normalized figures.
Year-to-date (in million EUR)
Reported Normalized
2013 2014 2013 2014 %
change Total operating income (revenues) 1,802.2 1,809.4 1,787.7 1,809.4 1.2%
Operating expenses 1,372.4 1,368.3 1,372.4 1,368.3 0.3%
EBITDA 429.9 441.0 415.3 441.0 6.2%
Margin (%) 23.9% 24.4% 23.2% 24.4%
EBIT 363.9 377.3 349.3 377.3 8.0%
Margin (%) 20.2% 20.9% 19.5% 20.9%
Profit before tax 371.4 368.8 356.8 368.8 3.4%
Income tax expense 136.1 124.0 136.1 124.0
Net profit 235.2 244.8 220.6 244.8 11.0%
FCF 113.3 324.9 236.5 325.2 37.5%
bpost S.A./N.V. net profit (BGAAP) 175.5 218.1 175.5 218.1 24.3%
Net Debt/(Net Cash), at 30 September (535.4) (645.9) (535.4) (645.9) 20.6% For more information: Investors Press Paul Vanwambeke T. +32 2 276 2822 Piet Van Speybroeck Saskia Dheedene T. +32 2 276 7643 M. +32 477 68 47 12 | T. +32 2 276 2185 www.bpost.be/ir [email protected]
1 Normalized figures are not audited, for further details on reconciliation of normalized and reported key figures, please refer to
section “Reconciliation of Reported to Normalized Financial Metrics” of this document

Third quarter 2014 Interim Financial Report
Press Release – Brussels, 03/11/2014 – 17:45pm (CET) Regulated information
www.bpost.be/ir
Page 3 of 28
Third quarter 2014 - Income Statement
Group revenues increased by EUR 2.6m (+0.5%), to EUR 569.2m in the third quarter, of which EUR 2.5m related to scope changes (100% acquisition of Gout, BEurope, Ecom and Starbase by Landmark Global Inc.). Excluding last year’s proceeds from sales of buildings, which were EUR 7.7m above this year’s level, revenues grew by EUR 7.8m organically driven by the solid performance of parcels (EUR +13.0m), partially offset by the decrease of domestic mail (EUR -6.5m). Reported EBITDA and EBIT margin were in line with last year. Excluding scope change and the lower proceeds from sales of buildings, EBITDA and EBIT grew respectively by EUR 8.1m and EUR 8.9m.
Net financial expenses increased by EUR 2.9m to EUR -5.7m, mainly explained by the increase of IAS 19 related non cash financial cost generated by the decrease in discount rates. Income Tax expense as well as the effective tax rate are in line with last year. IFRS group net profit stood at EUR 52.7m. Belgian GAAP net profit of the parent company amounted to EUR 46.6m for the quarter (+3.9%).
+1.4
+13.0+2.5 +104.4
EBITDA 3Q14
Costs
+0.3
Corporate
-7.9
Additional sources of revenues
ParcelsDomestic Mail
-6.5
Scope
-2.3
EBITDA 3Q13
+103.9
EUR +0.4m / +0.4%EUR +0.2m
Total operating income (revenues)

Third quarter 2014 Interim Financial Report
Press Release – Brussels, 03/11/2014 – 17:45pm (CET) Regulated information
www.bpost.be/ir
Page 4 of 28
First nine months 2014 - Income Statement
For the first nine months, group revenues increased by EUR 21.7m (+1.2%) on a normalized basis to EUR 1,809.4m, of which EUR 14.6m is organic growth. This was mainly driven by Parcels (EUR +37.9m organically), Additional sources of revenues (EUR +7.3m) and price increases in Domestic Mail (EUR +19.9m), which together more than compensated the volume losses in Domestic Mail (EUR -46.8m, excluding EUR 4.6m contribution related to 2014 elections) and lower gains on disposal of buildings (EUR -6.1m). Costs decreased organically by EUR 10.7m, leading to a higher EBITDA margin of 24.4% to reach EUR 441.0m (EUR +25.7m versus last year) on a normalized basis. EBIT came in at EUR 377.3m (EUR +28.0m versus last year), with depreciation charges amounting to EUR 63.7m. Net financial expenses increased by EUR 10.8m to EUR -17.4m. This evolution is mainly explained by higher non-cash financial charges (up EUR 13.6m) related to employee benefits IAS 19 generated by the decrease in discount rates. Income Tax expense decreased by EUR 12.1m compared to last year. This decrease was mainly explained by the fact that an additional income tax charge of EUR 17.6m had been incurred in the first half of 2013. This additional tax charge was the result of the transfer of EUR 21.3m from tax free reserves to distributable results and the payout of untaxed reserves of EUR 30.3m. IFRS group net profit stood at EUR 244.8m. Belgian GAAP net profit of the parent company amounted to EUR 218.1m year to date.
+10.7+7.3
+37.9+7.1
+441.0
EBITDA 3Q YTD 14
CostsCorporate
-7.3
Additional sources of revenues
ParcelsDomestic Mail
-23.2
Scope
-6.6
EBITDA 3Q YTD 13
+415.3
EUR +27.8m / +7.8%EUR +0.5m
Total operating income (revenues)

Third quarter 2014 Interim Financial Report
Press Release – Brussels, 03/11/2014 – 17:45pm (CET) Regulated information
www.bpost.be/ir
Page 5 of 28
Total operating income: group overview
Third quarter 2014
3rd quarter Reported Organic2 underlying volume
In million EUR 2013 2014 Change
% 2013 2014 Change
% Change % Domestic mail 348.4 341.9 -1.9% 348.4 341.9 -1.9% -4.3%
Transactional mail 212.5 209.3 -1.5% 212.5 209.3 -1.5% -4.7%
Advertising mail 60.5 58.3 -3.6% 60.5 58.3 -3.6% -3.7%
Press 75.4 74.3 -1.5% 75.4 74.3 -1.5% -2.5%
Parcels 58.0 72.9 25.7% 58.0 70.9 22.3% 29.7%
Domestic Parcels 31.9 35.2 10.3% 31.9 35.2 10.3% 10.3%
International Parcels 22.2 34.8 56.8% 22.2 32.8 47.9% Special Logistics 3.9 2.9 -25.6% 3.9 2.9 -25.6% Additional sources of revenues 146.3 148.4 1.4% 146.3 147.8 1.0%
International mail 45.5 48.5 6.6% 45.5 48.5 6.6% Value-added services 23.5 22.9 -2.6% 23.5 24.1 2.5% Banking and financial products 51.8 50.6 -2.3% 51.8 50.6 -2.3% Others 25.5 26.4 3.5% 25.5 24.6 -3.5% Corporate operating income 13.8 6.0 -56.5% 13.8 6.0 -56.5%
Total operating income 566.6 569.2 0.5% 566.6 566.6 0.0%
Revenues from Domestic Mail decreased by EUR 6.5m (-1.9%) to EUR 341.9m. Excluding the impact of one less working day in the quarter, underlying volume decline came in at -4.3%. Transactional mail, with underlying volume decline at -4.7%, continued to suffer from e-substitution by the same large senders of last quarter and a general trend towards reducing postal spend; however we have not witnessed additional customers implementing new aggressive measures. At the same time some one-off elements (e.g. rebranding campaigns by customers) had a positive impact. Advertising mail remained weak this quarter, with the underlying volume evolution amounting to -3.7%. Press volume declines showed an improvement at -2.5%. Total mail volume declines impacted revenues by EUR -12.9m, partially compensated by the net improvement in price and mix, amounting to EUR 7.3m. Parcels performed strongly, with organic growth at EUR 13.0m. International parcels grew by EUR +10.6m organically. Traffic on lanes from the US (EUR +5.7m) and China (EUR +2.2m) continued to develop well, while lanes towards China (EUR +1.4m) still recorded a modest growth. Volume growth in Domestic Parcels came in at 10.3%, an excellent performance against the first half of the year (+5.2%). Excellent growth in e-tailing activities, first signs of recovery in C2C and a one-off action of one customer (worth 60 basis points of volume growth) together explain this evolution. Total operating income from Additional sources of revenues increased by EUR 1.4m organically to reach EUR 148.4m. This is mainly driven by good performance in International Mail (EUR +3.0m) and Value Added Service (EUR +0.6m), partially offset by a decrease in Banking and Financial
2 Organic figures are not audited, and contain impact normalization (see section ”Reconciliation of Reported to Normalized
Financial Metrics”), transfer between VAS and Other in 2013 and exclude impact scope changes

Third quarter 2014 Interim Financial Report
Press Release – Brussels, 03/11/2014 – 17:45pm (CET) Regulated information
www.bpost.be/ir
Page 6 of 28
products revenues (EUR -1.3m) resulting from phasing and lower volumes of financial transactions managed on behalf of the Belgian State. Revenues from Corporate decreased by EUR 7.9m to EUR 6.0m, mainly due to lower gains on the disposal of buildings (EUR -7.7m). Last year, gains on the sale of buildings were positively impacted by one sizeable transaction (EUR 11.4m). First nine months 2014
Year-to-date Reported Organic underlying volume
In million EUR 2013 2014 Change
% 2013 2014 Change % Change % Domestic mail 1,137.0 1,113.8 -2.0% 1,137.0 1,113.8 -2.0% -4.7%
Transactional mail 701.7 684.1 -2.5% 701.7 684.1 -2.5% -5.3%
Advertising mail 202.0 199.9 -1.0% 202.0 199.9 -1.0% -3.3%
Press 233.4 229.9 -1.5% 233.4 229.9 -1.5% -2.9%
Parcels 173.6 217.1 25.1% 173.6 211.5 21.8% 28.1%
Domestic Parcels 102.9 110.4 7.3% 102.9 110.4 7.3% 6.8%
International Parcels 58.5 97.0 65.8% 58.5 91.4 56.2% Special Logistics 12.2 9.7 -20.5% 12.2 9.7 -20.5% Additional sources of revenues 460.3 454.4 -1.3% 445.7 453.0 1.6%
International mail 144.1 148.4 3.0% 144.1 148.4 3.0% Value-added services 66.5 71.6 7.7% 66.5 71.6 7.7% Banking and financial products 156.4 154.9 -1.0% 156.4 154.9 -1.0% Others 93.3 79.5 -14.8% 78.7 78.1 -0.8% Corporate operating income 31.3 24.0 -23.3% 31.3 24.0 -23.3%
Total operating income 1,802.2 1,809.4 0.4% 1,787.7 1,802.3 0.8%
Domestic Mail revenues amounted to EUR 1,113.8m, a EUR 23.2m decline versus last year, due to an underlying volume evolution of -4.7%, partly compensated by price increases and elections revenues in the second quarter. Parcels revenues attained EUR 217.1m (EUR +43.5m, of which EUR +37.9m organic growth), driven by volume growth of +6.8% in domestic parcels and by strong development in international parcels. Additional sources of revenues amounted to EUR 454.4m, down EUR -5.9m. Excluding the gain on the sale of Certipost activities, revenues were up EUR 8.7m of which EUR 7.3m was organic growth.

Third quarter 2014 Interim Financial Report
Press Release – Brussels, 03/11/2014 – 17:45pm (CET) Regulated information
www.bpost.be/ir
Page 7 of 28
Operating expenses
Third quarter 2014
3rd quarter Reported Organic3
In million EUR
2013 2014 Change % 2013 2014 Change % Payroll & interim costs 311.3 312.5 0.4% 311.3 312.0 0.2%
FTE 27,090 26,060 -1,030 27,090 25,998 -1,092
SG&A (excl. interim and transport costs) 93.6 90.8 -3.0% 93.6 90.4 -3.4%
Transport costs 43.7 51.7 18.3% 43.7 50.5 15.7%
Other costs 14.2 9.7 -31.6% 14.2 9.5 -33.6%
Total operating expenses 462.7 464.7 0.4% 462.7 462.4 -0.1%
Total operating costs stood at EUR 464.7m, a slight organic decrease of EUR -0.3m. Transport costs increased by EUR 6.9m, linked to the strong growth of our international activities. Excluding transport costs, operating expenses remained well under control and decreased by EUR 7.2m on an organic basis. Payroll and interim costs were impacted by the opposite effects of, on the one hand, the decrease of the average number of FTE by 1,092 versus the same quarter of last year (EUR -13.3m) and on the other hand the salary increases and impact of the collective labour agreement (together EUR +3.3m), one-off restructuring charges (EUR +3.1m), evolution of employee benefits (EUR +1.8m), a slightly negative mix effect (EUR +0.2m) resulting from lesser use of students and higher use of interims and finally higher provisions for delay in holiday taking (EUR +2.9m). The latter indicates that the FTE reduction figure reported is slightly inflated compared to the underlying trends, as fewer holidays were taken to date compared to last year. Excluding the temporary positive effect on FTE reduction resulting from the delay in the holiday take-up, the underlying FTE reduction is estimated at 840 FTE for the quarter, in line with management guidance. SG&A excluding transport costs decreased by EUR 3.2m organically, resulting from lower rent and rental costs (EUR -1.5m) due to the extension of fleet contracts leading to lower monthly cost, lower energy bills (EUR -0.7m) thanks to the positive price evolution of fuel costs and lower publicity and advertising costs (EUR -0.7m). The decrease of the other costs (EUR -4.8m organically) is mainly the result of last year’s estimate for 9 months of local and real estate taxes as new legislation became applicable to bpost (taken in full in the third quarter of 2013 but spread over the year for 2014), the favourable settlement of provisions and a decrease in material costs.
3 Organic figures are not audited, and contain impact normalization (see section ”Reconciliation of Reported to Normalized
Financial Metrics”) and exclude impact scope changes

Third quarter 2014 Interim Financial Report
Press Release – Brussels, 03/11/2014 – 17:45pm (CET) Regulated information
www.bpost.be/ir
Page 8 of 28
First nine months 2014
Year-to-date Reported Organic
In million EUR 2013 2014 Change
% 2013 2014 Change
% Payroll & interim costs 933.5 922.8 -1.1% 933.5 921.5 -1.3%
FTE 26,510 25,488 -1,022 26,510 25,433 -1,077
SG&A (excl. interim and transport costs) 286.1 269.2 -5.9% 286.1 267.9 -6.4%
Transport costs 127.1 150.7 18.5% 127.1 147.5 16.0%
Other costs 25.6 25.6 0.0% 25.6 24.9 -3.0%
Total operating expenses 1,372.4 1,368.3 -0.3% 1,372.4 1,361.7 -0.8%
For the first nine months of 2014, total operating costs amounted to EUR 1,368.3m, an organic saving of EUR 10.7m compared to last year. Excluding transport costs, total expenses went down organically by EUR 31.0m, mainly as a result of lower payroll and interim costs (EUR -12.0m) and lower SG&A and other costs (EUR -19.0m).
Cash flow statement
Third quarter 2014 Normalized free cash flow for the third quarter (EUR -38.5m) was EUR 36.0m lower than last year, due to lower cash flow from both operating and investing activities. Normalized cash flow from operating activities for the third quarter was EUR 10.1m lower compared to the same period last year. The improved result of operating activities (EUR 14.2m) was more than offset by a deterioration in working capital (EUR 24.2m) mainly due to the announced reversal of the positive phasing effect recorded in the first quarter of 2014 relating to terminal dues. Investing activities generated a cash outflow of EUR 21.7m for the third quarter compared to an inflow of EUR 4.1m for the same period last year. This variance is mainly due to higher capital expenditure (EUR 13.7m) on extensions of the sorting centres and the installation of new sorting machines for mixed/large format mail (as part of the Vision 2020 program). We also recorded lower proceeds from sale of property, plant and equipment for an amount of EUR 14.5m. First nine months 2014 Normalized free cash flow was EUR 88.7m better than last year due to a better cash flow from operating activities partly offset by a higher cash outflow for investing activities. Normalized cash flow from operating activities4
of EUR 379.9m was EUR 96.6m higher than last year thanks to improved results from operating activities (EUR +44.5m) and EUR 52.2m additional cash generated from working capital.
Investing activities generated a cash outflow of EUR 54.8m compared to an outflow of EUR 46.8m for the same period last year, mainly resulting from higher capital expenditure as explained above (EUR 15.0m) and lower proceeds from sale of property, plant and equipment (EUR 12.8m). These effects were partially offset by lower cash outflows related to the subsidiaries (EUR 19.9m), as last year bpost participated in the capital increase of bpost bank (EUR 37.5m) and purchased the remaining 20% shares of MSI (EUR 6.8m), but received cash from the disposal of certain activities of Certipost (EUR 15.1m). This year, bpost acquired new subsidiaries for a total amount of EUR 9.1m.
4 Excluding evolution of deposits received from third parties of EUR 0.2m and the exceptional repayment in 2013 of alleged SGEI
overcompensation (EUR 123.1m).

Third quarter 2014 Interim Financial Report
Press Release – Brussels, 03/11/2014 – 17:45pm (CET) Regulated information
www.bpost.be/ir
Page 9 of 28
The cash outflow from financing activities amounted to EUR 41.6m of which EUR 40.0m is related to the top-up dividend relating to the 2013 results paid in 2014. Net cash stood at EUR 645.9m at 30th September 2014.
Key events during the third quarter
On 29th September, bpost introduced a non-binding indicative offer to purchase 51% shares in the Romanian Post. Part of bpost’s strategy is to look at opportunities which add revenues and/or strength to our existing business in Belgium. In addition, on a very selective basis, we explore other opportunities if they provide a strong return on investment, where bpost is able to bring particular benefits to the situation, such as leveraging its know-how in modernizing postal operations, while not risking the dividend payments for our shareholders. The Romanian government has launched a privatisation process for Posta Romana. bpost is at a very early stage of assessing whether or not this provides one such opportunity and in order to start in-depth due diligence on the company, such non-binding proposal was required. It is much too early to say if this will lead to any binding offer, and in this particular case any investment, if made, would be quite limited in terms of financial and managerial resources committed. New products and services launched bpost strives to offer its customers the best options to receive their parcels. Starting November, bpost will deliver parcels on Saturdays in order to strengthen its offering. The delivery to parcels lockers was also launched on a commercial basis. There are already more than a hundred lockers across Belgium where addressees can pick up their parcel when it suits them, 24/7/365. They have been set up at busy locations like train stations, department store car parks and large post offices. Lastly, bpost also commercially launched online parcel preparation (labelling, payment) and direct drop-off and pick-up in one of our 1,250 parcel points, leading to improved convenience for users. Late September, home delivery by bpost of groceries ordered online has been rolled out to all inhabitants of Brussels and Walloon Brabant. On the bpost platform “www.combo.be” shoppers can place their orders with participating stores, choose a delivery slot and combine orders placed at different retailers into one delivery. The service has been extended to parts of Flemish Brabant at the end of October. Appointment of 2 non-executive independent Directors to the Board The special general meeting of shareholders, which was held on 22 September 2014, has appointed Ray Stewart and Michael Stone as independent directors of the company with immediate effect. Ray Stewart and Michael Stone replace Bjarne Wind and K.B. Pedersen, both of whom tendered their resignation following the sale by CVC of the majority of its participation in the company’s share capital. The Board of Directors has restructured the executive management of the company. As of 1 September 2014, the Management Committee and the Group Executive Management are both composed of Koen Van Gerven (CEO & Parcels), Pierre Winand (CFO), Marc Huybrechts (MRS director), Mark Michiels (HR) and Kurt Pierloot (MSO & International director). Tariff increases on domestic mail for 2015 Half October, bpost announced the tariff increases on mail products applicable as of January 2015. In compliance with the regulatory framework, the average price rise for all domestic mail products will be approximately 1.5%.

Third quarter 2014 Interim Financial Report
Press Release – Brussels, 03/11/2014 – 17:45pm (CET) Regulated information
www.bpost.be/ir
Page 10 of 28
New organization of international parcels and mail activities bpost has integrated its different international activities into one combined structure to leverage on the synergies and expertise of those entities in order to serve the package distribution needs of the global e-commerce marketplace. The new organisation will operate under the brand name “Landmark Global, a bpost company” and will be led by Dave Mays, the current CEO and founder of Landmark Global, Inc. He will report to a global board comprising Kurt Pierloot, Dave Mays and Pierre Winand. Kurt Pierloot will be the representative of Landmark Global on the bpost Group Executive Committee.
Financial calendar
04.12.14 (17:45 CET) Financial results 10 first months of 2014 08.12.14 Ex-dividend date (interim dividend) 09.12.14 Record date (interim dividend) 10.12.14 Payment date of the interim dividend 16.03.15 (17:45 CET) Announcement annual results FY2014 17.03.15 (10:00 CET) Analyst Conference Call 06.05.15 (17:45 CET) Announcement 1Q15 results 07.05.15 (10:00 CET) Analyst Conference Call 13.05.15 Ordinary General Meeting of Shareholders 18.05.15 Ex-dividend date 19.05.15 Record date 20.05.15 Payment date of the dividend 06.08.15 (17:45 CET) Announcement 2Q15 and half-year results 07.08.15 (10:00 CET) Analyst Conference Call 05.11.15 (17:45 CET) Announcement 3Q15 results 06.11.15 (10:00 CET) Analyst Conference Call 03.12.15 (17:45 CET) Financial results first 10 months of 2015 08.12.15 Ex-dividend date (interim dividend) 09.12.15 Record date (interim dividend) 10.12.15 Payment date of the interim dividend
Third quarter 2014 Interim Financial Report
Press Release – Brussels, 03/11/2014 – 17:45 (CET) Regulated information
www.bpost.be/ir
Page 11 of 28
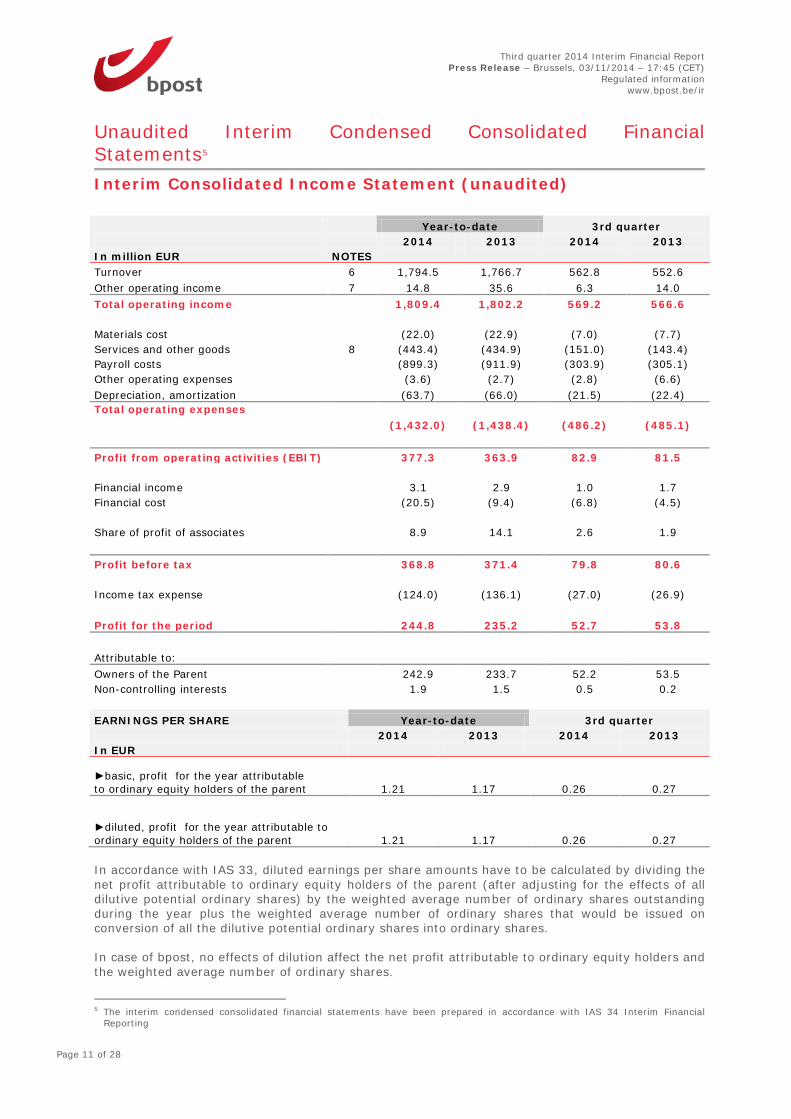
Unaudited Interim Condensed Consolidated Financial Statements5 Interim Consolidated Income Statement (unaudited) Year-to-date 3rd quarter 2014 2013 2014 2013 In million EUR NOTES Turnover 6 1,794.5 1,766.7 562.8 552.6 Other operating income 7 14.8 35.6 6.3 14.0 Total operating income
1,809.4 1,802.2 569.2 566.6
Materials cost
(22.0) (22.9) (7.0) (7.7) Services and other goods 8 (443.4) (434.9) (151.0) (143.4) Payroll costs
(899.3) (911.9) (303.9) (305.1)
Other operating expenses
(3.6) (2.7) (2.8) (6.6) Depreciation, amortization
(63.7) (66.0) (21.5) (22.4)
Total operating expenses
(1,432.0) (1,438.4) (486.2) (485.1)
Profit from operating activities (EBIT) 377.3 363.9 82.9 81.5
Financial income
3.1 2.9 1.0 1.7 Financial cost
(20.5) (9.4) (6.8) (4.5)
Share of profit of associates
8.9 14.1 2.6 1.9
Profit before tax 368.8 371.4 79.8 80.6
Income tax expense
(124.0) (136.1) (27.0) (26.9)
Profit for the period 244.8 235.2 52.7 53.8
Attributable to:
Owners of the Parent
242.9 233.7 52.2 53.5
Non-controlling interests
1.9 1.5 0.5 0.2 EARNINGS PER SHARE Year-to-date 3rd quarter 2014 2013 2014 2013 In EUR
►basic, profit for the year attributable to ordinary equity holders of the parent 1.21 1.17 0.26 0.27
►diluted, profit for the year attributable to ordinary equity holders of the parent 1.21 1.17 0.26 0.27 In accordance with IAS 33, diluted earnings per share amounts have to be calculated by dividing the net profit attributable to ordinary equity holders of the parent (after adjusting for the effects of all dilutive potential ordinary shares) by the weighted average number of ordinary shares outstanding during the year plus the weighted average number of ordinary shares that would be issued on conversion of all the dilutive potential ordinary shares into ordinary shares. In case of bpost, no effects of dilution affect the net profit attributable to ordinary equity holders and the weighted average number of ordinary shares.
5 The interim condensed consolidated financial statements have been prepared in accordance with IAS 34 Interim Financial
Reporting

Third quarter 2014 Interim Financial Report
Press Release – Brussels, 03/11/2014 – 17:45pm (CET) Regulated information
www.bpost.be/ir
Page 12 of 28
Interim Consolidated Statement of Comprehensive Income (unaudited)
Per September Per September 2014 2013 In million EUR Profit for period 244.8 235.2
Fair value for financial assets available for sale by associates 66.7 (64.7) (Loss)gain on available for sale financial assets 101.2 (98.0) Income tax effect (34.5) 33.3
Fair value of actuarial results on defined benefit plans (0.2) 7.4 Actuarial (losses)/gains on defined benefit plans (2.3) 10.1 Income tax effect 2.1 (2.7)
Non-controlling interests 0.0 0.0
Other comprehensive income for the year, net of tax (*) 66.4 (57.3)
Total comprehensive income for the year, net of tax 311.3 178.0
Attributable to:
Owners of the Parent 309.3 176.5 Non-controlling interest 1.9 1.5
* Net other comprehensive income is not being reclassified to profit or loss in subsequent periods.
Impact of the currency translation adjustment is immaterial.

Third quarter 2014 Interim Financial Report
Press Release – Brussels, 03/11/2014 – 17:45pm (CET) Regulated information
www.bpost.be/ir
Page 13 of 28
Interim Consolidated Statement of Financial Position (unaudited)
NOTES As of
30 September As of
31 December 2014 2013 In million EUR Assets
Non-current assets Property, plant and equipment 9 562.6 570.3 Intangible assets 10 92.8 89.0 Investments in associates 11 416.9 341.3 Investment properties
9.1 10.3
Deferred tax assets
52.8 58.3 Trade and other receivables
2.4 2.2
1,136.7 1,071.3
Current assets
Assets held for sale
0.6 0.1
Inventories
11.5 9.2 Income tax receivable
1.0 0.1
Trade and other receivables 12 312.6 400.2 Cash and cash equivalents 13 731.6 448.2
1,057.3 857.8
Total assets
2,194.0 1,929.2
Equity and liabilities
Equity attributable to equity holders of the Parent
Issued capital
364.0 364.0 Treasury shares
0.0 0.0
Reserves
240.2 111.0 Retained earnings
244.8 101.9
849.0 576.9
Non-controlling interests
(0.0) (0.0)
Total equity 14 849.0 576.9
Non-current liabilities
Interest-bearing loans and borrowings
75.4 75.6
Employee benefits 15 343.6 345.1 Trade and other payables
75.9 79.7
Provisions
35.6 40.2 Deferred tax liabilities
1.4 1.4
531.9 542.0
Current liabilities
Interest-bearing loans and borrowings
9.8 11.3
Bank overdrafts
0.3 0.2 Provisions
19.7 22.4
Income tax payable 16 99.7 41.7 Trade and other payables 17 683.7 734.7
813.2 810.3
Total liabilities
1,345.0 1,352.3
Total Equity and liabilities 2,194.0 1,929.2
Third quarter 2014 Interim Financial Report
Press Release – Brussels, 03/11/2014 – 17:45pm (CET) Regulated information
www.bpost.be/ir
Page 14 of 28
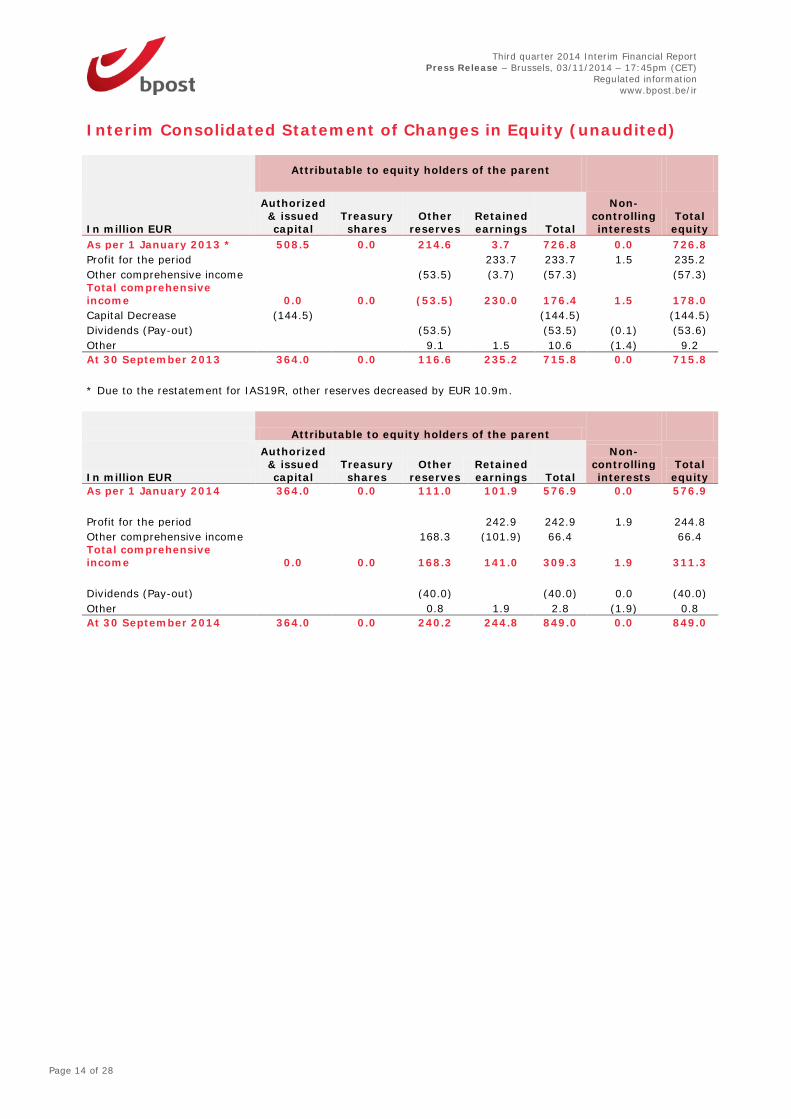
Interim Consolidated Statement of Changes in Equity (unaudited)
Attributable to equity holders of the parent
In million EUR
Authorized & issued capital
Treasury shares
Other reserves
Retained earnings Total
Non-controlling interests
Total equity
As per 1 January 2013 * 508.5 0.0 214.6 3.7 726.8 0.0 726.8 Profit for the period
233.7 233.7 1.5 235.2
Other comprehensive income
(53.5) (3.7) (57.3)
(57.3) Total comprehensive income 0.0 0.0 (53.5) 230.0 176.4 1.5 178.0 Capital Decrease (144.5)
(144.5)
(144.5)
Dividends (Pay-out)
(53.5)
(53.5) (0.1) (53.6) Other 9.1 1.5 10.6 (1.4) 9.2 At 30 September 2013 364.0 0.0 116.6 235.2 715.8 0.0 715.8
* Due to the restatement for IAS19R, other reserves decreased by EUR 10.9m.
Attributable to equity holders of the parent
In million EUR
Authorized & issued capital
Treasury shares
Other reserves
Retained earnings Total
Non-controlling interests
Total equity
As per 1 January 2014 364.0 0.0 111.0 101.9 576.9 0.0 576.9
Profit for the period
242.9 242.9 1.9 244.8 Other comprehensive income
168.3 (101.9) 66.4
66.4
Total comprehensive income 0.0 0.0 168.3 141.0 309.3 1.9 311.3
Dividends (Pay-out)
(40.0)
(40.0) 0.0 (40.0) Other
0.8 1.9 2.8 (1.9) 0.8
At 30 September 2014 364.0 0.0 240.2 244.8 849.0 0.0 849.0

Third quarter 2014 Interim Financial Report
Press Release – Brussels, 03/11/2014 – 17:45pm (CET) Regulated information
www.bpost.be/ir
Page 15 of 28
Interim Consolidated Statement of Cash Flows (unaudited)
Year-to-date 3rd quarter
In million EUR NOTES 2014 2013 2014 2013
Operating activities
Profit before tax
368.8 371.4 79.8 80.6
Depreciation and amortization 63.7 66.0 21.5 22.4
Impairment on bad debts 1.8 0.2 0.7 0.4
Gain on sale of property, plant and equipment (9.4) (15.4) (4.7) (12.4)
Gain on sale of Certipost activities 0.0 (14.6) 0.0 0.0
Change in employee benefit obligations (3.8) (27.8) (2.0) (9.3)
Share of profit of associates (8.9) (14.1) (2.6) (1.9)
Income tax paid (64.8) (62.0) (61.2) (60.9) Cash flow from operating activities before changes in working capital and provisions 347.4 303.7 31.6 18.9
Decrease/(increase) in trade and other receivables
62.9 70.7 (26.1) 2.3
Decrease/(increase) in inventories (1.9) (1.1) (1.6) (0.7)
Increase/(decrease) in trade and other payables (21.1) (81.9) (18.1) (23.1)
Deposits received from third parties (0.2) (0.0) 0.0 0.0
Repayment of SGEI overcompensation 0.0 (123.1) 0.0 0.0
Increase/(decrease) in other provisions
(7.4) (8.2) (2.6) (4.0)
Net Cash from operating activities 379.7 160.1 (16.7) (6.7)
Investing activities
Proceeds from sale of property, plant and equipment 11.3 24.2 5.6 20.1
Disposal of subsidiaries, net of cash disposed of 0.0 15.1 0.0 0.0
Acquisition of property, plant and equipment (48.8) (31.4) (24.3) (9.4)
Acquisition of intangible assets (8.2) (10.6) (2.6) (3.7)
Acquisition of subsidiaries, net of cash acquired 5 (9.1) (6.6) (0.4) (2.8)
Capital increase bpost bank 0.0 (37.5) 0.0 0.0
Net cash used in investing activities (54.8) (46.8) (21.7) 4.1
Financing activities
Payments related to borrowings and financing lease liabilities (1.6) 2.8 (0.5) (0.1)
Capital decrease 0.0 (144.5) 0.0 0.0
Dividends paid (40.0) 0.0 0.0 0.0
Exceptional dividend 0.0 (53.5) 0.0 0.0
Dividends paid to minority interests
0.0 (0.1) 0.0 0.0
Net Cash from financing activities (41.6) (195.3) (0.5) (0.1)
Net increase in cash and cash equivalents 283.3 (82.0) (38.9) (2.6)
Cash and cash equivalent less bank overdraft as of 1st January 448.0 712.8 Cash and cash equivalent less bank overdraft as of 30th September 731.3 630.9
Movements between 1st January and 30th September 283.3 (82.0)

Third quarter 2014 Interim Financial Report
Press Release – Brussels, 03/11/2014 – 17:45pm (CET) Regulated information
www.bpost.be/ir
Page 16 of 28
Notes to the Interim Condensed Consolidated Financial Statements (unaudited) 1. Corporate Information The interim condensed consolidated financial statements of bpost for the first nine months ended September 30, 2014 were authorized for issue in accordance with a resolution of the Board of Directors on November 3, 2014. Business activities bpost and its subsidiaries (hereinafter referred to as “bpost”) provide national and international mail and parcels services comprising the collection, transport, sorting and distribution of addressed and non-addressed mail, printed documents, newspapers and parcels. bpost, through its subsidiaries and business units, also sells a range of other products and services, including postal, banking and financial products, express delivery services, document management and related activities. bpost also carries out Services of General Economic Interest (SGEI) on behalf of the Belgian State. Legal status bpost is a limited-liability company under public law of Belgium. bpost has its registered office at the Muntcentrum-Centre Monnaie, 1000 Brussels. 2. Basis of preparation and accounting policies Basis of preparation These interim financial statements have not been subject to review by the independent auditor. The interim condensed consolidated financial statements for the nine months ended September 30, 2014 have been prepared in accordance with IAS 34 Interim Financial Reporting. The interim condensed consolidated financial statements do not include all the information and disclosures required in the annual financial statements, and should be read in conjunction with bpost’s annual financial statements as at December 31, 2013. Significant accounting policies The accounting policies adopted in the preparation of the interim condensed consolidated financial statements are consistent with those followed in the preparation of bpost’s annual financial statements for the year ended December 31, 2013, except for the adoption of new standards and interpretations effective as from January 1, 2014. The following new standards and amendments, entered into force as from January 1, 2014, don’t have any effect on the presentation, the financial performance or position of bpost:
IFRS 10 – Consolidated Financial statements IFRS 11 – Joint Arrangements IFRS 12 – Disclosure of Interests in Other Entities IFRS 10 –11 & 12 - Transition Guidance IFRS 10, IFRS 12 and IAS 27 – Amendments - Investment Entities IAS 27 – Amendment to IAS 27 – Separate Financial Statements IAS 28 – Amendment to IAS 28 – Investments in Associates and Joint Ventures IAS 32 – Financial Instruments: Presentation – Offsetting of financial assets and financial
liabilities

Third quarter 2014 Interim Financial Report
Press Release – Brussels, 03/11/2014 – 17:45pm (CET) Regulated information
www.bpost.be/ir
Page 17 of 28
IAS 39 – Financial Instruments: Recognition and Measurement – Novation of Derivatives and Continuation of Hedge Accounting
IAS 36 – Amendment to IAS 36 – Recoverable Amount Disclosures for Non-Financial Assets
Standards and Interpretations not yet applied by bpost The following new IFRS Standards and IFRIC Interpretations, which are yet to become mandatory, have not been applied by bpost for the preparation of its interim condensed consolidated financial statements.
Standard or interpretation
Effective for in reporting periods
starting on or after
IFRS 9 – Financial Instruments – (issued on July 2014)(*) 1 January 2018
IFRS 14 – Regulatory Deferral Accounts (*) 1 January 2016
IFRS 15 – Revenue from Contracts with customers (*) 1 January 2017
IAS 19 – Amendment - Employee Benefits – Defined benefit plans: Employee Contributions (*) 1 July 2014
IAS 16 - IAS 38 – Amendments – Clarification of acceptable methods of depreciation and amortisation (*) 1 January 2016
IAS 16 - IAS 41 –Amendments -Agriculture: Bearer plants (*) 1 January 2016
IFRS 11- Amendment – Accounting for acquisitions of interests in Joint Operations (*) 1 January 2016
IFRS 10 – IAS 28 – Amendments –Sale or contribution of assets between an investor and its Associate or Joint Venture (*) 1 January 2016
IAS 27 – Amendments – Equity method in Separate Financial Statements (*) 1 January 2016
Annual improvements to IFRSs 2010-2012 Cycle (*) 1 July 2014
Annual improvements to IFRSs 2011-2013 Cycle (*) 1 July 2014
Annual improvements to IFRSs 2012-2014 Cycle (*) 1 January 2016 (*) Not yet endorsed by the EU as per date of this report bpost has not early adopted any other standard, interpretation, or amendment that was issued but is not yet effective. IFRIC 21 has been endorsed by the EU in June 2014 and will be effective for the reporting periods starting on January 1, 2015 with voluntary retrospective application as at January 1, 2014. Implementation of IFRIC 21 will have mainly an impact on the seasonality of the results of bpost bank. bpost has decided to not reflect IFRIC 21 in the interim condensed consolidated financial statements ended at September 30, 2014.
Third quarter 2014 Interim Financial Report
Press Release – Brussels, 03/11/2014 – 17:45pm (CET) Regulated information
www.bpost.be/ir
Page 18 of 28
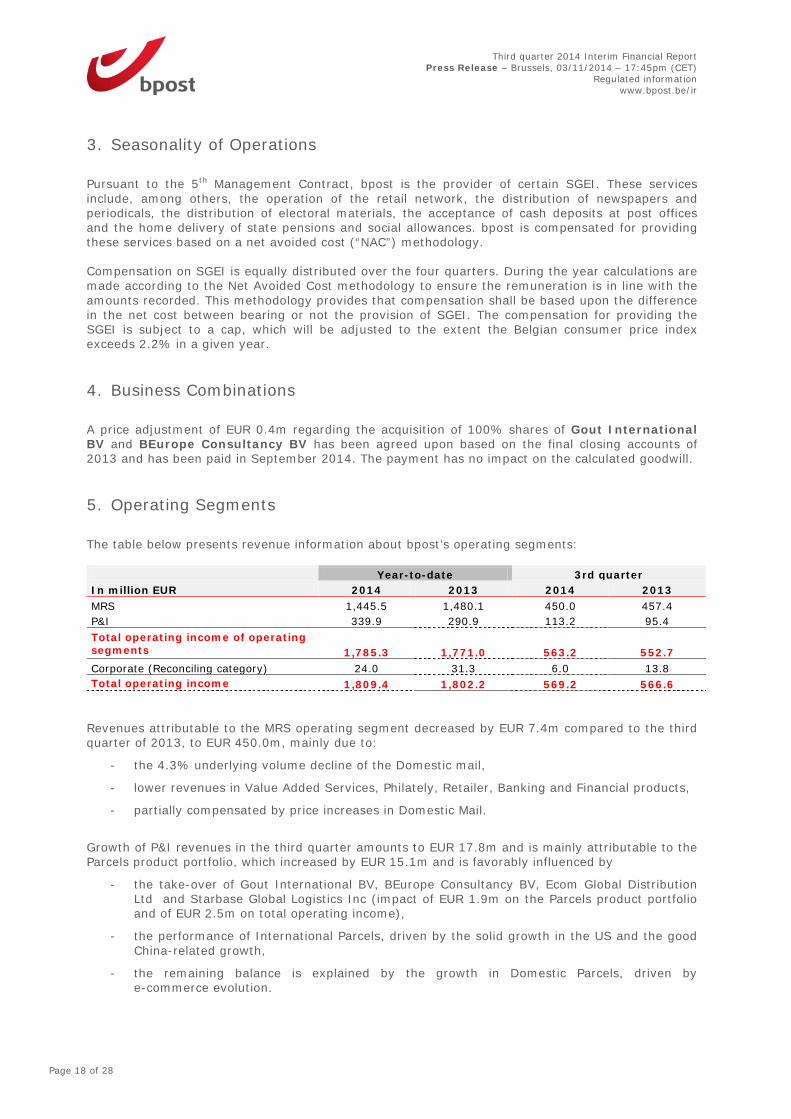
3. Seasonality of Operations Pursuant to the 5th Management Contract, bpost is the provider of certain SGEI. These services include, among others, the operation of the retail network, the distribution of newspapers and periodicals, the distribution of electoral materials, the acceptance of cash deposits at post offices and the home delivery of state pensions and social allowances. bpost is compensated for providing these services based on a net avoided cost (“NAC”) methodology. Compensation on SGEI is equally distributed over the four quarters. During the year calculations are made according to the Net Avoided Cost methodology to ensure the remuneration is in line with the amounts recorded. This methodology provides that compensation shall be based upon the difference in the net cost between bearing or not the provision of SGEI. The compensation for providing the SGEI is subject to a cap, which will be adjusted to the extent the Belgian consumer price index exceeds 2.2% in a given year. 4. Business Combinations A price adjustment of EUR 0.4m regarding the acquisition of 100% shares of Gout International BV and BEurope Consultancy BV has been agreed upon based on the final closing accounts of 2013 and has been paid in September 2014. The payment has no impact on the calculated goodwill. 5. Operating Segments The table below presents revenue information about bpost’s operating segments: Year-to-date 3rd quarter In million EUR 2014 2013 2014 2013 MRS 1,445.5 1,480.1 450.0 457.4 P&I 339.9 290.9 113.2 95.4 Total operating income of operating segments 1,785.3 1,771.0 563.2 552.7 Corporate (Reconciling category) 24.0 31.3 6.0 13.8 Total operating income 1,809.4 1,802.2 569.2 566.6
Revenues attributable to the MRS operating segment decreased by EUR 7.4m compared to the third quarter of 2013, to EUR 450.0m, mainly due to:
- the 4.3% underlying volume decline of the Domestic mail,
- lower revenues in Value Added Services, Philately, Retailer, Banking and Financial products,
- partially compensated by price increases in Domestic Mail.
Growth of P&I revenues in the third quarter amounts to EUR 17.8m and is mainly attributable to the Parcels product portfolio, which increased by EUR 15.1m and is favorably influenced by
- the take-over of Gout International BV, BEurope Consultancy BV, Ecom Global Distribution Ltd and Starbase Global Logistics Inc (impact of EUR 1.9m on the Parcels product portfolio and of EUR 2.5m on total operating income),
- the performance of International Parcels, driven by the solid growth in the US and the good China-related growth,
- the remaining balance is explained by the growth in Domestic Parcels, driven by e-commerce evolution.

Third quarter 2014 Interim Financial Report
Press Release – Brussels, 03/11/2014 – 17:45pm (CET) Regulated information
www.bpost.be/ir
Page 19 of 28
Inter-segment sales are immaterial. There is no internal operating income. Excluding the remuneration received to provide the services as described in the Management Contract (see note 6), no single external customer exceeds 10% of bpost’s operating income. The following table introduces the revenues from external customers attributed to Belgium and to all foreign countries in total from which bpost derives its revenues. The allocation of the revenues of the external customers is based on their location. Year-to-date 3rd quarter In million EUR 2014 2013 2014 2013 Belgium 1,571.1 1,635.0 485.0 507.0 RoW 238.3 167.3 84.2 59.5 Total operating income 1,809.4 1,802.2 569.2 566.6
The following tables present EBIT and EAT information about bpost’s operating segments for the period ended September 30, 2014 and 2013: Year-to-date 3rd quarter In million EUR 2014 2013 2014 2013 MRS 372.5 362.6 91.0 84.0 P&I 23.5 9.5 1.8 (1.6) Total EBIT of operating segments 396.0 372.1 92.8 82.4 Corporate (Reconciling category) (18.7) (8.2) (9.8) (0.9)
Total EBIT 377.3 363.9
82.9 81.5
In the third quarter of 2014, EBIT of the MRS operating segment increased by EUR 7.0m to EUR 91.0m. The volume decline was more than compensated by price increases combined with productivity improvements and costs reduction. EBIT attributable to the P&I operating segment improved by EUR 3.4m from negative EUR 1.6m to EUR 1.8m in the third quarter of 2014 mainly thanks to a positive impact of the settlement of terminal dues translating into increased margins combined with a better performance of the P&I subsidiaries. Year-to-date 3rd quarter In million EUR 2014 2013 2014 2013 MRS 372.5 362.6 91.0 84.0 P&I 23.5 9.5 1.8 (1.6) Total EAT of operating segments 396.0 372.1 92.8 82.4 Corporate (Reconciling category) (151.2) (136.9) (40.0) (28.6) Total EAT 244.8 235.2 52.7 53.8
Financial income, financial costs, share of profit of associates and income tax expenses are all included in the reconciling category “Corporate”. The following table provides detailed information on the reconciling category “Corporate”: Year-to-date 3rd quarter In million EUR 2014 2013 2014 2013 Operating Income 24.0 31.3 6.0 13.8 Central departments (Finance, Legal, Internal Audit, CEO, …) (45.7) (48.2) (16.3) (15.2) Other reconciliation items 3.0 8.7 0.5 0.5 Operating expenses (42.7) (39.5) (15.8) (14.7)

Third quarter 2014 Interim Financial Report
Press Release – Brussels, 03/11/2014 – 17:45pm (CET) Regulated information
www.bpost.be/ir
Page 20 of 28
EBIT Corporate (Reconciling category) (18.7) (8.2) (9.8) (0.9) Share of profit of associates 8.9 14.1 2.6 1.9 Financial Results (17.4) (6.6) (5.7) (2.8) Income Tax expense (124.0) (136.1) (27.0) (26.9) EAT Corporate (Reconciling category) (151.2) (136.9) (40.0) (28.6)
Profit from operating activities (EBIT) attributable to the Corporate reconciliation category decreased by EUR 9.0m to negative EUR 9.8m EUR for the third quarter of 2014 from negative EUR 0.9m for the third quarter of 2013. This deterioration is mainly driven by lower sales of buildings (EUR 7.7 m) and cost increase in the central departments (EUR 1.1m). Assets and liabilities are not reported per segment in the company. 6. Turnover Year-to-date 3rd quarter 2014 2013 2014 2013 In million EUR Turnover excluding the SGEI remuneration 1,566.2 1,538.9 486.7 476.7 SGEI remuneration 228.3 227.8 76.1 75.9 Total 1,794.5 1,766.7 562.8 552.6 7. Other Operating Income Year-to-date 3rd quarter In million EUR 2014 2013 2014 2013 Gain on disposal of property, plant and equipment 9.4 15.4 4.7 12.4 Gain on disposal of activities 0.0 14.6 0.0 0.0 Benefits in kind 0.0 0.2 0.0 0.1 Rental income of investment property 0.8 0.7 0.2 0.2 Other rental income 1.3 1.4 0.3 0.3 Third party cost recovery 1.7 2.1 0.6 0.7 Other 1.6 1.2 0.5 0.3
Total 14.8 35.6 6.3 14.0 The sale of the activity of electronics document exchange of Certipost to the Finnish group Basware per January 2013 generated a cash inflow of EUR 15.1m EUR and a gain of EUR 14.6m in the first quarter of 2013. Gains on disposal of property, plant and equipment are mainly related to the sales of buildings. During the third quarter of last year the sale of a single building contributed EUR 11.4m.

Third quarter 2014 Interim Financial Report
Press Release – Brussels, 03/11/2014 – 17:45pm (CET) Regulated information
www.bpost.be/ir
Page 21 of 28
8. Operating expenses Year-to-date 3rd quarter 2014 2013 Change % 2014 2013 Change % In million EUR
Rent and rental costs 51.2 52.5 -2.5% 16.9 18.2 -7.2% Maintenance and repairs 54.1 51.7 4.6% 18.1 17.3 4.6% Energy delivery 28.1 30.7 -8.4% 8.9 9.5 -7.0% Other goods 14.5 15.2 -4.6% 4.9 5.7 -13.2% Postal and telecom costs 4.1 4.8 -15.8% 1.4 1.6 -12.7% Insurance costs 9.5 10.9 -12.5% 3.1 3.2 -2.2% Transport costs 150.7 127.1 18.5% 51.7 43.7 18.3% Publicity and advertising 9.4 13.3 -28.9% 3.0 3.7 -18.8% Consultancy 8.8 11.8 -25.9% 3.5 3.4 4.8% Interim employees 23.6 21.6 8.9% 8.6 6.2 38.4% Third party remuneration, fees 76.2 82.2 -7.3% 26.9 26.6 1.1% Other services 13.3 12.9 2.4% 4.1 4.4 -7.3%
Total 443.4 434.9 2.0% 151.0 143.4 5.3% 9. Property, plant and equipment In the first nine months of 2014 property, plant and equipment slightly decreased by EUR 7.6m, or 1.3%, to EUR 562.6m as of September 30, 2014. The decrease was due to depreciation and impairment of EUR 53m for the first nine months of 2014, transfers to assets held for sale of EUR 2.5m and transfer to intangible assets of EUR 1.9m partially offset by capital expenditures of EUR 48.8m as well as transfers from investment property of EUR 1.1m. 10. Intangible assets Intangible assets increased by EUR 3.8m, or 3.5%, to EUR 92.8m as of September 30, 2014, mainly due to the goodwill increase (EUR 4.9m), related to the acquisition of the new subsidiaries Gout International BV, BEurope Consultancy BV, Ecom Ltd and Starbase Global Logistics Inc. 11. Investments in associates Investments in associates increased by EUR 75.5m, or 22.1%, to EUR 416.9m as of September 30, 2014, reflecting the Company’s share of bpost bank’s profit for the first nine months of 2014 in the amount of EUR 8.9m and the increase in the unrealized gain on the bond portfolio in the amount of EUR 66.7m, reflecting an average decrease of the underlying yield curve by 62 basis points (bps). As of September 30, 2014, investments in associates comprised net unrealized gains in respect of the bond portfolio in the amount of EUR 223.3m, which represented 53.6% of total investments in associates. The unrealized gains were generated by the lower level of interest rates compared to the acquisition yields of the bonds. Unrealized gains are not recognized in the income statement but rather are recognized directly in equity in other comprehensive income. 12. Current trade and other receivables Current trade and other receivables decreased by EUR 87.6m, or 21.9%, to EUR 312.6m as of September 30, 2014. The decrease was mainly driven by the settlement of the SGEI receivable for the last quarter of 2013 and the settlement of terminal dues from other postal operators.
Third quarter 2014 Interim Financial Report
Press Release – Brussels, 03/11/2014 – 17:45pm (CET) Regulated information
www.bpost.be/ir
Page 22 of 28
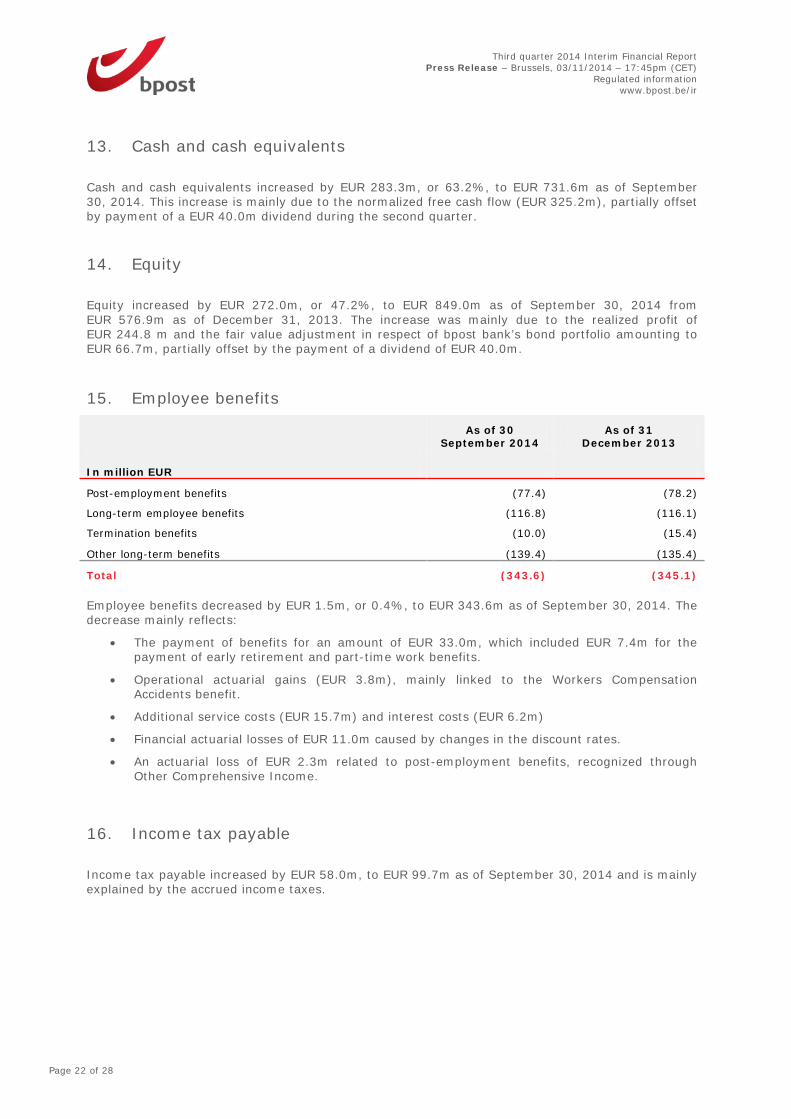
13. Cash and cash equivalents Cash and cash equivalents increased by EUR 283.3m, or 63.2%, to EUR 731.6m as of September 30, 2014. This increase is mainly due to the normalized free cash flow (EUR 325.2m), partially offset by payment of a EUR 40.0m dividend during the second quarter. 14. Equity Equity increased by EUR 272.0m, or 47.2%, to EUR 849.0m as of September 30, 2014 from EUR 576.9m as of December 31, 2013. The increase was mainly due to the realized profit of EUR 244.8 m and the fair value adjustment in respect of bpost bank’s bond portfolio amounting to EUR 66.7m, partially offset by the payment of a dividend of EUR 40.0m. 15. Employee benefits
As of 30 September 2014
As of 31 December 2013
In million EUR
Post-employment benefits (77.4) (78.2)
Long-term employee benefits (116.8) (116.1)
Termination benefits (10.0) (15.4)
Other long-term benefits (139.4) (135.4)
Total (343.6) (345.1) Employee benefits decreased by EUR 1.5m, or 0.4%, to EUR 343.6m as of September 30, 2014. The decrease mainly reflects:
• The payment of benefits for an amount of EUR 33.0m, which included EUR 7.4m for the payment of early retirement and part-time work benefits.
• Operational actuarial gains (EUR 3.8m), mainly linked to the Workers Compensation Accidents benefit.
• Additional service costs (EUR 15.7m) and interest costs (EUR 6.2m)
• Financial actuarial losses of EUR 11.0m caused by changes in the discount rates.
• An actuarial loss of EUR 2.3m related to post-employment benefits, recognized through Other Comprehensive Income.
16. Income tax payable Income tax payable increased by EUR 58.0m, to EUR 99.7m as of September 30, 2014 and is mainly explained by the accrued income taxes.

Third quarter 2014 Interim Financial Report
Press Release – Brussels, 03/11/2014 – 17:45pm (CET) Regulated information
www.bpost.be/ir
Page 23 of 28
17. Current trade and other payables Current trade and other payables decreased by EUR 51.0m, or 6.9%, to EUR 683.7m as of September 30, 2014. This decrease was due to the decline of the trade payables by EUR 51.0m, or 36.9% in comparison with 31 December 2013 and the decrease in social security payables by EUR 18.1m, offset by the increase in advance payments by EUR 18.1m. The increase of the latter is a phasing element as settlement occurs at year-end. The decrease of the social security payables is mainly caused by a timing difference as 2013 full year social accruals (holiday pay, bonuses,...) have been paid during 2014. 18. Contingent Liabilities and Contingent Assets As of September 30, 2014, bpost had 5,213 auxiliary postmen. At this stage, 53 auxiliary postmen initiated a lawsuit against the Company in the Brussels and Charleroi Labor Courts claiming equal salary and benefits by reference to baremic contractual employees performing the same work, mainly under the non-discrimination provisions set forth in Articles 10 and 11 of the Belgian Constitution. All claims and allegations are contested by bpost. However, if the courts were to find that this principle is applicable and bpost is found to have violated it, the labor courts will most likely order bpost to increase the compensation of the auxiliary postmen to the level of relevant baremic contractual employees and it cannot be excluded that other employees could bring similar claims. 19. Events After the Reporting Period No significant events impacting the Company’s financial position have been observed after the statement of financial position date.

Third quarter 2014 Interim Financial Report
Press Release – Brussels, 03/11/2014 – 17:45pm (CET) Regulated information
www.bpost.be/ir
Page 24 of 28
Other financial information (unaudited)
Reconciliation of Reported to Normalized Financial Metrics bpost also analyzes the performance of its activities on a normalized basis or before non-recurring items. Non-recurring items represent significant income or expense items that due to their non-recurring character are excluded from internal reporting and performance analyses. bpost strives to use a consistent approach when determining if an income or expense item is recurring or non-recurring and if it is significant enough to be excluded from the reported figures to obtain the normalized ones. A non-recurring item is deemed to be significant if it amounts to EUR 20m or more. All profits or losses on disposal of activities are normalized whatever the amount they represent. Reversals of provisions whose addition had been normalized from income are also normalized whatever the amount they represent. The presentation of normalized results is not in conformity with IFRS and is not audited. The normalized results may not be comparable to normalized figures reported by other companies as those companies may compute their normalized figures differently from bpost. Normalized financial measures are presented below. Income Statement related
OPERATING INCOME Year-to-date 3rd quarter
2014 2013 Change
% 2014 2013 Change % In million EUR
Total operating income 1,809.4 1,802.2 0.4% 569.2 566.6 0.5% Disposal of selected activities of Certipost (1)
(14.6)
Normalized total operating income 1,809.4 1,787.7 1.2% 569.2 566.6 0.5%
OPERATING EXPENSES Year-to-date 3rd quarter
2014 2013 Change
% 2014 2013 Change
% In million EUR
Total operating excluding depreciation, amortization (1,368.3) (1,372.4) -0.3% (464.7) (462.7) 0.4%
Normalized total operating expenses excluding depreciation, amortization (1,368.3) (1,372.4) -0.3% (464.7) (462.7) 0.4%
EBITDA Year-to-date 3rd quarter
2014 2013 Change
% 2014 2013 Change % In million EUR
EBITDA 441.0 429.9 2.6% 104.4 103.9 0.6% Disposal of selected activities of Certipost (1)
(14.6)
Normalized EBITDA 441.0 415.3 6.2% 104.4 103.9 0.6%

Third quarter 2014 Interim Financial Report
Press Release – Brussels, 03/11/2014 – 17:45pm (CET) Regulated information
www.bpost.be/ir
Page 25 of 28
EBIT Year-to-date 3rd quarter
2014 2013 Change
% 2014 2013 Change
% In million EUR
Profit from operating activities (EBIT) 377.3 363.9 3.7% 82.9 81.5 1.8% Disposal of selected activities of Certipost (1)
(14.6)
Normalized profit from operating activities (EBIT) 377.3 349.3 8.0% 82.9 81.5 1.8%
PROFIT FOR THE YEAR (EAT) Year-to-date 3rd quarter
2014 2013 Change
% 2014 2013 Change
% In million EUR
Profit for the year 244.8 235.2 4.1% 52.7 53.8 -1.9% Disposal of selected activities of Certipost (1)
(14.6)
Normalized profit of the year 244.8 220.6 11.0% 52.7 53.8 -1.9%
(1) In October 2012, the Company reached an agreement with the Finnish group Basware on the
sale of the electronic document exchange activities of Certipost as of January 2013. Certipost continues its other activities (securing documents, digital certificates and Belgian electronic cards. The normalization of EUR 14.6m corresponds to the gain on the disposal of the activities. This disposal did not generate a tax charge, as Certipost has tax losses carried forward on which no deferred tax asset had been recorded.
Cash Flow Statement related Year-to-date 3rd quarter 2014 2013 Change % 2014 2013 Change % In million EUR
Net Cash from operating activities 379.7 160.1 137.1% (16.7) (6.7) 151.4% Net Cash used in investing activities (54.8) (46.8) 17.0% (21.7) 4.1 -626.0%
Operating free cash flow 324.9 113.3 186.8% (38.5) (2.5) 1412.8% Deposits received from third parties 0.2 0.0
0.0 0.0
Payment relating to the decision of the European Commission (2) 0.00 123.1 -100.0% 0.00 0.00 Normalized operating free cash flow 325.2 236.5 37.5% (38.5) (2.5) 1412.8% (2) The amount of EUR 123.1m relates to the non-recurring payment of the alleged
overcompensation for which a provision was recorded in 2012 covering the period 2011-2012.

Third quarter 2014 Interim Financial Report
Press Release – Brussels, 03/11/2014 – 17:45pm (CET) Regulated information
www.bpost.be/ir
Page 26 of 28
From IFRS Consolidated Net Profit to Belgian GAAP Unconsolidated Net Profit
Year-to-date 3rd quarter 2014 2013 Change % 2014 2013 Change % In million EUR
IFRS Consolidated Net Profit 244.8 235.2 4.1% 52.7 53.8 -1.9% Results of subsidiaries and deconsolidation impacts (16.4) (34.7) -52.9% (1.2) (2.0) -41.1% Differences in depreciation and impairments (6.1) (4.6) 33.4% (1.8) (0.5) 252.2% Differences in recognition of provisions (8.1) (8.9) -9.5% (2.8) (2.4) 15.0% Effects of IAS19 (2.8) (27.5) -89.8% (3.5) (8.3) -58.0% Deferred taxes 7.5 15.0 -49.8% 3.2 4.1 -21.3% Other (0.9) 1.0 -191.8% (0.2) 0.2 -179.0% Belgian GAAP unconsolidated net profit 218.1 175.5 24.3% 46.6 44.9 3.9% The Company’s unconsolidated profit after taxes prepared in accordance with Belgian GAAP can be derived from the consolidated IFRS profit after taxes in two stages. The first stage consists of un-consolidating the profit after taxes under IFRS, i.e.:
• Eliminating the impact of the disposal of selected activities of Certipost for which a gain was realized in 2013,
• Subtracting the results of the subsidiaries, i.e. removing the profit after tax of the subsidiaries; and
• Eliminating any other Income Statement impact the subsidiaries had on the Company (such as impairments) and adding the dividends received from these subsidiaries. During the third quarter of 2014 Certipost paid a dividend of EUR 5.8m to bpost.
The table below sets forth the breakdown of the above mentioned impacts:
Year-to-date 3rd quarter 2014 2013 2014 2013 In million EUR Disposal of selected activities of Certipost (14.6) Profit of the Belgian fully consolidated subsidiaries (local GAAP) (6.1) (2.6) (1.4) (0.1) Profit of the international subsidiaries (local GAAP) (6.5) (3.6) (2.6) (0.8) Share of profit of bpost bank (local GAAP) (8.4) (13.8) (2.5) (1.8) Other deconsolidation impacts 4.6 (0.1) 5.3 0.7 Total (16.4) (34.7) (1.2) (2.0) The second stage consists of deriving the Belgian GAAP figures from the IFRS figures and is achieved by reversing all IFRS adjustments made to local GAAP figures. These adjustments include, but are not limited to the following:
• Differences in the treatment of depreciation and impairments: Belgian GAAP allows different useful lives (and hence depreciation rates) for fixed assets from IFRS. Goodwill is amortized under Belgian GAAP while IFRS requires impairment testing for goodwill. IFRS also allows intangible assets to be recorded on the balance sheet under different conditions from Belgian GAAP;
• Recognition of provisions is subject to different criteria under Belgian GAAP and IFRS;
• IFRS requires that all future obligations to personnel be recorded as a liability under IAS 19, whereas Belgian GAAP has no such obligation. The movements in the IFRS liability are reflected on the Company’s Income Statement under personnel costs or provisions, except

Third quarter 2014 Interim Financial Report
Press Release – Brussels, 03/11/2014 – 17:45pm (CET) Regulated information
www.bpost.be/ir
Page 27 of 28
for the impact of changes in the discount rates for the future obligations, which is recorded as a financial result;
• The evolution of IAS 19 is mainly explained by the increase of the financial charges related to employee benefits, which is due to the decrease in the discount rates. Besides this, the year-over-year evolution is also explained by the plans for early retirement and partial career interruption launched end 2012, for which the first quarter 2013 subscription rate was higher compared to the first quarter of the current year and for which full impact was already accounted for under IFRS in the fourth quarter 2012.
• Deferred taxes are not an accounting concept under Belgian GAAP, but are recorded under IFRS.
Statement of legal representatives
The bpost Management Committee declares that to the best of its knowledge, the condensed consolidated financial statements, established in accordance with International Financial Reporting Standards (“IFRS”), give a true and fair view of the assets, financial position and results of bpost and of the entities included in the consolidation. The financial report gives an accurate overview of the information that needs to be disclosed pursuant to article 13 and 14 of the Royal Decree of 14 November 2007. The bpost Management Committee is represented by Koen Van Gerven, Chief Executive Officer and Pierre Winand, Chief Financial Officer.
Forward Looking Statements
The information in this document may include forward-looking statements6
, which are based on current expectations and projections of management about future events. By their nature, forward-looking statements are not guarantees of future performance and involve known and unknown risks, uncertainties, assumptions and other factors because they relate to events and depend on circumstances that will occur in the future whether or not outside the control of the Company. Such factors may cause actual results, performance or developments to differ materially from those expressed or implied by such forward-looking statements. Accordingly, no assurance is given that such forward-looking statements will prove to have been correct. They speak only as at the date of the Presentation and the Company undertakes no obligation to update these forward-looking statements contained herein to reflect actual results, changes in assumptions or changes in factors affecting these statements.
6 as defined among others under the U.S. Private Securities Litigation Reform Act of 1995

Third quarter 2014 Interim Financial Report
Press Release – Brussels, 03/11/2014 – 17:45pm (CET) Regulated information
www.bpost.be/ir
Page 28 of 28
Glossary
• Operating free cash flow (FCF): cash flow from operating activities + cash flow from investing activities
• Net debt/(net cash) represents interest and non-interest bearing loans less cash and cash equivalents