BPO Sector Overview
22
BPO SECTOR OVERVIEW
Transcript of BPO Sector Overview

8/4/2019 BPO Sector Overview
http://slidepdf.com/reader/full/bpo-sector-overview 1/22
BPO SECTOR OVERVIEW

8/4/2019 BPO Sector Overview
http://slidepdf.com/reader/full/bpo-sector-overview 2/22
Globalization
�The most important f orce shaping global economics and politics in the early twenty-f irst century is a triple convergence - of new players, on a new playing f ield, developing new
processes and habits f or horizontal collaboration."
�"The 'hot line,' which used to connect the
Kremlin with the White House has been replaced by the 'help line,' which connects everyone in America to call centers in Bangalore."

8/4/2019 BPO Sector Overview
http://slidepdf.com/reader/full/bpo-sector-overview 3/22
ITES-BPO Industry
BPO predicted to overtake ITO in next 5 years
� The term captures: customer f acing, voice activities
non-customer f acing, back off ice activities
� end-to-end integrated services

8/4/2019 BPO Sector Overview
http://slidepdf.com/reader/full/bpo-sector-overview 4/22
Why India?
Still seen as paving the way among developing
countries
Most of the export of IT and ITES go to the UKand US
Off -shoring largely f ollows the contours of
linguistic and cultural compatibility, arising
f rom the legacy of empire and colonialism

8/4/2019 BPO Sector Overview
http://slidepdf.com/reader/full/bpo-sector-overview 5/22

8/4/2019 BPO Sector Overview
http://slidepdf.com/reader/full/bpo-sector-overview 6/22
Activities
Horizontals
± Processes that are seen as being similar across industries
(Customer interaction and support, f inance and
accounting, HRM, procurement services, and knowledgeservices)
Verticals
± Processes which require vertical-specif ic knowledge and
are not easily replicable across industries, such as claims processing f or the insurance industry or credit card
collections f or the credit services industry

8/4/2019 BPO Sector Overview
http://slidepdf.com/reader/full/bpo-sector-overview 7/22
Indian BPO industry continues to grow rapidly
Notes: (1) Leader locations are Bengaluru, Chennai, Hyderabad, Kolkata, Mumbai, NCR (Delhi, Noida, Gurgaon, Faridabad), PuneSource: NASSCOM
Exports
Domestic
Indian BPO Sector Revenue
(USD billion, percentage)
3.1
6.3
10.9
0.9
1.6
0.3
2004 2006 2008E
3.4
7.2
12.5
CAGR
38%
37%
52%Higher process maturity and quality of output
Increasing proportion of non-voice work (e.g.,
transaction processing, research etc.) likely to be
outsourced over the next two three years
Higher competition f or lower end BPO services
Emergence of competing destinations trying to
emulate the Indian success
Perceived commoditization - Increasing
sensitivity to prices
Growth in domestic BPO industry Still nascent,
expected to increase with growing business
demandsPrimarily driven by Financial Services, Telecom
and Retail sectors

8/4/2019 BPO Sector Overview
http://slidepdf.com/reader/full/bpo-sector-overview 8/22
Underlying dynamics
ICTs, which have enabled market expansion, removed geographical constrictions and reduced the need f or inf rastructure (Miozzo and Ramirez, 2003)
Time is compressed while space and distance are expanded (Massey 2007)
Distance shrinking ICTs enabled remote delivery and generated
economies of scale through the centralisation of previously-dispersed f acilities ± Work can take place anywhere there is a phone line thus making it easy to
establish operations nearly anywhere on the globe (Ritzer and Lair 2008: 40).
Yet paradoxically, place and space takes on increasing importance
New regulatory f rameworks, competitive sectoral markets, and broader
changes associated with liberalisation, privatisation and de-regulation ± GATS
± Deregulation of Indian telecoms industry
± Pressure f rom NASSCOM f or benef its to ITES-BPO sector

8/4/2019 BPO Sector Overview
http://slidepdf.com/reader/full/bpo-sector-overview 9/22
Tiered cities
No. of providers
per city
Average centre
Size (employees)
Tier 1
Delhi-NCR,Mumbai, Bangalore
120-150 350-45
Tier 1.5
Chennai,
Hyderabad, Pune,Kolkata
75-100 250-300
Tier 2/3 10-15 180-220
Tier 3/4 ?? ??
(Nasscom-Everest 2008)

8/4/2019 BPO Sector Overview
http://slidepdf.com/reader/full/bpo-sector-overview 10/22
However, most of this growth is currently concentrated in
~7 leading locations
Success and economic growth of these locations has led to significant interest from
other states / locations to leverage this sector as a growth driver for their economies
The top 7 locations account for around 90% of the
industry¶s employment today
These locations have helped in transforming their
states into a knowledge driven economy with high
per capita income
However, the hyper and concentrated growth acrossmost of these leading locations have resulted in:
± Saturation and deteriorating infrastructure
± Presence of large number of IT-BPO players
resulting in high attrition and increased
wages
± Rapid growth of other sectors, resulting in
greater competition for talent
± Rising real estate costs
± Deteriorating social and living environment
Hyderabad
Delhi
Faridabad
Bangalore
Mumbai
Pune
Chennai
Noida
Kolkata

8/4/2019 BPO Sector Overview
http://slidepdf.com/reader/full/bpo-sector-overview 11/22
Choice of an
off shoring
destination
country
Accelerator SteeringSmooth
Brake
Brake
Primary
motivating
f actors
Inhibiting
f actors
Facilitating
f actors
A f ramework f or evaluating the attractiveness of a
country f or off shoring

8/4/2019 BPO Sector Overview
http://slidepdf.com/reader/full/bpo-sector-overview 12/22
Bangalore

8/4/2019 BPO Sector Overview
http://slidepdf.com/reader/full/bpo-sector-overview 13/22
Hyderabad

8/4/2019 BPO Sector Overview
http://slidepdf.com/reader/full/bpo-sector-overview 14/22
� Cities are at breaking point, and f urther
growth will have to come f rom entirely new
business districts outside of T1 and T2 cities

8/4/2019 BPO Sector Overview
http://slidepdf.com/reader/full/bpo-sector-overview 15/22
Electronic City Bangalore

8/4/2019 BPO Sector Overview
http://slidepdf.com/reader/full/bpo-sector-overview 16/22
� The processes of social reproduction then crystallize into a relatively permanent patchwork quilt of local, interregional and
even international specialisation. This patchwork quilt may then also be associated with marked differentials in the value and value-productivity of labour power
8/4/2019 BPO Sector Overview
http://slidepdf.com/reader/full/bpo-sector-overview 17/22
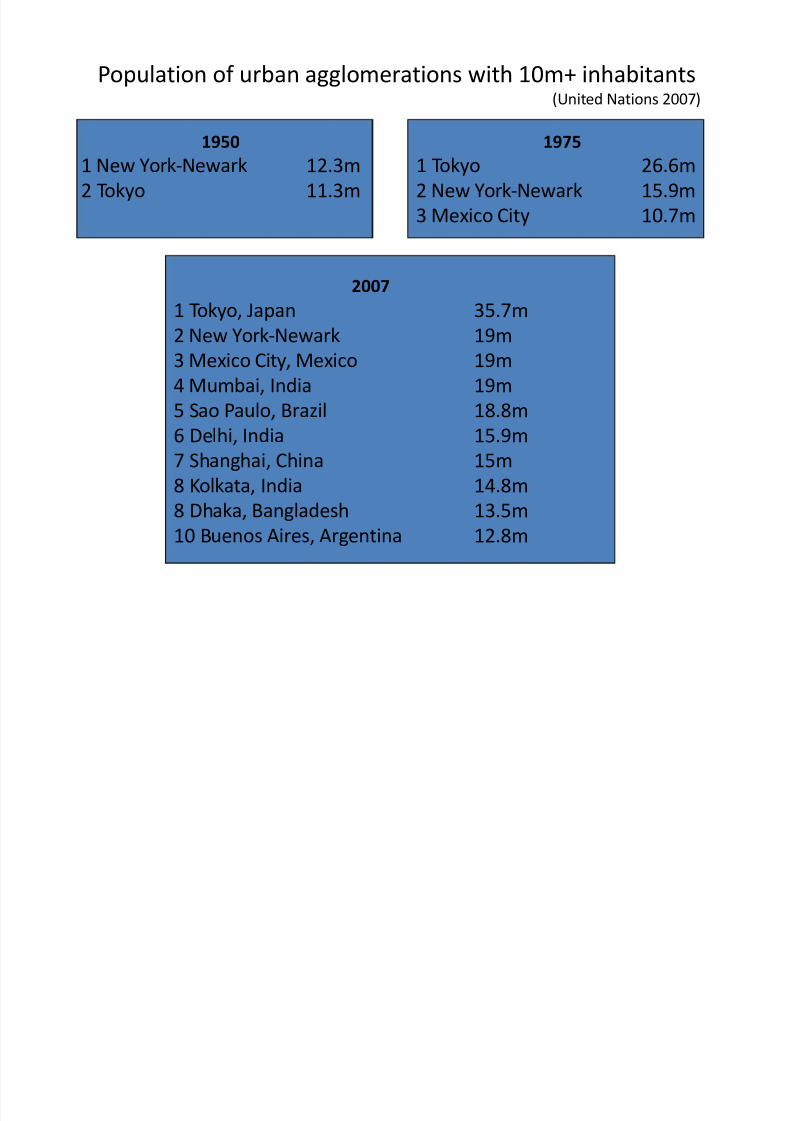
Population of urban agglomerations with 10m+ inhabitants
1975
1 Tokyo 26.6m
2 New York-Newark 15.9m
3 Mexico City 10.7m
1950
1 New York-Newark 12.3m
2 Tokyo 11.3m
2007
1 Tokyo, Japan 35.7m
2 New York-Newark 19m
3 Mexico City, Mexico 19m
4 Mumbai, India 19m
5 Sao Paulo, Brazil 18.8m6 Delhi, India 15.9m
7 Shanghai, China 15m
8 Kolkata, India 14.8m
8 Dhaka, Bangladesh 13.5m
10 Buenos Aires, Argentina 12.8m
(United Nations 2007)

8/4/2019 BPO Sector Overview
http://slidepdf.com/reader/full/bpo-sector-overview 18/22
Leaders Challengers Followers Aspirants
� Ahmedabad(2)
� Bhubaneshwar � Chandigarh(
)
� Coimbatore
� Indore
� Jaipur
� Kochi
� Lucknow
� Madurai� Mangalore
� Nagpur
� Thiruvananthapuram
� Tiruchirappalli
� Vadodara
� Visakhapatnam
� Aurangabad
� Bhopal� Goa
� Gwalior
� Hubli-Dharwad
� Kanpur
� Mysore
� Nashik
� Pondicherry� Salem
� Surat
� Vijayawada
� Allahabad
� Dehradun� Durgapur
� Gangtok
� Guwahati
� Ludhiana
� Patna
� Raipur
� Ranchi� Shimla
� Siliguri
� Srinagar
� Varanasi
Findings indicate that the 50 locations in India are categorized along a typical f our stage
development path
Location Classification
Increasing Location Attractiveness
Bangalore
Chennai
Hyderabad
Kolkata
Mumbai
NCR
Pune

8/4/2019 BPO Sector Overview
http://slidepdf.com/reader/full/bpo-sector-overview 19/22
TRAINING & DEVELOPMENT

8/4/2019 BPO Sector Overview
http://slidepdf.com/reader/full/bpo-sector-overview 20/22
NEED FOR T&D
� Productivity
� Team
� Organization Culture� Organization Climate
� Quality
� Healthy work environment� Health and Safety

8/4/2019 BPO Sector Overview
http://slidepdf.com/reader/full/bpo-sector-overview 21/22
BENEFITS
� Increased job satisf action and morale among employees.
� Better inter personal relationship and
customer satisf action.
� Increased employee motivation.
� Increased eff iciencies in processes, resulting in
improved f inancial gain.� Increased capacity to adopt new technologies
and methods.

8/4/2019 BPO Sector Overview
http://slidepdf.com/reader/full/bpo-sector-overview 22/22
THANKYOU