BPI Lonza November 2010
39
Transcript of BPI Lonza November 2010


Global Material Harmonization for
BioProcess International Webinar
Increased Effectiveness & Reduced Risk
Ben Locwin, M.S., M.B.A. / Lonza Biologics, Inc. / November 2010

“Effi i i d i thi i ht“Efficiency is doing things right; effectiveness is doing the right things.”
Peter Drucker
slide 415-Nov-10 See reference number 1

Where We’ve Beenvs. Where We Need to Go
As geographic distances continue to metaphorically shrink, we need to:
Assess our operational effectivenessReduce our risk profile and that of our customers
Each instance of “next-level” thinking requires many operational changes
Previous thinking New thinking
“We can be successfully
audited at any site”
“Each of our sites can function as a subset of the whole” Now what?
slide 515-Nov-10
Create better systems, render additional testing unnecessary
whole …Now what?

Background on Risk
Risk is the antecedent to:Our products’ SISPQOur products’ success
“Know thyself ”
Market perceptionConsumer perception
Know thyself.Heraclitus,
Greek philosopher
To understand good, we must understand about the proportion that isn’t
slide 615-Nov-10
Risk is ubiquitous; Success hinges on mitigating itSee reference number 2

9-11 Aftermath
Research indicates the perception of risk has an enormous impact on behavior
After 9-11, how many people drove to avoid death by airliner who then died by automobile accident?
slide 715-Nov-10
How good are we at avoiding risks?

Neglecting Probabilities
The answer, it turns out, is a sobering 725 more people died than normal in the three months following 9-11 (October, November, and December) by increased driving habits
slide 815-Nov-10 See reference number 3

What 9-11 Did to Our Perception of Risk
The risk of suffering a fatal airline event is 1 in 9.4 billion miles traveled
Risk of Flying vs. Driving
1.4201.40
1.60
er M
iles
The risk of suffering a fatal automobile event is 1 in 0.60
0.80
1.00
1.20
Hun
dred
Mio Passenge
70.4 million miles traveled
An individual is thus 133
0.0110.00
0.20
0.40
Flying DrivingFatalities/H
times more likely per mile traveled to have a fatal event driving versus flying
slide 915-Nov-10
Our behavior when faced with risk is usually not rationalSee reference number 4,5

Using Evidence for Better Decisions
Homeowners in California purchased earthquake insurance most often after
ll i ipersonally experiencing an earthquake, even though most responded (correctly) that the likelihood of anotherthat the likelihood of another quake was lower now that stress on the geologic fault had been reducedhad been reducedPeople generally dismiss low probability events unless they personally experience them
slide 1015-Nov-10
Expanding the time horizon can improve decision-makingSee reference number 6
personally experience them

So What Is Risk?
R = Pf x Mc
Risk is the product of probability and magnitude
R Pf x Mc
How likely is it? How big is it?How likely is it? How big is it?
slide 1115-Nov-10
We need to understand the relative proportions of each

A Case Study on Risk
A 6.6 magnitude earthquake hit near the west coast of Honshu, J 16J l07Japan 16Jul07
The Riken parts plant in Kashiwazaki, Niigata was damaged and closed
slide 1215-Nov-10
Assess risks realistically

A Case Study on Risk
Because they produced automobile piston rings, and their customers were JIT:
Toyota, Mazda, Nissan, and Honda were affected and had to halt productionToyota estimated losses during the downtime at 46,000 units; Nissan at 12,000 units
Lost production
Mother Nature
Earthquake‐prone region
Tsunami
Mother Nature
slide 1315-Nov-10
Assess risks realistically
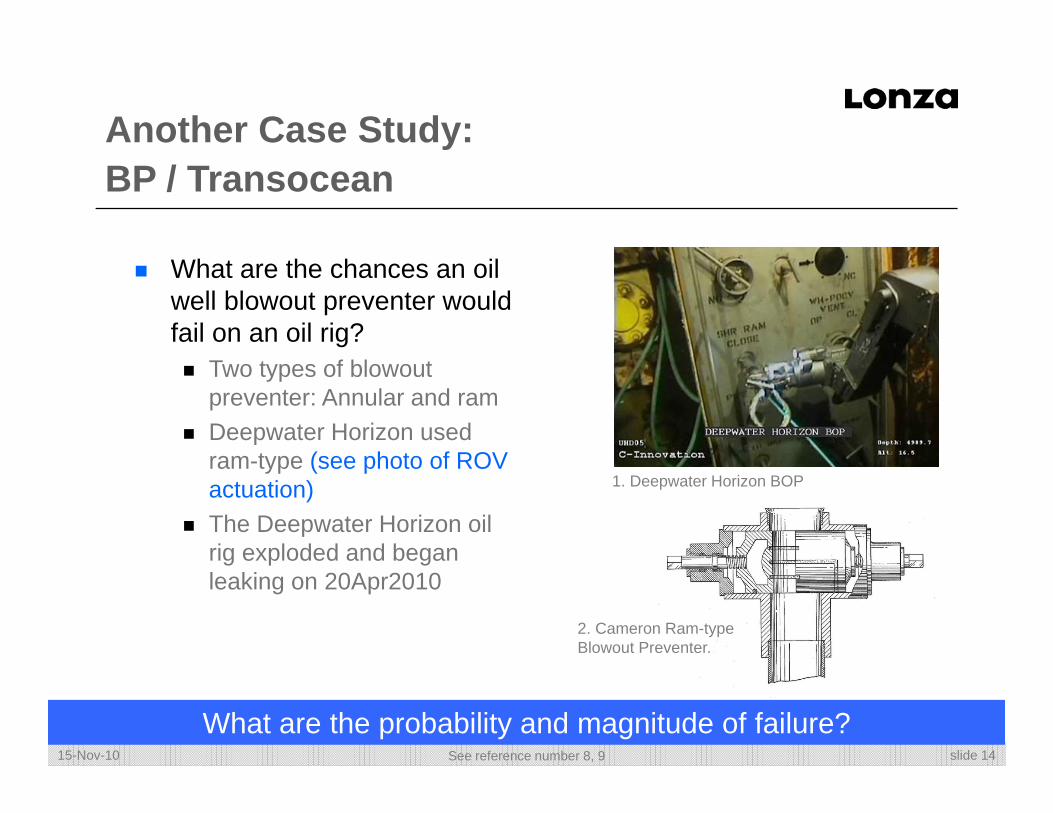
Another Case Study:BP / Transocean
What are the chances an oil well blowout preventer would fail on an oil rig?
Two types of blowout preventer: Annular and ramDeepwater Horizon used ram type (see photo of ROV
1. Deepwater Horizon BOPram-type (see photo of ROV actuation)The Deepwater Horizon oil rig exploded and began
2. Cameron Ram-type Blowout Preventer.
rig exploded and began leaking on 20Apr2010
slide 1415-Nov-10
What are the probability and magnitude of failure?See reference number 8, 9

BP / Transocean:Understanding Failure
“[The] equipment was supposed to have[The] equipment was supposed to have an exceptionally high integrity rating with a failure rate between 1 in a 100,000 and 1 in a million It is clear that the design wasin a million. It is clear that the design was not as failsafe as we'd believed it to be.”
Tony Hayward, CEO BP
slide 1515-Nov-10
Critically examine all process and system risksSee reference number 10

BP / Transocean:Understanding Failure
The blowout preventer has a “single-point failure”
If one of the small shuttle
“One Transocean study found that the blowout preventers had a 45%
valves leading to the ram fail, it will not operateA majority of oil rigs have 2 shear rams Deepwater
p‘failure rate,’ and the entire device could be rendered useless by the failure of a 2 shear rams, Deepwater
Horizon had just oneNeed Multiple Path Redundancy
ysingle valve.”
The New York Times, 20 Jun 2010y
slide 1615-Nov-10
Critically examine all process and system risksSee reference number 10

The Result
“The oil slick produced by the Deepwater Horizon oil spill has
covered as much as 28,958 square qmiles (75,000 sq. kms), an area
about the size of South Carolina.”Cutler J ClevelandCutler J. Cleveland
This is due to an outflow of1.6 million to 7.9 million barrels of oil (66.4 - 332 million gallons)
slide 1715-Nov-10
Always assess risks in the context of magnitude of lossSee reference number 11

Compounding Risk
What we consider “little” things can compound to form big problemsIt only took a metric conversion error to bring down a NASA satelliteThis happened 30Sep99; it was NASA’s Mars Climate Orbiter; one team used
t i th d E li hmetric, another used EnglishThe cost was $125 million
slide 1815-Nov-10
(Try to) expect the unexpectedSee reference number 12

What Can We Learn From This?
Unintended consequence!
Observed extent of risk (OER)
Measure what is bl d
( )What do we actually see?Do we think what we see is the full extent of the problem?
measurable, and make measurable
what is not so.”
(Hint: Usually not)Probable Extent of Risk (PER)
What is probably going on?Galileo GalileiHow much of the problem can
be hidden from view?Do our OER and PER match?
slide 1915-Nov-10
What we see and what is going on can be two different thingsSee reference number 7

How Do These Lessons Help Us?
Goal: Increase our effectiveness while also reducing risk
Status quo
$For the front-end of our processes, we need to dramatically change:
Cost $Receipt to release processing (time cost)Raw material inventory (carrying cost risk to agility)
Quality
New model
(carrying cost, risk to agility)Quality and accuracy of materials identification process (error risk)
slide 2015-Nov-10
Challenging the status quo has many benefits
p ( )

Evaluating the Technology
Determine which materials would respond to which technologyHandheld RamanPortable NIR
xxxAcetic Acid, Glacial
FTIRNIRRamanMaterial Name
xxxAcetic Acid, Glacial
FTIRNIRRamanMaterial Name
Handheld FTIR
xxxCitric Acid Anhydrous Powder
xxxCitric Acid Monohydrate
xxxCholesterol
xxxAmmonium Sulfate
Ammonium Ferric Citrate
xxxCitric Acid Anhydrous Powder
xxxCitric Acid Monohydrate
xxxCholesterol
xxxAmmonium Sulfate
Ammonium Ferric Citrate
xxxDextrose Anhydrous
xxxDexamethasone
xxxD(+)‐ Galactose
Cupric Sulfate, 5‐Hydrate
xxxCitric Acid, Anhydrous, Powder
xxxDextrose Anhydrous
xxxDexamethasone
xxxD(+)‐ Galactose
Cupric Sulfate, 5‐Hydrate
xxxCitric Acid, Anhydrous, Powder
slide 2115-Nov-10
Theoretical exercise shows similar applicability
xxxDimethyl Sulphoxide USP Grade xxxDimethyl Sulphoxide USP Grade

Study Design:The Empirical Work
Need to empirically test the three technologies in a practical way using
Salts, sugars, acids, solvents…
Technology Raman NIR FTIR
List of CTQs established:
CTQ ParameterRaman NIR FTIR
Accuracy/SensitivityPortabilityEase of useAbility to scan through containers (eliminate sampling need)
slide 2215-Nov-10
Need to collect the real data

Creation of Reference Scan
A reference scan was created for each of the 3 technologiesRaman: Material tested was previously released using full QC testing approachNIR: Vendors’ libraries used for study, insufficient lots available to demonstrateFTIR: Material tested was previously released using full QC testing approachapproach
Raman and NIR showed similar accuracy and sensitivity, greater than FTIRR d NIR ld di ti i h b t h d t fRaman and NIR could distinguish between hydrate formsRaman and NIR more sensitive than FTIR for some saltsIn most cases, general compendia ID tests (e.g., USP<191>)
slide 2315-Nov-10
Start differentiating the technologiescan be replaced

Technology Evaluation Results: CTQ Factors
Factor evaluated: Portability NIR required cart and a long extension cord or battery packFTIR was portable, but cannot scan through packagingRaman was portable and could scan through packaging
Technology Raman NIR FTIRCTQ Parameter
Raman NIR FTIR
Accuracy/SensitivityPortabilityEase of useAbility to scan through containers (eliminate sampling need)
slide 2415-Nov-10
Portability is directly related to adoption of technology

Technology Evaluation Results: CTQ Factors
Factor evaluated: Ease of UseSoftware across all was equivalently easy (or not easy)NIR “wand” was bulky, difficult to handleNIR “wand” needed full contact with material, misalignment means second scanHandheld Raman easier to hold and use, more spatially forgiving
TechnologyCTQ Parameter
Raman NIR FTIR
Accuracy/SensitivityPortabilityEase of useAbility to scan through containers ( li i t li d)
slide 2515-Nov-10
Ease of use means errors are minimized
(eliminate sampling need)
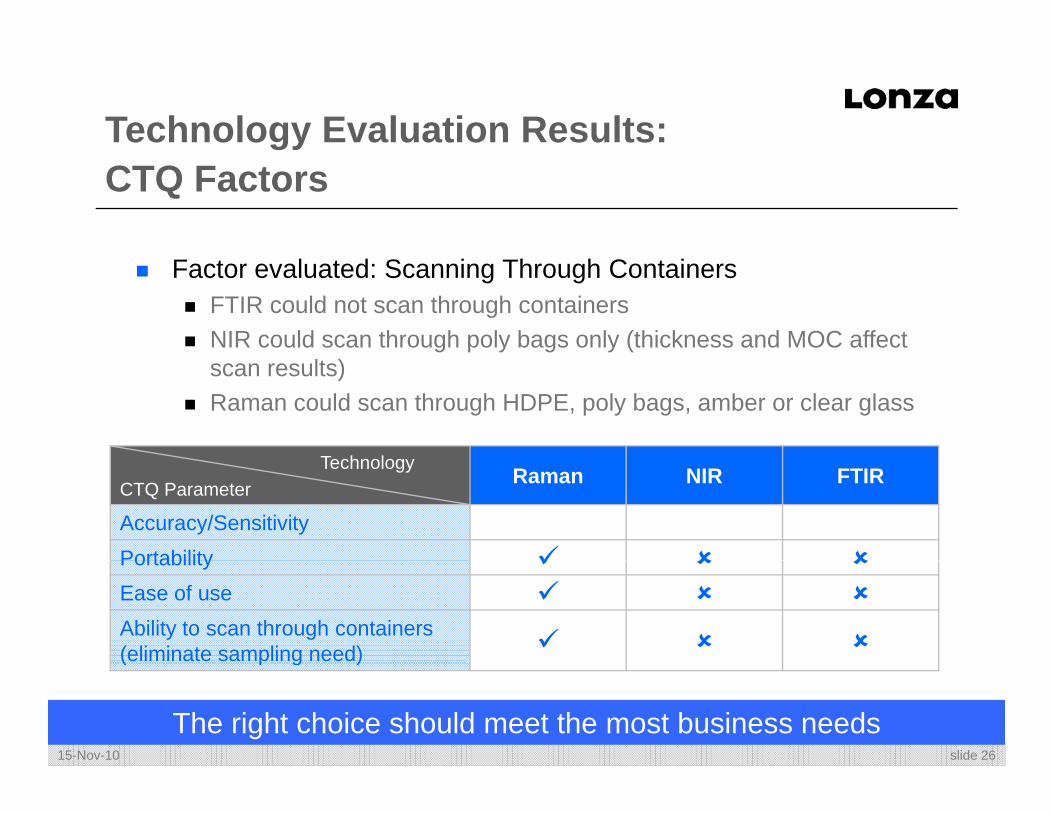
Technology Evaluation Results: CTQ Factors
Factor evaluated: Scanning Through ContainersFTIR could not scan through containersNIR could scan through poly bags only (thickness and MOC affect scan results)Raman could scan through HDPE, poly bags, amber or clear glass
T h lTechnologyCTQ Parameter
Raman NIR FTIR
Accuracy/SensitivityPortabilityPortabilityEase of useAbility to scan through containers (eliminate sampling need)
slide 2615-Nov-10
The right choice should meet the most business needs
( p g )

Example of Specificity: Glucose/Sucrose
As part of the design space, glucose was compared to sucroseTo show that similar materials can be differentiatedTo demonstrate resolution of the output
3 0 0 0
4 0 0 0
5 0 0 0
GlucoseSucrose
Truscan
0
1 0 0 0
2 0 0 0
1 6 0 0 1 4 0 0 1 2 0 0 1 0 0 0 8 0 0 6 0 0 4 0 0 2 0 0 0
6 0 0
Gl
- 2 0 0
0
2 0 0
4 0 0
GlucoseSucrose
slide 2715-Nov-10
Specificity addresses one of the CTQ variables
1 5 0 0 1 4 0 0 1 3 0 0 1 2 0 0 1 1 0 0 1 0 0 0 9 0 0 8 0 0

Example of Specificity:Polysorbate 20/80
As part of the design space, Polysorbate 20 and 80 were compared
To show that similar materials can be differentiated
NIR
To demonstrate resolution of the output
NIR
Polysorbate 20Polysorbate 80
Raman
slide 2815-Nov-10
Further specificity work shows continued promise

Technology Evaluation Results: CTQ Factors
Factor evaluated: Accuracy / Precision / SpecificityRaman and NIR excellent, NIR needs 10 lots minimum for variation absorptionFTIR insufficient for need
Technology Raman NIR FTIRCTQ Parameter
Raman NIR FTIR
Accuracy/SensitivityPortabilityEase of useAbility to scan through containers (eliminate sampling need)
slide 2915-Nov-10
The technology must be accurate as well as precise
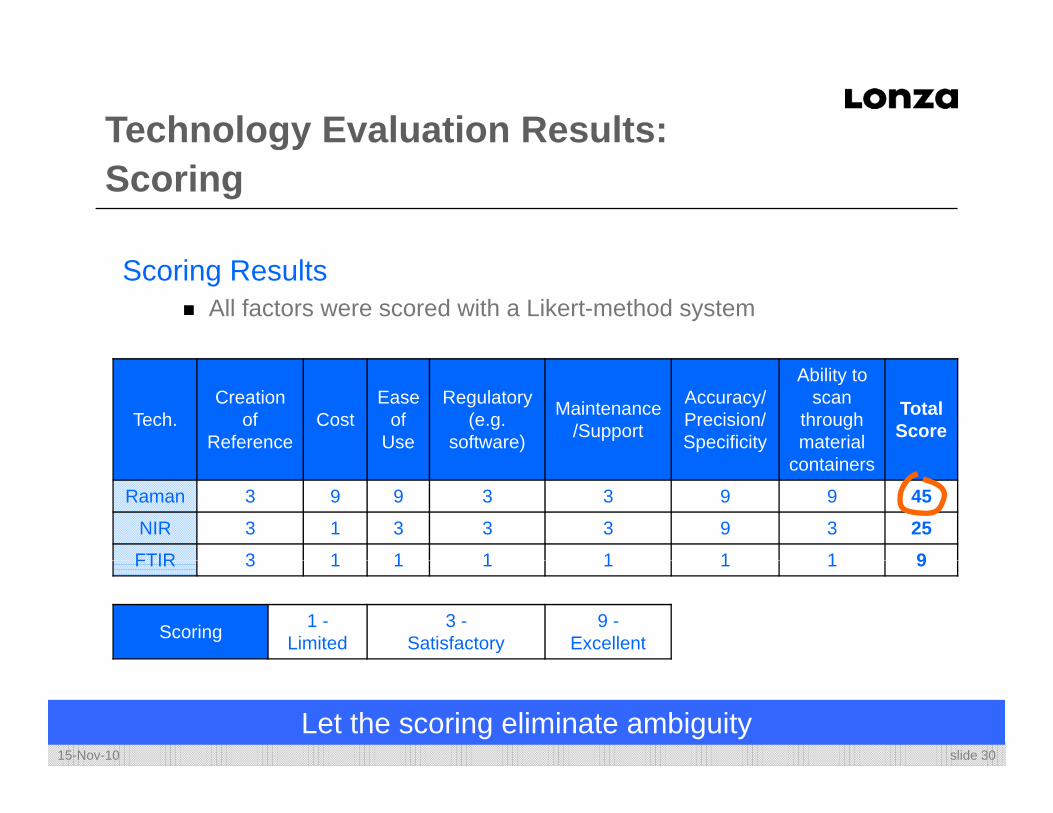
Technology Evaluation Results: Scoring
Scoring Results All factors were scored with a Likert-method system
Tech.Creation
of Reference
CostEase
of Use
Regulatory (e.g.
software)
Maintenance/Support
Accuracy/ Precision/ Specificity
Ability to scan
through material
t i
Total Score
containers
Raman 3 9 9 3 3 9 9 45NIR 3 1 3 3 3 9 3 25FTIR 3 1 1 1 1 1 1 9FTIR 3 1 1 1 1 1 1 9
Scoring 1 -Limited
3 -Satisfactory
9 -Excellent
slide 3015-Nov-10
Let the scoring eliminate ambiguity
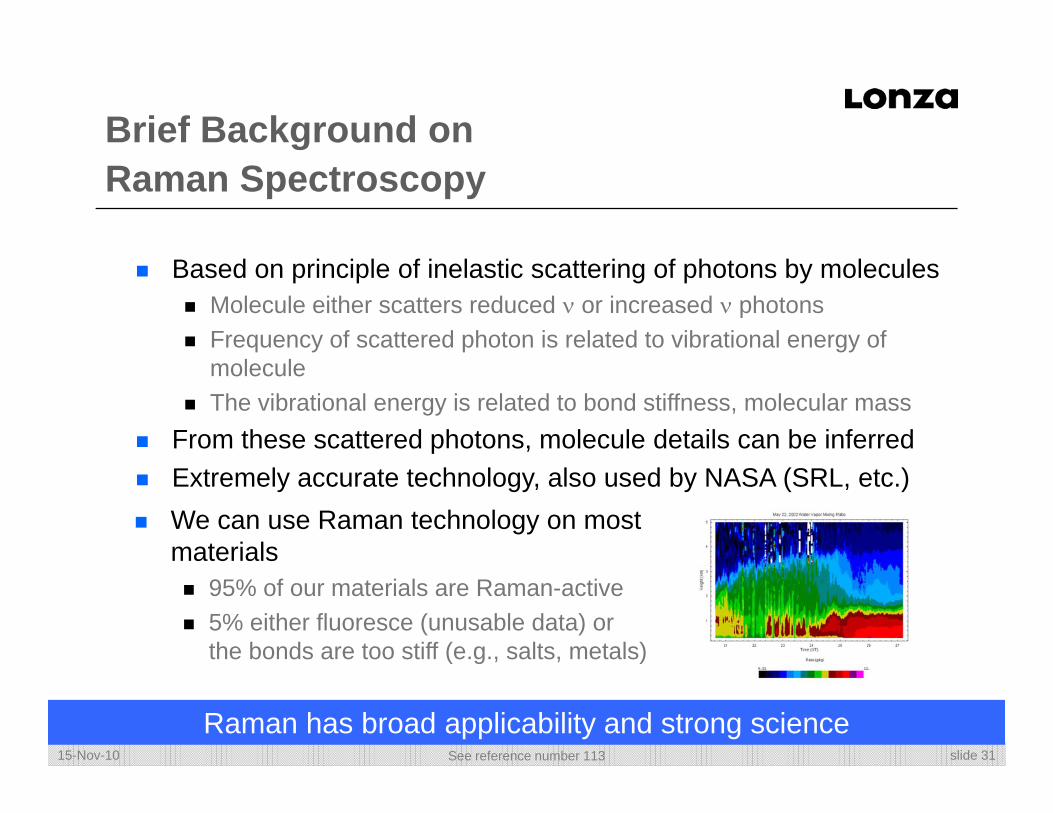
Brief Background on Raman Spectroscopy
Based on principle of inelastic scattering of photons by moleculesMolecule either scatters reduced ν or increased ν photonsFrequency of scattered photon is related to vibrational energy of moleculeThe vibrational energy is related to bond stiffness, molecular mass
From these scattered photons, molecule details can be inferredExtremely accurate technology, also used by NASA (SRL, etc.)We can use Raman technology on most materialsmaterials
95% of our materials are Raman-active5% either fluoresce (unusable data) or the bonds are too stiff (e.g., salts, metals)
slide 3115-Nov-10
Raman has broad applicability and strong scienceSee reference number 113
( g )

Example of Efficiency Saving:Dry Material
5 days 6 hrs 1 day 0.5 hrs 3 hrs 2 days
Raw material process – Dry powder (100 containers, 100% ID)
Vendor Receipt SampleTransport to Lab
Make Reagents
USP <191>
Vendor Receipt SampleTransport to Lab
FTIR
Vendor Receipt NIRVendor Receipt NIR
Vendor Receipt Raman
2+ days, 26% Improvement
slide 3215-Nov-10
Not only more efficient, but more effective

Example of Efficiency Saving:Liquid
5 days 6 hrs 1 day 0.5 hrs 3 hrs 2 days
Raw material process – Liquid, 100% ID
Vendor Receipt SampleTransport to Lab
Make Reagents
USP <191>
Vendor Receipt SampleTransport to Lab
FTIR
Vendor Receipt NIRVendor Receipt NIR
Vendor Receipt Raman
2+ days, 26% Improvement
slide 3315-Nov-10
Benefits seen for most materials, phases

Validation Considerations
Validation of the new technology must be conducted:
URS DQ IQ/OQ PQ SummaryQ Q/ Q Q y
Example PQ challenges:Creation of reference scan (different container types, different vendors)vendors)Specificity is considered a compendial technique (USP<1226>)Need to be smart about folder/file security to be Part 11 compliant
slide 3415-Nov-10
Robust implementation is a requirement

Implementation
Change control needs to take account of multiple customers
Specification revision priority based on volume/cost
slide 3515-Nov-10
Consider risks during implementation

Increased Effectiveness, Reduction of Risk
Multiple sites harmonized on new process, this allows for:Use of one material specificationShared testingShared raw material qualification (IQ, OQ, PQ at one site)Shared inventory (and potential to share safety stock)Taking advantage of global cost differences (storage, shipping, etc.)
Standardized basic ID tests:Greatly enhanced speed and market agility (TAT)Consistency across all sites (improved quality, reduced risk to y ( p q y,customers)
Vendor leverageCan buy in greater volume, not subject to global price variation
slide 3615-Nov-10
Can be more effective while simultaneously reducing risk
y g j g p
References
1. Emerald. (2010). 1st global Peter Drucker forum. Retrieved 22Sep10 from: http://www.emeraldinsight.com/2. Image source: Retrieved 11Aug09 from: http://www.mytholyoke.edu/
3. Reference: Blalock, G., Kadiyali, V., Simon, D.H. (2005). The impact of 9/11 on driving fatalities: The other lives lost to terrorism. Ithaca, NY: Cornell University.4. References: NHTSA. (2009). Fatality analysis reporting system. Retrieved from: http://www-fars.nhtsa.dot.gov/Main/index.aspx.5 Sivak M Flannagan M (2002) Flying and driving after the September 11 attacks UMTRI Research Review 33(3) Ann Arbor MI:5. Sivak, M., Flannagan, M. (2002). Flying and driving after the September 11 attacks. UMTRI Research Review, 33(3). Ann Arbor, MI: University of Michigan.
6. Reference: NASA. (2009). Earth observatory. Retrieved 13Jan10 from: http://earthobservatory.nasa.gov/Newsroom/NasaNews/ReleaseImages/20041004/04_LOMA-Prieta2.jpg7. Image source: Innovations Historia. (2010). Courses. Retrieved 29Sep10 from: http://www.innovationshistoria.se/images/Galileo%20Galilei.jpg
8. Image reference: Cameron ram-type blowout preventer. Retrieved 08Jul10 from: http://en.wikipedia.org/wiki/File:Cameron_Ram-type_Blowout_Preventer_(1922).jpg
9. Image reference: AOLNews. (2010). Oil Spill Points to Rig Fail-Safe as Utter Failure. Retrieved 08Jul10 from: http://www.aolnews.com/nation/article/oil-spill-debacle-points-to-rig-blowout-preventer-as-utter-failure/1946100910. Barstow, D., Dodd, L., Glanz, J., Saul, S., Urbina, I. (2010). Regulators failed to address risks in oil rig fail-safe device. The New Y k Ti R t i d 08J l10 f htt // ti /2010/06/21/ /21bl t ht l? 1&hYork Times. Retrieved 08Jul10 from: http://www.nytimes.com/2010/06/21/us/21blowout.html?_r=1&hp 11. Cleveland, C.J. (2010). Deepwater horizon oil spill. The Encyclopedia of Earth. Retrieved 08Jul10 from: http://www.eoearth.org/article/Deepwater_Horizon_oil_spill12. Reference: Jet Propulsion Laboratory. (2010). Mars climate orbiter fact sheet. Retrieved from: http://mars.jpl.nasa.gov/3D/stereo-spacecraft.html13. Image source: NASA. (2010). Scanning Raman LIDAR. NASA Goddard Space Flight Center. Retrieved from:
slide 3715-Nov-10
http://ramanlidar.gsfc.nasa.gov/instruments/scanning%20raman%20lidar/index.htm