BP-18 Transmission Rate Case Workshop
33
BP-18 Transmission Rates Workshop May 6, 2016 (Updated May 25, 2016)
Transcript of BP-18 Transmission Rate Case Workshop

BP-18 Transmission Rates Workshop
May 6, 2016 (Updated May 25, 2016)
B O N N E V I L L E P O W E R A D M I N I S T R A T I O N
• Load Forecasting • Planning the Transmission System • Rate Case Implications of Load Forecast • Segmentation
Agenda
2 May 6, 2016 Pre-Decisional. For Discussion Purposes Only

Load Forecasting

B O N N E V I L L E P O W E R A D M I N I S T R A T I O N
Transmission Peak Types (graph referenced throughout the presentation)
4 May 6, 2016 Pre-Decisional. For Discussion Purposes Only

B O N N E V I L L E P O W E R A D M I N I S T R A T I O N
• What does Coincident Peak (CP) load mean? – Generally, coincident peak is a measure of load at the same time
(coincident) that another measure is highest. – For Rate purposes, a customer’s CP load is the sum of the customer’s
individual meters, integrated over the hour of the FCRTS Monthly Transmission System Peak Load. (point D on graph)
• What is the Monthly Transmission System Peak Load? – The peak load on the Federal Columbia River Transmission System
(FCRTS) during the designated billing month, determined by the largest hourly integrated demand produced from the sum of the Federal and non-Federal generating plants in BPA’s Control Area and net metered flow into BPA’s Control Area (aka Total Transmission System Load or TTSL). (red vertical line on graph)
• What does Non-Coincident Peak (NCP) load mean? – For Rate purposes, any method that looks at customer metered load at a
time other than (non-coincidental with) the Monthly Transmission System Peak Load. (any of points A, B, C’s, E)
Terminology – Keeping All the Terms Straight
5 May 6, 2016 Pre-Decisional. For Discussion Purposes Only
B O N N E V I L L E P O W E R A D M I N I S T R A T I O N
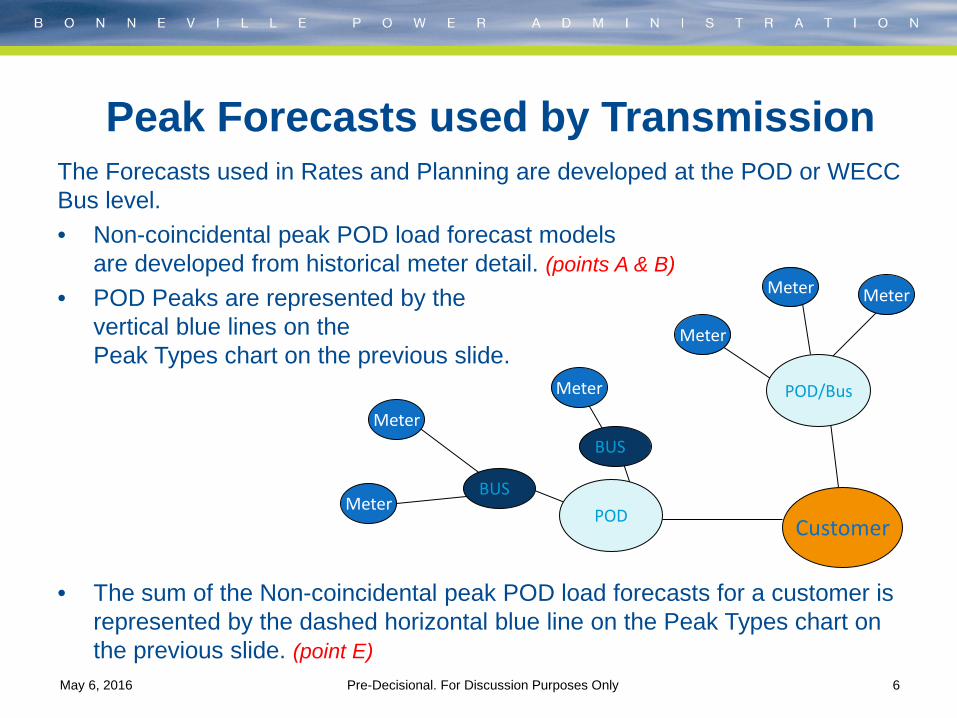
Peak Forecasts used by Transmission The Forecasts used in Rates and Planning are developed at the POD or WECC Bus level. • Non-coincidental peak POD load forecast models
are developed from historical meter detail. (points A & B) • POD Peaks are represented by the
vertical blue lines on the Peak Types chart on the previous slide.
• The sum of the Non-coincidental peak POD load forecasts for a customer is represented by the dashed horizontal blue line on the Peak Types chart on the previous slide. (point E)
Meter POD Customer
Meter
Meter
Meter
Meter Meter
POD/Bus
BUS
BUS
6 May 6, 2016 Pre-Decisional. For Discussion Purposes Only

B O N N E V I L L E P O W E R A D M I N I S T R A T I O N
Peak Forecasts used by Transmission, continued
• Each Non-coincidental POD forecast is scaled to reflect the POD load at the time of the Customer Peak as represented by the points where the POD load crosses the vertical black line on the chart. (points C1 and C2)
– The sum of these POD loads for a customer is the Non-coincident Customer Peak (point C)
• Each Non-coincidental POD forecast is also scaled to reflect the POD load at the time of the Transmission System Peak Load as represented by the points where the POD load crosses the vertical red line on the chart. (points D1 and D2) – The sum of these POD loads for a customer is the Customer
Peak coincident with the transmission system peak (CP). (point D)
7 May 6, 2016 Pre-Decisional. For Discussion Purposes Only

B O N N E V I L L E P O W E R A D M I N I S T R A T I O N
Overarching Forecast Assumptions • Normal weather conditions exist
– 34 year average value • Continuation of trends with known changes
– Known changes identified through customer visits • Numerous elements are forecasted from the same
assumptions – kWh – customer peak – GSP – TSP – CA peak – Etc.
8 May 6, 2016 Pre-Decisional. For Discussion Purposes Only

B O N N E V I L L E P O W E R A D M I N I S T R A T I O N
Load Forecasting Process • Forecasts developed within the Agency Load Forecasting
tool (ALF) • Updates prepared annually • Each customer/POD/Bus element is individually
forecasted – Statistical based regression models using up to 10 years of
historical data – All Energy models are independent models – Non-coincidental customer peak and POD non-coincidental
peaks each have their own independent model (points A, B, C)
– Customer non-coincidental POD peaks and all Coincidental peaks are dependent on Customer non-coincident peak model using historical factors (points C1, C2, D1, D2, D)
9 May 6, 2016 Pre-Decisional. For Discussion Purposes Only

B O N N E V I L L E P O W E R A D M I N I S T R A T I O N
Load Forecasting Process, continued • Preliminary forecast reviewed by Customer, and other
interested parties – Regional economic conditions
• Migration patterns • Individual industrial plant activity • Changing consumer behavior
– Demographic conditions • Birth and Death Rates • Age and Gender
– Off trend growth is added to trend – Off trend examples
• New large industrial or commercial loads • New large subdivision additions
10 May 6, 2016 Pre-Decisional. For Discussion Purposes Only

Planning the Transmission System

B O N N E V I L L E P O W E R A D M I N I S T R A T I O N
• BPA does not use the Monthly Transmission System Peak Load in planning the system. (points D, D1, D2)
– Because there is diversity in the timing when constraints occur across the system, BPA does not determine system reinforcements by a single snapshot of system usage as indicated by a Monthly Transmission Peak Load.
• The system is planned for Non-Coincidental Peak loads. – BPA Transmission Planning considers the maximum load (by season) on
individual PODs for each customer (Comparable to points A, B). Transmission Planning refers to this as a Customer’s Non-Coincidental Peak Load. (Comparable to line E)
– Transmission Planning may also consider the maximum load for the sum of the customer’s PODs during the month. Planning refers to this as a Customer’s Coincidental Peak Load. (Comparable to points C)
– While Transmission Planning may consider the Customer’s Coincidental Peak Load along with the Customer’s Non-Coincidental Peak Load, any of the loads BPA uses for planning the system are still Non-Coincidental Peak (NCP) loads relative to the Monthly Transmission System Peak Load.
Load Forecasts used in Planning the Transmission System
12 May 6, 2016 Pre-Decisional. For Discussion Purposes Only
B O N N E V I L L E P O W E R A D M I N I S T R A T I O N
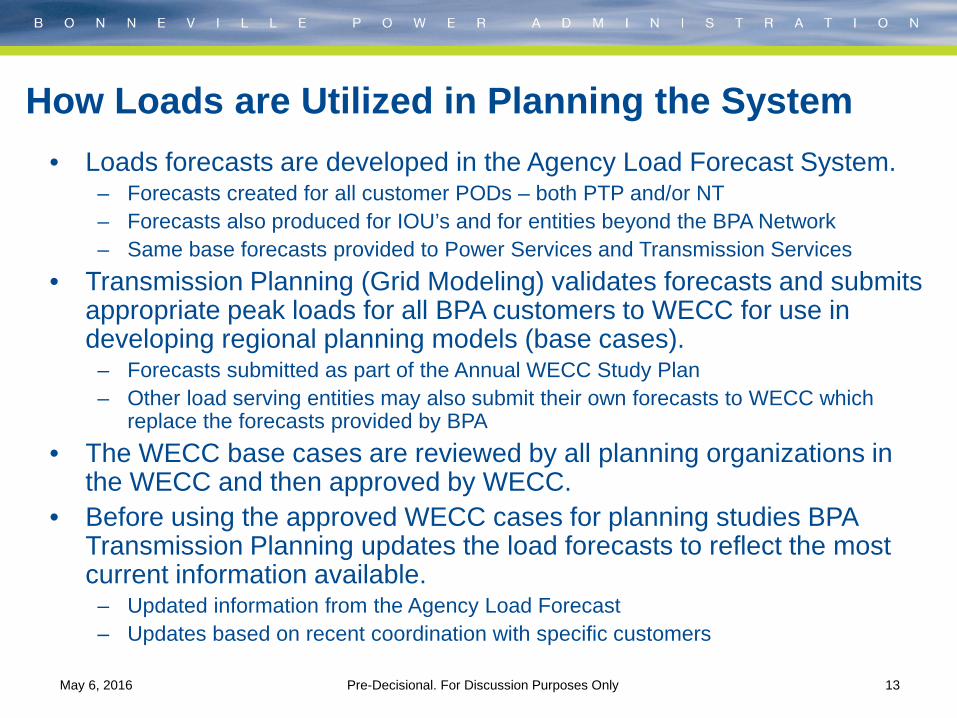
• Loads forecasts are developed in the Agency Load Forecast System. – Forecasts created for all customer PODs – both PTP and/or NT – Forecasts also produced for IOU’s and for entities beyond the BPA Network – Same base forecasts provided to Power Services and Transmission Services
• Transmission Planning (Grid Modeling) validates forecasts and submits appropriate peak loads for all BPA customers to WECC for use in developing regional planning models (base cases).
– Forecasts submitted as part of the Annual WECC Study Plan – Other load serving entities may also submit their own forecasts to WECC which
replace the forecasts provided by BPA • The WECC base cases are reviewed by all planning organizations in
the WECC and then approved by WECC. • Before using the approved WECC cases for planning studies BPA
Transmission Planning updates the load forecasts to reflect the most current information available.
– Updated information from the Agency Load Forecast – Updates based on recent coordination with specific customers
How Loads are Utilized in Planning the System
13 May 6, 2016 Pre-Decisional. For Discussion Purposes Only

B O N N E V I L L E P O W E R A D M I N I S T R A T I O N
• WECC Base Cases are developed on an annual basis (examples based on 2016 calendar year development)
– Typical Operating Base Cases (developed Spring time frame) • Upcoming year Heavy Winter (e.g. 2016/2017 winter) • Upcoming year Light Winter (e.g. 2016/2017 winter) • Following year Heavy Spring (e.g. 2017 spring) • Following year Heavy Summer (e.g. 2017 summer) • Following year Light Summer (e.g. 2017 summer)
– Five-year Base Cases (developed Summer time frame) • Five to Six years out Heavy Winter (e.g. 2021/2022 winter) • Five or Six years out Heavy Summer (e.g. 2022 summer)
– Ten-year Base Cases (developed Summer time frame) • Ten to Eleven years out Heavy Winter (e.g. 2026/2027 winter) • Ten or Eleven years out Heavy Summer (e.g. 2027 winter)
– Scenario Base Cases (developed in the Autumn/Winter time frame) • As needed (e.g. 2018 Light Autumn in Northwest)
Development of WECC Base Cases
14 May 6, 2016 Pre-Decisional. For Discussion Purposes Only

B O N N E V I L L E P O W E R A D M I N I S T R A T I O N
Planning Load Forecast Data Flow
Rates
Power Services
WECC Base case
Base case Update
Transmission Planning (Studies)
Agency Load
Forecast
6 to 18 months later
Adjacent Transmission
Owners
Transmission Planning
(Grid Modeling)
15 May 6, 2016 Pre-Decisional. For Discussion Purposes Only

B O N N E V I L L E P O W E R A D M I N I S T R A T I O N
• Planning prepares study cases for two primary uses: – System assessments – Reliability Based Studies
• Generally uses Five-year and Ten-year WECC Base Cases, updated to reflect recent load forecast information
• Planning develops additional cases and scenarios designed to simulate expected utilization for twenty four Load Service Areas and seven Transfer Path Areas
• Supports identification of system reinforcement to maintain reliable operation of the system – Requested Service
• Interconnection Studies – Cases selected to assess expected utilization – five-year and ten-year cases, typically.
– Generator Interconnection – Line & Load Interconnection
• Requests for Long Term Firm Transmission Service – ATC – Use a two year case – Cluster Study – Use an out-year case (typically five-year)
In summary, the forecasts used for the two-year rate case process will never match the planning forecasts exactly due to timing and updates to the load forecasts in the planning process.
Cases Used to Plan the System
16 May 6, 2016 Pre-Decisional. For Discussion Purposes Only
Rate Case Implications of Load Forecast

B O N N E V I L L E P O W E R A D M I N I S T R A T I O N
• In BP-14 and BP-16, BPA allocated Network costs between NT and PTP using forecast reserved capacities for PTP and forecast monthly non-coincidental customer peak loads for NT as the allocation factors (12 NCP method).
• The NT non-coincidental loads used were the non-coincidental customer peaks—the sum of the POD loads on the hour of the customer peak.
• BPA uses seasonal non-coincidental peaks by POD (not by customer) and other considerations in its planning studies. – The seasonal BUS peak load representative of the POD peaks is the forecast
originally submitted by BPA for the WECC base case development. – The non-coincidental customer peak may also be considered in the WECC
base case as some customers have the ability to submit directly to WECC in the base case development process, which may include the customer peak.
• BPA staff’s leaning is to continue to use the non-coincidental customer peak • What forecast of NT non-coincidental peak loads should be used in BP18 as
the Network allocation factor for NT? – Customer peaks – POD peaks
18 May 6, 2016 Pre-Decisional. For Discussion Purposes Only
Relationship of Peak load forecasts to Network Cost Allocation

Segmentation Overview

B O N N E V I L L E P O W E R A D M I N I S T R A T I O N
• Segmentation is a categorization of BPA’s transmission assets into groups (called segments) to develop allocation factors based on gross investment and historical operations and maintenance (O&M) expenses. These allocation factors are then used to assign the total transmission revenue requirement to the various segments. This results in the segmented revenue requirement that is used to calculate transmission rates.
20
What is Segmentation?
Segments Corresponding Rates Network PTP, NT, IR, FPT
Utility Delivery UDC
DSI Delivery UFT
Southern Intertie IS
Eastern Intertie IE, IM, TGT
Generation-Integration Assigned to power rates
Ancillary Services ACS
May 6, 2016 Pre-Decisional. For Discussion Purposes Only
B O N N E V I L L E P O W E R A D M I N I S T R A T I O N
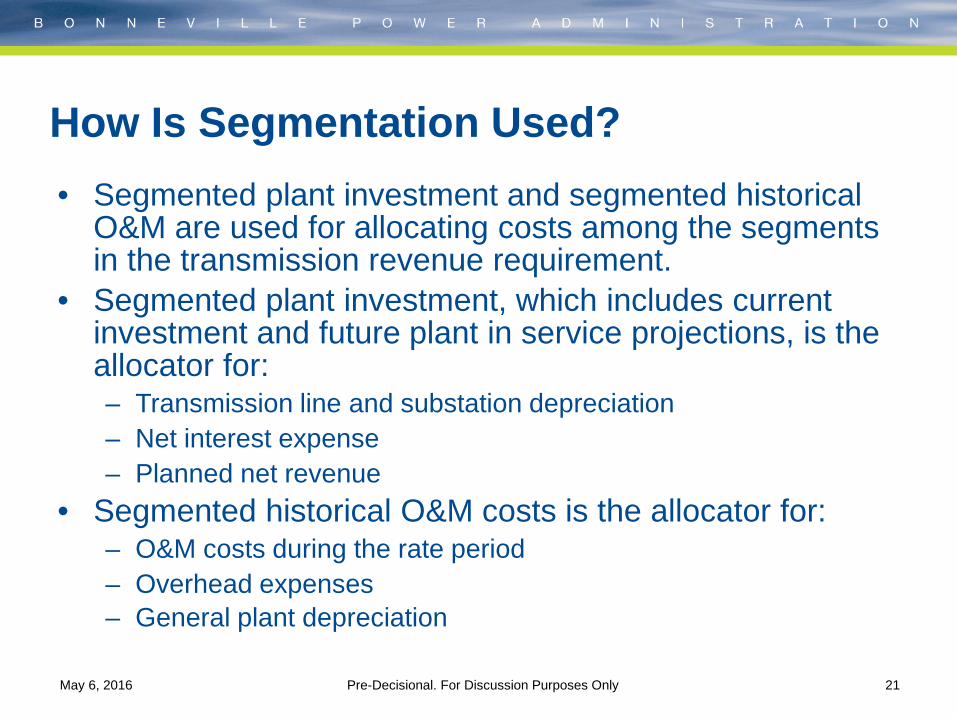
• Segmented plant investment and segmented historical O&M are used for allocating costs among the segments in the transmission revenue requirement.
• Segmented plant investment, which includes current investment and future plant in service projections, is the allocator for: – Transmission line and substation depreciation – Net interest expense – Planned net revenue
• Segmented historical O&M costs is the allocator for: – O&M costs during the rate period – Overhead expenses – General plant depreciation
21
How Is Segmentation Used?
May 6, 2016 Pre-Decisional. For Discussion Purposes Only
B O N N E V I L L E P O W E R A D M I N I S T R A T I O N
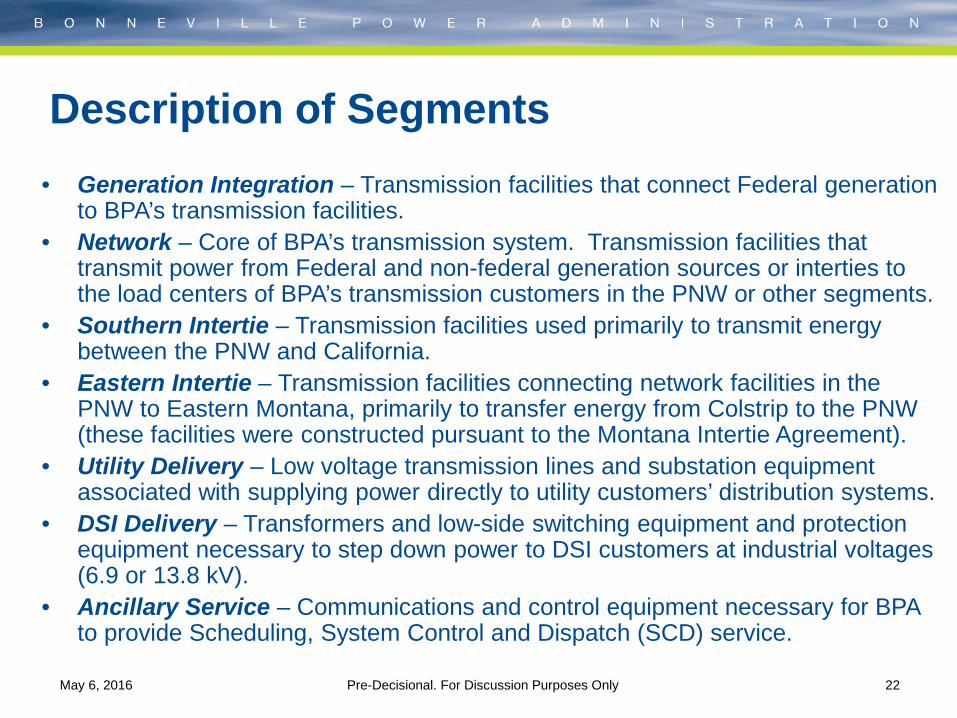
• Generation Integration – Transmission facilities that connect Federal generation to BPA’s transmission facilities.
• Network – Core of BPA’s transmission system. Transmission facilities that transmit power from Federal and non-federal generation sources or interties to the load centers of BPA’s transmission customers in the PNW or other segments.
• Southern Intertie – Transmission facilities used primarily to transmit energy between the PNW and California.
• Eastern Intertie – Transmission facilities connecting network facilities in the PNW to Eastern Montana, primarily to transfer energy from Colstrip to the PNW (these facilities were constructed pursuant to the Montana Intertie Agreement).
• Utility Delivery – Low voltage transmission lines and substation equipment associated with supplying power directly to utility customers’ distribution systems.
• DSI Delivery – Transformers and low-side switching equipment and protection equipment necessary to step down power to DSI customers at industrial voltages (6.9 or 13.8 kV).
• Ancillary Service – Communications and control equipment necessary for BPA to provide Scheduling, System Control and Dispatch (SCD) service.
22
Description of Segments
May 6, 2016 Pre-Decisional. For Discussion Purposes Only
B O N N E V I L L E P O W E R A D M I N I S T R A T I O N
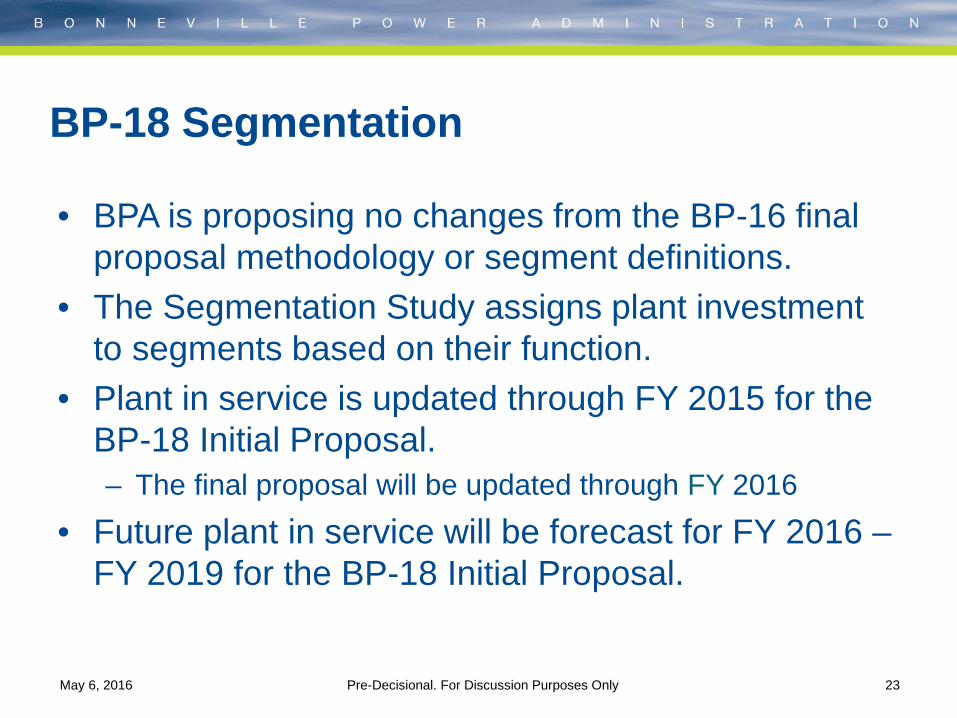
• BPA is proposing no changes from the BP-16 final proposal methodology or segment definitions.
• The Segmentation Study assigns plant investment to segments based on their function.
• Plant in service is updated through FY 2015 for the BP-18 Initial Proposal. – The final proposal will be updated through FY 2016
• Future plant in service will be forecast for FY 2016 – FY 2019 for the BP-18 Initial Proposal.
BP-18 Segmentation
23 May 6, 2016 Pre-Decisional. For Discussion Purposes Only

B O N N E V I L L E P O W E R A D M I N I S T R A T I O N
24
Segmented Lines and Substations Investment
($000)
A B C D E F G H I
Generation Integration Network
Southern Intertie
Eastern Intertie
Utility Delivery DSI Delivery
Segmented Total
Ancillary Services
1 Stations 81,760 2,678,554 636,189 23,289 11,304 10,331 3,441,428 2 Lines 17,992 2,663,166 199,264 94,891 170 - 2,975,484 3 Sub Total 99,752 5,341,721 835,453 118,181 11,474 10,331 6,416,911 147,353 4 % of Total 1.6% 83.2% 13.0% 1.8% 0.2% 0.2%
5 Stations 86,336 2,851,872 638,530 28,121 11,353 10,362 3,626,573 6 Lines 18,321 2,775,689 200,359 94,906 170 - 3,089,444 7 Sub Total 104,656 5,627,560 838,890 123,026 11,523 10,362 6,716,017 164,586 8 % of Total 1.6% 83.8% 12.5% 1.8% 0.2% 0.2%
Plant Investment Through September 30, 2014 (BP-16 Final Proposal)
Plant Investment Through September 30, 2015 (BP-18 Draft Initial Proposal)
May 6, 2016 Pre-Decisional. For Discussion Purposes Only

B O N N E V I L L E P O W E R A D M I N I S T R A T I O N
25
Future Plant in Service ($000)
This table is from Final Proposal BP-16. Updated forecasts for FY 2016 – FY 2019 will be shared in July and finalized after the CIR/IPR concludes this summer.
May 6, 2016 Pre-Decisional. For Discussion Purposes Only
A B C D E F G H
Generation Integration Network
Southern Intertie
Eastern Intertie
Utility Delivery DSI Delivery Total
Stations1 FY 2015 - 185,004 26,797 208 54 - 212,0642 FY 2016 - 241,608 23,593 91 63 - 265,3553 FY 2017 - 177,918 288,417 87 46 - 466,468
Lines4 FY 2015 - 147,123 1,762 - - - 148,8865 FY 2016 - 182,584 1,754 - - - 184,3396 FY 2017 - 129,702 34,336 - - - 164,038
Lines & Subs7 FY 2015 - 332,127 28,560 208 54 - 360,9508 FY 2016 - 424,192 25,347 91 63 - 449,6949 FY 2017 - 307,620 322,753 87 46 - 630,506
OtherAncillary Services
General Plant
10 FY 2015 52,109 116,23911 FY 2016 64,789 118,69112 FY 2017 40,038 119,561
B O N N E V I L L E P O W E R A D M I N I S T R A T I O N
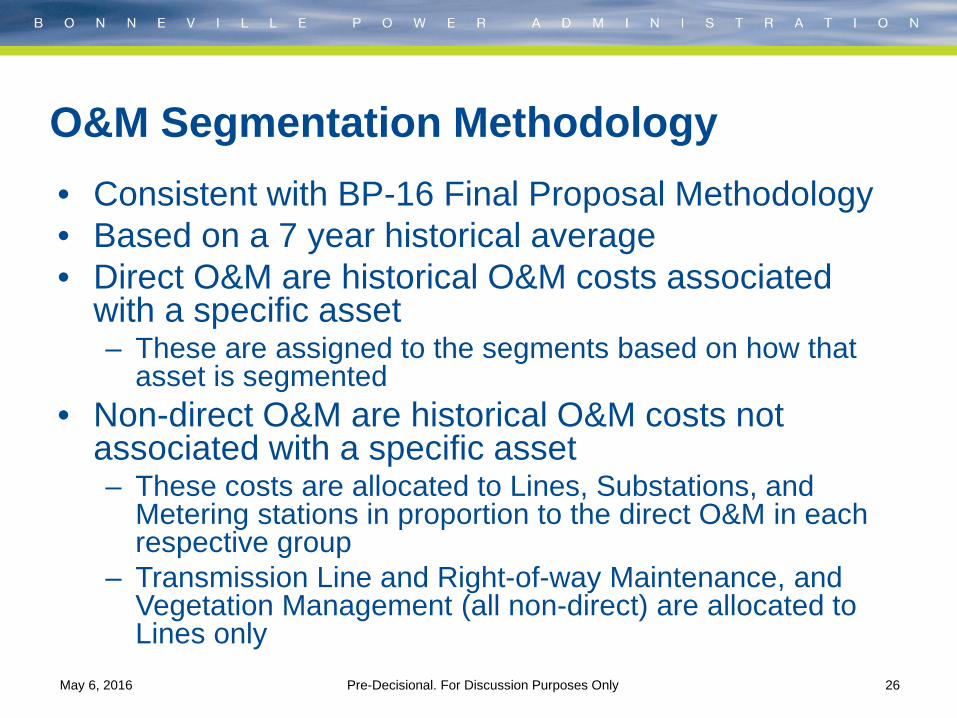
• Consistent with BP-16 Final Proposal Methodology • Based on a 7 year historical average • Direct O&M are historical O&M costs associated
with a specific asset – These are assigned to the segments based on how that
asset is segmented • Non-direct O&M are historical O&M costs not
associated with a specific asset – These costs are allocated to Lines, Substations, and
Metering stations in proportion to the direct O&M in each respective group
– Transmission Line and Right-of-way Maintenance, and Vegetation Management (all non-direct) are allocated to Lines only
26
O&M Segmentation Methodology
May 6, 2016 Pre-Decisional. For Discussion Purposes Only
B O N N E V I L L E P O W E R A D M I N I S T R A T I O N
27
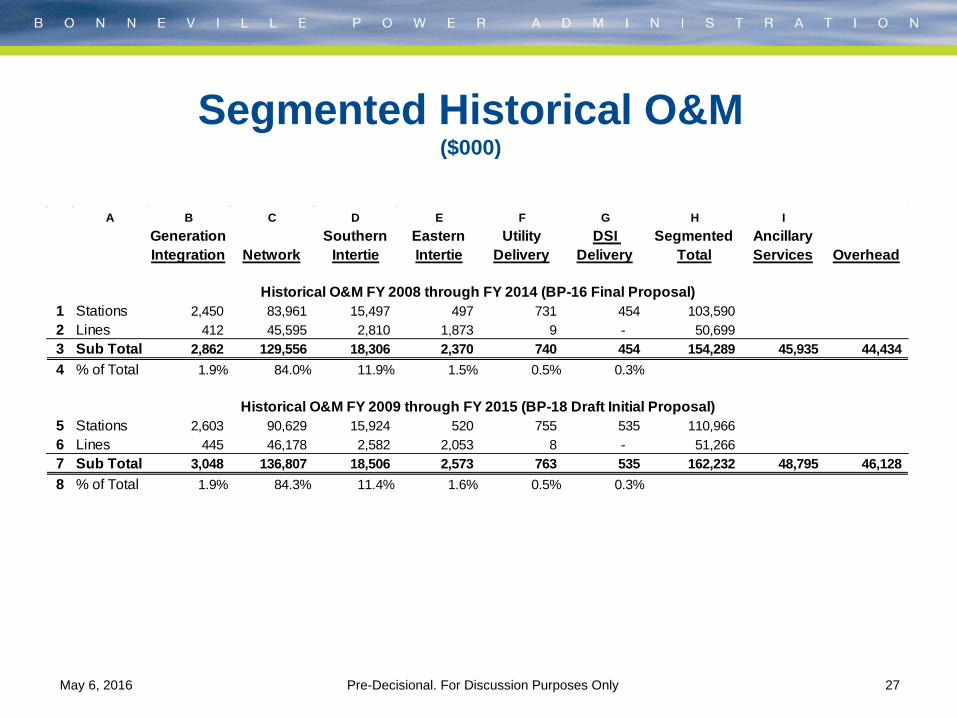
Segmented Historical O&M ($000)
A B C D E F G H IGeneration Integration Network
Southern Intertie
Eastern Intertie
Utility Delivery
DSI Delivery
Segmented Total
Ancillary Services Overhead
1 Stations 2,450 83,961 15,497 497 731 454 103,590 2 Lines 412 45,595 2,810 1,873 9 - 50,699 3 Sub Total 2,862 129,556 18,306 2,370 740 454 154,289 45,935 44,434 4 % of Total 1.9% 84.0% 11.9% 1.5% 0.5% 0.3%
5 Stations 2,603 90,629 15,924 520 755 535 110,966 6 Lines 445 46,178 2,582 2,053 8 - 51,266 7 Sub Total 3,048 136,807 18,506 2,573 763 535 162,232 48,795 46,128 8 % of Total 1.9% 84.3% 11.4% 1.6% 0.5% 0.3%
Historical O&M FY 2008 through FY 2014 (BP-16 Final Proposal)
Historical O&M FY 2009 through FY 2015 (BP-18 Draft Initial Proposal)
May 6, 2016 Pre-Decisional. For Discussion Purposes Only

B O N N E V I L L E P O W E R A D M I N I S T R A T I O N
• The next BP-18 Transmission Rates Workshop is May 24 (1:00p.m. - 4:00p.m.) – Southern Intertie HNF rate – Rate impact of the alternative load forecasts for Network cost
allocation
• By Friday, June 3 – BPA requests customer comments on which load forecast should be used for the NT cost allocation. Please send comments to [email protected] with the title “BP-18 Transmission Forecast Comments.”
• We will share the updated future plant in service in July after the IPR/CIR.
Next Steps
28 May 6, 2016 Pre-Decisional. For Discussion Purposes Only

Appendix
B O N N E V I L L E P O W E R A D M I N I S T R A T I O N
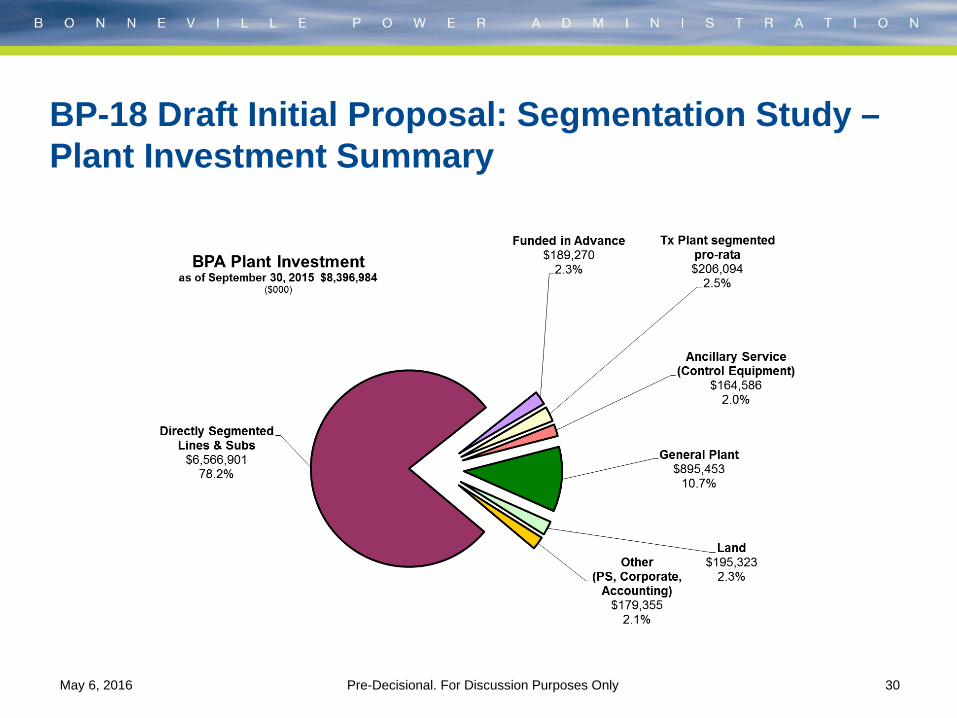
30
BP-18 Draft Initial Proposal: Segmentation Study – Plant Investment Summary
May 6, 2016 Pre-Decisional. For Discussion Purposes Only

B O N N E V I L L E P O W E R A D M I N I S T R A T I O N
Date BP-18 Rate Case Other Workshops May 10 (T) • RHWM Process
• Financial Reserves Policy May 24 (T) • Gen Inputs
• Transmission Rates o Southern Intertie HNF o Load forecast for Network cost
allocation
June 7 (T)
• Financial Reserves Policy
June 8 (W) • Transmission Rates o Segmentation
June 17 (F) • Financial Reserves Policy
Future Customer Meetings
31 May 6, 2016 Pre-Decisional. For Discussion Purposes Only.

B O N N E V I L L E P O W E R A D M I N I S T R A T I O N
Date BP-18 Rate Case Other Workshops June 29 (W) • Transmission Rates
o Southern Intertie HNF • Gen Inputs
June 28 (T) June 30 (Th)
• RHWM Process (if needed) • Small Generation Integration
Jul 13 (W) • Transmission Rates o Load Forecasting o LGIA o Sales
Jul 27 (W) • Revenue Requirement • Transmission Rates
o Southern Intertie HNF o SDD
• Gen Inputs
Future Customer Meetings, continued
32 May 6, 2016 Pre-Decisional. For Discussion Purposes Only.

B O N N E V I L L E P O W E R A D M I N I S T R A T I O N
Date BP-18 Rate Case Other Workshops Aug 9 (T) • Power Rates
o Overviews: Market Prices/Loads & Resources
o TCMS for NT Secondary o Other
• RHWM Process
Aug 10 (W) • Risk • Transmission Rates
o Rates Models o Wrap-up
Aug 24 (W) • Transmission Rates • Power Rates
Sept 7 (W) • Transmission Rates
Future Customer Meetings, continued
33 May 6, 2016 Pre-Decisional. For Discussion Purposes Only.