BOYS AND MEN OF COLOR: FRESNO COUNTY, … · BOYS AND MEN OF COLOR: FRESNO COUNTY, CALIFORNIA DATA...
36
BOYS AND MEN OF COLOR: FRESNO COUNTY, CALIFORNIA DATA CHART BOOK Alicia Gonzalez, MPH Jason Immekus, PhD Cassandra Joubert, ScD OCTOBER 2011
Transcript of BOYS AND MEN OF COLOR: FRESNO COUNTY, … · BOYS AND MEN OF COLOR: FRESNO COUNTY, CALIFORNIA DATA...
i
0.0.0.0.0.0.0.0.0.0.0.0.0.0.0.0.0.0.0.0.0.0.0.0.0.0.0.0.0.0.0.0.0.0.0.0.0.0.
BOYS AND MEN OF COLOR:
FRESNO COUNTY, CALIFORNIA DATA CHART BOOK
Alicia Gonzalez, MPH
Jason Immekus, PhD
Cassandra Joubert, ScD
OCTOBER 2011

ii
ACKNOWLEDGEMENTS
This report represents the combined efforts of the authors, the Core Planning Team (Dr. Juan Garcia, Tim Hernandez, Keith Kelly, Rey Leon, and Lue Yang) and members of the Fresno Boys and Men of Color Community-Academic Task Force. We wish to sincerely thank each of them for their dedication and contributions to this project.
COMMUNITY-ACADEMIC TASK FORCE MEMBERS
Big Brothers Big Sisters of Central California Boys & Girls Club, Huron California Health Collaborative Californians for Justice Cause4Youth, Mendota Central California Legal Services Central Valley After School Foundation Center for Multicultural Cooperation Centro La Familia Chicano Youth Center Contemplative Outreach of Central
California Education and Leadership Foundation El Concilio Encourage Tomorrow Faces of Prevention Focus Forward Fresno Barrios Unidos Fresno Center for New Americans Owens Valley Career Development Center
Pinedale Neighborhood Resource Center Planned Parenthood Male Involvement
Program Prison Moratorium Project Promesa Behavioral Health Reading and Beyond San Joaquin River Parkway Partnership San Joaquin Valley Latino Environmental Advancement and Policy (LEAP) The California Endowment Building Healthy
Communities (BHC) The Ramsay Group The Undercurrent West Hills College, Firebaugh West Valley Futbol Club, Mendota Youth Centers of America Youth Leadership Institute Fresno West Coalition for Economic
Development

iii
ABOUT THE CENTRAL CALIFORNIA CHILDREN’S INSTITUTE
The Central California Children’s Institute is dedicated to improving the lives of children and families in the San Joaquin Valley by leveraging the resources of California State University, Fresno and bringing community partners together to address regional challenges. Our mission is to promote research, policies and practices that support the well-being of children and families, using a regional children’s agenda as the guiding framework. The key functions of the Central California Children’s Institute are: • Regional Planning and Coordination; • Applied Research, Information and Data Gathering • Community Education and Outreach; • Interdisciplinary Seminars and Training; and • Policy Advocacy.
Additional information about the Central California Children’s Institute, its projects and activities, this report as well as academic and community resources may be found at www.centralcaliforniachildren.org.
AUTHORS
Alicia Gonzalez, MPH, Jason Immekus, PhD, and Cassandra Joubert, ScD
SUGGESTED CITATION
González, A., Immekus, J., Joubert, C. (2011). Boys and Men of Color: Fresno County, California Data Chart Book. Central California Children’s Institute, California State University, Fresno.
COPYRIGHT INFORMATION
Copyright © 2011 by California State University, Fresno. This report may be printed and distributed free of charge for academic or planning purposes without the written permission of the copyright holder. Citation as a source, however, is appreciated. Distribution of any portion of this material for profit is prohibited without specific permission of the copyright holder.
iv
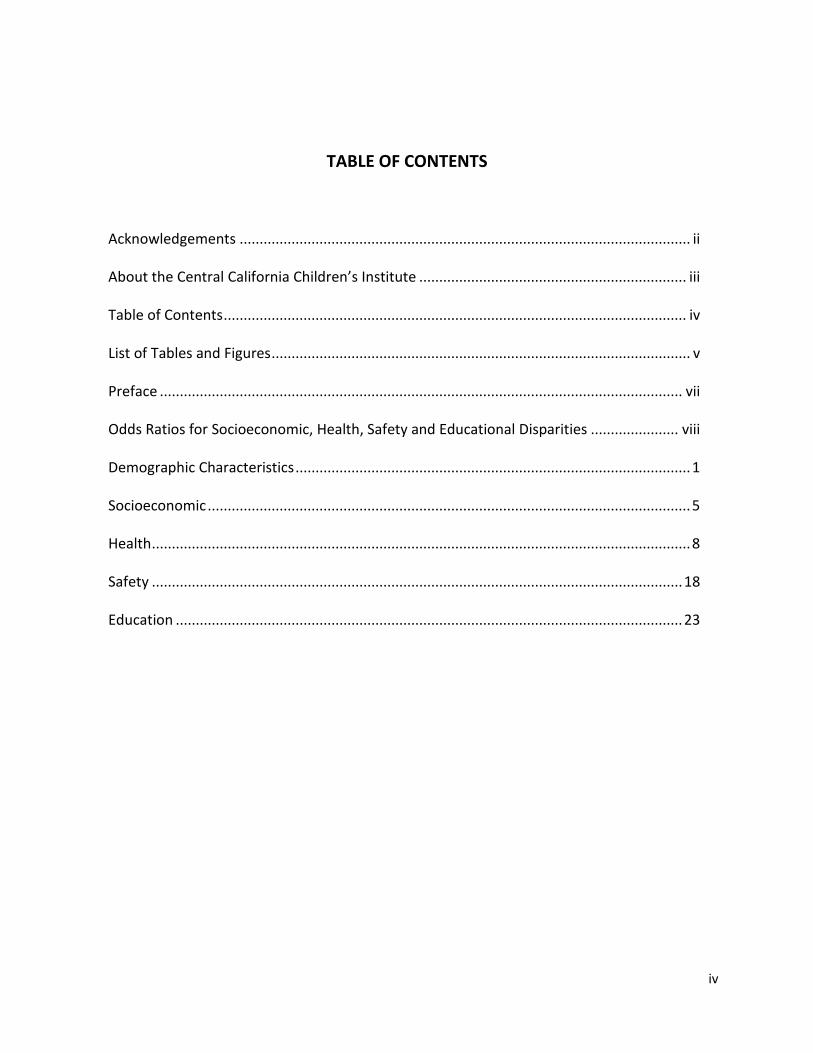
TABLE OF CONTENTS
Acknowledgements ................................................................................................................. ii
About the Central California Children’s Institute ................................................................... iii
Table of Contents .................................................................................................................... iv
List of Tables and Figures ......................................................................................................... v
Preface ................................................................................................................................... vii
Odds Ratios for Socioeconomic, Health, Safety and Educational Disparities ...................... viii
Demographic Characteristics ................................................................................................... 1
Socioeconomic ......................................................................................................................... 5
Health ....................................................................................................................................... 8
Safety ..................................................................................................................................... 18
Education ............................................................................................................................... 23

v
LIST OF TABLES & FIGURES
Table 1: Race and Ethnicity of the General Population in the U.S., California and Fresno County ........................................................................................................... 1 Table 2: Male Population Ages 5 – 24 Years Old by Race/Ethnicity ....................................... 2 Table 3: Citizenship Status for Males under Age 18 Years by Race/Ethnicity ........................ 3 Table 4: Educational Attainment for the General Population Over 25 Years Old by Race/Ethnicity ........................................................................................................... 4 Table 5: Median Household Income in Last 12 Months and Single-Parent Households by Race and Ethnicity .................................................................................................... 5 Table 6: Poverty Level and Unemployment Rate for the Male Population by Race/Ethnicity .................................................................................................................................. 7 Table 7: Usual Source of Health Care among Boys and Men Ages 6-25 Years by Race/Ethnicity........................................................................................................... 9 Table 8: Health Insurance Coverage among Boys and Men Ages 6-25 Years by Race/Ethnicity ......................................................................................................... 10 Table 9: Asthma Diagnosis and ER/Urgent Care Visits among Boys and Men Ages 6-25 Years by Race/Ethnicity ........................................................................................... 11 Table 10: Students Meeting All Fitness Standards by Gender and Grade ............................ 12 Table 11: Students Meeting All Fitness Standards by Race/Ethnicity and Grade ................ 12 Table 12: Reported Health Status among Boys and Men Ages 6-25 Years by Race/Ethnicity .............................................................................................................................. 13 Table 13: Risk for Depression and Psychological Distress among Boys and Men by Race/Ethnicity ....................................................................................................... 14 Table 14: Cumulative HIV and AIDS Cases for All Ages ......................................................... 16 Table 15: Cumulative HIV and AIDS among Adults by Race and Ethnicity ........................... 17 Table 16: Substantiated Case Rates of Child Abuse and Neglect for Boys Ages 6-17 Years by Race/Ethnicity................................................................................................... 19

vi
Table 17: Juvenile Felony Arrests for Youth by Gender, Age & Type of Felony Arrest ........ 20 Table 18: Juvenile Felony Arrests for Youth by Race/Ethnicity ............................................ 20 Table 19: Reports of Gang Membership among Males by Race/Ethnicity ........................... 21 Table 20: Reports of Gang Membership among Males by Grade ........................................ 21 Table 21: Percent of Homicide-Related Deaths among Males Ages 15-24 Years ................ 22 Table 22: Preschool, Nursery School and Head Start Enrollment for Children by Race/Ethnicity ....................................................................................................... 23 Table 23: English/Language Arts and Mathematics Proficiency Rates for Male Students in FUSD by Race/Ethnicity ........................................................................................ 24 Table 24: Educational Attainment for Males by Race/Ethnicity ........................................... 25 Table 25: High School Dropout and Suspension Rates in Fresno County and FUSD by Race/Ethnicity ....................................................................................................... 26 Table 26: 12th Grade Course Completion for Males by Race/Ethnicity in Fresno County and FUSD for UC and CSU Entrance ............................................................................ 27
FIGURES
Figure 1: Maternal Education Less than High School by Race and Ethnicity ........................ 6 Figure 2: Birth Rate Females Ages 15-19 Years by Race/Ethnicity ........................................ 8
Figure 3: STD Rates for Males by Age .................................................................................. 15 Figure 4: STD Rates for Males by Race/Ethnicity ................................................................ 15 Figure 5: Foster Care Rates for Boys Ages 6-17 Years by Race/Ethnicity ............................ 18 Figure 6: Percent of Male Deaths from Homicide (All Ages) .............................................. 22

vii
PREFACE
A 2009 study commissioned by The California Endowment (The Endowment) on racial and ethnic disparities affecting California’s boys and men of color offers compelling evidence of dispro-portionately adverse outcomes for African-American and Latino males as compared to their White counterparts. This report, “Reparable Harm: Assessing and Addressing Disparities Faced by Boys and Men of Color in California,” documents disparate outcomes for Latino and African American males in California across four domains: socioeconomics, health, safety, and education. Across the state of California, Latino and African American males are more than twice as likely as their White counterparts to live in poverty, to have a mother with less than a high school education, and to grow up in lone-parent and/or unemployed parent households. Further, boys and men of color are disproportionately affected by serious health disparities including higher rates of infant mortality, very low birth weight, childhood asthma hospitalizations, sexually transmitted diseases and HIV/AIDS. Disparities also are seen in the areas of safety and education, with Latino and African American males having greater odds of dropping out of school, going to prison, and dying of homicide. Based partly on the findings of that report, The Endowment determined that if California communities are to be healthy, the disparity in outcomes among boys and men of color must be directly addressed.
Subsequently, three communities in California were selected by The Endowment to conduct further research to determine the nature and extent of racial and ethnic disparities among boys and men of color. These communities --- Los Angeles, Oakland and Fresno --- have each collected data and/or conducted additional research to understand the local implications of these statewide findings. Utilizing various local, state and national data sources, The Data Chart Book documents disparities seen at the county level.
The table of odds ratios on the next page provides a summary snapshot of the disparities across the four domains. The tables and figures that follow in this document provide greater detail regarding the inequities faced by boys and men of color ages 6 – 25 years old in Fresno County. A companion document, “Advancing Equity for Boys and Men of Color through Policy and Systems Change in Fresno County, California” (Joubert, C., Gonzalez, J. C., Immekus, J., and Gonzalez, A., 2011) offers recommendations for change and qualitative research findings that augment the data in this chart book. The latter document is available on our website at www.centralcaliforniachildren.org.
The Central California Children’s Institute wishes to thank The Endowment for supporting
this work, Kaiser Permanente for printing and other project support, and the San Joaquin
Valley River Parkway for the generous use of their space for meetings and team-building
efforts.

viii
Odds Ratios for Socioeconomic, Health, Safety and Educational Disparities Among Boys and Men of Color
in Fresno County
INDICATOR AFRICAN AMERICANS
ASIANS LATINOS
SOCIOECONOMIC
Below Poverty Level 3.4 2.6 2.7
Maternal Education <High School Degree
2.5 3.4 8.9
HEALTH
No Usual Source of Care
7.4 n/a 6.3
Sexually Transmitted Infections*
15.2 1.1 2.8
SAFETY
In Foster Care 4.8 0.5 1.4
Homicide-Related Deaths
2.8 0.2 5.7
EDUCATION
High School Dropout 2.2 0.9 1.6
Less than High School Diploma
2.0 2.8 5.4
Odds Ratios (OR) were calculated by dividing the rate or percentage of a select indicator for boys and men of color by the rate or percentage for White boys. Indicators for which the OR met or exceeded the 2.0 threshold for either Latinos or African Americans or both relative to their White counterparts were included.
n/a: data not available
STIs*: Combined average rate per 100,000 population for chlamydia, gonorrhea and syphilis.
Interpretation Example: “The odds that African American males live in poverty are more than three times greater than the odds for White males.”

1
DEMOGRAPHIC CHARACTERISTICS
Highlights
Between 2007 and 2009, Latinos represented the second largest racial and ethnic group in the U.S. and California.
In Fresno County, Latinos were the predominant racial and ethnic group between 2007 and 2009, at nearly 50% of the county’s population.
Table 1 Race and Ethnicity of the General Population in the U.S., California and Fresno County
General Population
African Americans Asians Latinos Whites Other* Total
U.S. Population Total 36,813,245 13,350,880 46,930,522 198,909,781 8,316,037 304,320,465 (12.10%) (4.40%) (15.40%) (65.30%) (2.80%) (100.0%)
CA Population Total 2,165,954 4,485,274 13,373,152 15,366,995 1,198,012 36,589,387 (5.90%) (12.30%) (36.50%) (42.00%) (3.30%) (100.0%)
Fresno County Population Total
43,964 78,545 439,346 315,240 25,668 902,763
(4.90%) (8.70%) (48.70%) (34.90%) (2.80%) (100.0%) Source: U.S. Census Bureau, 2007-2009 American Community Survey, 3-Year Estimates. *Other includes Some other race and two or more Races.
Race and Ethnicity
Defined as the total number and percent of the population by race and ethnicity at the national, state and county levels.

2
Highlights
Between 2007 and 2009, almost 60% of the young men and boys between the ages of 5 and 24 years in Fresno County were Latino.
Table 2 Male Population Ages 5 – 24 Years Old by Race/Ethnicity
African Americans Asians Latinos Whites Other
Total Male Population
8,897 (5.9%)
14,779 (9.8%)
84,882 (56.6%)
37,018 (24.7%)
4,510 (3.0%)
150,086 (100.0%)
Source: U.S. Census Bureau, 2007-2009 American Community Survey, 3-Year Estimates According to U.S. Census Bureau: Other includes Some Other Race and Two or More Races. Asian is a person having origins in any of the original peoples of the Far East, Southeast Asia, or the Indian subcontinent including, for example, Cambodia, China, India, Japan, Korea, Malaysia, Pakistan, the Philippine Islands, Thailand, and Vietnam. It includes people who indicate their race as "Asian Indian," "Chinese," "Filipino," "Korean," "Japanese," "Vietnamese," and "Other Asian" or provide other detailed Asian responses.
Male Population
Defined as the total number and percent distribution of males in Fresno County.
3
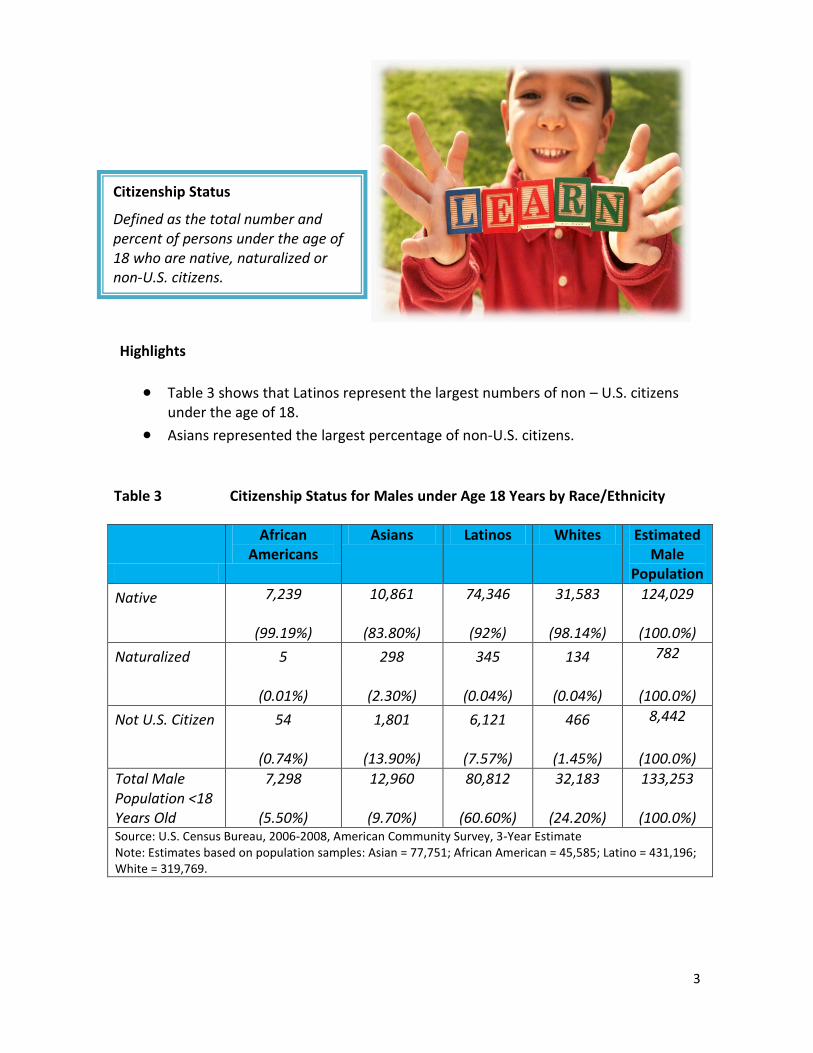
Highlights
Table 3 shows that Latinos represent the largest numbers of non – U.S. citizens under the age of 18.
Asians represented the largest percentage of non-U.S. citizens.
Table 3 Citizenship Status for Males under Age 18 Years by Race/Ethnicity
African Americans
Asians Latinos Whites Estimated Male
Population
Native 7,239 10,861 74,346 31,583 124,029
(100.0%) (99.19%) (83.80%) (92%) (98.14%)
Naturalized 5 298 345 134 782
(0.01%) (2.30%) (0.04%) (0.04%)
(100.0%)
Not U.S. Citizen 54 1,801 6,121 466 8,442
(0.74%) (13.90%) (7.57%) (1.45%)
(100.0%)
Total Male Population <18 Years Old
7,298
(5.50%)
12,960
(9.70%)
80,812
(60.60%)
32,183
(24.20%)
133,253
(100.0%) Source: U.S. Census Bureau, 2006-2008, American Community Survey, 3-Year Estimate Note: Estimates based on population samples: Asian = 77,751; African American = 45,585; Latino = 431,196; White = 319,769.
Citizenship Status
Defined as the total number and percent of persons under the age of 18 who are native, naturalized or non-U.S. citizens.
4
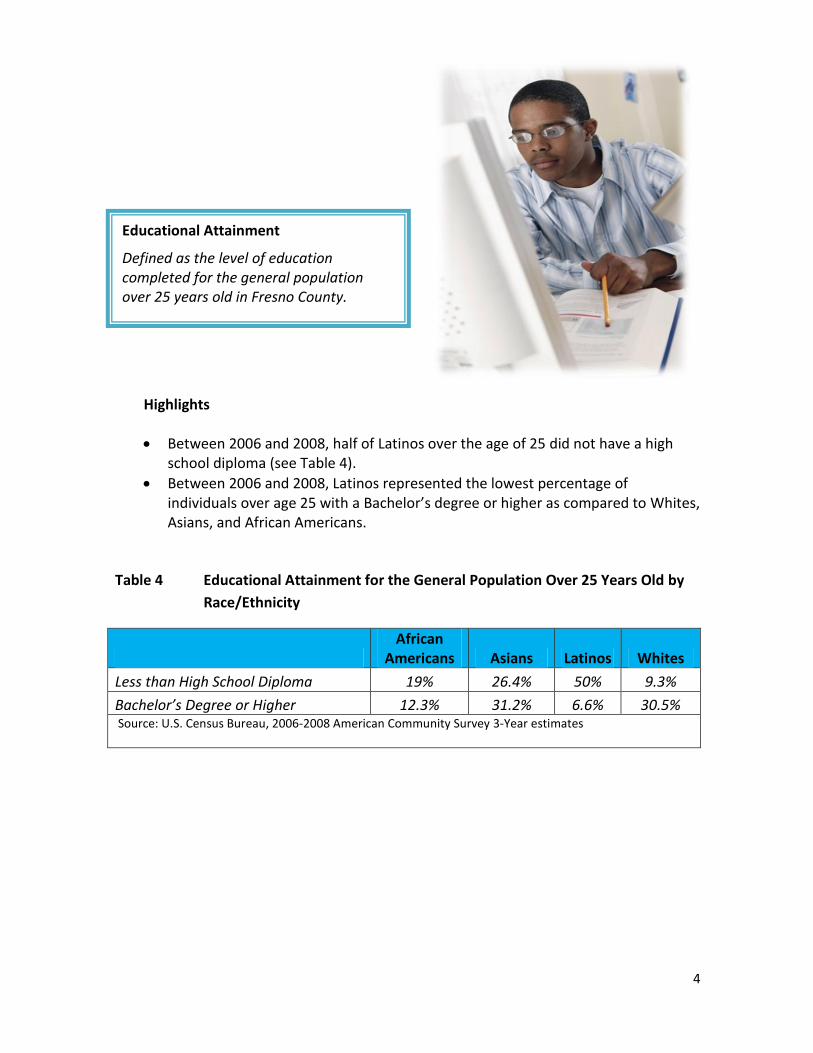
Highlights
Between 2006 and 2008, half of Latinos over the age of 25 did not have a high school diploma (see Table 4).
Between 2006 and 2008, Latinos represented the lowest percentage of individuals over age 25 with a Bachelor’s degree or higher as compared to Whites, Asians, and African Americans.
Table 4 Educational Attainment for the General Population Over 25 Years Old by
Race/Ethnicity
African
Americans Asians Latinos Whites
Less than High School Diploma 19% 26.4% 50% 9.3%
Bachelor’s Degree or Higher 12.3% 31.2% 6.6% 30.5% Source: U.S. Census Bureau, 2006-2008 American Community Survey 3-Year estimates
Educational Attainment
Defined as the level of education completed for the general population over 25 years old in Fresno County.
5
SOCIOECONOMIC
Highlights
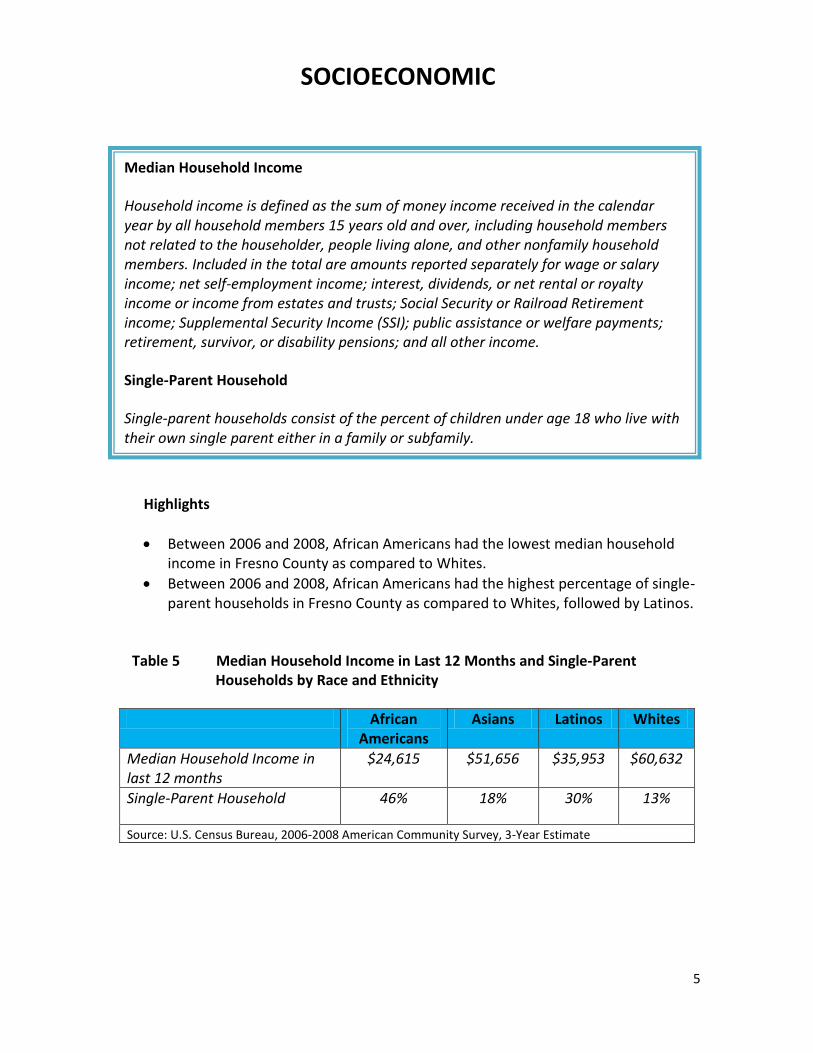
Between 2006 and 2008, African Americans had the lowest median household income in Fresno County as compared to Whites.
Between 2006 and 2008, African Americans had the highest percentage of single-parent households in Fresno County as compared to Whites, followed by Latinos.
Table 5 Median Household Income in Last 12 Months and Single-Parent Households by Race and Ethnicity
African Americans
Asians Latinos Whites
Median Household Income in last 12 months
$24,615 $51,656 $35,953 $60,632
Single-Parent Household 46% 18% 30% 13%
Source: U.S. Census Bureau, 2006-2008 American Community Survey, 3-Year Estimate
Median Household Income
Household income is defined as the sum of money income received in the calendar year by all household members 15 years old and over, including household members not related to the householder, people living alone, and other nonfamily household members. Included in the total are amounts reported separately for wage or salary income; net self-employment income; interest, dividends, or net rental or royalty income or income from estates and trusts; Social Security or Railroad Retirement income; Supplemental Security Income (SSI); public assistance or welfare payments; retirement, survivor, or disability pensions; and all other income.
Single-Parent Household
Single-parent households consist of the percent of children under age 18 who live with their own single parent either in a family or subfamily.

6
Highlights
Between 2002 and 2004, Latino mothers were least likely to have a high school education.
Figure 1 Maternal Education Less than High School by Race and Ethnicity
10.40% 14%
36.40%
4.10%
0.00%
20.00%
40.00%
60.00%
80.00%
100.00%
African Americans Asians Latinos Whites
Source: California Department of Public Health, Birth Records, 2002-2004.
Maternal Education
Defined as the percent of mothers in Fresno County who have less than a high school education.
7
Highlights
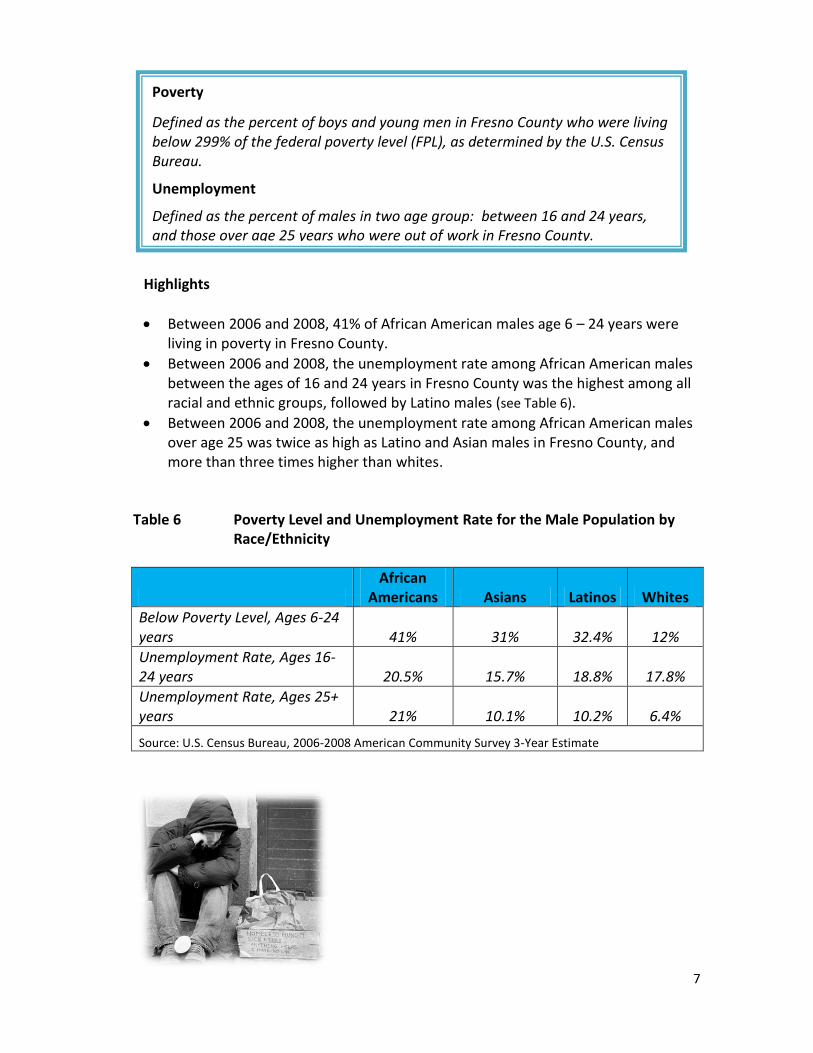
Between 2006 and 2008, 41% of African American males age 6 – 24 years were living in poverty in Fresno County.
Between 2006 and 2008, the unemployment rate among African American males between the ages of 16 and 24 years in Fresno County was the highest among all racial and ethnic groups, followed by Latino males (see Table 6).
Between 2006 and 2008, the unemployment rate among African American males over age 25 was twice as high as Latino and Asian males in Fresno County, and more than three times higher than whites.
Table 6 Poverty Level and Unemployment Rate for the Male Population by Race/Ethnicity
African
Americans Asians Latinos Whites
Below Poverty Level, Ages 6-24 years 41% 31% 32.4% 12%
Unemployment Rate, Ages 16-24 years 20.5% 15.7% 18.8% 17.8%
Unemployment Rate, Ages 25+ years 21% 10.1% 10.2% 6.4%
Source: U.S. Census Bureau, 2006-2008 American Community Survey 3-Year Estimate
Poverty
Defined as the percent of boys and young men in Fresno County who were living below 299% of the federal poverty level (FPL), as determined by the U.S. Census Bureau.
Unemployment
Defined as the percent of males in two age group: between 16 and 24 years, and those over age 25 years who were out of work in Fresno County.

8
HEALTH
Highlights
In 2007, the teen birth rate for Latinas ages 15 to 19 years in Fresno County was the highest across all racial/ethnic groups, followed closely by African Americans (see Figure 2).
Figure 2 Birth Rate for Females Ages 15-19 Years by Race/Ethnicity
71.6
36
76.6
25.4
0
10
20
30
40
50
60
70
80
90
African American Asian/Pacific Islander
Latina White
Source: www.KidsData.org, California Department of Public Health, 2007
Teen Births
Defined as the number of
births per 1,000 females
ages 15 to 19 years in Fresno
County.
9
Highlights
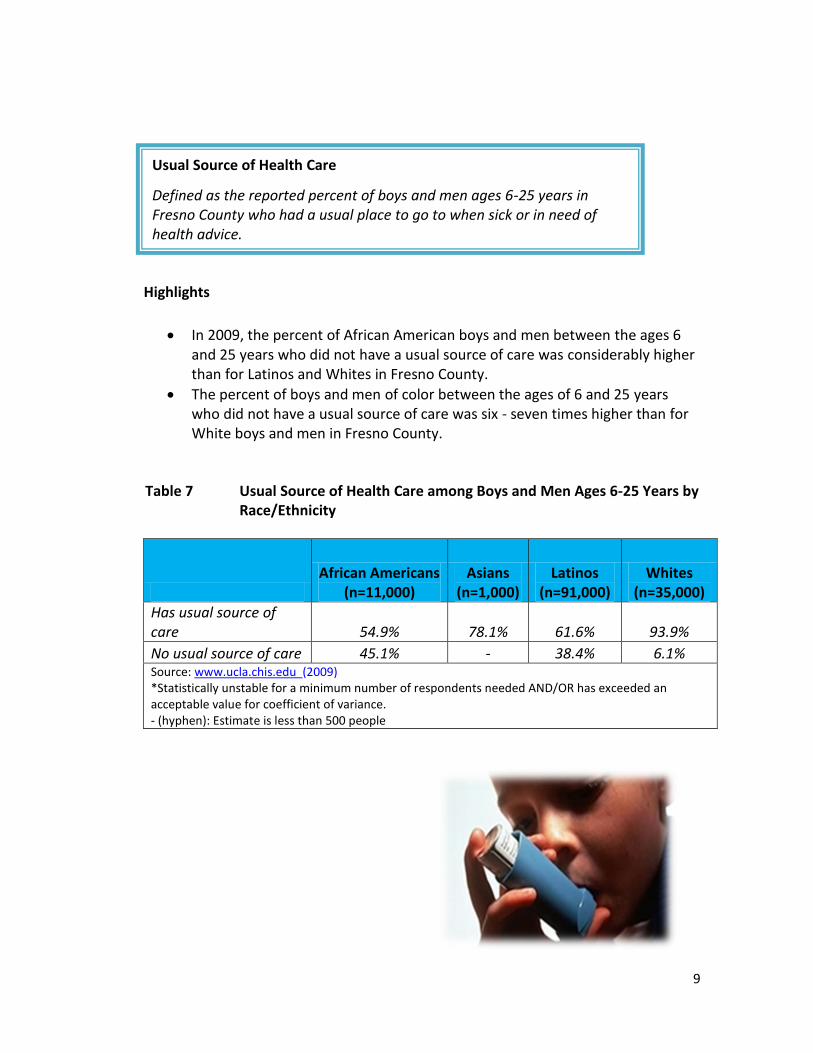
In 2009, the percent of African American boys and men between the ages 6
and 25 years who did not have a usual source of care was considerably higher than for Latinos and Whites in Fresno County.
The percent of boys and men of color between the ages of 6 and 25 years who did not have a usual source of care was six - seven times higher than for White boys and men in Fresno County.
Table 7 Usual Source of Health Care among Boys and Men Ages 6-25 Years by Race/Ethnicity
African Americans
(n=11,000) Asians
(n=1,000) Latinos
(n=91,000) Whites
(n=35,000)
Has usual source of care 54.9% 78.1% 61.6% 93.9%
No usual source of care 45.1% - 38.4% 6.1% Source: www.ucla.chis.edu (2009) *Statistically unstable for a minimum number of respondents needed AND/OR has exceeded an acceptable value for coefficient of variance. - (hyphen): Estimate is less than 500 people
Usual Source of Health Care
Defined as the reported percent of boys and men ages 6-25 years in Fresno County who had a usual place to go to when sick or in need of health advice.
10
Highlights
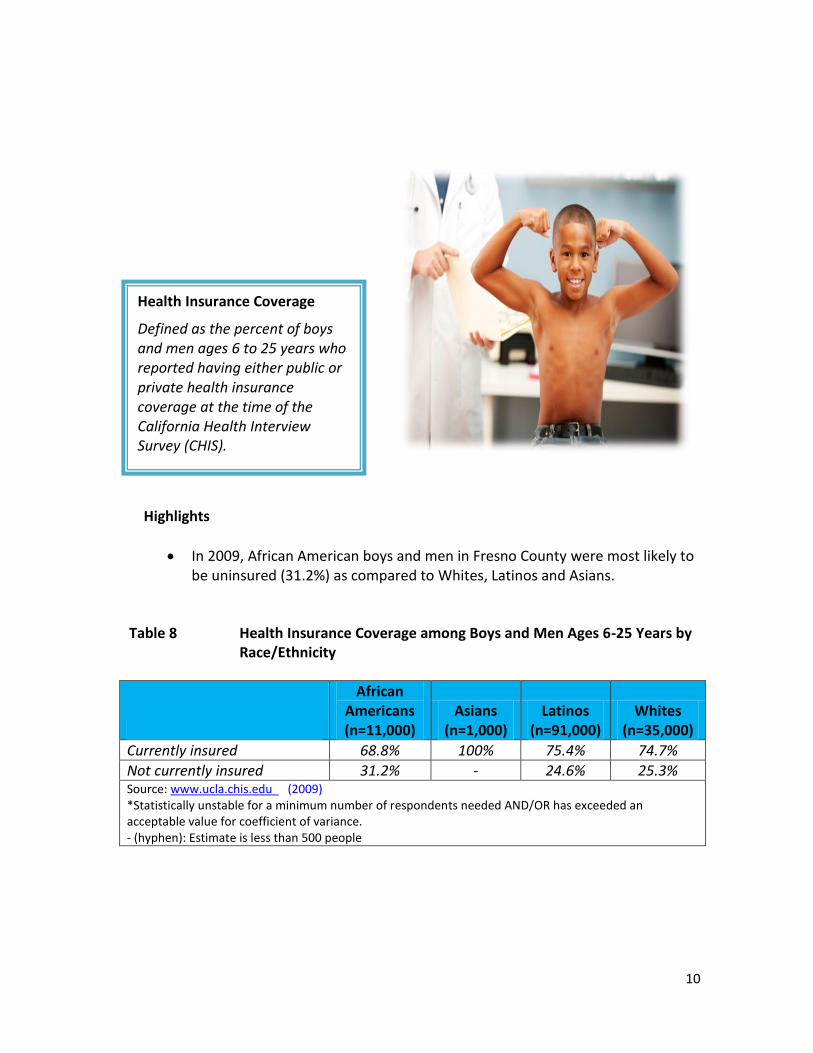
In 2009, African American boys and men in Fresno County were most likely to be uninsured (31.2%) as compared to Whites, Latinos and Asians.
Table 8 Health Insurance Coverage among Boys and Men Ages 6-25 Years by Race/Ethnicity
African Americans (n=11,000)
Asians (n=1,000)
Latinos (n=91,000)
Whites (n=35,000)
Currently insured 68.8% 100% 75.4% 74.7%
Not currently insured 31.2% - 24.6% 25.3% Source: www.ucla.chis.edu (2009) *Statistically unstable for a minimum number of respondents needed AND/OR has exceeded an acceptable value for coefficient of variance. - (hyphen): Estimate is less than 500 people
Health Insurance Coverage
Defined as the percent of boys and men ages 6 to 25 years who reported having either public or private health insurance coverage at the time of the California Health Interview Survey (CHIS).

11
Highlights
In 2009, the highest reported percentage of asthma diagnosis among boys and men ages 6 to 25 years was among African American boys and men (see Table 9).
In 2009, African Americans also had the highest percentage of reported visits to the emergency room/urgent care for asthma related problems.
Table 9 Asthma Diagnosis and ER /Urgent Care Visits among Boys and Men Ages 6-25 Years by Race/Ethnicity
Asthma Diagnosis
African Americans (n=11,000)
Asians (n=1,000)
Latinos (n=91,000)
Whites (n=35,000)
Ever Diagnosed with Asthma 62.7% 0% 18.6% 22.1%
Asthma ER Visit/Urgent Care
African Americans (n=3,000)
Asians (n=0)
Latinos (n=8,000)
Whites (n=3,000)
Visited emergency room/urgent care for asthma 79.1% n/a 0% 0% Source: www.ucla.chis.edu (2009) n/a=Data not available
Asthma
Defined as the percent of boys and men ages 6 to 25 years that in 2009 reported to have been diagnosed with asthma by a physician at any time. This indicator also represents the percent of boys and men, ages 6 to 25 years who visited the emergency room/urgent care for asthma in Fresno County.
12
Highlights
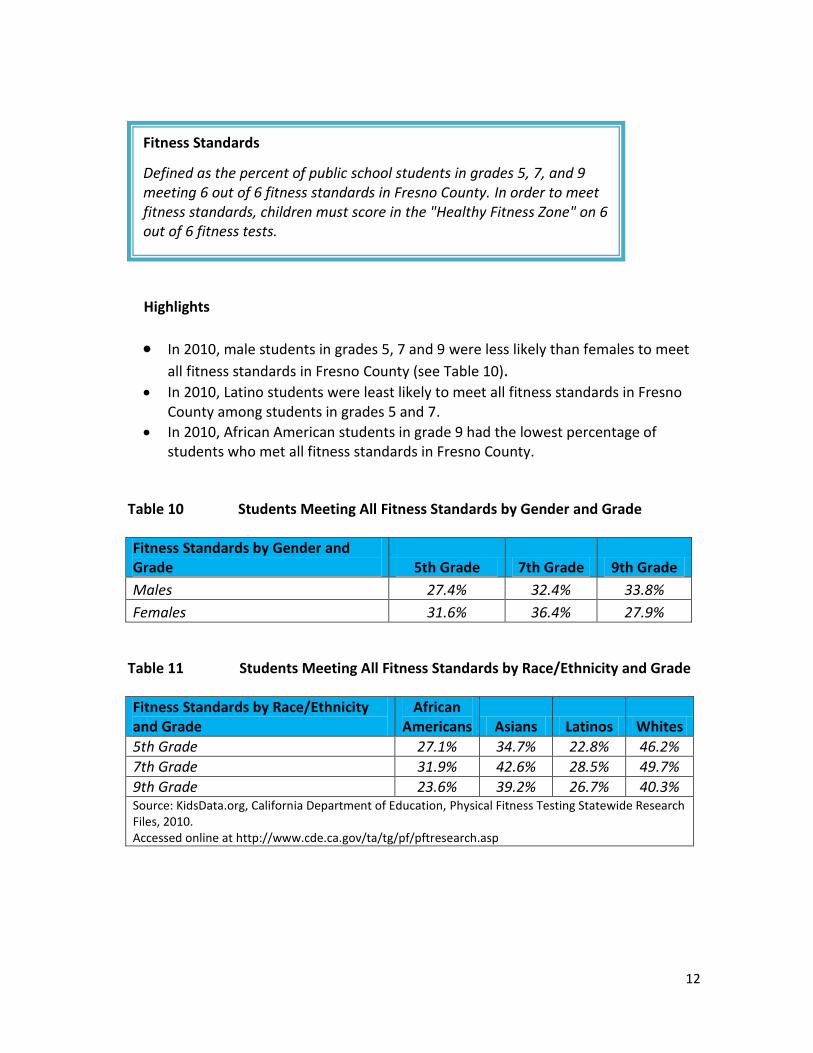
In 2010, male students in grades 5, 7 and 9 were less likely than females to meet
all fitness standards in Fresno County (see Table 10). In 2010, Latino students were least likely to meet all fitness standards in Fresno
County among students in grades 5 and 7.
In 2010, African American students in grade 9 had the lowest percentage of students who met all fitness standards in Fresno County.
Table 10 Students Meeting All Fitness Standards by Gender and Grade
Fitness Standards by Gender and Grade 5th Grade 7th Grade 9th Grade
Males 27.4% 32.4% 33.8%
Females 31.6% 36.4% 27.9%
Table 11 Students Meeting All Fitness Standards by Race/Ethnicity and Grade
Fitness Standards by Race/Ethnicity and Grade
African Americans Asians Latinos Whites
5th Grade 27.1% 34.7% 22.8% 46.2%
7th Grade 31.9% 42.6% 28.5% 49.7%
9th Grade 23.6% 39.2% 26.7% 40.3% Source: KidsData.org, California Department of Education, Physical Fitness Testing Statewide Research Files, 2010. Accessed online at http://www.cde.ca.gov/ta/tg/pf/pftresearch.asp
Fitness Standards
Defined as the percent of public school students in grades 5, 7, and 9 meeting 6 out of 6 fitness standards in Fresno County. In order to meet fitness standards, children must score in the "Healthy Fitness Zone" on 6 out of 6 fitness tests.
13
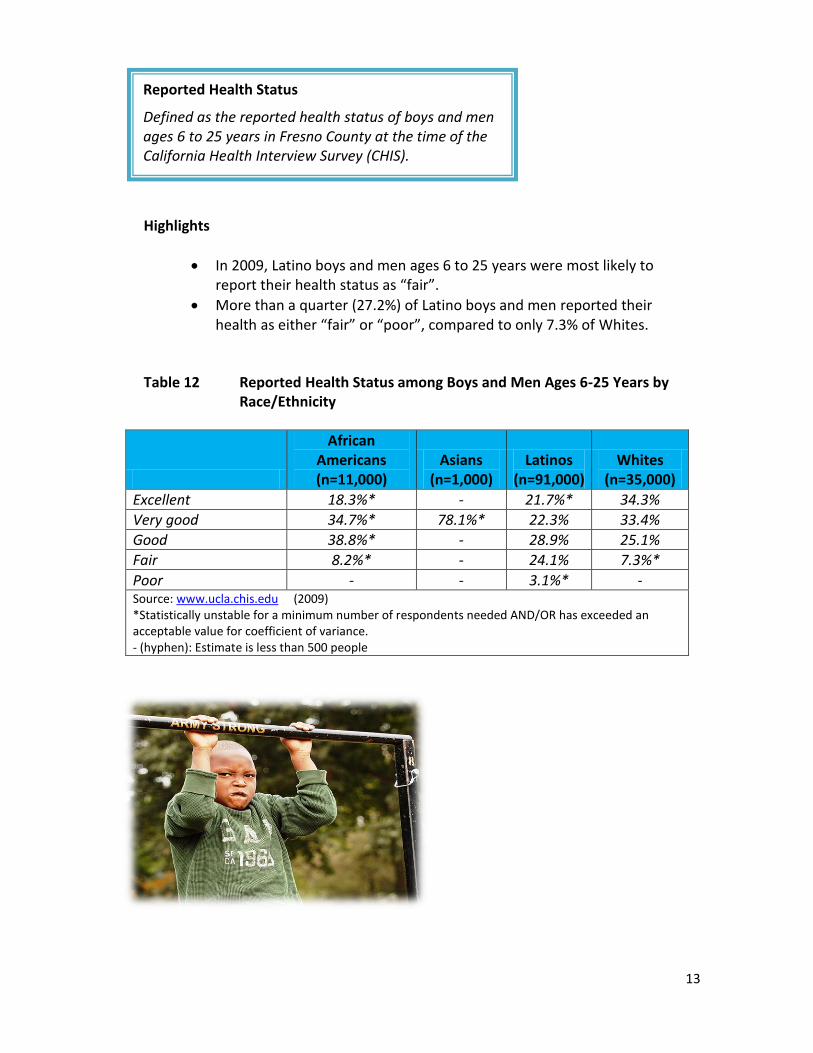
Highlights
In 2009, Latino boys and men ages 6 to 25 years were most likely to report their health status as “fair”.
More than a quarter (27.2%) of Latino boys and men reported their health as either “fair” or “poor”, compared to only 7.3% of Whites.
Table 12 Reported Health Status among Boys and Men Ages 6-25 Years by Race/Ethnicity
African Americans (n=11,000)
Asians (n=1,000)
Latinos (n=91,000)
Whites (n=35,000)
Excellent 18.3%* - 21.7%* 34.3%
Very good 34.7%* 78.1%* 22.3% 33.4%
Good 38.8%* - 28.9% 25.1%
Fair 8.2%* - 24.1% 7.3%*
Poor - - 3.1%* - Source: www.ucla.chis.edu (2009) *Statistically unstable for a minimum number of respondents needed AND/OR has exceeded an acceptable value for coefficient of variance. - (hyphen): Estimate is less than 500 people
Reported Health Status
Defined as the reported health status of boys and men ages 6 to 25 years in Fresno County at the time of the California Health Interview Survey (CHIS).

14
Highlights
In 2005, the percent of Latino boys ages 6 to 18 years who reported being at risk for depression was the highest among racial and ethnic groups.
In 2009, the percent of Latino men ages 19 to 25 years who reported that they had experienced psychological distress during the past year was the highest among all racial and ethnic groups.
Table 13 Risk for Depression and Psychological Distress among Boys and Men by Race/Ethnicity
Risk for Depression African
Americans (n=0) Asians
(n=1,000) Latinos
(n=25,000) Whites
(n=15,000)
At Risk for Depression n/a 0% 39.9%* 0%
Not at Risk for Depression n/a 100% 60.1% 98.0%
Psychological Distress
African Americans (n=3,000)
Asians (n=1,000)
Latinos (n=39,000)
Whites (n=11,000)
Likely has had psychological distress during past year
0% 0% 4.8%* 0%
Source: www.ucla.chis.edu (2005, 2009) *Statistically unstable for a minimum number of respondents needed AND/OR has exceeded an acceptable value for coefficient of variance. n/a=Data not available
Risk for Depression and Psychological Distress
Defined as the percent of boys ages 6 to 18 years in 2005 participating in the California Health Interview Survey (CHIS) who reported being at risk for depression. This indicator also represents the percent of men, ages 19 to 25 years who reported that they had experienced psychological distress during the year prior to the CHIS.

15
Highlights
In 2009, the rates of STD infections among males ages 20-24 years in Fresno County were almost two times higher than for males ages 15-19 years.
In 2009, the rates of chlamydia infections were almost four times higher for African-American males as compared to Latinos and 14 times higher than for Whites and Asian/Pacific Islander males.
Figure 3 STD Rates for Males by Age Figure 4 STD Rates for Males by Race/Ethnicity
626.5
142.8
0
1,157
237.9
7.0
523.5
149.2
21.3
0
200
400
600
800
1000
1200
1400
Chlamydia Gonorrhea P & S Syphillis
Source:California Department of Public Health,
STD Control Branch, 2009
Ages 15-19
Ages 20-24
Ages 25-29
957.2
96.9
223.2
64.7
478.6
9.0 37.5 26.1 21.6
2.3 3.2 5 0
200
400
600
800
1000
1200
African Americans
Asians* Latinos Whites
Source: California Department of Public Health,
STD Control Branch, 2009
Chlamydia
Gonorrhea
P & S Syphillis
Sexually Transmitted Diseases
Defined as the number of males per 100,000 population ages 15 to 29 years who were diagnosed with a sexually transmitted disease (STD) in 2009 in Fresno County. This indicator also includes the distribution of males who were diagnosed with chlamydia, gonorrhea and Primary (P) & Secondary (S) Syphilis in Fresno County.

16
Highlights
As of March 2011, adolescents between the ages of 15 and 24 years in Fresno County accounted for nearly 20% of all HIV cases.
Adults ages 25 and older represented the largest proportion of reported AIDS cases.
HIV cases for adolescents and adults combined disproportionately affect Latinos in Fresno County, whereas AIDS cases are highest among Whites.
Table 14 Cumulative HIV and AIDS Cases for All Ages
HIV Cases Cases %
Pediatric Ages <15 years 4 0.9%
Adolescents Ages 15-24 years 84 18.8%
Adults Ages 25-65+ years 359 80.3%
TOTAL 447 100%
AIDS Cases
Pediatric Ages <15 years 11 0.6%
Adolescents Ages 15-24 years 94 5.2%
Adults Ages 25-65+ years 1,720 94.2%
TOTAL 1,825 100% Source: Fresno County Dept. of Public Health, reported HIV cases as of March 2011; AIDS percentages cumulative from 1983-2011. Retrieved from: http://www.co.fresno.ca.us/DivisionPage.aspx?id=46949&terms=HIV
HIV/AIDS
Defined as the cumulative number and percent of HIV and AIDS cases for children and adults in Fresno County since 1983.

17
Table 15 Cumulative HIV and AIDS Cases among Adults by Race and Ethnicity
HIV Cases African
Americans Asians
* Latinos Whites Other
**
Ages 15-65+ years 17.2% 2.9% 44.9% 32.1% 2.9%
AIDS Cases African
Americans Asians
* Latinos Whites Other
***
Ages 15-65+ years 19.7% 1.9% 36.9% 40.7% 0.7% *Asians include: Asian, Native Hawaiian/Pacific Islander **Other includes: American Indian/Alaska Native, Multi-race ***Other includes: American Indian, Unknown Source: Fresno County Dept. of Public Health, reported HIV cases as of March 2011; AIDS percentages cumulative from 1983-2011. Retrieved from: http://www.co.fresno.ca.us/DivisionPage.aspx?id=46949&terms=HIV
18
SAFETY
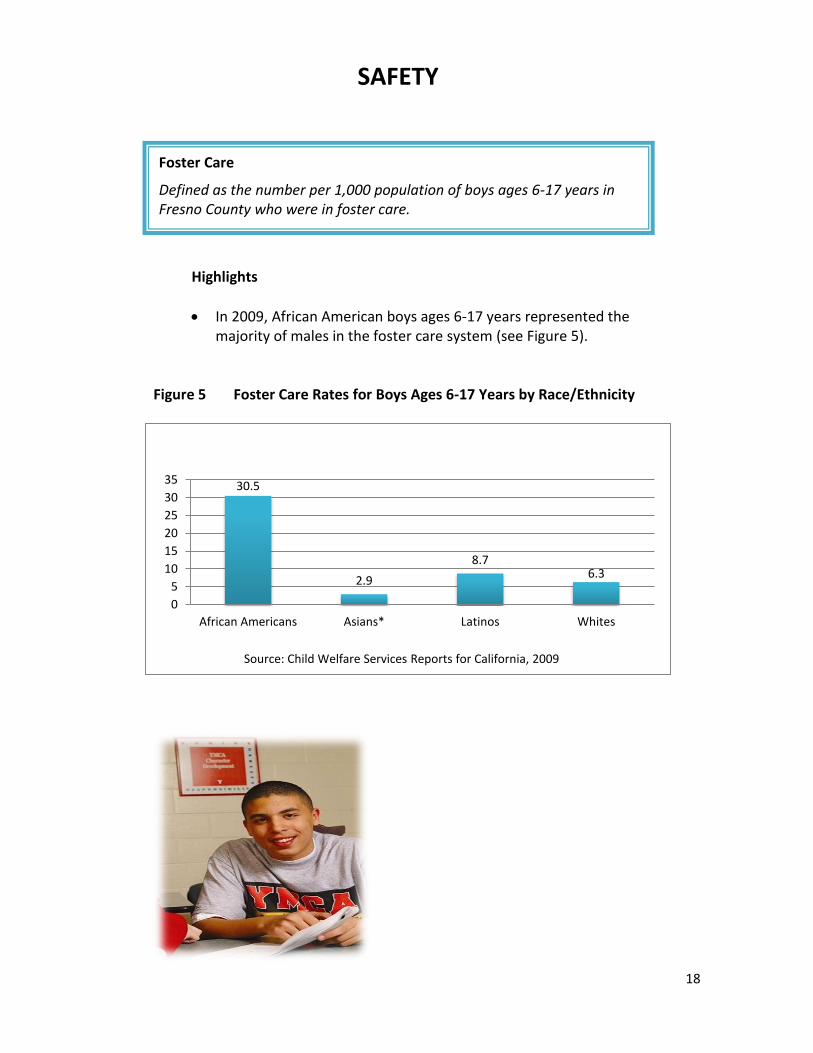
Highlights
In 2009, African American boys ages 6-17 years represented the majority of males in the foster care system (see Figure 5).
Figure 5 Foster Care Rates for Boys Ages 6-17 Years by Race/Ethnicity
30.5
2.9
8.7 6.3
0
5
10
15
20
25
30
35
African Americans Asians* Latinos Whites
Source: Child Welfare Services Reports for California, 2009
Foster Care
Defined as the number per 1,000 population of boys ages 6-17 years in Fresno County who were in foster care.
19
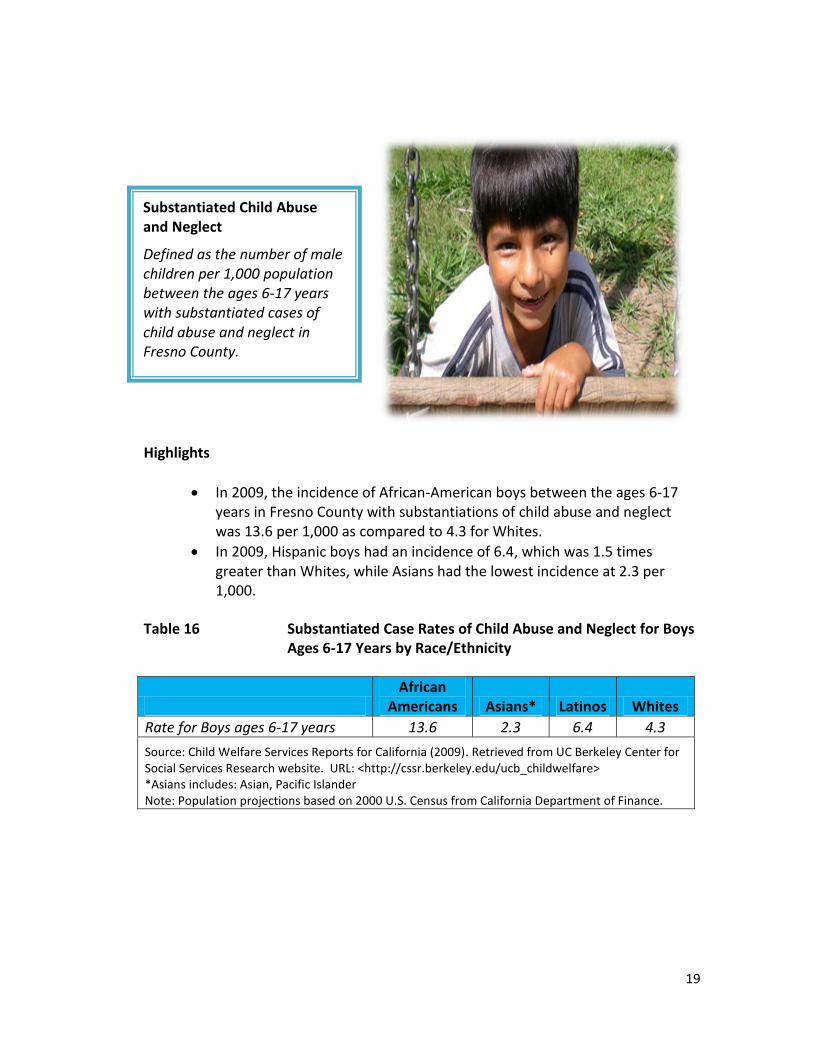
Highlights
In 2009, the incidence of African-American boys between the ages 6-17 years in Fresno County with substantiations of child abuse and neglect was 13.6 per 1,000 as compared to 4.3 for Whites.
In 2009, Hispanic boys had an incidence of 6.4, which was 1.5 times greater than Whites, while Asians had the lowest incidence at 2.3 per 1,000.
Table 16 Substantiated Case Rates of Child Abuse and Neglect for Boys Ages 6-17 Years by Race/Ethnicity
African
Americans Asians* Latinos Whites
Rate for Boys ages 6-17 years 13.6 2.3 6.4 4.3
Source: Child Welfare Services Reports for California (2009). Retrieved from UC Berkeley Center for Social Services Research website. URL: <http://cssr.berkeley.edu/ucb_childwelfare> *Asians includes: Asian, Pacific Islander Note: Population projections based on 2000 U.S. Census from California Department of Finance.
Substantiated Child Abuse and Neglect
Defined as the number of male children per 1,000 population between the ages 6-17 years with substantiated cases of child abuse and neglect in Fresno County.
20
Highlights
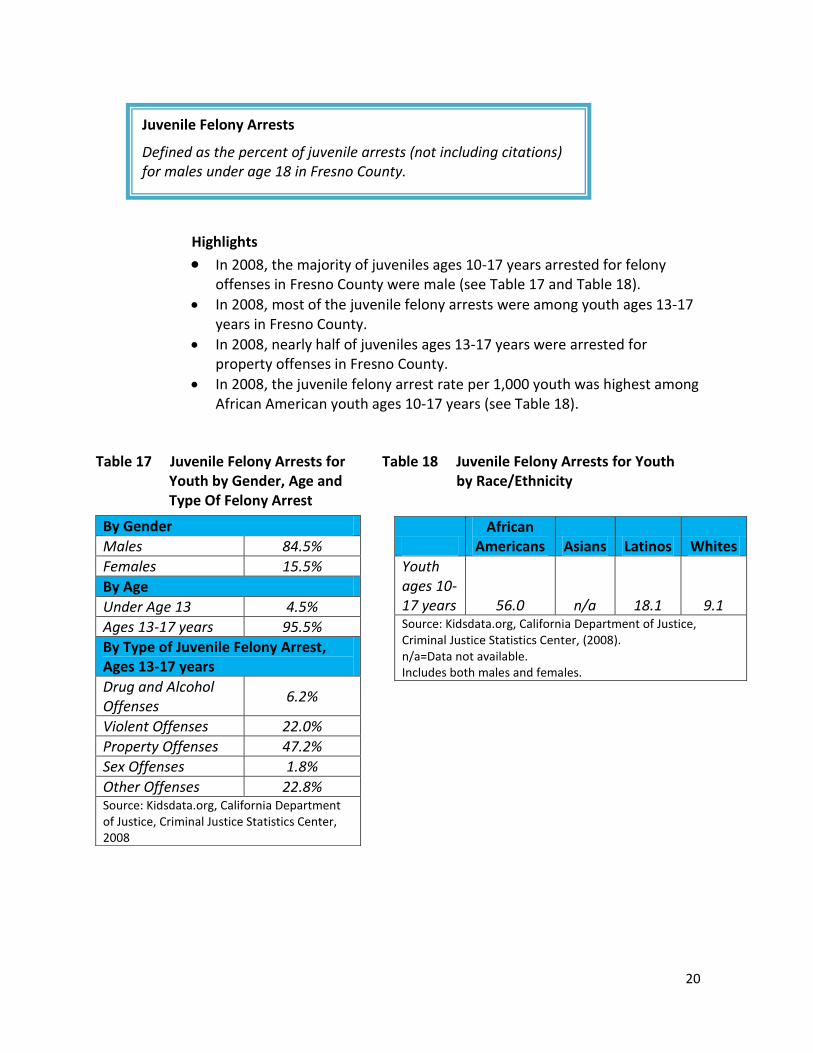
In 2008, the majority of juveniles ages 10-17 years arrested for felony offenses in Fresno County were male (see Table 17 and Table 18).
In 2008, most of the juvenile felony arrests were among youth ages 13-17 years in Fresno County.
In 2008, nearly half of juveniles ages 13-17 years were arrested for property offenses in Fresno County.
In 2008, the juvenile felony arrest rate per 1,000 youth was highest among African American youth ages 10-17 years (see Table 18).
Table 17 Juvenile Felony Arrests for Table 18 Juvenile Felony Arrests for Youth Youth by Gender, Age and by Race/Ethnicity Type Of Felony Arrest
By Gender
Males 84.5%
Females 15.5%
By Age
Under Age 13 4.5%
Ages 13-17 years 95.5%
By Type of Juvenile Felony Arrest, Ages 13-17 years
Drug and Alcohol Offenses
6.2%
Violent Offenses 22.0%
Property Offenses 47.2%
Sex Offenses 1.8%
Other Offenses 22.8% Source: Kidsdata.org, California Department of Justice, Criminal Justice Statistics Center, 2008
African
Americans Asians Latinos Whites
Youth ages 10-17 years 56.0 n/a 18.1 9.1 Source: Kidsdata.org, California Department of Justice, Criminal Justice Statistics Center, (2008). n/a=Data not available. Includes both males and females.
Juvenile Felony Arrests
Defined as the percent of juvenile arrests (not including citations) for males under age 18 in Fresno County.

21
Highlights
Between 2006 and 2008, African American students in grades 7, 9 and 11 represented the highest proportion of students who reported considering themselves as a gang member (see Table 19).
Between 2006 and 2008, male students in non-traditional schools were most likely to consider themselves a gang member.
Table 19 Reports of Gang Membership among Males by Race/Ethnicity
African
Americans Asians
Pacific Islander
Latinos Whites
Reports of gang membership (Includes males/females)
15.6% 7.3% 10.9% 11.4% 6.5%
Source: Kidsdata.org, California Department of Education, California Healthy Kids Survey (WestEd) (2006-2008). Retrieved from www.KidsData.org
Table 20 Reports of Gang Membership among Males by Grade
7th Grade 9th
Grade 11th
Grade Alternative
School
Reports of gang membership 11.6% 11.8% 11.2% 25.3% Source: Kidsdata.org, California Department of Education, California Healthy Kids Survey (WestEd) (2006-2008). Retrieved from www.KidsData.org
Gang Membership
Defined as the percent of students who reported that they considered themselves a member of a gang in Fresno County.

22
Highlights
Between 2006 and 2008, 1 in 5 deaths among males in Fresno County between the ages 15-24 years were related to homicide.
Between 2006 and 2008, Latinos had the highest percentage of male deaths of all ages attributed to homicide.
Table 21 Percent of Homicide-Related Deaths among Males Ages 15-24 Years
2006 2007 2008
Total male deaths (ages 15-24 years) 151 118 112
Total male deaths (ages 15-24 years) from homicide
33 (21.9%)
25 (21.2%)
27 (24.1%)
Source: RAND California (2006-2008). Retrieved from website: www.rand.org
Figure 6 Percent of Male Deaths from Homicide (All Ages)
19%
6%
53%
15%
28%
2%
57%
10% 10% 5%
64%
12%
0%
10%
20%
30%
40%
50%
60%
70%
African Americans Asians* Latinos Whites
Note: *Asians includes Pacific Islanders Source: RAND California, 2006-2008 via website: www.rand.org
2006
2007
2008
Homicide-Related Deaths
Defined as the number and percent of male deaths attributed to homicide for males between the ages of 15- 24 years in Fresno County.

23
EDUCATION
Highlights
In 2007, Asian children under age 6 years were least likely to be enrolled in preschool, nursery school or Head Start at least 10 hours per week in Fresno County as compared to African-American children who reported the highest proportion (see Table 22).
Table 22 Preschool, Nursery School and Head Start Enrollment for Children by Race/Ethnicity
African Americans (n=5,000)
Asians (n=6,000)
Latinos (n=56,000)
Whites (n=26,000)
Attends preschool, nursery school, Head Start at least 10 hrs/wk (< 6 years) A 21.0%* 9.8% 13.0%* 17.5%* Source: A: California Health Interview Survey, UCLA, 2007. www.chis.ucla.edu *Statistically unstable for a minimum number of respondents needed AND/OR has exceeded an acceptable value for coefficient of variance.
Preschool/Nursery/Head Start Enrollment
Defined as the percent of children, both male and female, under age 6 who were enrolled in preschool, nursery school or Head Start at least 10 hours per week in Fresno County at the time of the California Health Interview Survey (CHIS).
24
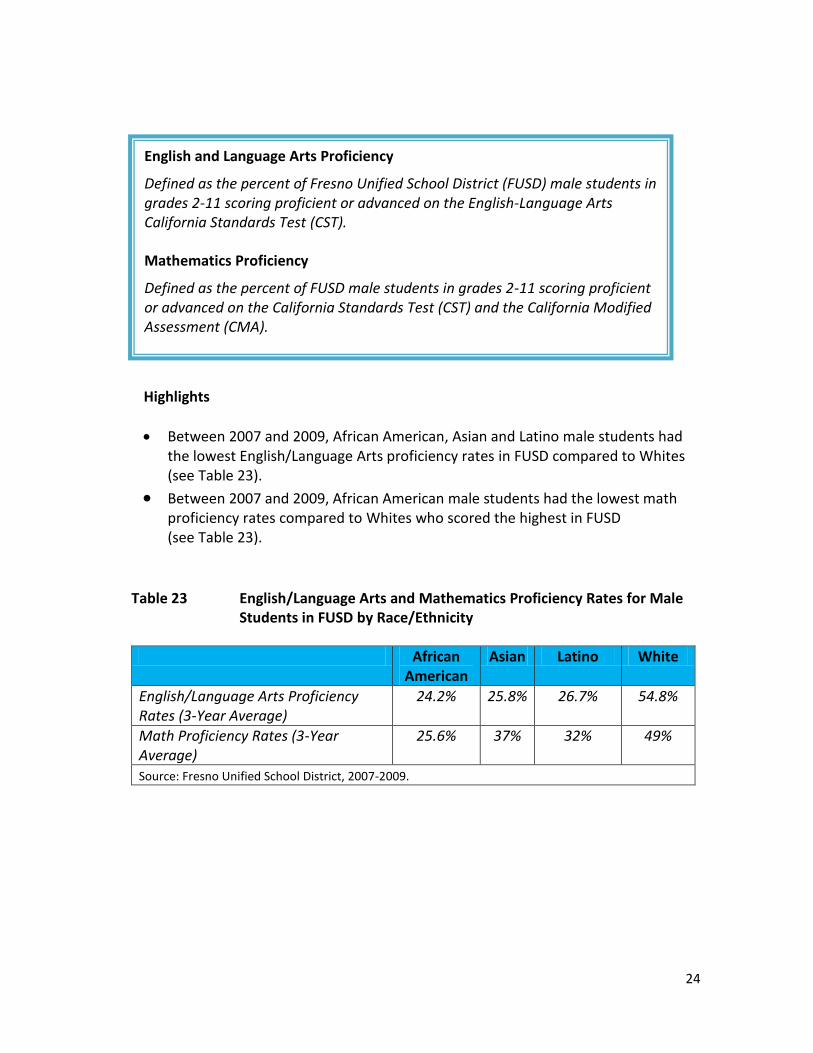
Highlights
Between 2007 and 2009, African American, Asian and Latino male students had the lowest English/Language Arts proficiency rates in FUSD compared to Whites (see Table 23).
Between 2007 and 2009, African American male students had the lowest math proficiency rates compared to Whites who scored the highest in FUSD (see Table 23).
Table 23 English/Language Arts and Mathematics Proficiency Rates for Male Students in FUSD by Race/Ethnicity
African American
Asian Latino White
English/Language Arts Proficiency Rates (3-Year Average)
24.2% 25.8% 26.7% 54.8%
Math Proficiency Rates (3-Year Average)
25.6% 37% 32% 49%
Source: Fresno Unified School District, 2007-2009.
English and Language Arts Proficiency
Defined as the percent of Fresno Unified School District (FUSD) male students in grades 2-11 scoring proficient or advanced on the English-Language Arts California Standards Test (CST).
Mathematics Proficiency
Defined as the percent of FUSD male students in grades 2-11 scoring proficient or advanced on the California Standards Test (CST) and the California Modified Assessment (CMA).
25
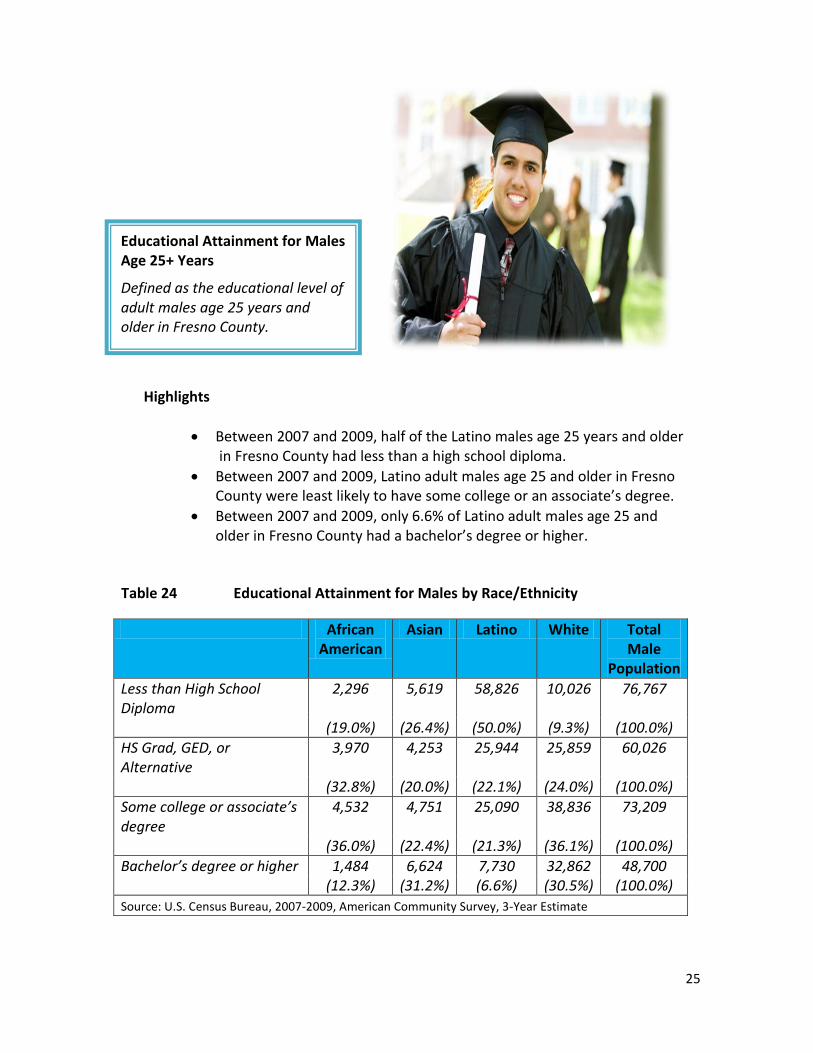
Highlights
Between 2007 and 2009, half of the Latino males age 25 years and older in Fresno County had less than a high school diploma.
Between 2007 and 2009, Latino adult males age 25 and older in Fresno County were least likely to have some college or an associate’s degree.
Between 2007 and 2009, only 6.6% of Latino adult males age 25 and older in Fresno County had a bachelor’s degree or higher.
Table 24 Educational Attainment for Males by Race/Ethnicity
African American
Asian Latino White Total Male
Population
Less than High School Diploma
2,296 5,619 58,826 10,026 76,767
(19.0%) (26.4%) (50.0%) (9.3%) (100.0%)
HS Grad, GED, or Alternative
3,970 4,253 25,944 25,859 60,026
(32.8%) (20.0%) (22.1%) (24.0%) (100.0%)
Some college or associate’s degree
4,532 4,751 25,090 38,836 73,209
(36.0%) (22.4%) (21.3%) (36.1%) (100.0%)
Bachelor’s degree or higher 1,484 6,624 7,730 32,862 48,700 (12.3%) (31.2%) (6.6%) (30.5%) (100.0%)
Source: U.S. Census Bureau, 2007-2009, American Community Survey, 3-Year Estimate
Educational Attainment for Males Age 25+ Years
Defined as the educational level of adult males age 25 years and older in Fresno County.

26
Highlights
Between 2008 and 2009, African American male students had the highest adjusted 4-year high school dropout rate in Fresno County and FUSD.
Between 2008 and 2009, Latino male students had the second highest adjusted 4-year high school dropout rate in Fresno County and FUSD.
Between 2007 and 2009, Latino students had the highest rates of suspensions in FUSD as compared to Whites (see Table 25).
Table 25 High School Dropout and Suspension Rates in Fresno County and FUSD by Race/Ethnicity
African
Americans Asians Latinos Whites
Fresno County Adjusted H.S -4-Year Dropout Rate D 41.5% 16.3% 31.0% 19.2%
FUSD Adjusted H.S -4-Year Dropout Rate E 31.1% 17.7% 27.8% 23.3%
Suspension Rates (n=13,262) 23% 4.8% 58.7% 12% Source: D: California Department of Education, Educational Demographics Office, 2008-2009. E: California Department of Education, Fresno Unified School District, 2008-2009.
High School Dropout
Defined as the Fresno County and Fresno Unified School District (FUSD) adjusted 4-year high school dropout rate for male students in grades 9-12. Suspension
Defined as the percent of FUSD male students who were suspended from school.

27
Highlights
Between 2008 and 2009, African American and Latino male students in Fresno County and Fresno Unified School District (FUSD) were least likely to meet the required 12th grade course completion for entrance to UC and CSU.
Completion rates were lowest for students in FUSD as compared to Fresno County students, with only 8.8% of African American students in FUSD meeting requirements for UC and CSU.
Table 26 12th Grade Course Completion for Males by Race/Ethnicity in Fresno County and FUSD for UC and CSU Entrance
African
Americans Asians* Latinos Whites
Fresno County 12th Grade Course Completion for UC & CSU Entrance 12.5% 36.9% 13.7% 36.8%
FUSD 12th Grade Course Completion for UC & CSU Entrance 8.8% 24.5% 10.3% 20.5% *Asians includes Pacific Islander Source: California Department of Education, Educational Demographics Office, 2008-2009.
12th Grade Course Completion
Defined as the percent of male students in Fresno County that completed the 12th grade course requirements for entrance to University of California (UC) and California State University (CSU).

28
Central California Center for Health & Human Services California State University, Fresno
1625 E. Shaw Ave., Suite 146 Fresno, CA 93710 (559) 228-2150
www.centralcaliforniachildren.org
This project was made possible thanks to generous support from: