BOULDER PREDICTION IN ROCK BLASTING USING ... developed neural network model is suitable for...
15
VOL. 12, NO. 1, JANUARY 2017 ISSN 1819-6608 ARPN Journal of Engineering and Applied Sciences ©2006-2017 Asian Research Publishing Network (ARPN). All rights reserved. www.arpnjournals.com 47 BOULDER PREDICTION IN ROCK BLASTING USING ARTIFICIAL NEURAL NETWORK P. Y. Dhekne, Manoj Pradhan, Ravi K. Jade and Romil Mishra Faculty, Department of Mining Engineering, National Institute of Technology, Raipur, India E-Mail: [email protected] ABSTRACT This paper explains the development of an artificial neural network (ANN) model for estimating the number of boulders resulting from the blasts in Limestone quarries. A number of ANN models are available for prediction of post- blast rock fragmentation distribution but none is available to predict boulder count. A data base of three hundred blasts was created for the development of the model. The records in the data base were generated from the blasts carried out in four Limestone quarries which have similar geotechnical set up. These quarries adopt different blast practice. The data base consists of blast design parameters, explosive type and the boulder count. 191records out of three hundred were used to train a two-hidden layer back-propagation neural network model to predict boulder count resulting from the blasts. The boulder count was considered to be a function of nine independent parameters. The ANN program code was developed inMatLabR2012a. The network was trained using Levenberg-Marquardt algorithm as it provides the highest stability and maximum learning speed. The network was extensively analyzed to assess its performance with different transfer functions and the number of hidden layers to estimate the optimum network architecture. 77 data sets were used to validate the results of the trained neural network model and the remaining 32 datasets were used for testing the developed model. Predictions of boulder count by the ANN model were compared with those using a statistical model developed in SPSS statistics 20.0. It was observed that the prediction capability of the trained neural network model was found to be strong and it provides an easy option to the field engineers to optimize the blast design so that the boulder-count is the minimum. Diversity of the blast data in the similar geotechnical set up is one of the most important aspects of the developed model. The developed neural network model is suitable for practical use at the Limestone quarries having similar geotechnical set up. Keywords: artificial neural network, multiple regression, blasting, rock fragmentation, boulder count. INTRODUCTION Efficiency of the unit operations of quarrying viz. loading, transporting and crushing is the maximum with optimum rock fragmentation. Maximum efficiency minimizes the cost of production. Therefore optimum rock fragmentation is always one of the objectives in any production blasting. Rock fragmentation is said to be optimum if the rock needs no further treatment after the blast. A lot of research has already been conducted on the various aspects of the fragmentation with the sole objective of improving the same [1-2, 4-7, 17, 21-22, 24- 31, 34-35, 38, 43,45-49, 51, 61-62, 65-71, 74-75, 78]. It is reported that more than 20 factors affect the blast results [19]. These factors can be grouped in four different categories: rock geotechnical parameters such as density, hardness, compressibility; explosive parameters such as density, velocity of detonation; technical parameters such as delay interval, primer strength and location and geometrical parameters such as burden, spacing, and stemming [3]. A number of empirical models are available to estimate post-blast rock fragmentation resulting from a blast [9-11, 39, 42, 64]. Concept of ANN has been applied to model various aspects of blast-induced ground vibrations [32, 37, 55, 76], air overpressure [72], fly rock [54,57,79], back break [15, 20, 36, 56, 73], powder factor [32-33, 44], estimation of blast geometry [13, 52, 59,77], estimation of an appropriate type of explosive [12], estimation of fragmentation [3, 15-16, 40-41, 50, 53, 58, 63, 80-81] etc. A critical analysis of the models indicates that the modeling using ANN is beneficial in rock blasting where a large number of affecting variables and their complicated mutual dependence sometimes create difficulties in the application of empirical modeling. Outputs of the developed ANN based fragmentation models have been expressed either as the fragment size or as the sieve analysis. Practicing mining engineers not only make use of this form of the output to evaluate the fragmentation but at the same time they are also interested in knowing the boulder count so that they can plan the secondary breakage operations. Extensive literature survey has indicated that no ANN model is available to predict the boulder count. Therefore an ANN model has been developed to predict the boulder count. The data sets required for the development of the model have been generated from the Limestone quarries. DESCRIPTION OF THE SITES The ANN model described in this paper has been developed from the blast records generated from Baikunth, Hirmi, Sonadih and Rawan Limestone quarries. The quarries are situated in Raipur district of Chhattisgarh province of India and are located within a radius of 20 km. The quarries have an overburden which is generally hard Laterite and Clay having a thickness from 4 m to 6 m. The deposits consist of horizontal, thick bedded Stromatolitic Limestone of Raipur Group. Patches of Dolomitic Limestone, Argillaceous Limestone and Shale are found associated with the deposits. The deposits are flat and their thickness ranges from 30 m to 35 m. The deposits are having three sets of joints. The joints are open and are
Transcript of BOULDER PREDICTION IN ROCK BLASTING USING ... developed neural network model is suitable for...

VOL. 12, NO. 1, JANUARY 2017 ISSN 1819-6608
ARPN Journal of Engineering and Applied Sciences ©2006-2017 Asian Research Publishing Network (ARPN). All rights reserved.
www.arpnjournals.com
47
BOULDER PREDICTION IN ROCK BLASTING USING ARTIFICIAL
NEURAL NETWORK
P. Y. Dhekne, Manoj Pradhan, Ravi K. Jade and Romil Mishra
Faculty, Department of Mining Engineering, National Institute of Technology, Raipur, India E-Mail: [email protected]
ABSTRACT
This paper explains the development of an artificial neural network (ANN) model for estimating the number of boulders resulting from the blasts in Limestone quarries. A number of ANN models are available for prediction of post-blast rock fragmentation distribution but none is available to predict boulder count. A data base of three hundred blasts was created for the development of the model. The records in the data base were generated from the blasts carried out in four Limestone quarries which have similar geotechnical set up. These quarries adopt different blast practice. The data base consists of blast design parameters, explosive type and the boulder count. 191records out of three hundred were used to train a two-hidden layer back-propagation neural network model to predict boulder count resulting from the blasts. The boulder count was considered to be a function of nine independent parameters. The ANN program code was developed inMatLabR2012a. The network was trained using Levenberg-Marquardt algorithm as it provides the highest stability and maximum learning speed. The network was extensively analyzed to assess its performance with different transfer functions and the number of hidden layers to estimate the optimum network architecture. 77 data sets were used to validate the results of the trained neural network model and the remaining 32 datasets were used for testing the developed model. Predictions of boulder count by the ANN model were compared with those using a statistical model developed in SPSS statistics 20.0. It was observed that the prediction capability of the trained neural network model was found to be strong and it provides an easy option to the field engineers to optimize the blast design so that the boulder-count is the minimum. Diversity of the blast data in the similar geotechnical set up is one of the most important aspects of the developed model. The developed neural network model is suitable for practical use at the Limestone quarries having similar geotechnical set up. Keywords: artificial neural network, multiple regression, blasting, rock fragmentation, boulder count.
INTRODUCTION
Efficiency of the unit operations of quarrying viz.
loading, transporting and crushing is the maximum with optimum rock fragmentation. Maximum efficiency minimizes the cost of production. Therefore optimum rock fragmentation is always one of the objectives in any production blasting. Rock fragmentation is said to be optimum if the rock needs no further treatment after the blast. A lot of research has already been conducted on the various aspects of the fragmentation with the sole objective of improving the same [1-2, 4-7, 17, 21-22, 24-31, 34-35, 38, 43,45-49, 51, 61-62, 65-71, 74-75, 78]. It is reported that more than 20 factors affect the blast results [19]. These factors can be grouped in four different categories: rock geotechnical parameters such as density, hardness, compressibility; explosive parameters such as density, velocity of detonation; technical parameters such as delay interval, primer strength and location and geometrical parameters such as burden, spacing, and stemming [3]. A number of empirical models are available to estimate post-blast rock fragmentation resulting from a blast [9-11, 39, 42, 64]. Concept of ANN has been applied to model various aspects of blast-induced ground vibrations [32, 37, 55, 76], air overpressure [72], fly rock [54,57,79], back break [15, 20, 36, 56, 73], powder factor [32-33, 44], estimation of blast geometry [13, 52, 59,77], estimation of an appropriate type of explosive [12], estimation of fragmentation [3, 15-16, 40-41, 50, 53, 58, 63, 80-81] etc. A critical analysis of the models indicates that the modeling using ANN is beneficial in rock blasting
where a large number of affecting variables and their complicated mutual dependence sometimes create difficulties in the application of empirical modeling. Outputs of the developed ANN based fragmentation models have been expressed either as the fragment size or as the sieve analysis. Practicing mining engineers not only make use of this form of the output to evaluate the fragmentation but at the same time they are also interested in knowing the boulder count so that they can plan the secondary breakage operations. Extensive literature survey has indicated that no ANN model is available to predict the boulder count. Therefore an ANN model has been developed to predict the boulder count. The data sets required for the development of the model have been generated from the Limestone quarries.
DESCRIPTION OF THE SITES The ANN model described in this paper has been
developed from the blast records generated from Baikunth, Hirmi, Sonadih and Rawan Limestone quarries. The quarries are situated in Raipur district of Chhattisgarh province of India and are located within a radius of 20 km. The quarries have an overburden which is generally hard Laterite and Clay having a thickness from 4 m to 6 m. The deposits consist of horizontal, thick bedded Stromatolitic Limestone of Raipur Group. Patches of Dolomitic Limestone, Argillaceous Limestone and Shale are found associated with the deposits. The deposits are flat and their thickness ranges from 30 m to 35 m. The deposits are having three sets of joints. The joints are open and are

VOL. 12, NO. 1, JANUARY 2017 ISSN 1819-6608
ARPN Journal of Engineering and Applied Sciences ©2006-2017 Asian Research Publishing Network (ARPN). All rights reserved.
www.arpnjournals.com
48
having an aperture of 2 mm to 5 mm. The joint surface is rough. The geotechnical properties of the deposits are
summarized in Table-1.
Table-1. Geotechnical properties of limestone deposits (*Mean values).
Name of
the
quarry
Uniaxial *
compressive
strength (M Pa)
Density*
(g/cc)
Young’s *
Modulus
(G Pa)
Porosity*
(%)
Vertical *
spacing
between joints (m)
Horizontal*
spacing
between joints (m)
Baikunth 38 2.25 46 6 1.0 0.6
Rawan 43 2.38 49 5 1.5 0.9
Sonadih 45 2.35 48 7 1.4 0.8
Hirmi 44 2.40 50 5 2.0 1.0
A perusal of the properties indicates that the
deposits of the four quarries have a similar geotechnical set-up and can be considered as competent. The quarries are under active production stage and the winning is done using conventional drilling and blasting method. The holes are drilled in two to three rows on staggered pattern.
Row to row delay with cord relays is maintained at 50 ms whereas the delay with shock tube initiation is 42 ms. Blasts are carried out either with Ammonium Nitrate- Fuel Oil mixture (ANFO) or with Site-Mixed Emulsion (SME) Explosive. The other details of blast practice are given in Table-2.
Table-2. Blast practice details.
Name of
the
quarry
Dia
(mm) Spacing
(m) Burden
(m) Depth
(m) Explosive
type Primer
Initiation
method
Secondary
breakage
method
Baikunth
115 5.0-6.0 3.0-4.0
8.0
ANFO Cartridge
booster/Cast booster
Cord relays
Secondary blasting/
Rock breaker 152 6.5-7.0 4.5-5.0 SME Cast booster
Shock tubes
Rawan 152 7.0 4.0 8.0 SME Cast booster Shock tubes
Rock breaker
Sonadih 100 4.0 3.0 9.0 SME Cast booster Shock tubes
Rock breaker
Hirmi
115 4.0 6.0
8.0
ANFO Cartridge booster/Cast
booster
Cord relays Rock
breaker 152 7.0 5.0 SME
Shock tubes
DATA COLLECTION
It has been established by the research [8] that the order of influence of various parameters for the fragmentation in competent rocks is: a) Explosive energy per unit volume of rock mass, i.e.
specific charge b) Explosive distribution within the rock mass c) Type of explosive d) Delay timing e) Joint system and its orientation with respect to blast
direction.
These findings have been the starting hypothesis for the selection of the input variables. Since the rock mass is competent; hence the specific charge has the most dominating role in deciding the quality of fragmentation. The specific charge is logically correlated with the number
of holes/row, number of rows, average depth, average spacing, average burden and total quantity of explosive fired in one round. If all these parameters are considered separately for the development for the model; then one can assess the effect of variation in individual parameter on the boulder count, if required. This is why the individual parameters were considered instead of specific charge. On the similar considerations the type of the explosive replaces the VoD and the density of the explosive. The explosive distribution is represented by the diameter of the blast hole and the stemming height. The geotechnical parameters and the delay practice were similar in the referred mines hence they have not been considered as an input variable. This makes the model site specific. In order to use the model in different geotechnical environment and/or with different delay practice and with different criterion for oversize fragments; the model requires training, validation and testing with new blast records.

VOL. 12, NO. 1, JANUARY 2017 ISSN 1819-6608
ARPN Journal of Engineering and Applied Sciences ©2006-2017 Asian Research Publishing Network (ARPN). All rights reserved.
www.arpnjournals.com
49
This is not a major problem as most of the mines maintain the records which are required for the operationalizing the model. Thus the input variables are number of holes per row, number of rows, average spacing, average burden, average depth, diameter, average stemming, type of the explosive and the total charge. The target variable is the boulder count. The maximum feed size of the crushers of the quarries is 1 m. Therefore the fragments having the size more than 1 m are considered as boulders. More than three hundred blast records were generated and assessed for their technical feasibility for multiple regressions
modeling with SPSS. Subsequently, three hundred blast records were finalized for both statistical and ANN modeling. These three hundred records were divided in three groups. 191 records were used for training, 77 records for validation and 32 for testing of the ANN model. The records used for training and validation of ANN model were used for the development of statistical model whereas the 32 records used for testing of the ANN and statistical models were same. The Range of the data used for the development of the models is presented in Table-3.
Table-3. Range of the data used for the development of models.
Input variables
Value
Minimum Maximum Mean Standard
Deviation
Diameter, mm (D) 100 152 Not Applicable
Average burden, m (B) 2.80 4.65 3.73 0.61
Average spacing, m (S) 3.70 6.80 4.89 0.78
Average depth, m (H) 7.00 9.75 8.66 0.61
Average stemming, m (T) 2.60 4.30 3.33 0.39
Number of holes/row (N) 9 57 25 8.13
Number of rows (n) 2 3 Not Applicable
Type of the explosive ANFO and SME
Quantity of explosive fired per round, kg (Q)
1287 9567 4109 1897
Target variable
Value
Minimum Maximum Mean Standard Deviation
Boulder count (N’) 39 250 122 45.82
CONCEPT
ANN mimics the function of human brain. Since its inception, ANN has become popular and applicable to various fields of science and technology to solve complicated simulation problems. The ANN is capable of calculating arithmetic and logical functions, generalizing and transforming independent variables to the dependent variables, parallel computations, nonlinearity processing, handling noisy data, function approximation and pattern recognition [3]. ANN is trained using a set of real inputs and their corresponding outputs. For a better approximation, sufficient number of datasets is required. Performance of the trained model is checked with part of the available data known as testing datasets. To find out the best possible network, various topologies are constructed and tested. The process of model training-testing has to be continued until the optimum model with minimum error and maximum accuracy is achieved. A neural network has a layered structure, and each layer contains processing units or neurons. Input variables are placed in the input layer, whereas target variables are put in the output layer. The neurons in the hidden layers are the intermediate computation components (black box) of
the system. All of the layers are connected to each other by weighted connections. Each neuron is connected to the neurons in the subsequent layer. However, there is no connection between the neurons of the same layer. In the training process, the interconnections among the neurons are initially assigned specific weights. The network would be able to perform a function by adjusting the initial weights. In the process of ANN training, an initial arbitrary value (weight) is assigned to the connections and then to combine all of the weighted inputs and generate the neuron output the formula depicted in equation (1) is applied: O = ∑xiwi + b (1)
Where, xi is the input; wi is the connection weight and b is the bias.
The neuron output is mapped to actual output by the function indicated in equation (2), y = f (O) = f (∑xiwi + b) (2)

VOL. 12, NO. 1, JANUARY 2017 ISSN 1819-6608
ARPN Journal of Engineering and Applied Sciences ©2006-2017 Asian Research Publishing Network (ARPN). All rights reserved.
www.arpnjournals.com
50
DEVELOPMENT OF ANN MODEL The ANN model described in this paper was
developed using the syntax available in ANN tool box of MATLAB. A back-propagation neural network was selected due to its simplicity and uniform approximation of any continuous function. The number of neurons in the input layer was nine and the number of neurons in the output layer was one. The tool box provides a number of training functions and each is having its own advantages and disadvantages. The objective of the training function is to adjust the weights and the bias vectors so as to find the complicated relation between the input and output. The application of a training function depends on several factors, such as the complexity of the problem, the number of training samples, the structure of the network and error target. Levenberg–Marquardt (LM) algorithm is used for
training the network because it has good generalization ability and has the capability of providing good predictions. LM algorithm provides a numerical solution to the problem of minimizing a function over a space of parameters of the function. Not only the first derivative information but also the second derivative information of the target function is used in the LM algorithm. It can dynamically adjust the convergence direction of iteration according to the iteration result, so its convergence speed is very fast. Generally, Log-Sigmoid ((Logsig), Hyperbolic tangent Sigmoid (Tansig), Positive Linear (Poslin) and Linear (Purelin) transfer functions are used in back propagation neural network (BPNN) [73]. These four transfer functions are considered for optimization. The optimization is ascertained by regression coefficients (Table 4 and Figure-1).
Table-4. Regression coefficients obtained with various transfer functions.
S. No. Transfer function Regression coefficients
Training Validation Testing Overall
1 Poslin 0.69 0.82 0.57 0.69
2 Logsig 0.75 0.47 0.62 0.64
3 Purelin 0.96 0.98 0.94 0.96
4 Tansig 0.59 0.44 0.51 0.55
Note- 1, 2, 3 and 4 indicate the serial numbers of the transfer functions indicated in Table-4.
In the case of the multilayer network, which can
be used for fitting or pattern recognition, the number of hidden layers is not determined by the problem, since any number of hidden layers is possible. The standard procedure is to begin with a network with one hidden layer. If the performance of the network is not satisfactory, then more number of layers can be used in the network. It would be unusual to use more than two hidden layers. The training becomes more difficult when multiple hidden layers are used which leads to slow convergence. The numbers of neurons in the hidden layers are determined by
the complexities of the function that is being approximated or the decision boundaries that are being implemented. Unfortunately, we don’t normally know how complex the problem is until we try to train the network. The standard procedure is to begin with more neurons and then change it. The network was trained using different number of hidden layers and neurons. The regression coefficients were noted for each of the architectures. The architecture providing the maximum regression coefficient was selected for the prediction [23]. Asa result of optimization, a BPNN model (Figure-2) with one hidden layer with two neurons in it, Levenberg-Marquardt as training function and purelin function as transfer function is finalized.
Figure-2. Developed artificial neural network.
Testing of ANN model The model predicts the boulder count based on
the input variables of 32 records comprising of ANFO blasts in 152 and 115 mm diameter holes. And, SME blasts in 152 and 100 mm diameter holes and the predictions are compared with target variables of these 32 records. The predictive ability of the neural network is evident from Figures 3 and 4.
0
0.2
0.4
0.6
0.8
1
1.2
1 2 3 4
Reg
ress
ion c
oef
fici
ents
Figure-1. Regression coefficients obtained with various transfer functions
Training
Validation
Testing
Overall

VOL. 12, NO. 1, JANUARY 2017 ISSN 1819-6608
ARPN Journal of Engineering and Applied Sciences ©2006-2017 Asian Research Publishing Network (ARPN). All rights reserved.
www.arpnjournals.com
51
Figure-3. Curves obtained in MATLAB during training, validation and testing of the data sets.
Figure-4. Regression lines obtained in MATLAB during training, validation and testing of the data set.

VOL. 12, NO. 1, JANUARY 2017 ISSN 1819-6608
ARPN Journal of Engineering and Applied Sciences ©2006-2017 Asian Research Publishing Network (ARPN). All rights reserved.
www.arpnjournals.com
52
Sensitivity analysis Sensitivity analysis is carried out to assess the
influence on each of the parameter on the predictions of ANN. The results are expressed as the strength of relations between the input and variables. Cosine amplitude method (CAM) is used to identify the most sensitive factors affecting boulder count. In this method, all of the data pairs are expressed in common X-space. The data pairs used to construct a data array X defined in equation (3) is X = {X1, X2, X3,...Xn} (3)
Each of the elements in the data array X is a vector of lengths of n, as shown in equation (4): Xi = {Xi1, Xi2, Xi3,…Xin} (4)
Thus, each of the pairs is a point in n-dimensional space, where each point requires m coordinates for a full description. Each element of a relation, results in a pair wise comparison of two data pairs. The strength of the relation between the data pairs, and, is expressed by the membership function given in equation (5). 𝑟 = ∑ 𝑥𝑛= ∗𝑥√∑ 𝑥𝑛= ∗∑ 𝑥𝑛= (5)
The analysis is carried and the order of the
influence of various input variables on the predictions is depicted in Table-5 and Figure-5 shows the strength of relations of input variables and the order of influence of each of the input variable on the boulder count. Table-5. Order of the influence of various input variables
on the predictions and the order of influence.
S. No. Input variable Strength of
relation
1 No. of holes per row 0.82
2 No. of rows 0.48
3 Average spacing 0.72
4 Average burden 0.78
5 Average depth 0.92
6 Diameter 0.76
7 Average stemming 0.80
8 Type of the explosive 0.50
9 Total charge 0.81
Figure-5. Strength of relations of input variables (1, 2, 3etc indicate the serial number of variables shown
in Table-5).
Since the investigated rock mass is competent hence the variables pertaining to the specific charge viz. number of holes per row, number of rows, average spacing, average burden, average depth and total charge and those related to explosive distribution viz. average stemming and total charge are expected to show a major influence on the boulder count. Table 5 indicates that each of the concerned variables except the number of rows has an influence of more than 70% on the boulder count. A low value of the strength of relation is owing to the fact that the number of rows is either two or three and as such there is no substantial variation in this variable. As per the starting hypothesis; type of the explosive comes last in the order of the influence amongst the variables considered in this research. This fact is further corroborated by the findings and the type of the explosive has an influence of 50 % on the predictions. The influence is less because there was not much variation in the type of the explosive and only ANFO and SME were available in this research. The benefits of the developed ANN model are: a) The model uses a limited number of input variables.
The records of the required input and target variables
are normally maintained in every mine. Requirement
of a large number of records for training and
validation of the model is therefore not a problem.
b) The target variable i.e. boulder count helps to plan
the secondary breakage operations properly.
c) The delay practice and the geotechnical features can
be incorporated in the model for prediction of
boulder count. In such a case, the program can be
easily modified to incorporate the changes.
0.82
0.48
0.72 0.78
0.92
0.76 0.8
0.5
0.81
0
0.1
0.2
0.3
0.4
0.5
0.6
0.7
0.8
0.9
1
1 2 3 4 5 6 7 8 9
Str
ength
of
rela
tio
ns
Input variables
VOL. 12, NO. 1, JANUARY 2017 ISSN 1819-6608
ARPN Journal of Engineering and Applied Sciences ©2006-2017 Asian Research Publishing Network (ARPN). All rights reserved.
www.arpnjournals.com
53
d) The model can be used to assess the blast designs for
minimizing the boulder count.
The limitations of the developed ANN model are: a) The predictions of the model are site specific and in
the present form; it can predict the boulder count
accurately in respect of only those mines which have
a similar rock mass and analogous delay practice.
b) The model has been developed with target variable as
boulder count which is; in this case; the fragments of
size more than 1 m. Skewed predictions may be
obtained, if the fragments of some other size are
considered as boulders.
c) MATLAB environment is necessary for the
development of this ANN model and subsequent
predictions. However, in the absence of the
MATLAB; ANN program code can be developed for
the prediction of the boulder count.
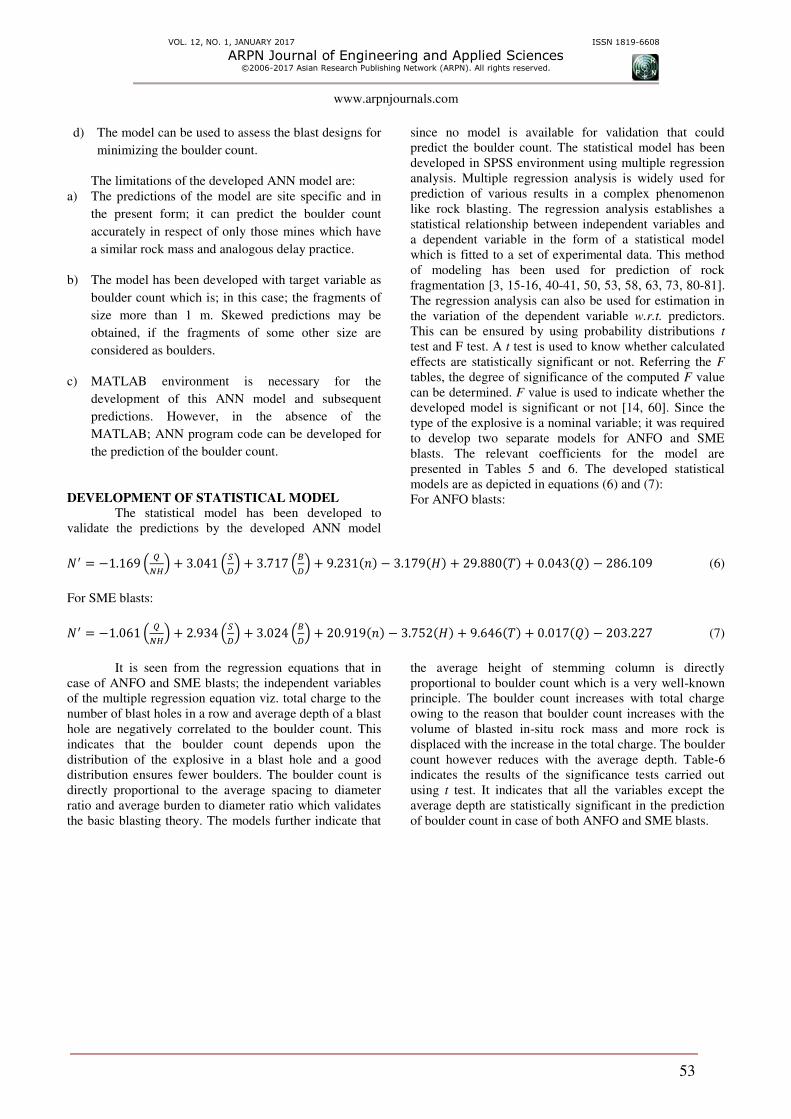
DEVELOPMENT OF STATISTICAL MODEL The statistical model has been developed to
validate the predictions by the developed ANN model
since no model is available for validation that could predict the boulder count. The statistical model has been developed in SPSS environment using multiple regression analysis. Multiple regression analysis is widely used for prediction of various results in a complex phenomenon like rock blasting. The regression analysis establishes a statistical relationship between independent variables and a dependent variable in the form of a statistical model which is fitted to a set of experimental data. This method of modeling has been used for prediction of rock fragmentation [3, 15-16, 40-41, 50, 53, 58, 63, 73, 80-81]. The regression analysis can also be used for estimation in the variation of the dependent variable w.r.t. predictors. This can be ensured by using probability distributions t test and F test. A t test is used to know whether calculated effects are statistically significant or not. Referring the F tables, the degree of significance of the computed F value can be determined. F value is used to indicate whether the developed model is significant or not [14, 60]. Since the type of the explosive is a nominal variable; it was required to develop two separate models for ANFO and SME blasts. The relevant coefficients for the model are presented in Tables 5 and 6. The developed statistical models are as depicted in equations (6) and (7): For ANFO blasts:
𝑁′ = − . 𝑄𝑁𝐻 + . 𝑆𝐷 + . 𝐵𝐷 + . 𝑛 − . 𝐻 + . 𝑇 + . 𝑄 − . (6)
For SME blasts: 𝑁′ = − . 𝑄𝑁𝐻 + . 𝑆𝐷 + . 𝐵𝐷 + . 𝑛 − . 𝐻 + . 𝑇 + . 𝑄 − . (7)
It is seen from the regression equations that in
case of ANFO and SME blasts; the independent variables of the multiple regression equation viz. total charge to the number of blast holes in a row and average depth of a blast hole are negatively correlated to the boulder count. This indicates that the boulder count depends upon the distribution of the explosive in a blast hole and a good distribution ensures fewer boulders. The boulder count is directly proportional to the average spacing to diameter ratio and average burden to diameter ratio which validates the basic blasting theory. The models further indicate that
the average height of stemming column is directly proportional to boulder count which is a very well-known principle. The boulder count increases with total charge owing to the reason that boulder count increases with the volume of blasted in-situ rock mass and more rock is displaced with the increase in the total charge. The boulder count however reduces with the average depth. Table-6 indicates the results of the significance tests carried out using t test. It indicates that all the variables except the average depth are statistically significant in the prediction of boulder count in case of both ANFO and SME blasts.

VOL. 12, NO. 1, JANUARY 2017 ISSN 1819-6608
ARPN Journal of Engineering and Applied Sciences ©2006-2017 Asian Research Publishing Network (ARPN). All rights reserved.
www.arpnjournals.com
54
Table-6. Results of significance test for ANFO and SME blasts.
Variables ANFO Blasts SME Blasts
t Sig t Sig
(Constant) -8.855 0.000 -5.799 0.000
Total charge to the number of blast holes in a row and average depth of a blast hole
-2.914 0.004 -3.605 0.004
Average spacing to diameter 6.222 0.000 5.426 0.000
Average burden to diameter 4.085 0.000 4.297 0.000
Number of rows 3.194 0.002 7.907 0.002
Average depth of the blast holes -1.537 0.126 -1.900 0.060
Average height of stemming 7.729 0.000 3.677 0.000
Total charge 24.499 0.000 42.000 0.000
Testing of statistical model
The testing of the models indicates that each of the predictors has its tolerance greater than 0.1 and the variance inflation factor for each of the independent variables is less than 10. Further, the Durbin-Watson statistic for the models on ANFO and SME blasts is 1.913 and 1.836 respectively indicating the independence of the predictors. The residuals have also been found to have normal distribution and the P-P plots indicate the normal distribution of the residuals. It is therefore found that the proposed model has all the desirable properties as required for a statistical model. The statistical model developed for ANFO blasts indicates that the R is 0.979 and adjusted R2 is 0.957. It means that 95.7% of the variance in the boulder count can be explained by the independent variables considered in this regression whereas in case of
SME blasts the R is 0.984 whereas the adjusted R2 is
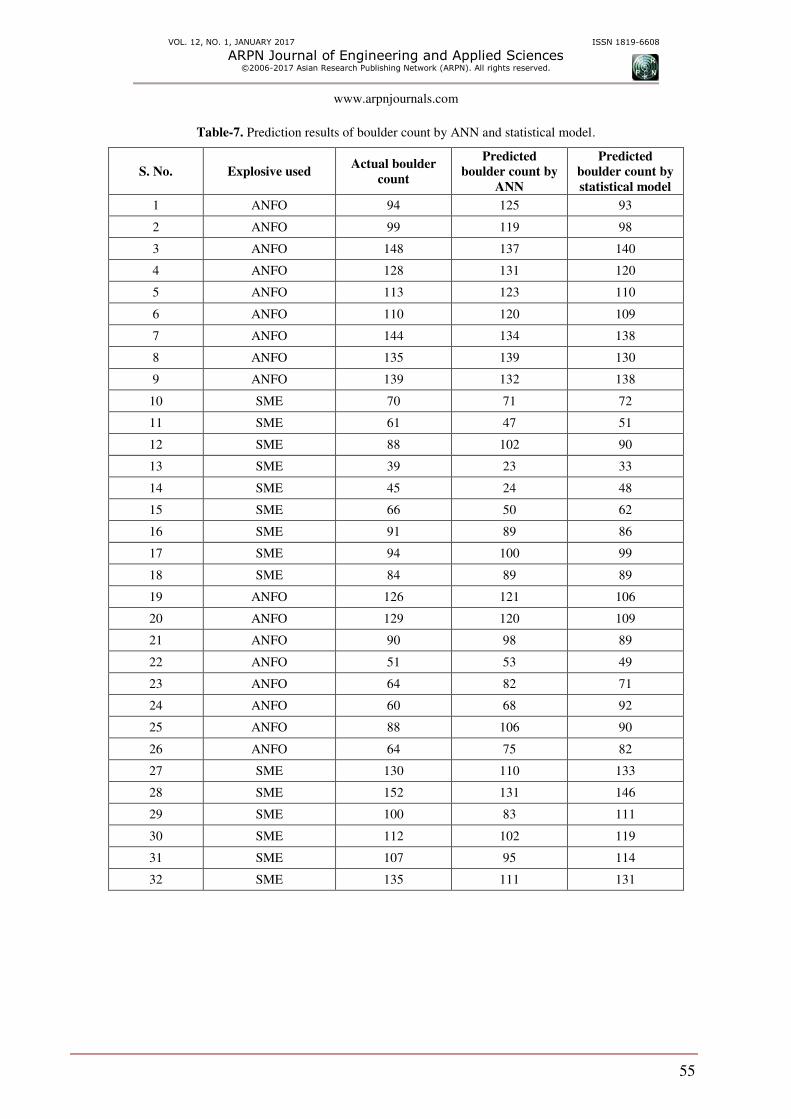
0.967. It means that 96.7% of the variance in the boulder count can be explained by the independent variables considered in this regression. The accuracy of the statistical model is corroborated by the F test. The test indicates that both the models in the present form are significant since p< 0.001. It validates the assumption of linearity between the dependent and independent variables. The predictions by ANN model and the statistical model are presented in Table 7 and Figures 6, 7 and 8 represent the an overview of prediction capabilities of the two models against the actual boulder count, scatter obtained in actual boulder count and predicted boulder count by statistical model and scatter obtained in the predictions by ANN model and Statistical model respectively.
VOL. 12, NO. 1, JANUARY 2017 ISSN 1819-6608
ARPN Journal of Engineering and Applied Sciences ©2006-2017 Asian Research Publishing Network (ARPN). All rights reserved.
www.arpnjournals.com
55
Table-7. Prediction results of boulder count by ANN and statistical model.
S. No. Explosive used Actual boulder
count
Predicted
boulder count by
ANN
Predicted
boulder count by
statistical model
1 ANFO 94 125 93
2 ANFO 99 119 98
3 ANFO 148 137 140
4 ANFO 128 131 120
5 ANFO 113 123 110
6 ANFO 110 120 109
7 ANFO 144 134 138
8 ANFO 135 139 130
9 ANFO 139 132 138
10 SME 70 71 72
11 SME 61 47 51
12 SME 88 102 90
13 SME 39 23 33
14 SME 45 24 48
15 SME 66 50 62
16 SME 91 89 86
17 SME 94 100 99
18 SME 84 89 89
19 ANFO 126 121 106
20 ANFO 129 120 109
21 ANFO 90 98 89
22 ANFO 51 53 49
23 ANFO 64 82 71
24 ANFO 60 68 92
25 ANFO 88 106 90
26 ANFO 64 75 82
27 SME 130 110 133
28 SME 152 131 146
29 SME 100 83 111
30 SME 112 102 119
31 SME 107 95 114
32 SME 135 111 131

VOL. 12, NO. 1, JANUARY 2017 ISSN 1819-6608
ARPN Journal of Engineering and Applied Sciences ©2006-2017 Asian Research Publishing Network (ARPN). All rights reserved.
www.arpnjournals.com
56
Figure-6. An overview of prediction ability of the two models.
Figure-7. Scatter obtained between the actual boulder count and the predicted boulder count by ANN.
0
20
40
60
80
100
120
140
160
1 2 3 4 5 6 7 8 9 10 11 12 13 14 15 16 17 18 19 20 21 22 23 24 25 26 27 28 29 30 31 32
Bo
uld
er c
ount
Blast number
Actual boulder count
Predicted boulder count byANN
Predicted boulder count bystatistical model
0
20
40
60
80
100
120
140
160
0 20 40 60 80 100 120 140 160
Pre
dic
ted
bo
uld
er c
ount
by A
NN
Actual boulder count
R² = 0.8184

VOL. 12, NO. 1, JANUARY 2017 ISSN 1819-6608
ARPN Journal of Engineering and Applied Sciences ©2006-2017 Asian Research Publishing Network (ARPN). All rights reserved.
www.arpnjournals.com
57
Figure-8. Scatter obtained between the predictions by ANN and statistical model.
RESULTS
Rock blasting is multi-faceted phenomenon, the results of which are affected are affected by the interaction of a number of uncontrollable parameters. It can therefore be safely said that an accuracy of more than 80 % in the predictions of boulder count is sufficient. It is observed that the correlation coefficient between the actual boulder count and predicted boulder count by ANN is more than 0.9; which can be considered as satisfactory. It was also found that in case of an ANN model; an accuracy of more than 80 % was achieved in 24 predictions out of 32. The accuracy was less than 80% but was around 75 % in four predictions out of 32 cases. It is difficult to state the exact cause of unexpected variation in the predicted boulder count in the remaining four cases as blasting is a complex phenomenon and the results can be affected because of unexpected changes in uncontrollable parameters. The boulder count may vary because of the unforeseen presence of subsurface cracks/fissures, due to unexpected localized changes in the elastic properties/joint properties, etc. The predictions by ANN and the statistical model are in close agreement. The coefficient of correlation between the actual boulder count and the predicted boulder count by the statistical model exceeds 0.9 and the value of the same between predictions by ANN and the statistical model is around 0.9. The test of significance indicated that in case of ANFO and SME blasts; all the variables except the average depth added statistically significantly to the prediction of boulder count with p< 0.05. The statistical model has been developed to ascertain the accuracy of predictions by the ANN model which has nine input variables. The selection of these variables is based on the well-established research findings [8] and the presentation
of full model is the best method to reflect the range of predictors investigated [18]. Therefore the average depth which is the statistically insignificant predictor has been retained in the proposed statistical models. The accuracy of the statistical model is corroborated by the F test. The test indicates that both the models in the present form are significant since p< 0.001.
CONCLUSIONS
The artificial neural network seems to be a competence measure to predict rock fragmentation. In this study, a new ANN model was established to predict boulder count in rock blasting. The new model is a BPNN with two hidden layers with two neurons in each of the hidden layer. The model uses LM training algorithm and purelin transfer function. The model indicated an overall high correlation coefficient of 0.96. The correlation coefficient between actual and predicted number of boulder count was more than 0.90. The performance of the model was validated using a statistical model developed in SPSS which also showed a correlation coefficient around 0.9. A perusal of the results indicated that majority of the predictions by two models were in close agreement. It can therefore be concluded that the developed ANN model has satisfactory predictive abilities. The sensitivity analysis of the ANN model indicates that the spacing, burden and stemming have substantial influence on the boulder count. Further, the tests of significance indicate that the explosive distribution, height of stemming column and the ratios of spacing and burden to diameter are statistically significant in case of both ANFO and SME blast models. Due attention is therefore required to be paid to maintain the
0
20
40
60
80
100
120
140
160
0 20 40 60 80 100 120 140 160
Pre
dic
ted
bo
uld
er c
ou
nt
by
sta
tist
ica
l m
od
el
Predicted boulder count by ANN
R² = 0.7847
VOL. 12, NO. 1, JANUARY 2017 ISSN 1819-6608
ARPN Journal of Engineering and Applied Sciences ©2006-2017 Asian Research Publishing Network (ARPN). All rights reserved.
www.arpnjournals.com
58
accuracy in drilling and charging the blast holes so that the boulder count can be minimized in the referred quarries.
ACKNOWLEDGEMENT
The authors are thankful to the management of Rawan, Hirmi, Sonadih and Baikunth Limestone Quarries from where the blast records were generated. Without their unflinching support; the study could not be completed.
REFERENCES
[1] Aler J., Mouza J.D. and Arnould M. 1996.
Measurement of the fragmentation efficiency of rock
mass blasting and its mining applications, Int J of
Rock Mech and Min Sci and Geo Abstracts. 3: 125-
139.
[2] Ash R. 1963. The mechanics of the rock breakage
(Part 1), Pit and Quarry. 56(2): 98-100.
[3] Bahrami A., Monjezi M., Goshtasbi K. and
Ghazvinian A. 2011. Prediction of rock fragmentation
due to blasting using Artificial Neural Network,
Engineering with Computers. 27: 177-181.
[4] Bhandari S. 1997. Rock Fragmentation by Blasting
Engineering In: Rock Blasting Operations, A. A.
Balkema/Rotterdam/Brookfield.
[5] Castro J.T., Liste A. V. and Gonzalez A.S. 1998.
Blasting index for exploitation of aggregates, 7th Mine
Planning and Equipment Selection Symposium,
Calgary, Canada. pp. 165-168.
[6] Chakraborty A. K., Jethwa J.L., and Paithankar A. G.
1990. Effects of joint orientation and rock mass
quality on tunnel blasting, Engineering Geology. 37:
247-262.
[7] Chakraborty A.K., Raina A. K., Ramlu M.,
Choudhury P.B., Haldar A., Sahu P. and
Bandopadhyay C. 2004. Parametric study to develop
guidelines for blast fragmentation improvement in
jointed and massive formations, Engineering
Geology. 73: 105-116.
[8] Chiappetta R.F. 1998. Choosing the right delay timing
for the blasting application, optimization and
maintainingfield control, 8th High-Tech Seminar on
State-of-the Art, Blasting Technology,
Instrumentation and Explosives Applications,
Allentown PA, USA. pp. 215-254.
[9] Chung S.H. and Katsabanis P.D. 2000. Fragmentation
prediction using improved engineering formulas, Int J
for Blasting and Fragmentation. 4: 198-207.
[10] Cunningham C.V.B. 1983. The Kuz-Ram Model for
prediction of fragmentation from blasting, 1st
International Symposium on Rock Fragmentation by
Blasting, Luleå University of Technology, Luleå,
Sweden. pp. 439-453.
[11] Cunningham C.V.B. 1987. Fragmentation estimations
and Kuz-Ram Model-Four years on, 2nd International
Symposium on Rock Fragmentation by Blasting,
Keystone, Colorado. pp. 475–487.
[12] Dhekne P.Y., Pradhan M. and Jade R. 2014.
Assessment of performance of explosives by
estimating the number of oversize boulders using
ANN Model, The Indian Mining and Engineering
Journal. 53: 8-13.
[13] Dhekne P.Y., Pradhan M. and Jade R.K. 2015.
Assessment of the effect of blast hole diameter on the
number of oversize boulders using ANN Model,
Journal of the Institution of Engineers (India) Series
D, DOI 10.1007/s40033-015-0083-7.
[14] Drape N.R. and Smith Jr H. 1981. Applied Regression
Analysis, 2nd ed, John Wiley and Sons Inc, New
York, USA.
[15] Ebrahimi E., Monjezi M., Khalesi M.R. and
Armaghani D.J. 2015. Prediction and optimization of
backbreak and rock fragmentation using an Artificial
Neural Network and Bee Colony Algorithm, Bulle
Engineering geo and Environ, DOI 10,1007/s10064-
015-0720-2.
[16] Enayatollahi I., Aghajani B.A. and Asa A. 2014.
Comparison between Neural Network and multiple
regression analysis to predict rock fragmentation in
open pit mines, Technical Note, Rock Mechanics and
Rock Engineering. 47: 799-807.
[17] Esen S., Onederra I., and Bilgin H.A. 2003.
Modelling the size of crushing zone around a blast
hole, Int. J of Rock Mech and Min Sci. 40: 485-495.
[18] Forstmeier W. and Schielzeth H. 2011. Cryptic
multiple hypotheses testing in linear models:
Overestimated effect sizes and the winner's curse,
Behavioural Ecology and Sociobiology. 65: 47-55.

VOL. 12, NO. 1, JANUARY 2017 ISSN 1819-6608
ARPN Journal of Engineering and Applied Sciences ©2006-2017 Asian Research Publishing Network (ARPN). All rights reserved.
www.arpnjournals.com
59
[19] Gama D. D. 1983. Use of comminution theory to
predict fragmentation of jointed rock masses
subjected to blasting, 1st International Symposium on
Rock Fragmentation by Blasting, Luleå University of
Technology, Luleå, Sweden. pp. 565-579.
[20] Gate W., Ortiz L. and Florez R. 2005. Analysis of
rock fall and blasting back break problems, American
Rock Mechanics Conference, Vol 4, Anchorage,
Alaska. pp. 1290-1298.
[21] Ghosh A., Daemen J.J.K., and Vanzyl D. 1990.
Fractal based approach to determine the effect of
discontinuities on blast fragmentation, 31st U.S.
Symposium on Rock Mechanics: Contributions and
Challenges, Golden, Colorado. pp. 905-912.
[22] Grundstrom C., Kanchibotla S., Jankovic A. and
Thornton D.M. 2001. Blast fragmentation for
maximizing the SAG mill throughput at Porgera
Goldmine, 27th Annual Conference on Explosives and
Blasting Technique, Orlando, Florida. pp. 383-399.
[23] Hagan M.T., Demuth H.B., Beale M.H. and De Jesus
O. Neural Network Design 2nd
edition,http://hagan.okstate.edu/NNDesign.pdf.
[24] Hagan T.N. 1995. The effect of rock properties on the
design and results of tunnel blasts, J of Rock Mech
and Tunnelling Tech. 1(1): 25-39.
[25] Hall J. and Brunton I. 2002. Critical comparison of
Kruttschnitt Mineral Research Center (JKMRC) blast
fragmentation models, Fragblast: Int J for Blasting
and Fragmentation. 6: 207-220.
[26] Hamdi E. and Mouza J.D. 2005. A methodology for
rock mass characterization and classification to
improve blast results, Int J of Rock Mech and Min
Sci. 42: 177-194.
[27] Hamdi E., Mouza J.D. and Fleurisson J.A. 2001.
Evaluation of the part of blasting energy used for rock
mass fragmentation, Fragblast: The Int J of Blasting
and fragmentation. 5: 180-193.
[28] Hjelmberg H. 1983. Some ideas on how to improve
calculations of the fragment size distribution in bench
blasting, 1st International Symposium on Rock
Fragmentation by Blasting, Luleå University of
Technology, Luleå, Sweden. pp. 469-494.
[29] Hustrulid W. 1999. The Fragmentation System
Concept, In: Blasting Principles for Open Pit Mining,
A.A. Balkema, Rotterdam.
[30] Jhanwar J.C., Jethwa J.L. and Reddy A.H. 2000.
Influence of air-deck blasting on fragmentation in
jointed rocks in an open-pit Manganese mine,
Engineering Geology. 57: 13-29.
[31] Jimeno C.L., Jimeno E.L. and Carcedo F.J.A. 1995.
Controllable Parameters of Blasting, In: Drilling and
blasting of Rocks, Balkema A. A., Rotterdam.
[32] Jong Y. and Lee C. 2002. Application of Neural
Networks to prediction of powder factor and peak
particle velocity in tunnel blasting, 28thAnnual
Conference on Explosives and Blasting Technique,
Las Vegas, Nevada. 2: 67-76.
[33] Jong Y.H. and Lee C.I. 2004. Influence of geological
conditions on the powder factor for tunnel blasting,
Int J of Rock Mech and Min Sci. 41: 533-538.
[34] Kanchibotla S.S., Valery W., and Morrell S. 1999.
Modeling fines in blast fragmentation and its impact
on crushing and grinding, EXPLO 99 Conference,
Kalgoorlie, Australia. pp. 137-144.
[35] Karami A. and Afluni Z.S. 2013. Sizing of rock
fragmentation modeling due to bench blasting using
adaptive neuro-fuzzy inference system (ANFIS), Int. J
of Min Sci and Tech. 23: 809-813.
[36] Karami A. R., Mansouri H., Farsangi M.A.E. and
Nezamabadi H. 2006. Backbreak prediction due to
bench blasting: An Artificial Neural Network
approach, J of Mine, Metals and Fuels. 54: 418-420.
[37] Khandelwal M. and Singh T.N. 2006. Prediction of
blast induced ground vibrations and frequency in
opencast mine: A Neural Network Approach, J of
Sound Vibration. 289: 711-725.
[38] Kojovic T., Michaux S., and McKenzie C. 1995.
Impact of blast fragmentation on crushing and
screening operations in quarrying, EXPLO 95
Conference, AusIMM, Brisbane, Australia. pp. 427-
436.
[39] Kou S. and Rustan A. 1993. Computerised design and
result prediction of bench blasting, 4th International
Symposium on Rock fragmentation by Blasting,
Vienna, Austria. pp. 263-271.

VOL. 12, NO. 1, JANUARY 2017 ISSN 1819-6608
ARPN Journal of Engineering and Applied Sciences ©2006-2017 Asian Research Publishing Network (ARPN). All rights reserved.
www.arpnjournals.com
60
[40] Kulatilake P.H.S.W., Hudaverdi T. and Qiong W.
2012. New prediction models for mean particle size in
rock blast fragmentation, Geotech and Geological
Engineering, 30: 665-684.
[41] Kulatilake P.H.S.W., Qiong W., Hudaverdi T. and
Kuzu C. 2010. Mean particle size prediction in rock
blast fragmentation using Neural Networks,
Engineering Geology. 114: 298-311.
[42] Kuznetsov V. M. 1973. Mean diameter of fragments
formed by blasting rock, Soviet Mining Science. 9(2):
144-148.
[43] Latham J.P. and Lu P. 1999. Development of an
assessment system for the blastability of rock masses,
Int J of Rock Mech and Min Sc. 36: 41-55.
[44] Leu S.S., Lin S.F., Chen C.K. and Wang S.W. 1998.
Analysis of powder factors for tunnel blasting using
Neural Networks, Fragblast: Int J for Blasting and
Fragmentation, 2: 433-448.
[45] Lilly P.A. 1986. An empirical method of assessing
rock mass blastability, Large Open Pit Conference,
IMM, Australia. pp. 89-92.
[46] Mckenzie S. 1966. Cost of explosives-Do you
evaluate it properly? Mining Congress Journal. 52 (5):
32-41.
[47] Mishnaevsky Jr L.L. and Schmauder S. 1996.
Analysis of rock fragmentation with the use of the
theory of fuzzy sets, ISRM International Symposium
(Eurock '96), Torino, Italy. 735-740.
[48] Mishra A. K., Kumar A., and Nizami A. A. 2008.
Digital blasting technology, Conference on Emerging
Trends in Mining and Allied Industries, NIT
Rourkela. pp. 80-92.
[49] Mishra A.K. 2008. Safety engineering in mine
blasting operations, Course Material on Safe Mining
Methods, Design and Technology, IIT, Kharagpur.
[50] Moghadam M.J., Farsangi M.A.E., Mansouri H. and
Nezamabadi H. 2006. Muck -pile fragmentation
prediction using Artificial Neural Networks, J of
Mines, Metals and Fuels. 54: 421-423.
[51] Mojtabai N., Farmer I. W. and Savely J.P. 1990.
Optimisation of rock fragmentation in bench blasting,
31st U.S. symposium on Rock Mechanics
Contributions and Challenges, Golden, Colorado. pp.
897-904.
[52] Monjezi M, Singh T.N., Khandelwal M., Sinha S.,
Singh V. and Hosseini I. 2006. Prediction and
analysis of blast parameters using Artificial Neural
Network, Noise Vibration Worldwide. 37: 8-16.
[53] Monjezi M., Amiri H., Farrokhi A. and Goshtasbi K.
2010. Prediction of rock fragmentation due to blasting
in Sarcheshmeh Copper mine using Artificial Neural
Networks, Geotech and Geological Engineering. 28:
423-430.
[54] Monjezi M., Dehghan H. and Samimi N.F. 2007.
Application of TOPSIS method in controlling fly rock
in blasting operations, 7th International Science
Conference SGEM, Sofia, Bulgaria. pp. 41-49.
[55] Monjezi M., Ghafurikalajah M. and Bahrami A. 2011.
Prediction of blast-induced ground vibration using
Artificial Neural Networks, Tunnelling and
Underground Space Technology. 26: 46-50.
[56] Monjezi M., Hashemi S.M., Hashemi R., Johari M.V.
and Khandelwal M. 2014. Artificial Neural Network
as a tool for back break prediction, Geotech and Geo
Engineering. 32: 21-30.
[57] Monjezi M., Mehrdanesh A., Malek A., and
Khandelwal M. 2013. Evaluation of effects of blast
design parameters on flyrock using Artificial Neural
Networks, Neural Computing and Applications. 23:
349-356.
[58] Monjezi M., Mohamadi H.A., Barati B. and
Khandelwal M. 2014. Application of soft computing
in predicting rock fragmentation to reduce
environmental blasting side effects, Arab Journal of
Geoscience. 7: 505-511.
[59] Monjezi M., Yazdian A., and Hesami S.M. 2006. Use
of back propagation Neural Network to estimate
burden in tunnel blasting, J of Mines, Metals and
Fuels. 12: 424-429.
[60] Montgomery D.C., Peck E.A. and Vining G.G. 2006.
Introduction to Linear Regression Analysis, John
Wiley & Sons Inc, New Jersey, USA.
[61] Morin M.A. and Ficarazzo F. 2006. Monte Carlo
simulation as a tool to predict blasting fragmentation
based on the Kuz–Ram model, Computers and
Geosciences. 32: 352-359.
[62] Nie S. L. and Rustan A. 1987. Techniques and
procedures in analysing fragmentation after

VOL. 12, NO. 1, JANUARY 2017 ISSN 1819-6608
ARPN Journal of Engineering and Applied Sciences ©2006-2017 Asian Research Publishing Network (ARPN). All rights reserved.
www.arpnjournals.com
61
blasting by photographic method, 2nd International
Symposium on Rock Fragmentation by Blasting,
Keystone, Colorado. pp. 36-47.
[63] Oraee K. and Asi B. 2006. Prediction of rock
fragmentation in open pit mines using Neural
Network Analysis, 15th International Symposium on
Mine Planning and Equipment Selection (MPES),
Torino, Italy. pp. 19-24.
[64] Ouchterlony F. 2003. Influence of blasting on size
distribution and properties of muckpile fragments: A
state-of-the-art review, MinFo Project P2000-10,
Swebrec, Luleå University of Technology, Sweden.
pp. 21-48.
[65] Ouchterlony F., Niklasson B. and Abrahamsson S.
1990. Fragmentation monitoring of production blasts
at Mrica, International Symposium on Rock
Fragmentation by Blasting, Frag Blast 3, Brisbane,
Australia. pp. 283-289.
[66] Ozcelik Y. 1998. Effect of discontinuities on fragment
size distribution in open-pit blasting: A case study,
Trans of the Institution of Mining and Metallurgy.
107: 146-150.
[67] Pal R. P. 1995. Breakage assessment through cluster
analysis of joint set orientations of exposed benches
of opencast mines, Geotechnical and Geological
Engineering. 13: 79-92.
[68] Rai P. and Baghel S.S. 2004. Investigation of firing
patterns on fragmentation in an Indian opencast
limestone mine, Quarry Management Journal, UK. pp.
33-37.
[69] Raina A. K., Ramulu M., Choudhary P.B., and
Chakraborty A.K. 2002. Fragmentation prediction in
different rock masses characterized by drilling index,
7th International Symposium on Rock fragmentation
by Blasting, Met Industry Press, Beijing, China. pp.
117-121.
[70] Rustan P.A. 1998. Automatic image processing and
analysis of rock fragmentation- Comparison of
systems and new guidelines for testing the systems,
Int J for Blasting and Fragmentation, Fragblast. 2: 15-
23.
[71] Sanchidrian J.A., Segarra P. and Lopez L.M. 2007.
Energy components in rock blasting, Int J of Rock
Mech and Min Sci. 44: 130-147.
[72] Sawmliana C., Pal R.P., Singh R. K. and Singh T.N.
2007. Blast induced air overpressure and its prediction
using Artificial Neural Network, Mining Technology,
Trans, Inst, Min, Metall, A. 116: 41-48.
[73] Sayadi A., M Monjezi., Talebi N. and Khandelwal M.
2013. A comparative study on the application of
various Artificial Neural Networks to simultaneous
prediction of rock fragmentation and back break, J of
Rock Mech and Geotech Engineering. 5: 318-324.
[74] Schuhmann Jr R. 1959. Energy input and size
distribution in comminution, Am, Inst, Min, Metall,
ANNME. 214: 22-25.
[75] Shao P., Xu Z. W., Zhang H.Q. and He Y. N. 2009.
Evolution of blast-induced rock damage and
fragmentation prediction, Procedia Earth and
Planetary Science, International Conference on
Mining Science & Technology (ICMST2009),
Xuzhou, China. 1: 585-591.
[76] Singh T. N. 1995. A study of blast induced ground
vibration at Dharapani Magnesite Mine, Pitthoragarh
Himalaya, India, 3rd International Symposium on
Headwater Control, New Delhi, India. pp. 183-188.
[77] Tawadrou A.S. and Katsabanis P.D. 2005. Prediction
of surface blast patterns in Limestone quarries using
Artificial Neural Networks, Fragblast: Int J for
Blasting and Fragmentation, 9: 233-242.
[78] Thote N. R. and Singh D.P. 2000. Effect of air-
decking on fragmentation: A few case studies of
Indian mining, Explosive & Blasting Technique,
Balkema. pp. 265-270.
[79] Trivedi R., Singh T. N. and Raina A.K. 2014.
Prediction of blast induced fly rock in Indian
Limestone mines using Neural Networks, J of Rock
Mech and Geotech Engineering. 6: 447-454.
[80] Xiu S. Z., Dan H., Jian Z. and Shu Z. 2013. Combined
ANN prediction model for rock fragmentation
distribution due to blasting, J of Information and
Computational Science. 10: 3511-3518.
[81] Zhu H.B. and Wu L. 2005. Application of Gray
correlation analysis and Artificial Neural Network in
rock mass blasting, J of Coal Science and
Engineering. 11: 44-47.