Boulder County E-bike Pilot Study Resultso E-bike observations were a fraction of the total bike...
32
1 Boulder County E-bike Pilot Study Results Tina Nielsen Sadie Mae Palmatier Abraham Proffitt Michelle Marotti October 2019
Transcript of Boulder County E-bike Pilot Study Resultso E-bike observations were a fraction of the total bike...

1
Boulder County E-bike Pilot Study Results
Tina Nielsen
Sadie Mae Palmatier
Abraham Proffitt
Michelle Marotti
October 2019

2
(Page intentionally left blank.)

3
Table of Contents
Executive Summary 4 Background 5 Methods 6
Procedure: Intercept Survey 6 Procedure: Speed Observation Survey 6
Table 1: Intercept survey and speed observation data collections sites 7
Results 8 Intercept Survey 8
Activities Participated In 8 E-bike Trail Sightings 9 Level of support for allowing e-bikes on POS properties 10 Reasons for level of support 11 Visitor Conflict 12 Rate of Conflict with an e-bike 13 Age 14 Time of the Day Error! Bookmark not defined. Home Location 15 Other Comments 16
Speed Observation Survey 17
Speed Distribution Across County All Bike Types 18 Average Speed by Location 19 Average Uphill and Downhill Speeds by Bike Type 20 Average Speed by Bike Type Error! Bookmark not defined. Speed Observations US 36 Bikeway 21
Discussion & Conclusion 22 Appendix 24
A. E-Bike Pilot Study Survey Schedule Error! Bookmark not defined. B. E-bike Pilot Study Intercept Survey Sheet Error! Bookmark not defined. C. Intercept Survey Results 28 D. Speed Observation Data Sheet 29

4
Executive Summary
In December 2018, Boulder County Commissioners approved a one-year pilot study to allow e-bikes on certain county open space trails on the plains starting January 1st, 2019. During the pilot period, staff studied visitor and trail impacts of e-bikes on county trails utilizing three methodologies: a visitor intercept survey, a speed observation study, and a phone survey of Boulder County residents. The phone survey was conducted by Drake Research and Strategy Inc. and the results are in a separate report on the Parks & Open Space E-bike page. The main goal of this pilot study was to assess knowledge of trail use policies, trail use behaviors, and perceptions regarding allowing class 1 and class 2 e-bikes on paved and natural surface trails in Boulder County.
The objectives of this pilot study include the following: 1. Collect a statistically significant sample of opinions from visitors to Boulder County
open space properties regarding e-bikes, recreation preferences, and recreation conflict;
2. Use this data to inform discussions about updating the definition of “passive recreation” in the Open Space Element of the Boulder County Comprehensive Plan;
3. Utilize this data to better integrate visitor opinions, values, and recreation goals into the ongoing management and maintenance of open space properties, with the possibility of adding speed control measures, additional trail courtesy signage, and bicycle education opportunities.
Key Findings: ● Intercept Survey
o Nearly three-quarters of POS users hike, bike, or walk the dog while on the trails
o Overall, POS trail users support or are neutral about allowing e-bikes on the plains and regional trails, but do not support allowing e-bikes on the foothills trails
o The majority of POS trail users (96%) did not experience conflict on the day of the survey
● Speed Observation Study o E-bike observations were a fraction of the total bike observations across
Boulder County. Only 12 e-bike speeds were recorded out of a total of 503 bike observations
o The average speed for all bike types and inclines was 14.8 mph. By bike type, the average speed of conventional bikes was 14.9 mph and 13.8 mph for e-bikes.

5
Background The governor signed Bill HB17-1151, Electrical Assisted Bicycles Regulation Operation April 4, 2017. This bill changes how e-bikes are classified in the Colorado Revised Statute, defines three classes of electrical assisted bicycles, and grants permission for class 1 and class 2 e-bikes to be ridden on bike or pedestrian paths where bikes are authorized to travel. The bill also provides local governments authority to prohibit class 1 and class 2 e-bikes on paths under their jurisdiction. Class 3 e-bikes are not allowed on bike or pedestrian paths unless local governments act to allow them.
Motorized recreation is not allowed on Boulder County open space trails, with exceptions for individuals with mobility disabilities. The Open Space Element of the Boulder County Comprehensive Plan defines passive recreation in part as “non-motorized outdoor recreation with minimal impact on the land, water, or other resources that creates opportunities to be close to nature, enjoy the open space features, and have a high degree of interaction with the natural environment” and may include bicycling if specifically designated. In December 2017, Boulder County Parks & Open Space (BCPOS) staff proposed updates to POSAC about the Rules & Regulations including a clarification that bicycles are defined as being exclusively human-powered wheeled devices. These clarifications maintained the prohibited status of e-bikes on Boulder County Parks & Open Space trails, with the exceptions of individuals with mobility disabilities. Based on the high public interest and a significant number of comments against the prohibition of e-bikes following the December Parks & Open Space Advisory Committee meeting, POS staff decided to conduct a community engagement process to consider if, and where, e-bikes could be considered on Boulder County trails.
In December 2018, Boulder County Commissioners approved a one-year pilot study to allow e-bikes on certain county open space trails on the plains starting January 1, 2019. From April to September 2019, staff studied visitor and trail impacts of e-bikes on county trails utilizing three methodologies: a visitor intercept survey, a speed observation study, and a phone survey. The main goal of this pilot study was to assess trail use behaviors, monitor visitor conflict, and gauge public perceptions regarding allowing class 1 and class 2 e-bikes on paved and improved surface trails in Boulder County.
In addition to assessing the effects of allowing e-bikes on POS trails, a secondary goal of the pilot study was to document the speed of all cyclists using the trail. The speed observation study sought to observe the speeds of several bike types (e-bike, conventional, recumbent) to discern whether there is a speed differential between cyclists.

6
Methods
Visitor Intercept Survey Starting April 2019, Boulder County employees were briefed on the study objectives, trained on proper intercept survey and speed observation protocols, and provided with specific trail locations for conducting surveys by Michelle Marotti (Education and Outreach/Visitor Studies). Survey dates were randomized to gain a broad perspective of opinions. Survey times were divided into three separate blocks: morning (8:00am - 12:00pm), afternoon (12:00pm - 4:00pm), and evening (4:00pm - 8:00pm). Within these four-hour blocks, surveys were conducted for two consecutive hours. In addition to different times of the day, surveys were scheduled on both weekdays and weekends. For the survey schedule, see Appendix A. Survey locations were chosen to represent regional and plains trails (see Table 1). For the intercept survey instrument, see Appendix B. A total of 427 complete responses were collected.
Speed Observation Survey Following the same survey schedule as the intercept survey, starting in early June, speed observations were conducted for two-hour periods either preceding or following the intercept survey shift. Speed observations were conducted at the same POS properties, but at slightly different coordinates (Table 1) in order to gain a representative view of trail use and capture a potential discrepancy between uphill and downhill speeds. At each speed observation location, speeds of oncoming cyclists were taken 100 ft away from the observer. The type of bike was recorded (conventional vs. recumbent vs. electric) and cyclists were noted as going uphill or downhill. Other landscape information including the trail condition (wet vs. dry) and weather were recorded (see Appendix D).
In addition to surveying the locations outlined in the intercept survey schedule, speed observations were also taken at Betasso Preserve and on the US 36 Bikeway. Betasso Preserve was selected to compare bike speeds in the foothills to the regional and plains trails. This foothills location was selected due to the good sight-distance on the trail and since there has been previous trail user concern about cyclists’ speeds. Observations on the US 36 bikeway were taken to observe cyclists speed on a paved, multi-use, commuting path. In addition, due to e-bikes popularity as a commuting tool, POS staff anticipated observing more e-bikes on the US 36 bikeway than BCPOS trails, allowing for a more complete understanding of e-bike speeds.
Speed observations were taken using a Bushnell Velocity speed gun. Prior to using the speed gun, its accuracy was tested against the radar gun used by the Boulder County Deputy Sheriffs at Coalton Trailhead Superior, CO. After several tests, the Bushnell speed gun was deemed accurate enough for this study. A total of 503 speed observations were collected.
7
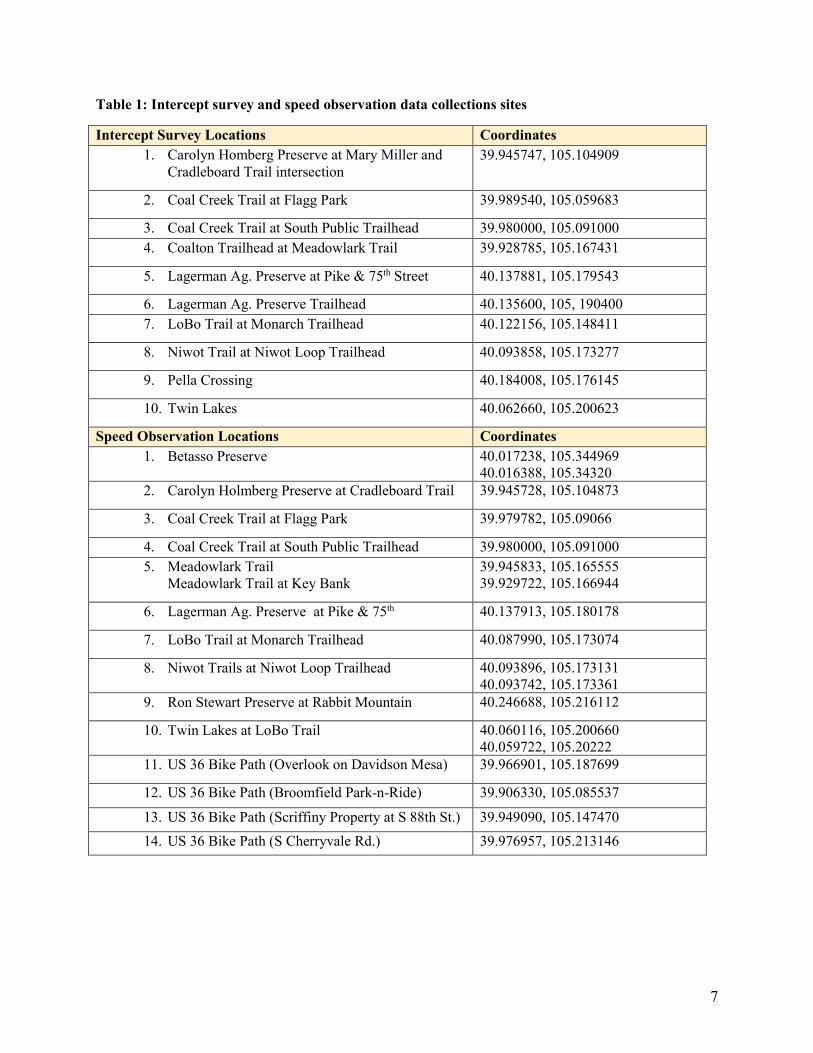
Table 1: Intercept survey and speed observation data collections sites
Intercept Survey Locations Coordinates 1. Carolyn Homberg Preserve at Mary Miller and
Cradleboard Trail intersection 39.945747, 105.104909
2. Coal Creek Trail at Flagg Park 39.989540, 105.059683
3. Coal Creek Trail at South Public Trailhead 39.980000, 105.091000 4. Coalton Trailhead at Meadowlark Trail 39.928785, 105.167431
5. Lagerman Ag. Preserve at Pike & 75th Street 40.137881, 105.179543
6. Lagerman Ag. Preserve Trailhead 40.135600, 105, 190400 7. LoBo Trail at Monarch Trailhead 40.122156, 105.148411
8. Niwot Trail at Niwot Loop Trailhead 40.093858, 105.173277
9. Pella Crossing 40.184008, 105.176145
10. Twin Lakes 40.062660, 105.200623
Speed Observation Locations Coordinates 1. Betasso Preserve 40.017238, 105.344969
40.016388, 105.34320 2. Carolyn Holmberg Preserve at Cradleboard Trail 39.945728, 105.104873
3. Coal Creek Trail at Flagg Park 39.979782, 105.09066
4. Coal Creek Trail at South Public Trailhead 39.980000, 105.091000 5. Meadowlark Trail
Meadowlark Trail at Key Bank 39.945833, 105.165555 39.929722, 105.166944
6. Lagerman Ag. Preserve at Pike & 75th 40.137913, 105.180178
7. LoBo Trail at Monarch Trailhead 40.087990, 105.173074
8. Niwot Trails at Niwot Loop Trailhead 40.093896, 105.173131 40.093742, 105.173361
9. Ron Stewart Preserve at Rabbit Mountain 40.246688, 105.216112
10. Twin Lakes at LoBo Trail 40.060116, 105.200660 40.059722, 105.20222
11. US 36 Bike Path (Overlook on Davidson Mesa) 39.966901, 105.187699
12. US 36 Bike Path (Broomfield Park-n-Ride) 39.906330, 105.085537
13. US 36 Bike Path (Scriffiny Property at S 88th St.) 39.949090, 105.147470 14. US 36 Bike Path (S Cherryvale Rd.) 39.976957, 105.213146

8
Results
Intercept Survey
For the count of responses for the all the results listed below, please see Appendix C.
Activities on Day of Survey
Hiking was the most common activity for survey respondents. Biking and walking the dog
were the second and third most common, respectively. The least common activity was e-
biking, with only four survey respondents (Fig. 1).
Figure 1. POS survey respondents’ activities Respondents were able to choose more than one response (n=427).
48.5%
21.8%
5.2% 6.1%0.9%
26.5%
1.4%
18.7%
35.4%
3.5% 3.5% 3.3%
0%
10%
20%
30%
40%
50%
60%
Activities
Perc
ent o
f Use
rs

9
E-bike Sightings on Trails
Only 4.5% of the total survey respondents had seen an e-bike and 4.9% weren’t sure if they
had seen one on the day of the survey. The majority of trail users (90.6%) did not see an e-
bike on the survey day (Fig. 2). As mentioned above, four survey respondents were riding e-
bikes.
Figure 2. Percent of survey participants who had/had not seen an e-bike or weren’t sure if they had seen one on the day of survey (n=426)
4.5%
4.9%
90.6%
Yes
Not sure
No
0% 20% 40% 60% 80% 100%
E-bi
ke S
ight
ing
Percent of Users

10
Level of Support for Allowing E-bikes on POS Properties
Level of support was evaluated for three different types of trails (flat trails in the plains,
regional trails, and foothills trails) using a Likert scale ranging from strongly support to
strongly oppose.
42% of respondents support allowing e-bikes on flat trails on the plains and 41% support
allowing them regional trails, while 28% and 27% respectively are opposed and nearly one-
third are neutral or unsure. Feelings about foothills trails is the reverse: 49% opposed
allowing e-bikes and 29% were in support, with nearly one-quarter neutral or unsure (Fig. 3).
Figure 3. Support for Allowing e-bike on POS Trails (n=427).
5%
4%
4%
19%
27%
25%
49%
27%
28%
26%
41%
42%
0% 10% 20% 30% 40% 50%
Foothill trails
Regional trails
Flat trails on the plains
Level of Support
Loca
tion
Support Oppose Neutral DK/NS

11
Reasons for Level of Support
Trail users were given an opportunity to explain their level of support for each of the POS
properties. Following their answers, comments were either for e-bikes, against e-bikes, and
neutral towards e-bikes. In total, 40% of respondents left positive comments, 13% left neutral
comments, 39% left negative, and 8% were neither. Responses that were deemed
representative of common sentiments expressed within each level of support are documented
below. (Please note these are direct quotes from the intercept surveys and have not been
edited for coherence or grammar.)
Representative Responses- Pro e-bike access • “While there are always people who go too fast on e-bikes, when responsibly ridden, e-
bikes open the experience to more people which is positive!” • “I feel like bike or e-bike is not the problem or the answer. It is and always will be the
human attached to the mechanism.” • “I currently use an e-bike in place of a car. Limiting access means more pollution or less
safe roads.” • I'm in my 60's and ebike (specifically mtn ebike) has been a life changer. e-bike riders are
by and large responsible riders “ Representative Responses- Con e-bike access
• “E-bikes are "cheating". If disabled, elderly, etc. e-bikes may be ok. If able bodied please use e- bikes on less "nature-friendly" areas”
• “They are dangerous. People can go too fast. There are already a lot of bicyclists that do not follow proper right-of-way procedures. E-bikes would exacerbate this issue.”
• “can damage trails when wet; can degrade experience for those biking, hiking; awareness of e-bike riders may be low; many people who use trails are seeking space away from motorized vehicles“
• “E-bikes should be reserved for commuting on the streets. No electric vehicles should be on trails”
Representative Responses- Ambivalent- e-bike access • “I feel like e-bikes are fine on flat trails, for commuting or enjoying the outdoors, as long
as they don't pose a threat to hikers or other cyclists due to speed. I feel like e-bikes on mountain trails could lead to more rescue situations.“
• “I’d have to see and hear one to decide”

12
Visitor Conflict
Conflict was defined as “sometimes, visitors interfere with one another’s goals on the trail,
causing unpleasant experience.” The majority of trail users (96%) did not experience conflict
or were not sure if they had (2.1%) on the day of the survey (Fig. 4). Of the 1.9% of
individuals who did experience conflict, their issues arose from the following three
categories:
1. Off-leash dogs or dogs crowding the path
2. Other trail user was wearing headphones or blasting music and couldn’t hear the
individual approaching
3. Cyclists not announcing themselves when passing
Figure 4. Visitor Conflict on POS Trails (n=425)
1.9%
2.1%
96.0%
Yes
Not sure
No
0% 20% 40% 60% 80% 100% 120%
Expe
rienc
e of
Con
flict
Percent of Users

13
Rate of Conflict with an E-bike
Of those trail users who did experience conflict, about 93% did not experience conflict with
an e-bike and about 7% were not sure if their experience constituted as a conflict (Fig. 5).
Figure 5. Of those who experienced conflict on the day of survey, percent of those who experienced conflict with an e-bike (n=14).
0.0%
7.1%
92.9%
Yes
Not sure
No
0% 20% 40% 60% 80% 100%
Res
pons
e
Percent of Users

14
Age
Most of the surveyed trail users were middle aged (53%), or young adults (25%), followed
by adults age 65 and older .
Figure 6. Age of Survey Respondents (n=427)
1.6% 3.0%
24.8%
52.7%
17.8%
16-19 20-24 25-44 45-64 65+0%
10%
20%
30%
40%
50%
60%
Age Group
Perc
ent o
f Use
rs
15
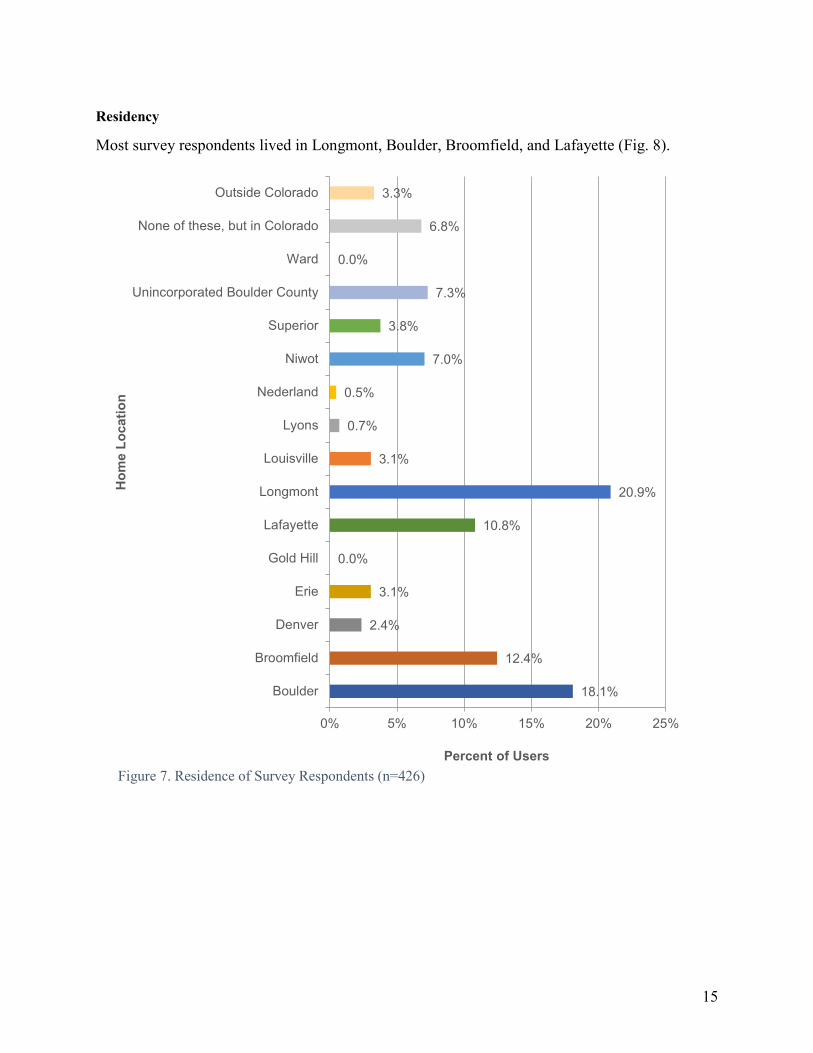
Residency
Most survey respondents lived in Longmont, Boulder, Broomfield, and Lafayette (Fig. 8).
18.1%
12.4%
2.4%
3.1%
0.0%
10.8%
20.9%
3.1%
0.7%
0.5%
7.0%
3.8%
7.3%
0.0%
6.8%
3.3%
Boulder
Broomfield
Denver
Erie
Gold Hill
Lafayette
Longmont
Louisville
Lyons
Nederland
Niwot
Superior
Unincorporated Boulder County
Ward
None of these, but in Colorado
Outside Colorado
0% 5% 10% 15% 20% 25%
Hom
e Lo
catio
n
Percent of UsersFigure 7. Residence of Survey Respondents (n=426)

16
Other Comments
Trail users were also given the opportunity to list any other comments regarding Parks &
Open Space trails and/or management. The following were the most common response
categories:
1. The speed and on-trail etiquette of both conventional bikes and e-bikes is a concern
2. Gratitude for the continued management of the trails
3. More bathrooms at BCPOS trailheads
4. Concerns about off-leash dogs
5. Trail users had experienced conflict on a different day than they were surveyed. Often
this point of conflict occurred when a cyclist passed another user. Both the passing
cyclists and the pedestrians being passed reported conflicts prior to the survey dates.

17
Speed Observation Survey
Speed observations were recorded starting in early June until mid-September. During this
period, a total of 504 speed observations were taken of conventional bikes and e-bikes. There
were 2 observations of recumbent bikes, and a singular one-wheeled skateboard, however,
their speeds were omitted from the analysis. Below, these observations are analyzed by,
average speed by bike type, speed frequency by bike type, average speed by location and
bike type, and average speed of downhill vs. uphill observations by bike type.
Average Speed by Bike Type
The average e-bike speed was 13.8 mph (n=12) and the average conventional bike speed was
14.9 mph (n=491). Due to an insufficient amount of data, no statistical tests were conducted.
Figure 8. Average speed (mph) by bike type [n(conventional)=492, n(electric)=12]
14.913.8
02468
1012141618
Conventional Electric
Aver
age
Spee
d (M
PH)
Bike Type

18
Speed Distribution
A distribution of electric and conventional bike speed across all locations illustrates the
frequency of bike speeds (Fig. 9). The most frequent conventional bike speed was 15 mph
(n=76). The most frequent e-bike speed was 13 mph (n=4). The range of conventional bikes
speeds includes a max of 26 mph (n=1) and 6 mph (n=3). The range of electric bike speeds
spanned 17 mph (n=1) and 11 mph (n=1).
Figure 9. Speed frequency for conventional and electric bikes in Boulder County [n(conventional)=492, n(electric)=12]
0
10
20
30
40
50
60
70
80
1 2 3 4 5 6 7 8 9 10 11 12 13 14 15 16 17 18 19 20 21 22 23 24 25 26 27 28 29 30M
ore
Freq
uenc
y
Speed (MPH)
Conventional Electric

19
Average Speed by Location
14.915.9
14.6 14.8 14.8 14.513.2
11
13.3
16
13.8
0
2
4
6
8
10
12
14
16
18
LagermanPreserve
BetassoPreserve
CarolynHolmbergPreserve
Coal Creek Trail LoBo Trail MeadowlarkTrail
Niwot Trails
Spee
d (M
PH)
Conventional Electric
The highest average speed of e-bikes was recorded on the Meadowlark Trail near Coalton Trailhead (M=16.0 mph), the lowest average
e-bike speed was recorded at Carolyn Holmberg Preserve (M=11 mph). The highest average conventional bike speeds were recorded at
Betasso Preserve (M=15.9 mph), the lowest average conventional bike speeds were observed at Niwot Trails (M=13.2 mph).
Figure 10. Average speed of conventional and electric bikes by observation location [n(conventional)=492, n(electric)=12]

20
Average Uphill and Downhill Speeds by Bike Type
The average speed for all bike types was 14.8 mph. When analyzing by bike type and incline, the average uphill speed of conventional bikes was 12.9 mph and 13.8 mph for e-bikes. For average downhill speeds, conventional bikes traveled at 15 mph on average, while e-bikes traveled at a slower average speed of 13.5 mph. Due to an insufficient number of data points for electric bike speeds, no statistical tests were conducted.
Figure 11. Average uphill and downhill speeds for electric and conventional bikes across all survey locations [n(electric uphill)=10, n(conventional uphill)=152, n(electric downhill)= 2, n(conventional downhill)=339]
13.8
12.9
13.5
15
11.5
12
12.5
13
13.5
14
14.5
15
15.5
Electric Conventional Electric Conventional
Uphill Downhill
Spee
d (M
PH)

21
Speed Observations on US 36 Bikeway
The average speed for conventional bikes and e-bikes used for commuting or recreation
purposes on the US 36 bikeway were 15.7 and 16.9 mph respectively (Table 2)
Table 2. Electric and conventional bike speeds on the US 36 Bikeway
Electric Conventional Mean 16.9 15.7
Minimum 10 10 Maximum 27 29
.

22
Discussion & Conclusion
In Boulder County, most POS trail users either hike, bike, or walk their dog on POS trails. The majority of respondents hadn’t seen an e-bike on the survey date, nor had any trail users perceived personally experiencing conflict with an e-bike and very few users experienced any conflict at all. However, there were many comments from respondents expressing concern about the safety speed, and on-trail etiquette of both e-bikes and conventional bikes on the trail. Several other trail users pointed out it is the rider, not the bike that creates adverse situations. These comments suggest that whatever policy recommendations follow this pilot period, strategies to address these bike etiquette concerns must be included.
When asked to rank their level of support for allowing e-bikes on certain types of POS properties, respondents generally supported or were neutral about allowing e-bikes on flat trails in the plains and on regional trails. Many respondents commented that allowing e-bikes could aid in getting cars off the road and allow more people to enjoy POS properties. Conversely, the largest portion of survey respondents did not support allowing e-bikes in the foothill properties. Heeding several trail-user comments, this sentiment follows a concern that e-bikes will exacerbate crowding in the foothills, or their speed differential will adversely impact other trail users.
Given that speed and safety was a top concern in the intercept study, the speed observation survey lends several key takeaways. First, the speed of all bike types varies across the county. The highest speeds were documented on the US 36 bikeway which is a paved trail used mostly for commuting. Given that the US 36 bikeway is not exclusively under the jurisdiction of Boulder County and allows class 3 e-bikes, its importance in this analysis is a helpful comparison, though not indicative of the speed profile of Boulder County cyclists. The highest speeds on Parks & Open Space trails were observed at Betasso Preserve. Despite not allowing e-bikes on this property, POS staff felt it was helpful to compare bike speeds on a foothills property given that these areas are usually more crowded with higher conflict ratings. These higher speeds likely occurred given that these Betasso observations were recorded at two downhill locations and were mountain bikers only. However, even the average speeds at Betasso were around 15 mph, a speed that is often cited as reasonable. The lowest speeds were recorded at Niwot Trails which are relatively flat and feature a mixture of cyclists.
Secondly, this study found average conventional bike speeds to be higher than average e-bike speeds. However, on uphill slopes, e-bikes were on average faster than conventional bicycles. On downhill slopes, the opposite was found to be true, with average conventional bike speeds faster than average e-bike speeds. Given that total e-bike observations were a fraction of the overall speed observations, at just12 total e-bike observations, this data should not be broadly interpreted, nor should it be used as evidence for a speed differential between conventional

23
bike and e-bikes. When incorporating these conclusions into policy recommendations, it is imperative that the limitations of this data be considered.
Finally, in regard to the range of speeds observed, the highest e-bike speed observed was 17 mph and the fastest conventional bike speed 26 mph. The slowest observed speeds were 11 mph for e-bikes and 6 mph for conventional bikes. Overall, there were far fewer e-bikes at all locations (n=12) than conventional bike speed observations (n=491). This finding, in conjunction with the small percent of trail users who had seen an e-bike while on the trail, suggests that the market penetration of e-bikes is still relatively low on Boulder County trails.

24
Appendix A: E-bike Pilot Study Survey Schedule April: Friday 4/19 Carolyn Holmberg Preserve (morning 8 – 12) - John Saturday 4/20 Niwot Trails (evening 4 – 8) - Molly Wednesday 4/24 Pella Crossing (evening 4 – 8) - Molly Thursday 4/25 Lagerman Pike and 75th (evening 4 – 8) - John Saturday 4/27 Lobo (morning 8 – 12) - Emily Sunday 4/28 Twin Lakes (afternoon 12 – 4) - Emily Sunday 4/28 Coal Creek Trail – South Public Road (evening 4 – 8) – John May: Thursday 5/9 Niwot Trails (morning 8 – 12) - Emily Saturday 5/11 Lagerman (afternoon 12 – 4) Friday 5/17 Twin Lakes (afternoon 12 – 4) – John Saturday 5/18 Coal Creek Trail – Flagg Park (afternoon 12 – 4)- AB Sunday 5/19 Carolyn Holmberg Preserve (morning 8 – 12)-SMP Tuesday 5/21 Coalton (morning 8 – 12) Saturday 5/25 Pella Crossing (morning 8-12)-AP Sunday 5/26 Lobo (evening 4-8)-SMP Wednesday 5/29 Coalton (evening 4 – 8)-AP June: Sunday 6/2 Twin Lakes (weekend morning 8 – 12)-SMP Tuesday 6/4 Lagerman (weekday afternoon 12 – 4)-AP Sunday 6/9 Coalton (weekend morning 8 – 12)-SMP Monday 6/10 LoBo (weekday morning 8 – 12)-AP Saturday 6/15 Carolyn Holmberg Preserve (weekend afternoon 12 – 4)-AP Tuesday 6/18 Coal Creek Trail – South Public Road (weekday evening 4 – 8)-SMP Wednesday 6/26 Niwot Trails (weekday afternoon 12 – 4)-SMP Saturday 6/29 Pella Crossing (weekend evening 4 – 8)-SMP July: Thursday 7/4 Lagerman Pike and 75th (weekday morning 8 – 12)-AP Sunday 7/7 Pella Crossing (weekend afternoon 12 – 4)-AP Saturday 7/13 LoBo (weekend afternoon 12 – 4)-AP Sunday 7/14 Carolyn Holmberg Preserve (weekend evening 4 – 8)-SMP Tuesday 7/16 Coalton (weekday afternoon 12-4)-SMP Sunday 7/21 Niwot Trails (weekend morning 8 – 12)-SMP Saturday 7/27 Twin Lakes (weekend evening 4 – 8)-AP Wednesday 7/31 Coal Creek Trail – Public Road (weekday morning 8 – 12)-AP August:

25
Thursday 8/1 Carolyn Holmberg Preserve (weekday evening 4 – 8)-AP Saturday 8/3 Lagerman Pike and 75th (weekend morning 8 – 12)-AP Tuesday 8/6 LoBo (weekday evening 4 – 8)-SMP Friday 8/16 Niwot (weekday evening 4 – 8)-SMP Saturday 8/17 Coalton (weekend evening 4 – 8)-AP Sunday 8/18 Coal Creek Trail – Flagg Park (weekend morning 8 – noon)-SMP Monday 8/19 Pella Crossing (weekday afternoon 12 – 4)-AP Wednesday 8/28 Twin Lakes (weekday morning 8 – noon)-SMP September: Sunday 9/1 Niwot Trails (weekend afternoon 12 – 4)-SMP Monday 9/2 US 36 Scriffiny Property (weekday evening 4 – 8)-SMP Saturday 9/7 US 36 Broomfield Park & Ride (weekend afternoon 12 – 4)-AP Sunday 9/8 US 36 Overlook (weekend evening 4 – 8)-SMP Tuesday 9/910 Coal Creek Trail—Flagg Park (weekday afternoon 12 – 4)-AP Friday 9/13 US 36 Cherryvale Intersection (weekday morning 8 – 12)-SMP

26
Appendix B. E-bike Pilot Study
(Page 1)

27
(Page 2)

28
Appendix C: Intercept Survey Results Which activities did you participate in today? (check all that apply) Answer Choices Responses Hike 48.5% 207 Run 21.8% 93 Family Gathering 5.2% 22 Photography/Art 6.1% 26 E-Bike 0.9% 4 Walk the Dog 26.5% 113 Ride a Horse 1.4% 6 View Wildlife 18.7% 80 Bike 35.4% 151 Fish 3.5% 15 Picnic 3.5% 15 Other (please specify) 3.3% 14
Answered 427 Skipped 0
Which activity listed above in Question 1 do you consider your primary activity today? Answer Choices Responses Hike 29.58% 126 Run 15.73% 67 Family Gathering 0.23% 1 Photography/Art 0.70% 3 E-Bike 0.70% 3 Walk the Dog 16.20% 69 View wildlife 4.46% 19 Bike 27.70% 118 Fish 2.82% 12 Picnic 0.00% 0 Other (please specify) 1.88% 8
Answered 426 Skipped 1
Did you see any e-bikes on the trail today?
Answer Choices Responses Yes 4.5% 19 Not sure 4.9% 21 No 90.6% 386
Answered 426 Skipped 1

29
Thinking about Boulder County Parks and Open Space properties, please indicate your level of support or opposition for allowing e-bikes on the three types of trails listed. Strongly
Oppose Oppose Neutral Support Strongly
Support Not sure
Flat Trails in the plains
11.5% 49 16.9% 72 25.1% 107 26.2% 112 15.9% 68 4.5% 19
Regional Trails
10.1% 43 17.4% 74 27.2% 116 24.7% 105 16.7% 71 4.0% 17
Foothills and Mountain Trails
23.0% 98 25.8% 110 19.9% 85 15.9% 68 10.8% 46 4.7% 20
Answered 427 Skipped 0
Sometimes, visitors interfere with one another’s goals on the trail, causing unpleasant experiences. This is generally referred to as “conflict.” Did you experience conflict at this park today? Answer Choices Responses Yes 1.9% 8 Not sure 2.1% 9 No 96.0% 408
Answered 425 Skipped 2
If described conflict with someone riding a bike, was the biker using an e-bike?
Answer Choices Responses Yes 0.00% 0 No 92.86% 13 Not sure 7.14% 1
Answered 14
Skipped 413
Age Answer Choices Responses 16-19 1.6% 7 20-24 3.0% 13 25-44 24.8% 106 45-64 52.7% 225 65+ 17.8% 76
Answered 427 Skipped 0

30
Where do you live?
Answer Choices Responses Boulder 18.1% 77 Broomfield 12.4% 53 Denver 2.4% 10 Erie 3.1% 13 Gold Hill 0.0% 0 Lafayette 10.8% 46 Longmont 20.9% 89 Louisville 3.1% 13 Lyons 0.7% 3 Nederland 0.5% 2 Niwot 7.0% 30 Superior 3.8% 16 Unincorporated Boulder County 7.3% 31 Ward 0.0% 0 None of these, but in Colorado 6.8% 29 Outside Colorado 3.3% 14
Answered 426 Skipped 1
Boulder County Parks and Open Space E-Bike Location
Answer Choices Responses Coal Creek South Public Trailhead 5.15% 22 Coal Creek Trail at Flagg Park 3.98% 17 Lobo 11.94% 51 Carolyn Holmberg Preserve 18.03% 77 Lagerman Agricultural Preserve Trailhead 4.22% 18 Lagerman Agricultural Preserve Pike and 75th 5.39% 23 Pella Crossing 14.99% 64 Niwot 10.54% 45 Twin Lakes 14.52% 62 Coalton (Meadowlark Trail) 11.24% 48
Answered 427 Skipped 0

31
Time of Day
Answer Choices Responses Morning (8:00 - noon) 44.7% 190 Afternoon (noon - 4:00) 25.9% 110 Evening (4:00 - 8:00) 29.4% 125
Answered 425 Skipped 2
32
1
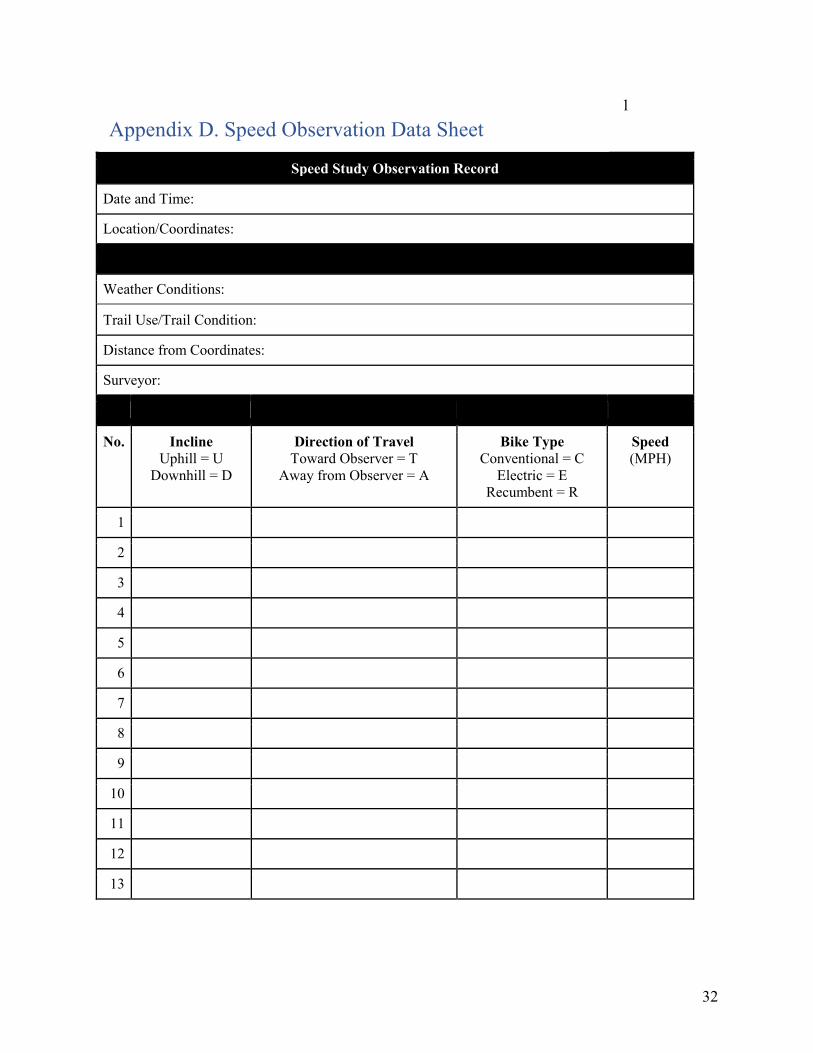
Speed Study Observation Record
Date and Time:
Location/Coordinates:
Weather Conditions:
Trail Use/Trail Condition:
Distance from Coordinates:
Surveyor:
No. Incline Uphill = U
Downhill = D
Direction of Travel Toward Observer = T
Away from Observer = A
Bike Type Conventional = C
Electric = E Recumbent = R
Speed (MPH)
1
2
3
4
5
6
7
8
9
10
11
12
13
Appendix D. Speed Observation Data Sheet