Bottleneck Prediction Using the Active Period Method in ...€¦ · Ralph Richter, Jacqueline...
14
Bottleneck Prediction Using the Active Period Method in Combination with Buffer Inventories Christoph Roser 1 , Kai Lorentzen 2 , David Lenze 3 Jochen Deuse 3 , Ferdinand Klenner 4 , Ralph Richter 5 , Jacqueline Schmitt 3 , Peter Willats 3 1 Karlsruhe University of Applied Sciences, Karlsruhe, Germany (Corresponding Author) [email protected] 2 Robert Bosch GmbH, Stuttgart, Germany [email protected] 3 TU Dortmund University, Dortmund, Germany [email protected] 4 BMW Group, Munich, Germany [email protected] 5 Robert Bosch GmbH, Stuttgart, Germany [email protected] Abstract. Knowing the bottleneck is one of the keys to improving a production system. The active period method is one approach to detect shifting bottlenecks that most other bottleneck detection methods have problems with. Yet, like many other methods, these detections are limited to detecting the past and present bot- tlenecks. In this paper, we combined the active period method with the buffer
Transcript of Bottleneck Prediction Using the Active Period Method in ...€¦ · Ralph Richter, Jacqueline...

Bottleneck Prediction Using the Active Period Method in
Combination with Buffer Inventories
Christoph Roser1, Kai Lorentzen2, David Lenze3 Jochen Deuse3, Ferdinand Klenner4,
Ralph Richter5, Jacqueline Schmitt3, Peter Willats3
1Karlsruhe University of Applied Sciences, Karlsruhe, Germany
(Corresponding Author)
2Robert Bosch GmbH, Stuttgart, Germany
3TU Dortmund University, Dortmund, Germany
4BMW Group, Munich, Germany
5Robert Bosch GmbH, Stuttgart, Germany
Abstract. Knowing the bottleneck is one of the keys to improving a production
system. The active period method is one approach to detect shifting bottlenecks
that most other bottleneck detection methods have problems with. Yet, like many
other methods, these detections are limited to detecting the past and present bot-
tlenecks. In this paper, we combined the active period method with the buffer

Preprint of Roser, Christoph, Kai Lorentzen, David Lenze, Jochen Deuse, Ferdinand Klenner, Ralph Richter, Jacqueline Schmitt, and Peter Willats. “Bottleneck Prediction Using the Active Period Method in Combination with Buffer Inventories.” In Proceedings of the International Conference on the Advances in Production Management System. Hamburg, Germany, 2017.
inventories and free buffer spaces of the adjacent inventories to statistically pre-
dict not only an upcoming change of the bottleneck, but also where the bottleneck
will move to.
Keywords: bottleneck detection, inventory, bottleneck prediction, active period
method, bottleneck walk
1 Introduction and Literature Review
Bottleneck1 detection is the key to improving output in any production system,
and also the basis to predict the shifting of a bottleneck. Only the improvement of the
throughput of a bottleneck process will lead to an improvement of the throughput of the
entire system. Unfortunately, real-world systems are dynamic and rarely have a single,
permanent bottleneck. Instead, the bottleneck shifts between different processes. There-
fore, we define the bottleneck as follows:
Bottlenecks are processes that influence the throughput of
the entire system. The larger the influence, the more sig-
nificant the bottleneck[1] [2] [3] [4].
To detect shifting bottlenecks, it is necessary to determine how the momentary
bottleneck changes over time. Hence, it is necessary to determine the momentary or
1 Please note that throughout this paper we will occasionally abbreviate “bottleneck” as “BN” in
graphics.

Preprint of Roser, Christoph, Kai Lorentzen, David Lenze, Jochen Deuse, Ferdinand Klenner, Ralph Richter, Jacqueline Schmitt, and Peter Willats. “Bottleneck Prediction Using the Active Period Method in Combination with Buffer Inventories.” In Proceedings of the International Conference on the Advances in Production Management System. Hamburg, Germany, 2017.
real-time bottleneck. Due to the nature of the shifting bottleneck, however, it is not
possible to determine momentary bottlenecks using long-term averages.
Unfortunately, many bottleneck detection methods presented in academic pub-
lications or used in industry are based on long-term averages, as for example the aver-
age cycle time or utilization [4] [5] [6] [7] [8], total waiting time [5], average waiting
time [9], average length of the queue [10] [11], or combinations thereof [12], and aver-
age time blocked or starved [13] [14] [15]. Overviews of different bottleneck detection
methods can be found, for example, in [3] [16] [17].
There are very few methods available that are actually able to detect the mo-
mentary bottlenecks. These are the active period method and the bottleneck walk. The
active period method determines the momentary bottleneck through the process that
has currently the longest period without interruption through waiting times (the active
period) [18] [19] and a simplified variant thereof [20]. This method is very precise but
has high requirements on the quality of the data.
The bottleneck walk looks at both processes and inventories to determine the
direction in which the bottleneck is likely to be found [1] [21]. This approach is very
well suited for practical use in flow lines, although it has difficulties with job shop-type
production systems. These two methods consistently outperform other bottleneck de-
tection methods [16] [3] [22]. Within this paper we will use the active period method,
and hence will present this approach in more detail below.

Preprint of Roser, Christoph, Kai Lorentzen, David Lenze, Jochen Deuse, Ferdinand Klenner, Ralph Richter, Jacqueline Schmitt, and Peter Willats. “Bottleneck Prediction Using the Active Period Method in Combination with Buffer Inventories.” In Proceedings of the International Conference on the Advances in Production Management System. Hamburg, Germany, 2017.
2 Need for and Use of Predictive Methods
Detecting the past and current bottleneck is one step to improving system out-
put. Yet another major step is to predict the behavior of the bottleneck in the future. If
a shift in the bottleneck can be predicted before it happens, then it is possible to coun-
teract this change and prevent a shift. While this will not eliminate the bottleneck in the
system, it can avoid or reduce the negative influence of shifting bottlenecks among each
other.
Wedel et al investigated the effect of the buffer preceding the bottleneck on
the prediction of the change in the bottleneck [23] [24]. However, while they investigate
both upstream and downstream buffers, they do not investigate where the bottleneck
shifts to.
3 The Active Period Method
As this bottleneck prediction method is based on the active period method, we
will briefly describe the bottleneck walk. More details on this method can be found in
[18] [19], and an evaluation of its abilities in [16] [3] [22] [25].
The active period method is based on the status of the processes across time.
For the duration of the observation, the status of all processes is monitored. While the
process can be in many possible status situations, like working, repair, waiting for parts,
changeover, maintenance, waiting for transport, etc., these are aggregated into two
groups: 1) Waiting on another process, called inactive; and 2) NOT waiting on another

Preprint of Roser, Christoph, Kai Lorentzen, David Lenze, Jochen Deuse, Ferdinand Klenner, Ralph Richter, Jacqueline Schmitt, and Peter Willats. “Bottleneck Prediction Using the Active Period Method in Combination with Buffer Inventories.” In Proceedings of the International Conference on the Advances in Production Management System. Hamburg, Germany, 2017.
process, called active. These active periods are plotted as shown in Fig. 1 for a simple
example using four processes in sequence.
Fig. 1. Simple example of the active periods for two processes
At any given time, the process with the longest active period is the bottleneck.
The bottleneck shifts when one longest period overlaps with the next longest active
period. Fig. 2 shows how the bottleneck changes from machine M3 to M2 and back for
the simple example from Fig. 1.
Fig. 2. Simple example of the active periods for two processes showing the bottleneck shift
This active period method is very precise and well suited for many different
kinds of production systems. Its drawback is the data requirement, as a continuous data
stream from all processes is necessary.
M1M2M3M4
Time
M1M2M3M4
Time

Preprint of Roser, Christoph, Kai Lorentzen, David Lenze, Jochen Deuse, Ferdinand Klenner, Ralph Richter, Jacqueline Schmitt, and Peter Willats. “Bottleneck Prediction Using the Active Period Method in Combination with Buffer Inventories.” In Proceedings of the International Conference on the Advances in Production Management System. Hamburg, Germany, 2017.
4 Adapting the Active Period Method for Prediction
The active period method analyses an entire data set from beginning to end.
Hence, it must be adapted before it can be used for bottleneck prediction.
4.1 Floating Observation
The major difference is that for a bottleneck prediction, we do not know the
future behavior of the production system (otherwise no prediction would be needed in
the first place). Fig. 3 shows the example from Fig. 1, although with an unknown future
development.
Fig. 3. Simple example with active periods up to the current moment of observation
Here, too, the current bottleneck is the process with the longest active period
until now. Unfortunately, we do not know a shift until it happens. However, we do
know which process would be the runner-up. Fig. 4 shows the current bottleneck M3
in red and the possible next bottleneck M2 in blue. If the process marked in blue will
become the bottleneck or not is not visible from this data until it happens.
M1M2M3M4
TimeNow
UnknownFuture

Preprint of Roser, Christoph, Kai Lorentzen, David Lenze, Jochen Deuse, Ferdinand Klenner, Ralph Richter, Jacqueline Schmitt, and Peter Willats. “Bottleneck Prediction Using the Active Period Method in Combination with Buffer Inventories.” In Proceedings of the International Conference on the Advances in Production Management System. Hamburg, Germany, 2017.
Fig. 4. Floating bottleneck observation and runner-up
4.2 Prediction of Bottleneck Shift Event
Hence, the second problem is to predict when the bottleneck will shift. A bot-
tleneck will shift if the so-far-longest active period is interrupted. This can happen in
two cases: the process with the longest active period so far runs out of parts or runs out
of space to store parts. These two situations are commonly known as starved and
blocked.
The likelihood of this happening can be directly observed from the buffer be-
fore and after the currently longest active process. If the buffer before the currently
longest active process starts to run empty, then the risk of interruption through starving
increases. If the buffer after the currently longest active process starts to run full, then
the risk of interruption through blocking increases.
4.3 Prediction of Future Bottleneck
When a bottleneck shifts, the future bottleneck is the process that at the mo-
ment before the shift has the second-longest active period, and is therefore the longest
active period after the shift. The example in Fig. 4 shows the possible future bottleneck
as process M2.
M1M2M3M4
TimeNow
UnknownFuture

Preprint of Roser, Christoph, Kai Lorentzen, David Lenze, Jochen Deuse, Ferdinand Klenner, Ralph Richter, Jacqueline Schmitt, and Peter Willats. “Bottleneck Prediction Using the Active Period Method in Combination with Buffer Inventories.” In Proceedings of the International Conference on the Advances in Production Management System. Hamburg, Germany, 2017.
5 Simulation Verification
The above approaches have been verified using simulation data. Our system
consisted of eight processes in sequence, as shown in Fig. 5, always separated by a
buffer with a capacity of 10. There is infinite demand and supply at the system bound-
aries. The cycle time of the processes are exponentially distributed with a mean of 2,
except for process P3 and P6, which have a mean of 3. Hence, processes P3 and P6 are
likely to be the bottlenecks. The simulation was run for 8000 time units.
Fig. 5. Simulation example
Fig. 6 shows the results of the active period analysis. As expected, the bottle-
neck changes mainly between processes P3 and P6. Overall, P3 was the sole bottleneck
29% of the time and shifting for 31%, whereas P6 was the sole bottleneck 39% of the
time and shifting for 30%. All other processes have a negligible impact on the system
performance with below 2%.
Fig. 6. Active periods of simulation example
P1 P2 P3 P4 P5 P7P6 P82 2 3 2 2 3 2 2Mean Cycle Time
Buffer Capacity 10 10 10 10 10 10 10
∞ ∞
P1P2P3P4P5P6P7P8
0 1000 2000 3000 4000 5000 6000 7000 8000
SoleBNShiftingBN
Proc
esse
s
Time

Preprint of Roser, Christoph, Kai Lorentzen, David Lenze, Jochen Deuse, Ferdinand Klenner, Ralph Richter, Jacqueline Schmitt, and Peter Willats. “Bottleneck Prediction Using the Active Period Method in Combination with Buffer Inventories.” In Proceedings of the International Conference on the Advances in Production Management System. Hamburg, Germany, 2017.
For all bottleneck shifts within the simulation, we plotted the behavior of the
buffer before and after the currently longest active period up to the moment of the actual
shift. This is shown in Fig. 7. The x-axis is the negative time until the shift of the bot-
tleneck away from the currently longest active period. The 22 graphs overlap each other
partially. All of these graphs start when the bottleneck shifted to the process, and end
when the bottleneck shifts away (time 0 on the x-axis). The y-axis shows the available
parts in the buffer in front of the bottleneck on the top half, and the available free spaces
inverted on the bottom half of the graph.
Fig. 7. Critical buffers before and after longest active period before switch
The results are very concise. When the bottleneck shifts to the process ob-
served, the process was already active long enough to be the second-longest active pe-
riod until the moments before the shift. Hence, the buffers before the process have a
tendency to be full and the buffer after the process have a tendency to be empty.
10
8
6
4
2
0
2
4
6
8
10
-2000 -1800 -1600 -1400 -1200 -1000 -800 -600 -400 -200 0
Time till Bottleneck Shift
Free
Cap
acity
Afte
rcu
rren
t BN
Avai
labl
e pa
rts b
efor
ecu
rren
t BN
Preprint of Roser, Christoph, Kai Lorentzen, David Lenze, Jochen Deuse, Ferdinand Klenner, Ralph Richter, Jacqueline Schmitt, and Peter Willats. “Bottleneck Prediction Using the Active Period Method in Combination with Buffer Inventories.” In Proceedings of the International Conference on the Advances in Production Management System. Hamburg, Germany, 2017.
Interestingly enough, this changes only when a bottleneck shift approaches.
With very few exceptions, a nearly empty buffer before or a nearly full buffer after the
process quickly leads to a shift in the bottleneck.
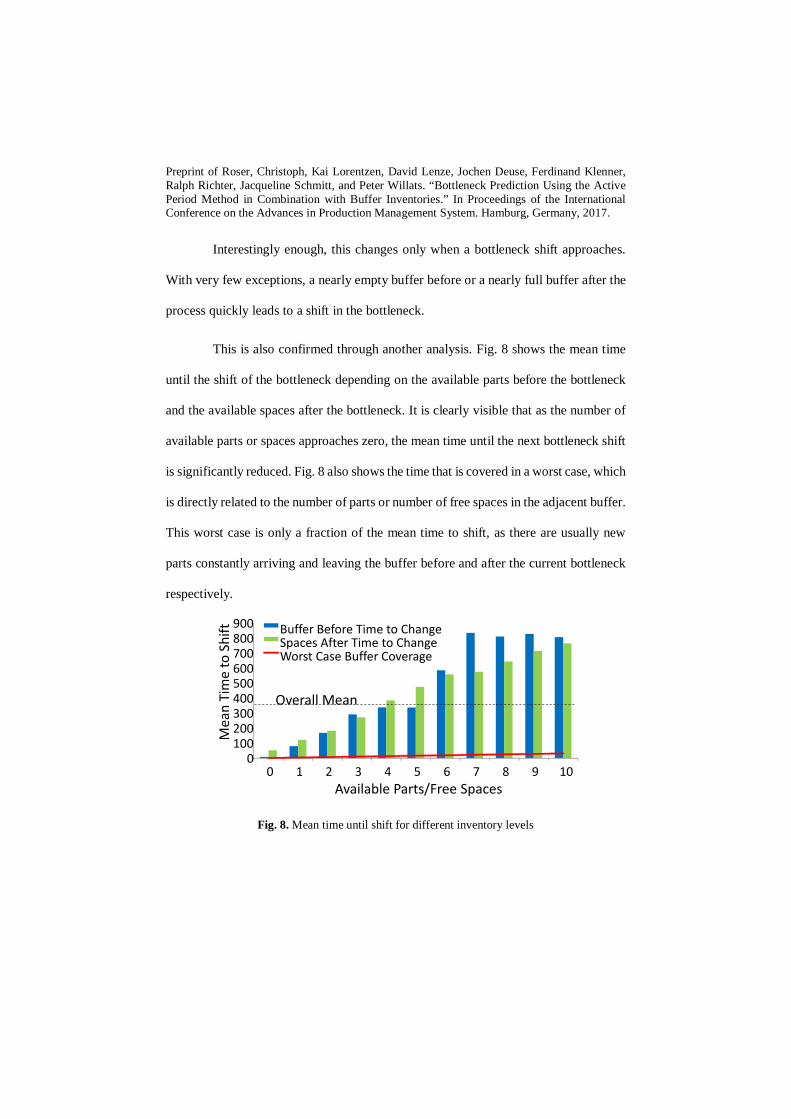
This is also confirmed through another analysis. Fig. 8 shows the mean time
until the shift of the bottleneck depending on the available parts before the bottleneck
and the available spaces after the bottleneck. It is clearly visible that as the number of
available parts or spaces approaches zero, the mean time until the next bottleneck shift
is significantly reduced. Fig. 8 also shows the time that is covered in a worst case, which
is directly related to the number of parts or number of free spaces in the adjacent buffer.
This worst case is only a fraction of the mean time to shift, as there are usually new
parts constantly arriving and leaving the buffer before and after the current bottleneck
respectively.
Fig. 8. Mean time until shift for different inventory levels
0100200300400500600700800900
0 1 2 3 4 5 6 7 8 9 10
Buffer Before Time to ChangeSpaces After Time to ChangeWorst Case Buffer Coverage
Available Parts/Free Spaces
Mea
n Ti
me
to S
hift
Overall Mean

Preprint of Roser, Christoph, Kai Lorentzen, David Lenze, Jochen Deuse, Ferdinand Klenner, Ralph Richter, Jacqueline Schmitt, and Peter Willats. “Bottleneck Prediction Using the Active Period Method in Combination with Buffer Inventories.” In Proceedings of the International Conference on the Advances in Production Management System. Hamburg, Germany, 2017.
6 Summary
Overall, the active period method can easily be adapted to detect the current
bottleneck in real time. Furthermore, by simply analyzing the buffers before and after
the current bottleneck, it is possible to estimate if a shift may occur sooner or later.
Finally, the process to which the bottleneck will shift to is also already known as the
process with the second-longest active period before the shift. Hence, the presented
method allows not only the detection but also the prediction of bottleneck shifts in real
time. Similar to the normal active period method, the approach is very accurate and
intuitive, but requires detailed process data of all processes in the system.
7 References
[1] C. Roser, K. Lorentzen, and J. Deuse, “Reliable Shop Floor Bottleneck Detection
for Flow Lines Through Process and Inventory Observations: The Bottleneck
Walk,” Logist. Res., vol. 8, no. 7, Oct. 2015.
[2] C. Romeser and C. Roser, “Direction of the Bottleneck in Dependence on Inven-
tory Levels,” in Proceedings of the International Conference on the Advances in
Production Management System, Iguassu Falls, Brazil, 2016.
[3] C. Roser and M. Nakano, “A Quantitative Comparison of Bottleneck Detection
Methods in Manufacturing Systems with Particular Consideration for Shifting
Bottlenecks,” in Proceedings of the International Conference on the Advances in
Production Management System, Tokyo, Japan, 2015.

Preprint of Roser, Christoph, Kai Lorentzen, David Lenze, Jochen Deuse, Ferdinand Klenner, Ralph Richter, Jacqueline Schmitt, and Peter Willats. “Bottleneck Prediction Using the Active Period Method in Combination with Buffer Inventories.” In Proceedings of the International Conference on the Advances in Production Management System. Hamburg, Germany, 2017.
[4] S.-Y. Chiang, C.-T. Kuo, and S. M. Meerkov, “Bottlenecks in Markovian Pro-
duction Lines: A Systems Approach,” IEEE Trans. Robot. Autom., vol. 14, no.
2, pp. 352–359, 1998.
[5] A. M. Law and D. W. Kelton, Simulation Modeling & Analysis, 2nd ed. McGraw
Hill, 1991.
[6] “Knessl and Tier - 1998 - Asymptotic approximations and bottleneck analy-
sis .pdf.” .
[7] P. J. Schweitzer, G. Serazzi, and M. Broglia, “A survey of bottleneck analysis in
closed networks of queues,” in Performance Evaluation of Computer and Com-
munication Systems, L. Donatiello and R. Nelson, Eds. Springer Berlin Heidel-
berg, 1993, pp. 491–508.
[8] S.-Y. Chiang, C.-T. Kuo, and S. M. Meerkov, “c-Bottlenecks in Serial Produc-
tion Lines: Identification and Application,” Math. Probl. Eng., 2002.
[9] P. K. Pollett, “Modelling congestion in closed queueing networks,” Int. Trans.
Oper. Res., vol. 7, no. 4–5, pp. 319–330, Sep. 2000.
[10] S. R. Lawrence and A. H. Buss, “Shifting Production Bottlenecks: Causes, Cures,
and Conundrums,” J. Prod. Oper. Manag., vol. 3, no. 1, pp. 21–37, 1994.
[11] L. Li, Q. Chang, J. Ni, G. Xiao, and S. Biller, “Bottleneck Detection of Manu-
facturing Systems Using Data Driven Method,” in IEEE International Sympo-
sium on Assembly and Manufacturing, 2007. ISAM ’07, 2007, pp. 76–81.

Preprint of Roser, Christoph, Kai Lorentzen, David Lenze, Jochen Deuse, Ferdinand Klenner, Ralph Richter, Jacqueline Schmitt, and Peter Willats. “Bottleneck Prediction Using the Active Period Method in Combination with Buffer Inventories.” In Proceedings of the International Conference on the Advances in Production Management System. Hamburg, Germany, 2017.
[12] G. F. Elmasry and C. J. McCann, “Bottleneck discovery in large-scale networks
based on the expected value of per-hop delay,” in 2003 IEEE Military Commu-
nications Conference, 2003. MILCOM ’03, 2003, vol. 1, p. 405–410 Vol.1.
[13] C.-T. Kuo, J.-T. Lim, and S. M. Meerkov, “Bottlenecks in Serial Production
Lines: A System-Theoretic Approach,” Math. Probl. Eng., vol. 2, pp. 233–276,
1996.
[14] L. Li, Q. Chang, and J. Ni, “Data driven bottleneck detection of manufacturing
systems,” Int. J. Prod. Res., vol. 47, no. 18, pp. 5019–5036, Jun. 2009.
[15] S. Sengupta, K. Das, and R. P. VanTil, “A New Method for Bottleneck Detec-
tion,” in Proceedings of the 40th Conference on Winter Simulation, Miami, Flor-
ida, 2008, pp. 1741–1745.
[16] E. Lima, L. Chwif, and M. R. P. Barreto, “Metodology for selecting the best
suitable bottleneck detection method,” in Simulation Conference, 2008. WSC
2008. Winter, 2008, pp. 1746–1751.
[17] Y. Wang, Q. Zhao, and D. Zheng, “-,” J. Syst. Sci. Syst. Eng., vol. 14, no. 3, pp.
347–363, Sep. 2005.
[18] C. Roser, M. Nakano, and M. Tanaka, “Detecting Shifting Bottlenecks,” in In-
ternational Symposium on Scheduling, Hamamatsu, Japan, 2002, pp. 59–62.
[19] C. Roser, M. Nakano, and M. Tanaka, “Shifting Bottleneck Detection,” in Winter
Simulation Conference, San Diego, CA, USA, 2002, pp. 1079–1086.

Preprint of Roser, Christoph, Kai Lorentzen, David Lenze, Jochen Deuse, Ferdinand Klenner, Ralph Richter, Jacqueline Schmitt, and Peter Willats. “Bottleneck Prediction Using the Active Period Method in Combination with Buffer Inventories.” In Proceedings of the International Conference on the Advances in Production Management System. Hamburg, Germany, 2017.
[20] C. Roser, M. Nakano, and M. Tanaka, “A Practical Bottleneck Detection
Method,” in Proceedings of the Winter Simulation Conference, Arlington, Vir-
ginia, USA, 2001, vol. 2, pp. 949–953.
[21] C. Roser, K. Lorentzen, and J. Deuse, “Reliable Shop Floor Bottleneck Detection
for Flow Lines through Process and Inventory Observations,” in Proceedings of
the Robust Manufacturing Conference, Bremen, Germany, 2014.
[22] J. Deuse, D. Lenze, F. Klenner, and T. Friedrich, “Manufacturing Data Analytics
zur Identifikation dynamischer Engpässe in Produktionssystemen mit hoher
wertschöpfender Variabilität,” in Megatrend Digitalisierung - Potenziale der Ar-
beits- und Betriebsorganisation, Gito, 2016.
[23] M. Wedel, M. von Hacht, R. Hieber, J. Metternich, and E. Abele, “Real-time
Bottleneck Detection and Prediction to Prioritize Fault Repair in Interlinked Pro-
duction Lines,” Procedia CIRP, vol. 37, pp. 140–145, Jan. 2015.
[24] M. Wedel, P. Noessler, and J. Metternich, “Development of bottleneck detection
methods allowing for an effective fault repair prioritization in machining lines of
the automobile industry,” Prod. Eng., vol. 10, no. 3, pp. 329–336, Jun. 2016.
[25] C. Roser, M. Nakano, and M. Tanaka, “Comparison of Bottleneck Detection
Methods for AGV Systems,” in Winter Simulation Conference, New Orleans,
Louisiana, USA, 2003, pp. 1192–1198.