Botnet Detection on TCP Tra c Using Supervised Machine ...
12
Botnet Detection on TCP Traffic Using Supervised Machine Learning Javier Velasco-Mata 12 , Eduardo Fidalgo 12 , V´ ıctor Gonz´ alez-Castro 12 , Enrique Alegre 12 , and Pablo Blanco-Medina 12 1 Department of Electrical, Systems and Automation Engineering, Universidad de Le´ on, Spain 2 Researcher at INCIBE (Spanish National Cybersecurity Institute), Le´ on, Spain {jvelm,eduardo.fidalgo,victor.gonzalez, enrique.alegre, pblanm}@unileon.es Abstract. The increase of botnet presence on the Internet has made it necessary to detect their activity in order to prevent them to attack and spread over the Internet. The main methods to detect botnets are traffic classifiers and sinkhole servers, which are special servers designed as a trap for botnets. However, sinkholes also receive non-malicious automatic online traffic and therefore they also need to use traffic classifiers. For these reasons, we have created two new datasets to evaluate classifiers: the TCP-Int dataset, built from publicly available TCP Internet traces of normal traffic and of three botnets, Kelihos, Miuref and Sality; and the TCP-Sink dataset based on traffic from a private sinkhole server with traces of the Conficker botnet and of automatic normal traffic. We used the two datasets to test four well-known Machine Learning classifiers: Decision Tree, k-Nearest Neighbours, Support Vector Machine and Na¨ ıve Bayes. On the TCP-Int dataset, we used the F1 score to measure the capability to identify the type of traffic, i.e., if the trace is normal or from one of the three considered botnets, while on the TCP-Sink we used ROC curves and the corresponding AUC score since it only presents two classes: non-malicious or botnet traffic. The best performance was achieved by Decision Tree, with a 0.99 F1 score and a 0.99 AUC score on the TCP-Int and the TCP-Sink datasets respectively. 1 Introduction The development of the Internet as a common resource has caused a constant grow of the number of cyberthreats. Therefore, the need of automatic solutions to supply the lack of human resources to detect these threats has fomented the use of Machine Learning (ML) algorithms in cybersecurity [1]. One of the most hazardous menaces are botnets. A botnet is a network of malware-infected computer-like devices called bots, which are controlled by a remote user, known as botmaster. Botnets are used to perform different types of cyber-attacks such as DDoS (Distributed Denial of Service) to targeted servers or massive credential collection from online users. For
Transcript of Botnet Detection on TCP Tra c Using Supervised Machine ...

Botnet Detection on TCP Traffic UsingSupervised Machine Learning
Javier Velasco-Mata12, Eduardo Fidalgo12, Vıctor Gonzalez-Castro12, EnriqueAlegre12, and Pablo Blanco-Medina12
1 Department of Electrical, Systems and Automation Engineering, Universidad deLeon, Spain
2 Researcher at INCIBE (Spanish National Cybersecurity Institute), Leon, Spain{jvelm,eduardo.fidalgo,victor.gonzalez, enrique.alegre,
pblanm}@unileon.es
Abstract. The increase of botnet presence on the Internet has made itnecessary to detect their activity in order to prevent them to attack andspread over the Internet. The main methods to detect botnets are trafficclassifiers and sinkhole servers, which are special servers designed as atrap for botnets. However, sinkholes also receive non-malicious automaticonline traffic and therefore they also need to use traffic classifiers. Forthese reasons, we have created two new datasets to evaluate classifiers:the TCP-Int dataset, built from publicly available TCP Internet tracesof normal traffic and of three botnets, Kelihos, Miuref and Sality; andthe TCP-Sink dataset based on traffic from a private sinkhole server withtraces of the Conficker botnet and of automatic normal traffic. We usedthe two datasets to test four well-known Machine Learning classifiers:Decision Tree, k-Nearest Neighbours, Support Vector Machine and NaıveBayes. On the TCP-Int dataset, we used the F1 score to measure thecapability to identify the type of traffic, i.e., if the trace is normal orfrom one of the three considered botnets, while on the TCP-Sink weused ROC curves and the corresponding AUC score since it only presentstwo classes: non-malicious or botnet traffic. The best performance wasachieved by Decision Tree, with a 0.99 F1 score and a 0.99 AUC scoreon the TCP-Int and the TCP-Sink datasets respectively.
1 Introduction
The development of the Internet as a common resource has caused a constantgrow of the number of cyberthreats. Therefore, the need of automatic solutionsto supply the lack of human resources to detect these threats has fomented theuse of Machine Learning (ML) algorithms in cybersecurity [1]. One of the mosthazardous menaces are botnets.
A botnet is a network of malware-infected computer-like devices called bots,which are controlled by a remote user, known as botmaster. Botnets are usedto perform different types of cyber-attacks such as DDoS (Distributed Denial ofService) to targeted servers or massive credential collection from online users. For

this reason, botnets have become one of the most remarkable security concernsin the last years [2, 3]. Depending on the structure of the network [2], botnetscan be classified as:
– Centralized: In this structure all the infected devices communicate directlywith the botmaster.
– Distributed: In this case, the botnet use peer-to-peer protocols for intra-communication and the botmaster only connects to a small subset of botnetsto transmit the orders.
– Hybrid: This type of network is divided into subsets of bots. Each subsetfollows a centralized hierarchy where all the client bots communicate with aserver bot. On a higher level, the server bots communicate with each otherand with the botmaster using a distributed architecture.
Botnets need to receive orders from online connections, and the generatedtraffic can be exploited to detect them. Early solutions used a signature-basedapproach [4] and thus analysed plain network communications in search of knownmalicious patterns, but they can be bypassed using obfuscation or encryptedprotocols. The supervised ML based detectors can overcome this drawback andprovide a more efficient solution. A trained ML model is capable of classifyingthe network traffic according to general traffic characteristics instead of lookingfor specific signatures [5].
Beside of traffic classifiers, botnets also can be detected using sinkhole servers.A sinkhole is a server designed to deceive botnets by disguising as a real bot-net controller server, and thus it collects the attempts of bots to communicatewith the botmaster [6]. However, sinkholes also receive non-malicious connec-tions from automatic programs like web crawlers or spiders, i.e., programs thatsystematically explore the Internet usually for web indexing [7]. Because of this,it is also necessary to apply network classifiers to the traffic received by sinkholesservers to separate non-malicious traces from the botnet ones.
This work explores the automatic classification of TCP network traffic, bothin regular Internet communications and in sinkhole traffic. Besides, we have notfound another work on botnet detection in sinkhole traffic focused on the TCPprotocol.
We present two main contributions. First, we constructed two new datasetsfrom TCP network traffic: one from public Internet traffic captures and anotherfrom private sinkhole data. And second, we tested on the two datasets fourwell-known ML classifiers, namely Decision Tree (DT), k-Nearest Neighbours(k-NN), Support Vector Machine (SVM) and Naıve Bayes (NB), using a schemeapplicable to the three types of botnet architectures we previously described.The general scheme of this work is illustrated on Fig. 1.
The rest of the paper is organized as follows. Section 2 presents the litera-ture review about botnet detection and classification. In Sect. 3 we present thedatasets we made for this work, and we describe the features used to model thetraffic samples, as well as the tested algorithms and the performance metrics wehave used. The experimental settings are described on Sect. 4, and the resultsare discussed on Sect. 5. Finally, our conclusions and future work are on Sect. 6.

Fig. 1. Methodology followed in this work
2 Related Works
Over the last years, different works have proposed various ML algorithms todetect botnets with varying results. These algorithms have been compared in avariety of network traffic classification problems, such as detection of anomalies,network intrusions or botnet detection.
For example, the experiments of Kirubavathi and Anitha [5] used a mixtureof the ISOT botnet dataset3 and a dataset of private laboratory traces, obtainingan accuracy of 99.14% for NB while the accuracies for DT and SVM were 95.86%and 92.02% respectively.
However, Sangkatsanee et al. reported an accuracy on their work about intru-sion detection [8] of 99.00% using DT, outperforming NB, Bayesian Networks(BN) and shallow Neural Networks (NN), which got an accuracy of 78.70%,89.30% and 93.00% respectively. These results were obtained with a privatedataset with 7200 data records. Based on these results, they implemented a DTin a real-time Intrusion Detection System (IDS) that showed a good performance,with a Total Detection Rate (TDR) of 99.33%.
Moreover, Kim et al. [9] concluded that SVM surpasses k-NN, NB, BN, DTand shallow NN in network anomaly detection with an accuracy comprised be-tween 94.2% and 97.8% on their datasets of collected network traces from dif-ferent entities in the USA, Japan and Korea.
Recently, the appearance of the Internet of Things (IoT) has offered anotherenvironment for botnet propagation. The research of Doshi et al. [10] on theMirai botnet propagation over IoT devices demonstrated the effectiveness of fiveML classifiers, namely k-NN, SVM, DT, Random Forest (RF) and NN, on selfgenerated IoT traffic with Mirai traces. In particular, RF achieved the highestmean F1 score (0.99).
3 Methodology
3.1 Datasets and Features
The Internet-alike network traffic data used in this work is publicly available bycourtesy of the of the Stratosphere Project, formerly Malware Capture FacilityProject [11]. The traffic captures that we have selected for this work are listed on
3 https://www.uvic.ca/engineering/ece/isot/datasets/

Table 1. Our dataset is composed of traces from these data where each samplecorresponds to a TCP connection or TCP flow and is characterized with thefeatures described in Table 2. The dataset, which we called TCP-Int dataset,contemplates four classes of data: the Normal class represents non-malicioustraffic, while the Kelihos, Miuref and Sality classes represent traffic traces fromthe botnets with the same name. We built a balanced dataset where each classcontains 44231 samples since this is the number of TCP connections of the leastrepresented class, Miuref.
Table 1. List of the selected traffic captures including the type of their traffic (i.e.,from Normal communications or from activity of the malware Kelihos, Miuref or Sality)and the number of TCP flows present. The source of the captures is the StratosphereProject [11]
Traffic capture Type TCP flows
ctu-normal-21.pcap Normal 5886ctu-normal-22.pcap Normal 45461ctu-normal-23.pcap Normal 4059ctu-normal-24.pcap Normal 1721ctu-normal-25.pcap Normal 1092ctu-normal-26.pcap Normal 1866ctu-normal-27.pcap Normal 9200ctu-normal-28.pcap Normal 4034ctu-normal-30.pcap Normal 13965ctu-normal-31.pcap Normal 14982ctu-normal-32.pcap Normal 220002015-12-09 capture-win4-1.pcap Kelihos 955752015-12-09 capture-win4-2.pcap Kelihos 942192015-06-07 capture-win12.pcap Miuref 12852015-06-07 capture-win8.pcap Miuref 48992015-06-19 capture-win12.pcap Miuref 48072015-07-08 capture-win8.pcap Miuref 332402014-04-07 capture-win13.pcap Sality 57808
Besides, we have constructed a dataset using traffic data from a sinkholeserver which we called TCP-Sink dataset. These data was supplied by INCIBE(Spanish National Cybersecurity Institute)4, and have both non-malicious tracesfrom automatic online programs and traces from the Conficker botnet. The TCP-Sink dataset contains 4027 samples of TCP flows from non-malicious connections(Normal class) and the same amount of samples from Conficker connections(Botnet class). The samples are described according to the TCP features shownin Table 2.
4 https://incibe.es/
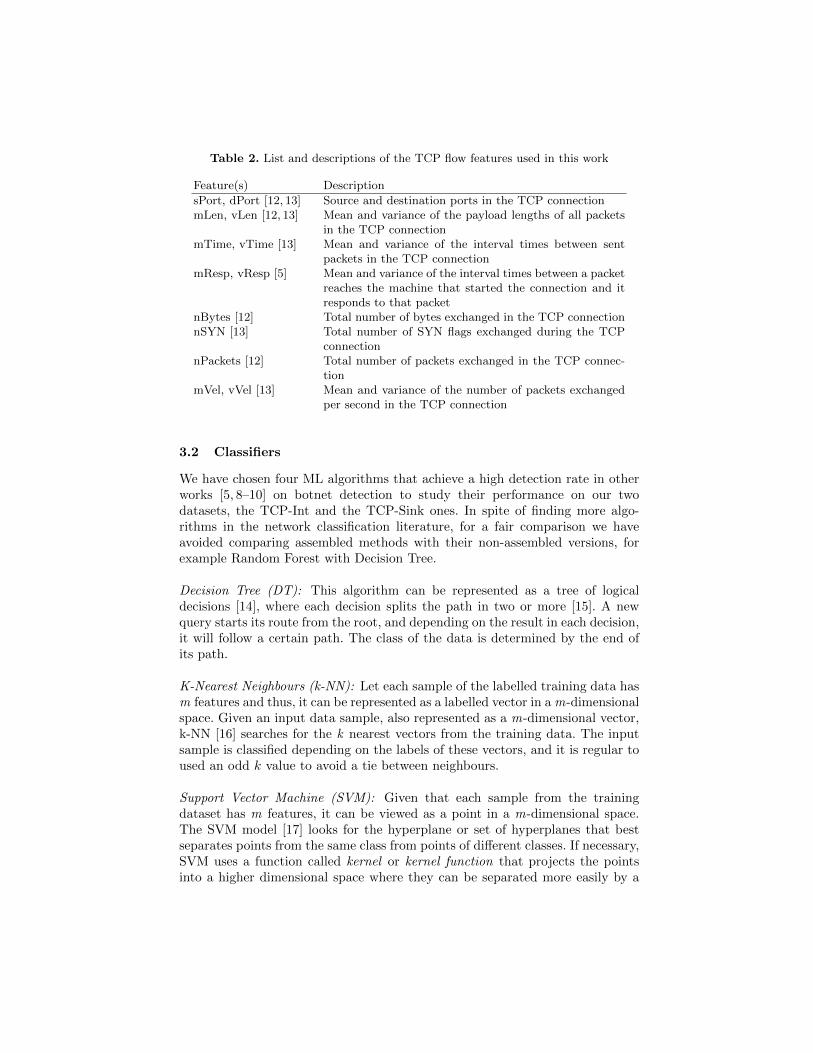
Table 2. List and descriptions of the TCP flow features used in this work
Feature(s) Description
sPort, dPort [12, 13] Source and destination ports in the TCP connectionmLen, vLen [12, 13] Mean and variance of the payload lengths of all packets
in the TCP connectionmTime, vTime [13] Mean and variance of the interval times between sent
packets in the TCP connectionmResp, vResp [5] Mean and variance of the interval times between a packet
reaches the machine that started the connection and itresponds to that packet
nBytes [12] Total number of bytes exchanged in the TCP connectionnSYN [13] Total number of SYN flags exchanged during the TCP
connectionnPackets [12] Total number of packets exchanged in the TCP connec-
tionmVel, vVel [13] Mean and variance of the number of packets exchanged
per second in the TCP connection
3.2 Classifiers
We have chosen four ML algorithms that achieve a high detection rate in otherworks [5, 8–10] on botnet detection to study their performance on our twodatasets, the TCP-Int and the TCP-Sink ones. In spite of finding more algo-rithms in the network classification literature, for a fair comparison we haveavoided comparing assembled methods with their non-assembled versions, forexample Random Forest with Decision Tree.
Decision Tree (DT): This algorithm can be represented as a tree of logicaldecisions [14], where each decision splits the path in two or more [15]. A newquery starts its route from the root, and depending on the result in each decision,it will follow a certain path. The class of the data is determined by the end ofits path.
K-Nearest Neighbours (k-NN): Let each sample of the labelled training data hasm features and thus, it can be represented as a labelled vector in a m-dimensionalspace. Given an input data sample, also represented as a m-dimensional vector,k-NN [16] searches for the k nearest vectors from the training data. The inputsample is classified depending on the labels of these vectors, and it is regular toused an odd k value to avoid a tie between neighbours.
Support Vector Machine (SVM): Given that each sample from the trainingdataset has m features, it can be viewed as a point in a m-dimensional space.The SVM model [17] looks for the hyperplane or set of hyperplanes that bestseparates points from the same class from points of different classes. If necessary,SVM uses a function called kernel or kernel function that projects the pointsinto a higher dimensional space where they can be separated more easily by a

hyperplane. Depending on the problem characteristics, SVM can use either ageneric kernel such as the linear kernel [18] or a custom kernel [19–21].
Naıve Bayes (NB): Given a value x for a certain feature f , the probability thatthis value corresponds to a certain class Cj is P (Cj |f = x). This probabilityis calculated by fitting the training data into a probability distribution definedby the event model of NB [22, 23]. To calculate the probability that an inputdata corresponds to a certain class, NB supposes that each feature contributesindependently [24].
3.3 Evaluation
In this work we have used three metrics to measure the performance of theclassification algorithms, which are described as follows:
F1 score: This score is defined as the harmonic mean of the precision and recallscores [25] as shown in (1). The precision is defined in (2) from the number ofTrue Positives (TP) and the number of False Positives (FP), while the recall isdefined in (3) from the number of TP and the number of False Negatives (FN).The F1 score can be applied with multiclass datasets to measure the performanceof a classifier over each class, where the ideal score is 1 and the worst is 0.
F1 = 2× precision × recall
precision + recall(1)
precision =TP
TP + FP(2)
recall =TP
TP + FN(3)
Receiver Operating Characteristic (ROC) curves: ROC curves [26] usually plotthe True Positive Rate (TPR) on the Y axis against the False Positive Rate(FPR) on the X axis using the results of cross-validation. This method is usedto evaluate the performance of a classifier on datasets with two types of datasuch as the TCP-Sink dataset. The ideal measure maximizes the TPR whileminimizing the FPR.
Area Under the Curve (AUC): This measurement corresponds with the totalarea under the ROC curve [26]. The ideal measure is an area of 1, which means aperfect TPR and FPR scores, while a score under 0.5 means that the performanceis worse than a random classifier.

4 Experiments
All the experiments were performed on a machine with 128 GB of RAM and twoIntel(R) Xeon(R) E5-2630v3 CPUs running an Ubuntu 14.04.5 LTS.
The software was developed using Python 3. To extract traffic characteristicsfrom traffic captures in .pcap format, the script used the module PyShark5 whichis a python wrapper for TShark6, and the module PyTables7 to manage inter-mediary HDF5 files. The Machine Learning Python module used was sklearn8,and the most relevant optimization settings for the four used algorithms in thesklearn libraries are described as follows:
1. For DT, the main setting is the maximum depth which refers to the maxi-mum number of splits in a path from the root to a leaf. While reducing thisdepth allows decreasing the computational cost, the downside is a decreaseon the detection capability. In this work we use the default option of unlim-ited depth, i.e., it is not established a restriction on the maximum numberof branches in the tree.
2. In k-NN the main hyper-parameters are the number k of neighbours con-sidered in a search and the distance metric used to determine the similaritywith the neighbours. Before comparing k-NN with the rest of the classifiers,we experiment with different values of k to determine the optimal one foreach of the two datasets used in this work. Besides, to determine the similar-ity with the neighbours, we use the Euclidean distance in the 11-dimensionalspace of the features from Table 2.
3. The main settings for the SVM algorithm are the employed kernel and theerror penalty parameter or cost C. In this work we have chosen an optimisedimplementation of the linear kernel that uses the liblinear library [27] dueto its better escalation on a large number of samples, which is beneficial onnetwork traffic classification problems. With respect to the cost variable, wehave tried several values (C={0.1, 0.5, 0.9, 1.0, 5.0, 10.0, 100.0}) withoutobserving any significant difference, and thus we have selected the defaultvalue of C=1.0.
4. The only relevant setting for NB is the employed event model, whose se-lection is based on the type of the used data. In this work, we use featuresrepresented as continuous variables that can not be converted into discreteones, such as all the features on Table 2 that represent a mean or a variance,and thus we use a Gaussian event model.
We tested the four algorithms using stratified 10-folds cross-validation on theTCP-Int and the TCP-Sink datasets introduced on Sect. 3.1.
5 https://pypi.org/project/pyshark/6 https://www.wireshark.org/7 https://www.pytables.org/8 http://scikit-learn.org/stable/index.html

5 Results and Discussion
We have tested the performance of the four classifiers on Internet-alike trafficusing the TCP-Int dataset. This dataset presents four classes: Normal, Kelihos,Miuref and Sality, and we used the F1 score to measure the class-identificationability of each algorithm.
First, we need to find the optimal k parameter of the k-NN classifier. Figure2 shows that the highest mean F1 score of k-NN on the TCP-Int dataset isachieved with k = 1.
Fig. 2. Mean F1 score achieved by k-NN with different k values over the TCP-Intdataset
Afterwards, we tested the four classification algorithms (with k = 1 in k-NN)on the TCP-Int dataset and the results are displayed on Table 3. DT achievesthe best detection rate with a mean F1 score of 0.99 with a stable detectingperformance among the four classes, meaning that the current used features areeasy to categorize. On the one hand, k-NN also presents a relatively high andstable performance, implying that the data is well separated into clusters on thefeature space. On the other hand, SVM with a linear kernel shows a relativelypoor detection rate over the Normal and Sality classes. This suggest that theNormal and Sality classes are not linearly separable in the feature space. Besides,NB only achieves a relatively good result on the Kelihos class, while it shows apoor performance on the other three classes with an approximate 50% F1 score.Since the NB classifier is based on the idea that the features are independent,we infer that the Normal, Miuref and Sality classes contain features that presentcorrelations.
To test the performance of the four classifiers on sinkhole traffic we usedthe TCP-Sink dataset. Since this dataset only contains two classes, Normal andBotnet traffic, it is preferred to measure the performance using ROC curves andAUC scores because they are more informative in binary classification than theF1 score. First, we need to optimize the k parameter of k-NN. As depicted in
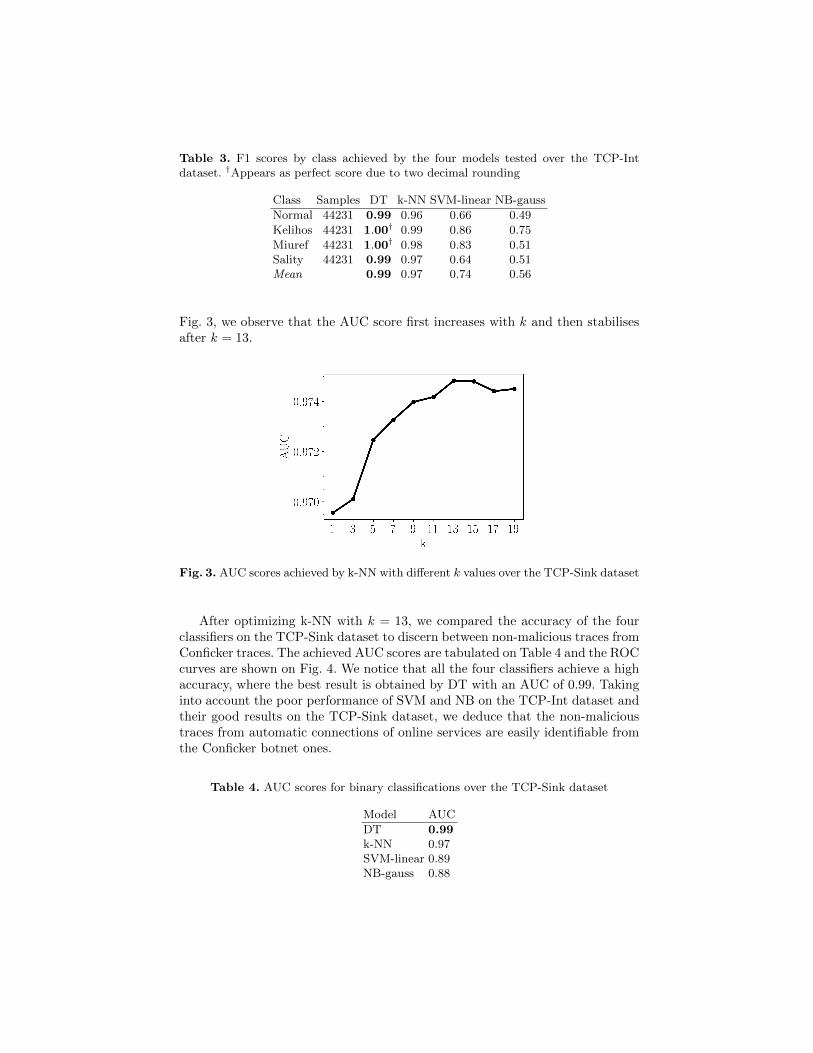
Table 3. F1 scores by class achieved by the four models tested over the TCP-Intdataset. †Appears as perfect score due to two decimal rounding
Class Samples DT k-NN SVM-linear NB-gauss
Normal 44231 0.99 0.96 0.66 0.49
Kelihos 44231 1.00† 0.99 0.86 0.75
Miuref 44231 1.00† 0.98 0.83 0.51Sality 44231 0.99 0.97 0.64 0.51Mean 0.99 0.97 0.74 0.56
Fig. 3, we observe that the AUC score first increases with k and then stabilisesafter k = 13.
Fig. 3. AUC scores achieved by k-NN with different k values over the TCP-Sink dataset
After optimizing k-NN with k = 13, we compared the accuracy of the fourclassifiers on the TCP-Sink dataset to discern between non-malicious traces fromConficker traces. The achieved AUC scores are tabulated on Table 4 and the ROCcurves are shown on Fig. 4. We notice that all the four classifiers achieve a highaccuracy, where the best result is obtained by DT with an AUC of 0.99. Takinginto account the poor performance of SVM and NB on the TCP-Int dataset andtheir good results on the TCP-Sink dataset, we deduce that the non-malicioustraces from automatic connections of online services are easily identifiable fromthe Conficker botnet ones.
Table 4. AUC scores for binary classifications over the TCP-Sink dataset
Model AUC
DT 0.99k-NN 0.97SVM-linear 0.89NB-gauss 0.88

Fig. 4. ROC curves for Conficker botnet detection over the TCP-Sink dataset
6 Conclusions and Future Work
In this paper we explored the problem of botnet detection on TCP traffic in twodifferent environments: regular Internet communications and traffic captures onsinkhole servers. For this purpose, we constructed two datasets: the TCP-Intdataset with public Internet traffic captures from the Stratosphere Project [11],and the TCP-Sink dataset with traces from a private sinkhole server gatheredby INCIBE.
We have tested four supervised ML algorithms, namely DT, k-NN, SVM andNB, on the two datasets using an approach independent from the three possiblenetwork architectures used by botnets.
The TCP-Int dataset contained traces from three botnets: Kelihos, Miurefand Sality, aside from non-malicious data. We used the F1 score to evaluatethe capability of the algorithms to identify the four classes. Both DT and k-NNshowed a stable performance among the classes, and DT achieved the best meanF1 score (0.99). However, the performance of SVM and NB varied significantlybetween classes: the worst F1 score of SVM was 0.64 for the Sality class whilethe best score was 0.86 for the Kelihos class, and the best F1 score of NB was0.49 for the Normal class while the best score was 0.75 for the Kelihos class. Itis noticeable that the Kelihos class was the best identified by the four classifiers,revealing that its characteristics are more distinguishable from the other classes.
The TCP-Sink dataset contained Conficker botnet traces and normal tracesfrom automatic Internet programs such as web crawlers. The four algorithms
were evaluated on this dataset using the AUC score, where the highest score wasachieved by DT (0.99) and the lowest score was obtained by NB (0.88). Sincethe lowest score is relatively high, this means that the automatic non-malicioustraffic in a sinkhole is easily identifiable.
On the basis of our results, we recommend DT for building botnet detectorson TCP traffic. For future works, we will study for an improved feature selectionamong the ones used in this work. The benefit from this is building lightermodels that may run faster while maintaining the accuracy. Moreover, anotheroptimization to consider consist on using assembled models from the ones used inthis work, such as Random Forest or Boosted Trees from Decision Tree. Finally,our future work includes working with Deep Learning (DL) classifiers which canbe trained with the same set of features of this work [28]. Besides, the textcomprehension of DL Neural Networks could let us build featureless classifiers,i.e., classifiers than do not need a precalculation of features form the datasets,but can directly work with the data in text format.
Acknowledgements
This work was supported by the framework agreement between the University ofLeon and INCIBE (Spanish National Cybersecurity Institute) under Addendum01.
References
1. Martınez, J., Iglesias, C. and Garcıa-Nieto, P.: Machine Learning Techniques Ap-plied to Cybersecurity. International Journal of Machine Learning and Cybernetics,1–14 (2019)
2. Silva, S. S., Silva, R. M., Pinto, R. C., and Salles, R. M.: Botnets: A survey. Com-puter Networks, 57(2), 378–403 (2013)
3. Boshmaf, Y., Muslukhov, I., Beznosov, K. and Ripeanu, M.: Design and analysis ofa social botnet. Computer Networks, 57(2), 556–578 (2013)
4. Bujlow, T., Carela-Espanol, V. and Barlet-Ros, P.: Independent comparison of pop-ular DPI tools for traffic classification. Computer Networks, 76, 75–89 (2015)
5. Kirubavathi G. and Anitha, R.: Botnet detection via mining of traffic flow charac-teristics. Computers & Electrical Engineering, 50, 91–101 (2016)
6. Kim, H., Choi, S. S., and Song, J.: A methodology for multipurpose DNS Sinkholeanalyzing double bounce emails. International Conference on Neural InformationProcessing, 609–616 (2013)
7. Fetzer, C., Felber, P., Rivire, ., Schiavoni, V., and Sutra, P: Unicrawl: A practicalgeographically distributed web crawler. International Conference on Cloud Com-puting, 389–396 (2015)
8. Sangkatsanee, P., Wattanapongsakorn, N. and Charnsripinyo, C.: Practical real-timeintrusion detection using machine learning approaches. Computer Communications,34(18), 2227–2235 (2011)
9. Kim, H., Claffy, K.C., Fomenkov, M., Barman, D., Faloutsos, M. and Lee, K.: In-ternet Traffic Classification Demystified: Myths, Caveats, and the Best Practices.Proceedings of the 2008 ACM CoNEXT Conference, 11:1–11:12 (2008)
10. Doshi, R., Apthorpe, N., and Feamster, N.: Machine Learning DDoS Detectionfor Consumer Internet of Things Devices. IEEE Security and Privacy Workshops,29–35 (2018)
11. Garcıa, S., Grill, M., Stiborek, J. and Zunino, A.: An empirical comparison ofbotnet detection methods. Computers & Security, 45, 100–123 (2014)
12. Saad, S., Traore, I., Ghorbani, A., Sayed, B., Zhao, D., Lu, W., Felix, J. andHakimian, P.: Detecting P2P botnets through network behavior analysis and ma-chine learning. 2011 Ninth Annual International Conference on Privacy, Securityand Trust, 174–180 (2011)
13. Zhao, D., Traore, I., Sayed, B., Lu, W., Saad, S., Ghorbani, A. and Garant, D.:Botnet detection based on traffic behavior analysis and flow intervals. Computers& Security, 39, 2–16 (2013)
14. Buntine, W. and Niblett, T.: A further comparison of splitting rules for decision-tree induction. Machine Learning, 8, 75–85, (1992)
15. Friedman, J. H.: Lazy Decision Trees. Proceedings of the Thirteenth NationalConference on Artificial Intelligence, 1, 717–724 (1996)
16. Dong, W., Moses, C. and Li, K.: Efficient K-nearest Neighbor Graph Constructionfor Generic Similarity Measures. Proceedings of the 20th International Conferenceon World Wide Web, 577–586 (2011)
17. Cherkassky, V. and Ma, Y.: Practical selection of SVM parameters and noise esti-mation for SVM regression. Neural Networks, 17(1), 113 - 126 (2004)
18. Al Nabki, M.W., Fidalgo, E., Alegre, E. and de Paz, I.: Classifying illegal activitieson TOR network based on web textual contents. Proceedings of the 15th Conferenceof the European Chapter of the Association for Computational Linguistics, 1, 35–43(2017)
19. Fidalgo, E., Alegre, E., Gonzalez-Castro, V. and Fernandez-Robles, L.: Compassradius estimation for improved image classification using Edge-SIFT. Neurocom-puting, 197, 119–135 (2016)
20. Fidalgo, E., Alegre, E., Gonzalez-Castro, V. and Fernandez-Robles, L.: Illegal ac-tivity categorisation in DarkNet based on image classification using CREIC method.International Joint Conference SOCO17-CISIS17-ICEUTE17, 600–609 (2017)
21. Fidalgo, E., Alegre, E., Gonzalez-Castro, V. and Fernandez-Robles, L.: Boostingimage classification through semantic attention filtering strategies. Pattern Recog-nition Letters, 112, 176–183 (2018)
22. Schneider, K.: A Comparison of Event Models for Naive Bayes Anti-spam e-MailFiltering. Proceedings of the Tenth Conference on European Chapter of the Asso-ciation for Computational Linguistics, 1, 307–314 (2003)
23. Xu, S.: Bayesian Nave Bayes classifiers to text classification. Journal of InformationScience, 44(1), 48–59 (2018)
24. Ren, J., Lee, S. D., Chen, X., Kao B., Cheng, R. and Cheung, D.: Naive BayesClassification of Uncertain Data. 2009 Ninth IEEE International Conference on DataMining, 944–949 (2009)
25. Sasaki, Y.: The truth of the F-measure. Teach Tutor mater, 1(5), 1–5, (2007)26. Fawcett, T.: An introduction to ROC analysis. Pattern Recognition Letters, 27(8),
861–874, (2006)27. Fan, R. E., Chang, K. W., Hsieh, C. J., Wang, X. R., and Lin, C. J.: LIBLINEAR:
A library for large linear classification. Journal of machine learning research, 9,1871–1874 (2008)
28. van Roosmalen, J., Vranken, H. and van Eekelen, M.: Applying Deep Learning onPacket Flows for Botnet Detection. Proceedings of the 33rd Annual ACM Sympo-sium on Applied Computing, 1629–1636 (2018)