BOT2017 TRGCover - · PDF fileEric Brown Senior Report Developer Deborah Geil Data...
204
2017 BOT Book of Trends
Transcript of BOT2017 TRGCover - · PDF fileEric Brown Senior Report Developer Deborah Geil Data...

2017 BOT Book of Trends


Offi ce of Academic PlanningPhone (216) 687-4700www.csuohio.edu/offi ces/planning
Marius Boboc Vice Provost for Academic PlanningLaurine Owens Administrative Coordinator
Offi ce of Institutional Research and AnalysisPhone (216) 687-4700www.csuohio.edu/iraa
Thomas Geaghan Director
Eric Brown Senior Report DeveloperDeborah Geil Data Analyst/System DeveloperAndy White Data Analyst/System DeveloperMichael McGoun Research AssistantPatricia Lyons Program Review Coordinator
2017 BOT Book of Trends

Cleveland State University / 2017 Book of Trends2

SEC
TIO
N
1
Table of Contents
1Book of Trends

Table of Contents
1 INTRODUCTION University Administration .............................................................................................................................................................3 Board of Trustees 2016-2017 ..................................................................................................................................................... 4 Student Government Association Executive Board .............................................................................................................. 4 President’s Medal ............................................................................................................................................................................5 Distinguished Alumni ....................................................................................................................................................................5
2 CAMPUS ENROLLMENT CHARACTERISTICS AND TRENDS Table 2.1: Cleveland State University Enrollment by Level, Fall 1965 – 2016 .............................................. 9 Table 2.2: Enrollment by College, Level and Load-Fall 2016 ............................................................................ 10 Table 2.3: Full-Time Enrollment by Ethnicity and Gender-Fall 2016 ............................................................. 11 Table 2.4: Total Enrollment by Ethnicity and Gender-Fall 2016 ..................................................................... 11 Table 2.5: New Undergraduate Fall Enrollment by College and Entrance Status: 5-Year Trend.............. 12 Table 2.6: New Graduate & Law Fall Enrollment by College and Entrance Status: 5-Year Trend .......... 12 Table 2.7: New Undergraduate Fall Enrollment by Academic Load: 5-Year Trend ..................................... 13 Table 2.8: New Graduate & Law Fall Enrollment by Academic Load: 5-Year Trend ................................. 13 Table 2.9: New Fall Enrollment by College, 5-Year Trend ............................................................................... 13 Table 2.10: Fall Enrollment by Class Standing and Student Credit Hours: 5-Year Trend ............................. 14 Table 2.11: Total Fall Enrollment by Academic Level: 5-Year Trend ............................................................... 15 Table 2.12: Fall Enrollment by College, 5-Year Trend ........................................................................................... 16 Table 2.13: Fall Student Credit Hours (SCH) by College, 5-Year Trend .......................................................... 16 Table 2.14: Registered Student Credit Hours by Level - Fall 2016 ...................................................................... 17 Table 2.15: Enrollment by Age Category - Fall 2016 ............................................................................................. 18 Table 2.16: Enrollment by Level and Residency Status - Fall 2016 ..................................................................... 19 Table 2.17: Enrollment by State - Fall 2016 .............................................................................................................. 19 Table 2.18: Enrollment by Ohio County - Fall 2016 .............................................................................................. 19 Map of 2016 Fall Enrollment by Ohio County ................................................................................................................... 20 Table 2.19: Non-Resident Alien Enrollment by Country or Region - Fall 2016.............................................. 21 Table 2.20: Spring Enrollment by College: 5-Year Trend ...................................................................................... 22 Table 2.21: Spring Student Credit Hours (SCH) by College: 5-Year Trend ...................................................... 22 Table 2.22: Summer Enrollment by College: 5-Year Trend .................................................................................. 23 Table 2.23: Summer Student Credit Hours (SCH) by College, 5-Year Trend .................................................. 23 Table 2.24: Annualized Student Credit Hours (SCH) by College: 5-Year Trend ............................................. 24 Table 2.25: Yearly Change in Enrollment by Campus Types for Ohio Institutions, Fall 2012-2016 ............. 25 Table 2.26: Main Campus Enrollment for Select Ohio Four Year Institutions, Fall 2012-2016 .................. 25

3 ENROLLMENT CHARACTERISTICS OF STUDENTS IN CSU COLLEGES Tables 3.1-11: Fall Enrollment by Level and Major, 5-Year Trend ...................................................................... 29-41 Table 3.1: College of Business .................................................................................................................................... 29 Table 3.2: College of Liberal Arts and Social Sciences ......................................................................................... 31 Table 3.3: College of Education and Human Services ......................................................................................... 33 Table 3.4: School of Nursing ...................................................................................................................................... 36 Table 3.5: College of Engineering ............................................................................................................................. 37 Table 3.6: College of Sciences and Health Professions ........................................................................................ 38 Table 3.7: College of Urban Affairs .......................................................................................................................... 40 Table 3.8: College of Law ............................................................................................................................................ 41 Table 3.9: Undergraduate Studies .............................................................................................................................. 41 Table 3.10: Undergraduate Non-Degree .................................................................................................................... 42 Table 3.11: Graduate Studies ......................................................................................................................................... 42 Table 3.11a: Other ............................................................................................................................................................ 41 Tables 3.12-20: Fall Enrollment by Class Standing and Student Credit Hours by Course Level: 5-Year Trend .......................................................................................................... 43-50 Table 3.12: College of Business .................................................................................................................................... 43 Table 3.13: College of Liberal Arts and Social Sciences ......................................................................................... 44 Table 3.14: College of Education and Human Services ......................................................................................... 45 Table 3.15: School of Nursing ...................................................................................................................................... 46 Table 3.16: College of Engineering ..............................................................................................................................47 Table 3.17: College of Sciences and Health Professions ........................................................................................ 48 Table 3.18: College of Urban Affairs .......................................................................................................................... 49 Table 3.19: College of Law ............................................................................................................................................ 50 Table 3.20: Undergraduate Studies .............................................................................................................................. 51 Table 3.21: CSU Total Fall Enrollment by College and Ethnicity: 5-Year Trend ............................................. 52 Table 3.22: CSU Undergraduate Fall Enrollment by College and Ethnicity: 5-Year Trend ........................... 56 Table 3.23: CSU Graduate and Law Fall Enrollment by College and Ethnicity: 5-Year Trend .....................59 Table 3.24: Undergraduate Fall Enrollment by College and Load: 5-Year Trend............................................. 62 Table 3.25: Graduate & Law Fall Enrollment by College and Load: 5-Year Trend ......................................... 63 East and West Centers and Off-Campus Locations ............................................................................................................ 64 Table 3.26: West Center Student Credit Hours: Fall Semester .............................................................................. 64 Table 3.26a: Annual West Center Historical Enrollment and Student Credit Hours Trend ............................ 64 Table 3.27a: Annual Historical Enrollment and SCH Trends at Lorain County Community College .......... 65 Table 3.27b: Annual Historical Enrollment and SCH Trends at Lakeland Community College .................... 66 Table 3.27c: Annual Historical Enrollment and SCH Trends at Other Off-Campus Locations .................... 67

4 SPONSORED RESEARCH Table 4.1: Sponsored Program Awards and Expenditures, Fiscal Years 2011-2016 ...................................... 71 Table 4.2: Sponsored Program Awards by Source, Fiscal Years 2011-2016 .................................................... 72 Table 4.3: Sponsored Program Expenditures by Source, Fiscal Years 2011-2016 ......................................... 73 Table 4.4: National Science Foundation Ranking of Research and Development Expenditures, Fiscal Years 2010-2015 (Northern Ohio Comparison) ................ 74 Table 4.5a: National Science Foundation Ranking of Research Results, Fiscal Years 2013-2015 ................ 75 Table 4.5: Indirect Cost (IDC) Recovery and Total Sponsored Program Expenditures by Year, Fiscal Years 2011-2016 ................................................................... 75 Table 4.6: Proposals Submitted and Awards Received by Source, Fiscal Years 2011-2016.......................... 76 Table 4.7: Proposals Submitted and Awards Received by College, Fiscal Years 2011-2016 ........................ 77 Table 4.7a: Fiscal Year 2016 Proposals Submitted by College .............................................................................. 77 Table 4.7b: Fiscal Year 2016 Awards Received by College ..................................................................................... 78 Table 4.8: Intellectual Property: Patents and Disclosures, Fiscal Years 2011-2016 ........................................ 79 Table 4.9: Cleveland State University Graduate Student Support from Externally Funded Research, Fiscal Years 2011-2016 ............................................................. 79 Table 4.10: Percentage of Total Student Credit Hours Taken by Graduate Level Students at Selected Ohio 4-Year Institutions-Main Campuses Only, Fall Terms 2012-2016................... 80 Table 4.11: Selected Research & Grant Highlights by College .............................................................................. 81 Table 4.12: Cleveland State University Research Centers and Institutes ............................................................. 96 Table 4.13: Past Recipients of Distinguished Faculty Awards by Award Type, 1995-2017 .............................97
5 RETENTION AND GRADUATION Table 5.1: Fall to Fall Retention Rates for IPEDS Cohort by Ethnicity and Gender Enrolled Fall 2011-2015 / Returned Fall 2012-2016 ............................................... 101 Table 5.2: Fall to Fall Retention Rates for IPEDS Cohort by College Enrolled Fall 2011-2015 / Returned Fall 2012-2016 ....................................................... 102 Table 5.3: Attended, Graduated and Retained Fall to Fall Student Tracking (IPEDS Cohort) ............... 103 Table 5.4: Attended, Graduated and Retained Fall to Fall Student Tracking (Transfer Cohort) .............. 103 Table 5.5a: Undergraduate First-Year, Full-Time Degree-Seeking Cohort Graduation Rate ..................... 104 Table 5.5b: Undergraduate First-Year, Full-Time Degree-Seeking Cohort Retention Rate ........................ 105 Table 5.6: Annual Degrees Awarded by Academic Level and Gender - University Total ......................... 106 Tables 5.7-14: Annual Degrees Awarded by Major and Gender ..................................................................... 106-116 Table 5.7: College of Business ................................................................................................................................. 106 Table 5.8: College of Liberal Arts and Social Sciences ...................................................................................... 108 Table 5.9: College of Education and Human Services ...................................................................................... 110 Table 5.10: College of Engineering .......................................................................................................................... 112 Table 5.11: School of Nursing ................................................................................................................................... 113 Table 5.12: College of Sciences and Health Professions ..................................................................................... 113 Table 5.13: College of Urban Affairs ....................................................................................................................... 115 Table 5.14: College of Law ......................................................................................................................................... 116 Table 5.15: Annual Degrees Awarded by Ethnicity and Gender ....................................................................... 117

6 SELECTED STRATEGIC INDICATORS: Academic and Administrative Programs Honors Program Table 6.1: Characteristics of New Honors Students Fall 2012-2016 ............................................................. 123 Table 6.2: Scholarship Aid for Honors Students by Financial Aid Year ........................................................ 123 Academic Characteristics Table 6.3: IPEDS Cohort Characteristics ............................................................................................................. 124 Table 6.3a: Average ACT Composite Scores by College for IPEDS Cohort Students ............................... 124 Table 6.3b: Fall IPEDS Cohort by Gender: 5 Year Trend .................................................................................. 125 Table 6.3c: Fall IPEDS Cohort by Ethnicity: 5 Year Trend ............................................................................... 125 Table 6.3d: Fall IPEDS Cohort by Age Group: 5 Year Trend ........................................................................... 125 Table 6.3e: Fall IPEDS Cohort by Selected Major: 5 Year Trend ..................................................................... 125 Table 6.3f: Fall IPEDS Cohort by Notable Student Groups: 5 Year Trend .................................................. 125 Table 6.4: Average High School GPA by College for IPEDS Cohort Students: 5 Year Trend ............... 126 Table 6.5: Undergraduate Cumulative GPA by College: 5-Year Trend .......................................................... 127 Table 6.6a: Fall 2016 Top 15 Majors by Academic Level .................................................................................... 128 Table 6.6b: Top 15 Departments by Academic Level .......................................................................................... 128 Table 6.7: Fall 2016 Top 15 Degree Seeking Programs with Highest Minority Student Enrollment by Level ............................................................................................... 129 Table 6.8: Fall 2016 Top 15 Degree Seeking Programs with Highest Female Student Enrollment by Level .................................................................................. 130 Table 6.9: Summer Class Section and Average Class Size by Time of Day and College: 5-Year Trend ........ 131 Table 6.10: Fall Class Section and Average Class Size by Time of Day and College: 5-Year Trend ......... 133 Table 6.11: Spring Class Section and Average Class Size by Time of Day and College: 5-Year Trend ......... 135 Table 6.12: Fall Undergraduate Student FTE by College and Class Time: 5-Year Trend, Fall 2012-2016 ................................................................................. 137 Table 6.13: Fall Graduate & Law Student FTE by College and Class Time: 5-Year Trend, Fall 2012-2016 ................................................................................. 137 Center for eLearning Table 6.14a: Annual Web Historical Enrollment and SCH Trends ................................................................... 138 Table 6.14b: 5-Year Trends in Web-Based Instructional Delivery Student Credit Hours Generated ......... 139 Trends in Interactive Video and Telecourse Instructional Delivery Table 6.15: 5-Year Trends in Interactive Video and Telecourse Delivery Student Credit Hours Generated ........................................................................................ 140 Table 6.16: Cleveland State University Michael Schwartz Library Collections and Instructional Media Services, FY 2016 ................................................................. 141 Table 6.17: Cleveland State University Michael Schwartz Library Use Statistics ............................................................................................................................................. 142 Table 6.18: Cleveland State University Law Library Collections FY 2016 ...................................................... 142

7 Faculty & Staff Table 7.1: Full-Time Employees by Standard Occupational Classifi cation (SOC), Fall 2016 ......................... 147 Table 7.2: Full-Time Employees by Gender, Ethnicity, and SOC Category, Fall 2016 .............................. 148 Table 7.3: Full-Time Employees: Women and Minorities as a Percentage of Total by SOC Category, Fall 2016 ..................................................................... 152 Table 7.4: Total Employees by SOC Category, Fall 2016 .................................................................................. 154 Table 7.5: Full-Time Faculty by Rank and College, Fall 2016 ........................................................................... 155 Table 7.6: Full-Time Faculty by Gender and College, Fall 2016 ...................................................................... 155 Table 7.6a: Full-Time Faculty by College, Gender and Rank, Fall 2016 .......................................................... 156 Table 7.7: Full-Time Faculty by Highest Degree Attained, Fall 2016 ............................................................. 156 Table 7.8: Full-Time Tenured/Tenure-Track and Non-Tenure Track Faculty by College/Department: 5-Year Trend .................................................................... 157 Table 7.9: Percentage of Undergraduate Student Credit Hours (SCH) Generated by Part-Time Faculty, Fall 2016 ........................................................................................ 159 Table 7.10: Women and Minorities as a Percent of Full-Time Faculty, Selected Ohio 4-Year Institutions, Fall 2010-2016 ........................................................................... 162 Table 7.11: Full-Time Faculty as a Percentage of Total Full-Time Employees, Selected Ohio 4-Year Institutions, Fall 2010-2016 ........................................................................... 162 Table 7.12: Rate of Annual Student FTE to Number of Full-Time Faculty Selected Ohio 4-Year Institutions Fiscal Years 2010-2016 ............................................................. 163 Table 7.13: Student FTE to Full-Time Staff Ratio Selected Ohio 4-Year Institutions Main Campuses Only Fall 2010-2016 ................................................................................................. 163
8 SELECTED ADMINISTRATIVE CENTERS, DEPARTMENTS & OFFICES Application, Admission, and Yield Table 8.1: University Totals Application Trends Unduplicated for Degree-Seeking Students, Fall 2010-2016 ................................................................................... 167 Table 8.1a: New First Year Undergraduate Application Trends for Degree-Seeking Students, Fall 2010-2016 ................................................................................... 167 Table 8.1b: New Transfer Undergraduate Application Trends for Degree-Seeking Students, Fall 2010-2016 ................................................................................... 167 Table 8.1c: New Law Application Trends for Degree-Seeking Students, Fall 2010-2016 ........................... 167 Table 8.1d: New Graduate Application Trends for Degree-Seeking Students, Fall 2010-2016 .................. 167 Offi ce of Advancement Table 8.2: CSU Foundation: 5 Year Endowment Growth by College/Division ......................................... 168 Table 8.3: CSU Foundation: Endowed Scholarship, Donors & Giving ........................................................ 169 Philanthropic Highlights: 2016-2017 .................................................................................................. 169 Athletics Department Table 8.4: Athletic Sports at Cleveland State University by Enrollment ........................................................ 170 Table 8.5 Athletic Sports at Cleveland State University 4, 5 and 6 Year Graduation Rate .......................................................................................................... 170
Finance Table 8.6: Statement of Revenues, Expenditures and Other Changes, Fiscal Years 2012-2016 .............. 171 Table 8.7: Public Service Expenditures as a Percentage of Total Expenditures, Selected Ohio 4-Year Institutions, Main Campuses Only, Fiscal Years 2012-2016.................. 173 Table 8.8: Benefi t Expenditures as a Percentage of Total Funding Unit Expenditures Selected Ohio 4-Year Institutions, Main Campuses Only, Fiscal Years 2012-2016.................. 173 Table 8.9: Scholarship and Fellowship Expenditures as a Percentage of Total Expenditures Selected Ohio 4-Year Institutions, Main Campuses Only, Fiscal Years 2012-2016.................. 174 Financial Aid Table 8.10: Financial Aid Awards to Undergraduate Students by Full-Time/Part-Time Status: Average Aid Package and Academic Year ............................. 174 Table 8.11: Financial Aid Awards Fall Cohort, Full-Time, First-Time, Degree-Seeking Undergraduate Students ......................................................................................................................... 175 Table 8.12: Financial Aid Awards to Fall Term Undergraduate Students........................................................ 175 Table 8.13: Graduate Student Financial Aid Awards by Full-Time/Part-Time Status & Average Aid Package .............................................................. 176 Table 8.14: Graduate Student Financial Aid Awards by Types of Financial Aid, Fall 2012-2016 ............. 176 Table 8.15: Law Student Financial Aid Awards by Full-Time/Part-Time Status and Average Aid Package .................................................................. 176 Table 8.16: Law Students Financial Aid Awards by Types of Financial Aid, Fall 2012-2016 ..................... 176 Table 8.17: Undergraduate Cost of Attendance (COA) ...................................................................................... 177 Table 8.18: Annualized Full-Time Undergraduate Tuition and Fees for Selected Main Campuses of Ohio, 4 Year Institutions, 2016-2017 ............................................. 177 Table 8.19: Award of Financial Aid at Ohio’s Public Title IV Postsecondary Institutions ........................ 178 Financial Aid Notes .................................................................................................................................................................. 178 Center for International Services and Programs (CISP) Table 8.20: CSU Fulbright Scholar Awards, 1973–2017 ...................................................................................... 179 Table 8.21: Cleveland State University International Academic Initiatives ...................................................... 180 Table 8.22: Study Abroad Student Enrollment by Academic Year (Summer, Fall and Spring) and Program Type ................................................................................. 181 Table 8.23: Study Abroad Student Enrollment by Academic Year (Summer, Fall and Spring) and College .............................................................................................. 181 Table 8.24: Study Abroad Student Enrollment by Academic Year (Summer, Fall and Spring) and Course Level .................................................................................... 181 Table 8.25: Key International Links.......................................................................................................................... 182 Offi ce of Space Management Table 8.26: Cleveland State University Fall 2016 Building Inventory ............................................................... 183 Accreditation ............................................................................................................................................... 184 List of College Acronyms & Abbreviations .............................................................................................. 185 Other Acronyms and Abbreviations .......................................................................................................... 185 Book of Trends 2017 .................................................................................................................................. 186

Diversity Index Continuing our commitment to recognize the diversity of our campus, this year we are providing a Diversity Index for readers of the Book of Trends. The Index gives page numbers for all tables and graphs relating to gender and ethnicity, so that readers can easily locate information about all aspects related to our campus’ diverse makeup.
2 CAMPUS ENROLLMENT CHARACTERISTICS AND TRENDS
Table 2.3: Full-Time Enrollment by Ethnicity and Gender-Fall 2016 .............................................................. 11 Table 2.4: Total Enrollment by Ethnicity and Gender-Fall 2016 ....................................................................... 11
3 ENROLLMENT CHARACTERISTICS OF STUDENTS IN CSU COLLEGES
Table 3.21: CSU Total Fall Enrollment by College and Ethnicity: 5-Year Trend .............................................. 51 Table 3.22: CSU Undergraduate Fall Enrollment by College and Ethnicity: 5-Year Trend ............................ 55 Table 3.23: CSU Graduate and Law Fall Enrollment by College and Ethnicity: 5-Year Trend ..................... 58
5 RETENTION AND GRADUATION
Table 5.1: Fall to Fall Retention Rates for IPEDS Cohort by Ethnicity and Gender Enrolled Fall 2011-2015/ Returned Fall 2012-2016 .................................................. 101 Table 5.6: Annual Degrees Awarded by Academic Level and Gender - University Total ........................... 106 Tables 5.7-14: Annual Degrees Awarded by Major and Gender ...................................................................... 106-116 Table 5.15: Annual Degrees Awarded by Ethnicity and Gender ......................................................................... 117
6 SELECTED STRATEGIC INDICATORS: Academic and Administrative Programs
Table 6.3b: Fall IPEDS Cohort by Gender: 5 Year Trend .................................................................................... 125 Table 6.3c: Fall IPEDS Cohort by Ethnicity: 5 Year Trend ................................................................................. 125
7 Faculty & Staff
Table 7.2: Full-Time Employees by Gender, Ethnicity, and SOC Category, Fall 2014–2016 .................... 148 Table 7.3: Full-Time Employees: Women and Minorities as a Percentage of Total by SOC Category, Fall 2014–2016 ........................................................................................................................................... 152 Table 7.6: Full-Time Faculty by Gender and College, Fall 2016 ........................................................................ 155 Table 7.6a: Full-Time Faculty by College, Gender and Rank, Fall 2016 ............................................................ 156 Table 7.10: Women and Minorities as a Percent of Full-Time Faculty, Selected Ohio 4-Year Institutions, Fall 2012-2016 ............................................................................. 162

Cleveland State University / 2013 Book of Trends12

SEC
TIO
N
1
Introduction
1Book of Trends

Cleveland State University / 2017 Book of Trends14

3Section 1 - Introduction
SEC
TIO
N
1
University Administration
Ronald M. Berkman President
Jianping Zhu Provost and Senior Vice President for Academic Aff airsStephanie Y. McHenry Senior Vice President for Business Aff airs and FinanceRobert A. Spademan Interim Vice President for Enrollment ServicesBerinthia R. LeVine Vice President for University Advancement and Executive Director of CSU Foundation, Inc.Maurice A. Stinnett Vice President for University EngagementSonali B. Wilson General Counsel and Counsel to the Board of TrusteesWilliam J. Napier Senior Advisor to President and Secretary to the Board of Trustees
Jianping Zhu Provost and Senior Vice President for Academic Aff airs
Jerzy T. Sawicki Vice President for ResearchLee Fisher Dean, Cleveland Marshall College of LawMeredith Bond Dean, College of Sciences and Health ProfessionsRoland V. Anglin Dean, Maxine Goodman Levin College of Urban Aff airsAnette Karlsson Dean, Washkewicz College of EngineeringTimothy M. Gaspar Dean, School of NursingSanjay Putrevu Dean, Monte Ahuja College of Business AdministrationGregory M. Sadlek Dean, College of Liberal Arts and Social SciencesSajit Zachariah Dean, College of Education and Human ServicesElizabeth A. Lehfeldt Dean, Jack, Joseph and Morton Mandel Honors CollegeNigamanth Sridhar Dean, College of Graduate StudiesMarius Boboc Vice Provost for Academic PlanningEdgar B. Jackson Special Assistant to the President for Health Aff airsPeter F. Meiksins Vice Provost for Academic ProgramsGlenda A. Th ornton Director, Michael Schwartz LibraryBoyd Yarbrough Vice President for Student Aff airsWilliam R. Morgan Vice Provost for Faculty Aff airs

Cleveland State University / 2017 Book of Trends4
Trustee Term
Bernardo “Bernie” F. Moreno June 1, 2011 May 1, 2018Chairperson
Dan T. Moore III July 26, 2008 May 1, 2020
Vice Chairperson
David H. Gunning II, Esq. September 13, 2012 May 1, 2021Treasurer
Thomas W. Adler July 29, 2009 May 1, 2022
Development Offi cer
Stephen F. Kirk July 16, 2015 May 1, 2023 June E. Taylor January 9, 2012 May 1, 2024
Deborah A. Vesy June 21, 2016 May 1, 2019
John Demarco August 11, 2017 May 1, 2019
Student Trustee Sierra G. Davidson July 7, 2016 May 1, 2018
Student Trustee Robyn Gordon September 30, 2016 June 30, 2018
Community Board MemberTimothy J. Cosgrove June 2, 2017 End of term as CSU Foundation Chair
Community Board Member
Linda McHugh September 30, 2016 June 30, 2018
Community Board MemberHeather Lennox June 20, 2017 June 30, 2019
Community Board MemberJoseph D. Roman September 30, 2016 June 30, 2018
Community Board MemberMark Holtzblatt, Ph.D. July 1, 2016 June 30, 2018
Faculty Representative William M. Bowen, Ph.D. September 13, 2017 August 31, 2018
Faculty Representative
William J. Napier, Ph.D., Secretary to the Board of Trustees
Executive Member Position
Aeisha Kangan President
Nadet Najjar Vice President
Olga Grech Secretary
Board of Trustees 2017-2018
Student Government Association Executive Board 2016-2017Executive Member Position
Kyle Stephens Treasurer
Catherine Tiesling Advisor
5Section 1 - Introduction
SEC
TIO
N
1
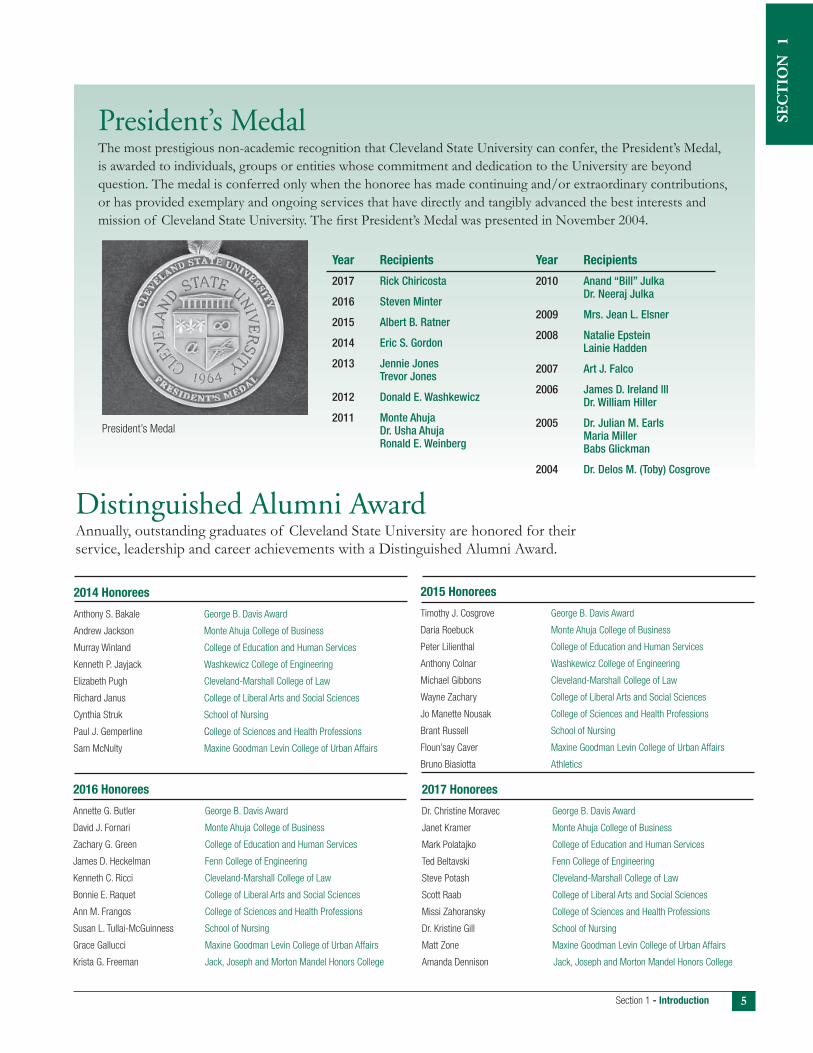
Distinguished Alumni AwardAnnually, outstanding graduates of Cleveland State University are honored for their service, leadership and career achievements with a Distinguished Alumni Award.
2017 Honorees
Dr. Christine Moravec George B. Davis Award
Janet Kramer Monte Ahuja College of Business
Mark Polatajko College of Education and Human Services
Ted Beltavski Fenn College of Engineering
Steve Potash Cleveland-Marshall College of Law
Scott Raab College of Liberal Arts and Social Sciences
Missi Zahoransky College of Sciences and Health Professions
Dr. Kristine Gill School of Nursing
Matt Zone Maxine Goodman Levin College of Urban Affairs
Amanda Dennison Jack, Joseph and Morton Mandel Honors College
2014 Honorees
Anthony S. Bakale George B. Davis Award
Andrew Jackson Monte Ahuja College of Business
Murray Winland College of Education and Human Services
Kenneth P. Jayjack Washkewicz College of Engineering
Elizabeth Pugh Cleveland-Marshall College of Law
Richard Janus College of Liberal Arts and Social Sciences
Cynthia Struk School of Nursing
Paul J. Gemperline College of Sciences and Health Professions
Sam McNulty Maxine Goodman Levin College of Urban Affairs
2015 Honorees
Timothy J. Cosgrove George B. Davis Award
Daria Roebuck Monte Ahuja College of Business
Peter Lilienthal College of Education and Human Services
Anthony Colnar Washkewicz College of Engineering
Michael Gibbons Cleveland-Marshall College of Law
Wayne Zachary College of Liberal Arts and Social Sciences
Jo Manette Nousak College of Sciences and Health Professions
Brant Russell School of Nursing
Floun’say Caver Maxine Goodman Levin College of Urban Affairs
Bruno Biasiotta Athletics
President’s MedalThe most prestigious non-academic recognition that Cleveland State University can confer, the President’s Medal, is awarded to individuals, groups or entities whose commitment and dedication to the University are beyond question. The medal is conferred only when the honoree has made continuing and/or extraordinary contributions, or has provided exemplary and ongoing services that have directly and tangibly advanced the best interests and mission of Cleveland State University. The fi rst President’s Medal was presented in November 2004.
Year Recipients
2017 Rick Chiricosta
2016 Steven Minter
2015 Albert B. Ratner
2014 Eric S. Gordon
2013 Jennie Jones Trevor Jones
2012 Donald E. Washkewicz
2011 Monte Ahuja Dr. Usha Ahuja Ronald E. Weinberg
Year Recipients
2010 Anand “Bill” Julka Dr. Neeraj Julka
2009 Mrs. Jean L. Elsner
2008 Natalie Epstein Lainie Hadden
2007 Art J. Falco
2006 James D. Ireland lll Dr. William Hiller
2005 Dr. Julian M. Earls Maria Miller Babs Glickman
2004 Dr. Delos M. (Toby) Cosgrove
President’s Medal
2016 Honorees
Annette G. Butler George B. Davis Award
David J. Fornari Monte Ahuja College of Business
Zachary G. Green College of Education and Human Services
James D. Heckelman Fenn College of Engineering
Kenneth C. Ricci Cleveland-Marshall College of Law
Bonnie E. Raquet College of Liberal Arts and Social Sciences
Ann M. Frangos College of Sciences and Health Professions
Susan L. Tullai-McGuinness School of Nursing
Grace Gallucci Maxine Goodman Levin College of Urban Affairs
Krista G. Freeman Jack, Joseph and Morton Mandel Honors College

Cleveland State University / 2017 Book of Trends6

SEC
TIO
N
2
Campus Enrollment Characteristics & Trends
2Book of Trends

Cleveland State University / 2017 Book of Trends8

9Section 2 - Campus Enrollment Characteristics & Trends
SEC
TIO
N
2
Tabl
e 2.
1: C
leve
land
Sta
te U
nive
rsit
y En
rollm
ent
by L
evel
- F
all 1
965
- 20
16
Figu
re 2
.1: C
leve
land
Sta
te U
nive
rsit
y En
rollm
ent T
rend
- F
all 1
965
- 20
16
5,00
0
10,0
00
15,0
00
20,0
00
25,0
00
1965
1966
1967
1968
1969
1970
1971
1972
1973
1974
1975
1976
1977
1978
1979
1980
1981
1982
1983
1984
1985
1986
1987
1988
1989
1990
1991
1992
1993
1994
1995
1996
1997
1998
1999
2000
2001
2002
2003
2004
2005
2006
2007
2008
2009
2010
Enrollment
2011
2012
2013
2014
2015
2016
Yea
r U
nd
erg
rad
ua
te
Gra
du
ate
La
w
Tota
l Ye
ar
Un
derg
rad
ua
te
Gra
du
ate
La
w
Tota
l
1965
6
,026
N
/A
N/A
6
,026
19
91
13,
531
4
,500
1
,060
1
9,09
1 19
66
7,8
53
N/A
N
/A
7,8
53
1992
1
2,71
6
4,5
04
979
1
8,19
9 19
67
8,4
31
184
N
/A
8,6
15
199
3
11,
966
4
,240
9
31
17,
137
1968
8
,836
2
48
N/A
9
,084
1
994
1
1,34
1
4,2
51
912
1
6,50
419
69
9,4
42
1,2
20
775
1
1,43
7
199
5
10,
698
4
,065
9
08
15,
671
1970
1
0,73
4
1,1
71
742
1
2,64
7
1996
1
0,72
8
3,9
05
889
1
5,52
2 19
71
11,
257
1
,760
7
72
13,
789
1
997
1
0,67
5
4,1
54
906
1
5,73
519
72
11,
758
2
,045
9
09
14,
712
19
98
11,
215
4
,244
8
67
16,
326
1973
1
1,98
6
2,2
12
1,0
03
15,
201
19
99
10,
453
4
,480
7
49
15,
682
1974
1
2,89
5
2,3
00
1,0
66
16,
261
20
00
10,
260
4
,658
7
62
15,
680
1975
1
3,27
8
2,5
68
1,1
28
16,
974
20
01
10,
507
4
,774
8
34
16,
115
1976
1
3,40
1
2,8
08
1,1
38
17,
347
2
002
1
0,40
5
4,9
41
817
1
6,16
319
77
13,
896
2
,851
1
,168
1
7,91
5
200
3
10,
300
5
,262
8
15
16,
377
1978
1
3,14
3
3,1
25
1,1
64
17,
432
20
04
9,8
70
5,2
59
752
1
5,88
1 19
79
13,
154
3
,242
1
,184
1
7,58
0
200
5
9,6
05
5,1
97
748
1
5,55
019
80
14,
330
3
,751
1
,169
1
9,25
0
2006
9
,525
4
,905
7
12
15,
142
1981
1
4,16
7
3,8
83
1,0
90
19,
140
2
007
9
,798
4
,873
7
12
15,
383
1982
1
4,17
7
3,7
15
1,0
52
18,
944
2
008
9
,825
4
,942
6
72
15,
439
1983
1
4,19
5
3,7
68
979
1
8,94
2
2009
1
0,70
8
5,1
53
645
1
6,50
6 19
84
13,
426
3
,589
1
,018
1
8,03
3
2010
1
1,49
6
5,2
80
610
1
7,38
6 19
85
12,
502
3
,347
9
17
16,
766
2
011
1
1,72
2
5,1
62
563
1
7,44
719
86
13,
220
4
,005
1
,016
1
8,24
1
2012
1
2,03
9
4,9
85
501
1
7,52
5 19
87
13,
236
3
,945
1
,006
1
8,18
7
2013
1
2,35
9
4,9
02
469
1
7,73
0 19
88
12,
971
3
,850
1
,000
1
7,82
1
2014
1
2,21
8
4,6
85
442
1
7,34
5 19
89
13,
409
4
,115
1
,011
1
8,53
5
2015
12
,446
4,
395
428
17,2
69
1990
1
3,82
5
4,3
31
1,0
64
19,
220
2016
12
,434
4,
144
381
16,9
59
No
te: C
SU
sw
itched
fro
m q
uart
er
to s
em
este
r te
rms in 1
998.

Cleveland State University / 2017 Book of Trends10
Tabl
e 2.
2: E
nrol
lmen
t by
Col
lege
, Lev
el a
nd L
oad
- Fa
ll 20
16
Figu
re 2
.2a:
Enr
ollm
ent
by L
evel
Fa
ll 20
16Fi
gure
2.2
b: E
nrol
lmen
t by
Loa
d an
d Le
vel
Fa
ll 20
16
24%
3%
73%
14%
54%
Un
derg
rad
ua
te
G
rad
ua
te &
La
w
Tota
l
U
nd
erg
rad
ua
te
Un
derg
rad
ua
te
Gra
du
ate
&
Gra
du
ate
&
Colleg
e
Fu
ll-T
ime
Pa
rt-T
ime
Tota
l %
of
Tota
l Fu
ll-T
ime
Pa
rt-T
ime
La
w T
ota
l
La
w %
of
Tota
l
Fu
ll-T
ime
Pa
rt-T
ime
Tota
l %
of
Tota
l
Busi
ness
1
,704
4
77
2,1
81
18%
3
39
526
8
65
19%
2
,043
1
,003
3
,046
18
%CL
ASS
1,9
29
563
2
,492
20
%
243
1
94
437
10
%
2,1
72
757
2
,929
17
%Ed
ucat
ion
467
2
16
683
5%
2
62
825
1
,087
24
%
729
1
,041
1
,770
10
%Nu
rsin
g 4
97
104
6
01
5%
12
4
3
55
1%
5
09
147
6
56
4%En
gine
erin
g 1
,570
3
24
1,8
94
15%
3
89
266
6
55
14%
1
,959
5
90
2,5
49
15%
Scie
nce
2,2
28
660
2
,888
23
%
583
2
41
824
18
%
2,8
11
901
3
,712
22
%Ur
ban
Affa
irs
213
1
97
410
3%
5
1
146
1
97
4%
264
3
43
607
4%
Law
-
-
-
0%
2
41
140
3
81
8%
241
1
40
381
2%
Unde
rgra
duat
e St
udie
s 6
02
447
1
,049
8%
-
-
-
0%
6
02
447
1
,049
6%
Unde
rgra
duat
e No
n-De
gree
1
1
159
1
70
1%
-
-
-
0%
11
1
59
170
1%
Grad
uate
Stu
dies
-
-
-
0%
1
2
3
24
1%
1
2
3
24
0%
Othe
r1 -
6
6
66
1%
-
-
-
0%
-
6
6
66
0%
Tota
l 9
,221
3
,213
1
2,43
4
100%
2
,121
2
,404
4
,525
10
0%
11,
342
5
,617
1
6,95
9
100%
No
te: U
nder
grad
uate
full-
time
stat
us: m
inim
um o
f 12
hour
s; G
rad
uate
full-
time
stat
us: m
inim
um o
f 9 h
ours
; Law
full-
time
stat
us: m
inim
um o
f 13
hour
s.
1 O
ther
incl
udes
stu
den
ts e
nrol
led
in A
ir Fo
rce,
Car
eer
Ser
vice
s, E
nglis
h as
a S
econ
d L
angu
age,
Mili
tary
Sci
ence
, Sp
ecia
l pro
gram
and
Stu
dy
Ab
road
.
11Section 2 - Campus Enrollment Characteristics & Trends
SEC
TIO
N
2
No
te: U
nd
erg
rad
ua
te f
ull-t
ime
sta
tus: m
inim
um
of 12 h
ours
G
rad
ua
te f
ull-t
ime
sta
tus: m
inim
um
of 9 h
ours
L
aw
fu
ll-t
ime
sta
tus: m
inim
um
of 13 h
ours
1 5
stu
dents
(2 full-
tim
e, 3 p
art
-tim
e) re
port
ed
their g
end
er
as “
unsp
ecifi
ed
”
Figu
re 2
.4a:
Tot
al E
nrol
lmen
t by
Eth
nici
ty
Fall
2016
Figu
re 2
.4b:
Tot
al E
nrol
lmen
t by
Gen
der
Fa
ll 20
16
8.8%
2.7%
61.4
%
2.2%
0.2%
3.4%
16.4
%4.
8%
0.1%
Fu
ll-T
ime
Stu
den
ts
Am
eri
ca
n I
nd
ian
/
Ala
sk
a N
ati
ve
Asia
n
Bla
ck
/Afr
ica
n
Am
eri
ca
n
His
pa
nic
/
La
tin
oW
hit
e
Na
tive H
aw
aii
an
or
Oth
er
Pa
cifi
c
Isla
nd
er
Two
or
mo
re
races
No
n R
esid
en
t
Ali
en
U
nk
no
wn
Tota
l
Gra
nd
Tota
l
Mal
e F
emal
eM
ale
Fem
ale
Mal
e F
emal
eM
ale
Fem
ale
Mal
e F
emal
eM
ale
Fem
ale
Mal
e F
emal
eM
ale
Fem
ale
Mal
e F
emal
eM
ale
Fem
ale
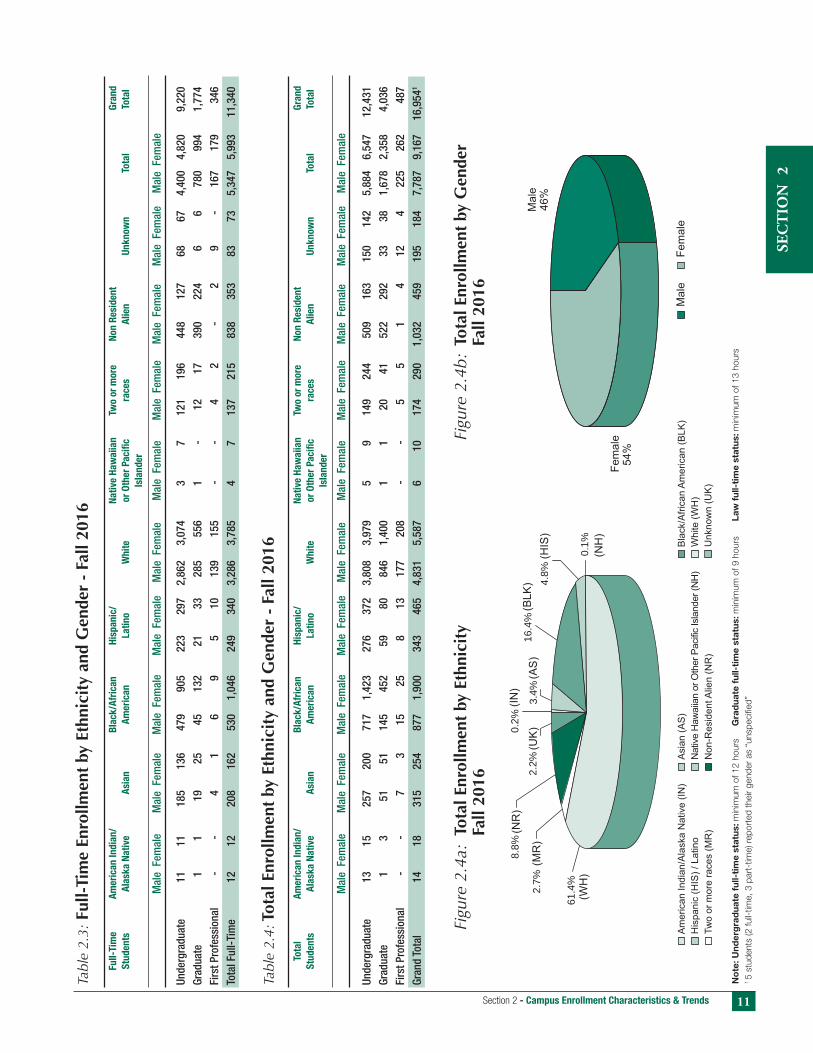
Tabl
e 2.
3: F
ull-
Tim
e En
rollm
ent
by E
thni
city
and
Gen
der
- Fa
ll 20
16
Unde
rgra
duat
e 1
1
11
1
85
136
4
79
905
2
23
297
2
,862
3
,074
3
7
1
21
196
4
48
127
6
8
67
4
,400
4
,820
9
,220
Gr
adua
te
1
1
19
2
5
45
1
32
21
3
3
285
5
56
1
-
12
1
7
390
2
24
6
6
780
9
94
1,7
74
Firs
t Pro
fess
iona
l -
-
4
1
6
9
5
1
0
139
1
55
-
-
4
2
-
2
9
-
167
1
79
346
To
tal F
ull-T
ime
12
1
2
208
1
62
530
1
,046
2
49
340
3
,286
3
,785
4
7
1
37
215
8
38
353
8
3
73
5
,347
5
,993
1
1,34
0
Tabl
e 2.
4: T
otal
Enr
ollm
ent
by E
thni
city
and
Gen
der
- Fa
ll 20
16
Unde
rgra
duat
e 1
3
15
2
57
200
7
17
1,4
23
276
3
72
3,8
08
3,9
79
5
9
149
2
44
509
1
63
150
1
42
5,8
84
6,5
47
12,
431
Grad
uate
1
3
5
1
51
1
45
452
5
9
80
8
46
1,4
00
1
1
20
4
1
522
2
92
33
3
8
1,6
78
2,3
58
4,0
36
Firs
t Pro
fess
iona
l -
-
7
3
1
5
25
8
1
3
177
2
08
-
-
5
5
1
4
12
4
2
25
262
4
87
Gran
d To
tal
14
1
8
315
2
54
877
1
,900
3
43
465
4
,831
5
,587
6
1
0
174
2
90
1,0
32
459
1
95
184
7
,787
9
,167
1
6,95
41
Tota
l
Stu
den
ts
Am
eri
ca
n I
nd
ian
/
Ala
sk
a N
ati
ve
Asia
n
Bla
ck
/Afr
ica
n
Am
eri
ca
n
His
pa
nic
/
La
tin
oW
hit
e
Na
tive H
aw
aii
an
or
Oth
er
Pa
cifi
c
Isla
nd
er
Two
or
mo
re
races
No
n R
esid
en
t
Ali
en
U
nk
no
wn
Tota
l
Gra
nd
Tota
l
Mal
e F
emal
eM
ale
Fem
ale
Mal
e F
emal
eM
ale
Fem
ale
Mal
e F
emal
eM
ale
Fem
ale
Mal
e F
emal
eM
ale
Fem
ale
Mal
e F
emal
eM
ale
Fem
ale

Cleveland State University / 2017 Book of Trends12
Tabl
e 2.
5: N
ew U
nder
grad
uate
Fal
l Enr
ollm
ent
by C
olle
ge a
nd E
ntra
nce
Stat
us: 5
-Yea
r Tre
nd
Fre
sh
men
Tr
an
sfe
rs
Oth
er
Un
derg
rad
ua
te
New
Un
derg
rad
ua
te T
ota
l To
tal P
erc
en
t C
ha
ng
e
Colleg
e
2012
2013
2014
2015
2016
2012
2013
2014
2015
2016
2012
2013
2014
2015
2016
2012
2013
2014
2015
2016
1-Y
ea
r 5-Y
ea
r
Busi
ness
1
96
243
2
34
232
2
50
32
4
323
3
49
294
2
84
24
2
1
11
3
3
544
5
87
594
5
29
537
2%
-1%
CLAS
S 4
64
520
4
34
293
3
24
46
6
449
3
39
322
3
11
37
2
4
12
1
6
8
9
67
993
7
85
631
6
43
2%
-3
4%Ed
ucat
ion
70
9
7
56
8
7
82
113
1
29
103
1
15
64
2
1
30
3
1
16
7
204
2
56
190
2
18
153
-
30%
-2
5%Nu
rsin
g 1
19
135
1
23
146
1
46
6
0
38
3
8
35
5
0
4
10
8
1
3
4
1
83
183
1
69
194
2
00
3%
9%
Engi
neer
ing
215
2
25
226
2
87
314
137
1
47
143
1
81
148
1
5
19
8
1
5
11
367
3
91
377
4
83
473
-2%
29
%Sc
ienc
e 4
06
421
3
61
454
4
48
40
7
442
3
54
354
3
68
125
9
7
77
9
7
102
938
9
60
792
9
05
918
1%
-2%
Urba
n Af
fairs
9
8
1
4
7
14
65
5
8
81
9
7
75
2
4
2
1
-
76
7
0
97
1
05
89
-
15%
17
%Un
derg
radu
ate
Stud
ies
110
1
04
143
3
41
328
74
7
2
111
1
30
87
2
34
259
2
60
196
1
66
4
18
435
5
14
667
5
81
-13
%
39%
Unde
rgra
duat
e No
n-De
gree
-
- -
- -
- -
- -
- -
1
29
114
8
8
127
9
4
1
29
114
8
8
127
9
4
-26
%
-27%
Othe
r1 -
- -
1
-
- -
- -
-
83
5
8
86
5
1
36
83
5
8
86
5
2
36
-
31%
-5
7%U
NIV
ER
SIT
Y
1,5
89 1,7
53
1,5
91
1,8
48
1,9
06
1,6
46 1,6
58
1,5
18
1,5
28
1,3
87
674
636
583
535
431
3
,909
4,0
47
3,6
92
3,9
11
3,7
24
-5
%
-5%
Tabl
e 2.
6: N
ew G
radu
ate
& L
aw F
all E
nrol
lmen
t by
Col
lege
and
Ent
ranc
e St
atus
: 5-Y
ear T
rend
M
aste
r’s/L
aw
Docto
ral
O
ther
Gra
du
ate
N
ew
Gra
du
ate
/La
w T
ota
l
To
tal P
erc
en
t C
ha
ng
e
Colleg
e
2012
2013
2014
2015
2016
2012
2013
2014
2015
2016
2012
2013
2014
2015
2016
2012
2013
2014
2015
2016
1-Y
ea
r 5-Y
ea
r
Busi
ness
3
37
296
3
07
201
2
07
-
10
-
- -
9
9
69
4
4
37
5
4
4
36
375
3
51
238
2
61
10
%
-40%
CLAS
S 1
58
122
1
56
125
1
21
-
- -
- -
3
7
52
3
2
25
2
8
1
95
174
1
88
150
1
49
-1
%
-24%
Educ
atio
n 2
79
243
2
62
272
2
29
6
8
7
6
7
5
8
59
5
1
47
5
1
3
43
310
3
20
325
2
87
-12
%
-16%
Nurs
ing
16
1
9
23
1
8
22
- -
- -
-
3
3
3
2
3
1
9
22
2
6
20
2
5
25
%
32%
Engi
neer
ing
94
1
44
134
2
44
149
6
7
10
1
1
3
7
3
8
5
5
1
07
154
1
52
260
1
57
-40
%
47%
Scie
nce
187
1
76
194
1
91
194
17
1
9
13
9
2
1
36
3
5
37
3
7
41
240
2
30
244
2
37
256
8%
7%Ur
ban
Affa
irs
48
3
2
45
4
2
30
2
2
4
1
2
16
3
4
23
2
5
26
66
6
8
72
6
8
58
-
15%
-1
2%La
w
139
1
35
143
1
09
98
- -
- -
-
7
25
2
4
24
1
7
1
46
160
1
67
133
1
15
-14
%
-21%
Grad
uate
Stu
dies
-
- -
- -
-
- -
- -
6
2
2
12
1
3
17
6
22
1
2
13
1
7
31
%
183%
UN
IVE
RS
ITY
1
,258 1,1
67 1,2
64
1,2
02
1,0
50
3
1
46
34
27
33
269
302
234
215
242
1
,558
1,5
15
1,5
32
1,4
44
1,3
25
-8
%
-15%
1 O
ther
Gra
duate
inclu
des s
tud
ents
enro
lled
in n
on-d
egre
e c
ours
es a
nd
tra
nsfe
rs. P
art
-tim
e n
ew
Maste
rs a
nd
Docto
ral stu
dents
are
als
o u
nd
er
Oth
er
Gra
duate
now
.

13Section 2 - Campus Enrollment Characteristics & Trends
SEC
TIO
N
2
Table 2.7: New Undergraduate Fall Enrollment by Academic Load: 5-Year Trend % Change in % Change in
Full-Time Full-Time Part-Time Part-Time
College 2012 2013 2014 2015 2016 1-Year 5-Year 2012 2013 2014 2015 2016 1-Year 5-Year
Business 407 482 480 434 462 6% 14% 137 105 114 95 75 -21% -45%CLASS 821 864 700 538 556 3% -32% 146 129 85 93 87 -6% -40%Education 179 202 145 167 127 -24% -29% 25 54 45 51 26 -49% 4%Nursing 164 169 145 162 175 8% 7% 19 14 24 32 25 -22% 32%Engineering 311 314 338 440 426 -3% 37% 56 77 39 43 47 9% -16%Science 764 790 656 779 772 -1% 1% 174 170 136 126 146 16% -16%Urban Affairs 57 48 51 55 51 -7% -11% 19 22 46 50 38 -24% 100%Undergraduate Studies 207 202 233 460 409 -11% 98% 211 233 281 207 172 -17% -18%Undergraduate Non-Degree2 19 12 9 21 10 -52% -47% 110 102 79 106 84 -21% -24%Other1 - - - - - - - 83 58 86 52 36 -31% -57%Total New Undergraduate 2,929 3,083 2,757 3,056 2,988 -2% 2% 980 964 935 855 736 -14% -25%
Table 2.8: New Graduate & Law Fall Enrollment by Academic Load: 5-Year Trend % Change in % Change in
Full-Time Full-Time Part-Time Part-Time
College 2012 2013 2014 2015 2016 1-Year 5-Year 2012 2013 2014 2015 2016 1-Year 5-Year
Business 209 153 158 122 136 11% -35% 227 222 193 116 125 8% -45%CLASS 88 77 115 88 96 9% 9% 107 97 73 62 53 -15% -50%Education 102 127 108 129 103 -20% 1% 241 183 212 196 184 -6% -24%Nursing 9 13 10 7 11 57% 22% 10 9 16 13 14 8% 40%Engineering 29 32 38 225 127 -44% 338% 78 122 114 35 30 -14% -62%Science 137 138 149 179 185 3% 35% 103 92 95 58 71 22% -31%Urban Affairs 24 16 16 21 20 -5% -17% 42 52 56 47 38 -19% -10%Law 109 114 117 74 78 5% -28% 37 46 50 59 37 -37% 0%Graduate Studies2 1 - - - 1 - 0% 5 22 12 13 16 23% 220%
Total New Graduate & Law 708 670 711 845 757 -10% 7% 850 845 821 599 568 -5% -33%
Table 2.9: New Fall Enrollment by College: 5-Year Trend Percent Change
College 2012 2013 2014 2015 2016 1-Year 5-Year
Business 980 962 945 767 798 4% -19%CLASS 1,162 1,167 973 781 792 1% -32%Education 547 566 510 543 440 -19% -20%Nursing 202 205 195 214 225 5% 11%Engineering 474 545 529 743 630 -15% 33%Science 1,178 1,190 1,036 1,142 1,174 3% 0%Urban Affairs 142 138 169 173 147 -15% 4%Law 146 160 167 133 115 -14% -21%Undergraduate Studies 418 435 514 667 581 -13% 39%Undergraduate Non-Degree2 129 114 88 127 94 -26% -27%Graduate Studies 6 22 12 13 17 31% 183%Other1 83 58 86 52 36 -31% -57%Total New Students 5,467 5,562 5,224 5,355 5,049 -6% -8%
Undergraduate full-time status: Any student registered for a minimum of 12 hours.
Graduate full-time status: Any student registered for a minimum of 9 hours.
Law full-time status: Any student registered for a minimum of 13 hours.
1 Other includes students enrolled in Air Force, Career Services, English as a Second Language, Military Science, Special Programs and Study Abroad.
2 Undergraduate Non-Degree and Graduate Studies fl uctuations are due to the reclassifi cation of academic plans.

Cleveland State University / 2017 Book of Trends14
Tabl
e 2.
10: F
all E
nrol
lmen
t by
Cla
ss S
tand
ing
and
Stud
ent
Cre
dit
Hou
rs: 5
-Yea
r Tre
nd
Tab
le 2
.10a
: E
NR
OLLM
EN
T B
Y C
LA
SS
STA
ND
ING
P
erc
en
t C
ha
ng
e
Cla
ss S
tan
din
g
2012
%
2013
%
2014
%
2015
%
2016
%
1-Y
ea
r 5-Y
ea
r
Fres
hmen
3
,175
18
%
3,3
56
19%
3
,156
18
%
3,3
29
19%
3
,110
18
%
-7%
-2
%So
phom
ores
1
,830
10
%
1,9
37
11%
2
,011
12
%
1,9
63
11%
2
,122
13
%
8%
16%
Juni
ors
2,3
00
13%
2
,410
14
%
2,4
47
14%
2
,533
15
%
2,5
30
15%
0%
10
%Se
nior
s 4
,734
27
%
4,6
56
26%
4
,604
27
%
4,6
21
27%
4
,672
28
%
1%
-1%
Mas
ters
4
,501
26
%
4,3
93
25%
4
,204
24
%
3,9
47
23%
3
,730
22
%
-5%
-1
7%Do
ctor
al
484
3%
5
09
3%
481
3%
4
48
3%
414
2%
-8
%
-14%
Law
5
01
3%
469
3%
4
42
3%
428
2%
3
81
2%
-11%
-2
4%To
tal
17,5
25
100%
1
7,7
30
100%
1
7,3
45
100%
1
7,2
69
100%
1
6,9
59
100%
-2
%
-3%
Tab
le 2
.10b
: S
TU
DE
NT C
RE
DIT
HO
UR
S B
Y C
OU
RS
E L
EV
EL
P
erc
en
t C
ha
ng
e
Cla
ss S
tan
din
g
2012
%
2013
%
2014
%
2015
%
2016
%
1-Y
ea
r 5-Y
ea
r
Deve
lopm
enta
l 2
,690
1%
2
,898
1%
1
,855
1%
1
,783
1%
1
,937
1%
9%
-2
8%Lo
wer
83,5
54
43%
8
9,33
7
45%
8
5,36
1
45%
8
9,54
4
46%
8
8,81
2
46%
-1
%
6%Up
per
62
,180
32
%
63,
338
32
%
58,
899
31
%
63,
407
33
%
65,
830
34
%
4%
6%M
aste
rs
34
,180
18
%
33,
535
17
%
32,
617
17
%
31,
786
16
%
29,
473
15
%
-7%
-1
4%Do
ctor
al
3,
306
2%
3
,566
2%
3
,242
2%
3
,057
2%
3
,131
2%
2%
-5
%La
w
6,
776
4%
6
,116
3%
5
,720
3%
5
,282
3%
4
,877
3%
-8
%
-28%
Tota
l
192,6
86
100%
1
98,7
90
100%
1
87,6
94
100%
1
94,8
59
100%
1
94,0
60
100%
0%
1%
Stu
dy A
bro
ad
: S
tud
y A
bro
ad
(S
AB
) cours
es a
re inclu
ded
in t
he c
ours
e level of U
pp
er
rath
er
than follo
win
g t
he s
tand
ard
num
eric v
alu
es a
ssocia
ted
with t
he c
ata
log n
um
ber
of th
e c
ours
e.
No
te: The low
er
num
ber
of units for
Develo
pm
enta
l cours
es r
efl e
cts
a r
ecate
gorization o
f som
e E
nglis
h c
lasses fro
m D
evelo
pm
enta
l to
Low
er.
Figu
re 2
.10a
: Enr
ollm
ent
by C
lass
Sta
ndin
gFi
gure
2.1
0b: S
tude
nt C
redi
t H
ours
by
Cou
rse
Leve
l
2012
2013
2014
2015
2016
2012
2013
2014
2015
2016

15Section 2 - Campus Enrollment Characteristics & Trends
SEC
TIO
N
2
Tabl
e 2.
11: T
otal
Fal
l 201
6 En
rollm
ent
by A
cade
mic
Lev
el: 5
-Yea
r Tre
nd
P
erc
en
t C
ha
ng
e
Aca
dem
ic L
evel
20
12
2
01
3
20
14
2
01
5
20
16
1
yea
r
5 y
ea
r
Unde
rgra
duat
es
12,0
39
12,3
59
12,2
18
12,4
46
12,4
34
0%
3%M
aste
rs
4,50
1
4,39
3
4,20
4
3,94
7
3,73
0
-5%
-1
7%Do
ctor
al
484
50
9
481
44
8
414
-8
%
-14%
Law
50
1
469
44
2
428
38
1
-11%
-2
4%U
niv
ers
ity T
ota
l 17,5
25
17,7
30
17,3
45
17,2
69
16,9
59
-2%
-3
%

Cleveland State University / 2017 Book of Trends16
1 Other includes students enrolled in Air Force, Career Services, English as a Second Language, Military Science, Special Programs and Study Abroad.
Note: This table uses units progress rather than units taken. Undergraduate Non-Degree and Graduate Studies fl uctuations are due to procedural changes.
Table 2.12: Fall Enrollment by College: 5-Year Trend
2012 2013 2014 2015 2016 Percent Change
College Enrollment % Enrollment % Enrollment % Enrollment % Enrollment % 1-Year 5-Year
Business 3,369 19% 3,301 19% 3,448 20% 3,009 17% 3,046 18% 1% -10%CLASS 3,731 21% 3,691 21% 3,252 19% 2,979 17% 2,929 17% -2% -21%Education 2,266 13% 2,259 13% 2,052 12% 1,952 11% 1,770 10% -9% -22%Nursing 592 3% 628 4% 600 3% 589 3% 656 4% 11% 11%Engineering 1,569 9% 1,771 10% 1,948 11% 2,527 15% 2,549 15% 1% 62%Science 3,727 21% 3,841 22% 3,687 21% 3,689 21% 3,712 22% 1% 0%Urban Affairs 620 4% 576 3% 606 3% 653 4% 607 4% -7% -2%Law 501 3% 469 3% 442 3% 428 2% 381 2% -11% -24%Undergraduate Studies 780 4% 863 5% 965 6% 1,094 6% 1,049 6% -4% 34%Undergraduate Non-Degree 245 1% 220 1% 170 1% 209 1% 170 1% -19% -31%Graduate Studies 19 0% 28 0% 24 0% 23 0% 24 0% 4% 26%Other1 106 1% 83 0% 151 1% 117 1% 66 0% -44% -38%Total Enrollment 17,525 100% 17,730 100% 17,345 100% 17,269 100% 16,959 100% -2% -3%
Table 2.13: Fall Student Credit Hours (SCH) by College: 5-Year Trend
2012 2013 2014 2015 2016 Percent Change
College SCH % SCH % SCH % SCH % SCH % 1-Year 5-Year
Business 26,889 14% 27,276 14% 27,030 14% 25,519 13% 27,275 14% 7% 1%CLASS 58,808 31% 60,416 30% 55,231 29% 55,511 28% 55,351 29% 0% -6%Education 16,165 8% 16,224 8% 15,009 8% 15,116 8% 13,606 7% -10% -16%Nursing 4,564 2% 4,569 2% 4,364 2% 4,565 2% 4,918 3% 8% 8%Engineering 10,054 5% 11,572 6% 14,192 8% 19,414 10% 19,613 10% 1% 95%Science 56,361 29% 59,594 30% 54,556 29% 57,625 30% 56,929 29% -1% 1%Urban Affairs 10,245 5% 10,176 5% 8,870 5% 9,071 5% 8,780 5% -3% -14%Law 6,776 4% 6,116 3% 5,720 3% 5,282 3% 4,877 3% -8% -28%Undergraduate Studies 1,419 1% 1,596 1% 1,427 1% 1,499 1% 1,523 1% 2% 7%Honors 121 0% 120 0% 114 0% 132 0% 128 0% -3% 6%Other1 1,284 1% 1,131 1% 1,181 1% 1,125 1% 1,060 1% -6% -17%Total SCH 192,686 100% 198,790 100% 187,694 100% 194,859 100% 194,060 100% 0% 1%
Figure 2.12 & 2.13: Fall Enrollment and FTE (SCH/15)
0
5,000
10,000
15,000
Enrollment FTE
2014 2015 20162012 2013

17Section 2 - Campus Enrollment Characteristics & Trends
SEC
TIO
N
2
Figure 2.14: Registered Student Credit Hours by Level - Fall 2016
Table 2.14: Registered Student Credit Hours by Level - Fall 2016
Registered Credit
Undergraduate Graduate Law All
Hours Enrollment Cumulative % Enrollment Cumulative % Enrollment Cumulative % Enrollment Cumulative %
0 66 1% 0 0% 0 0% 66 0% 1 46 1% 142 3% 1 0% 189 2% 2 36 1% 37 4% 2 1% 75 2% 3 471 5% 402 14% 1 1% 874 7% 4 173 6% 296 21% 2 2% 471 10% 5 37 7% 31 22% 2 2% 70 10% 6 892 14% 840 42% 29 10% 1,761 21% 7 294 16% 191 47% 12 13% 497 24% 8 126 17% 325 55% 3 14% 454 26%GRAD FT 9 628 22% 832 75% 15 18% 1,475 35% 10 284 25% 221 80% 17 22% 522 38% 11 160 26% 124 83% 32 30% 316 40%UGRD FT 12 1,635 39% 271 90% 18 35% 1,924 51%LAW FT 13 1,248 49% 79 91% 15 39% 1,342 59% 14 1,046 57% 101 94% 30 47% 1,177 66% 15 2,184 75% 124 97% 103 74% 2,411 80% 16 1,566 88% 61 98% 45 86% 1,672 90% 17 773 94% 55 100% 38 96% 866 95% 18 587 99% 5 100% 11 99% 603 99% 19 139 100% 4 100% 3 99% 146 100% 20 24 100% 2 100% 0 99% 26 100% 21 16 100% 1 100% 1 100% 18 100% 22 1 100% 0 100% 0 100% 1 100% 23 2 100% 0 100% 1 100% 3 100%
TOTAL 12,434 4,144 381 16,959
Average 12.6 7.8 13.1 11.4
Note: For Graduate students, IPEDS defi nition of full-time status = 9 or more student credit hours is used here.
0%
20%
40%
60%
80%
Undergraduate Graduate Law
0-3 4-7 8-11 12-15 16-19 20+

Cleveland State University / 2017 Book of Trends18
Table 2.15: Enrollment by Age Category - Fall 2016 65 and Average
College Gender Under 18 18-19 20-21 22-24 25-29 30-34 35-39 40-49 50-64 Over Unknown Age
Business Female 3 180 227 282 276 119 63 79 33 2 - 26.3 Male 2 281 375 418 371 149 81 65 37 2 - 25.3 Total 5 461 602 700 647 268 144 144 70 4 - 25.7CLASS Female 13 387 417 366 233 118 85 106 94 6 - 26.1 Male - 198 267 259 161 69 45 60 37 7 - 25.7 Total 13 585 684 625 394 187 130 166 131 13 - 26.0Education Female 2 83 112 276 301 146 103 162 98 4 - 30.7 Male 1 48 36 101 98 65 53 50 30 1 - 30.1 Total 3 131 148 377 399 211 156 212 128 5 - 30.6Nursing Female 7 202 116 77 48 40 19 35 15 - - 24.3 Male - 35 14 8 14 8 8 9 1 - - 25.8 Total 7 237 130 85 62 48 27 44 16 - - 24.6Engineering Female 6 88 81 122 65 23 9 7 2 - - 23.2 Male 6 432 415 641 406 134 56 37 17 1 - 23.7 Total 12 520 496 763 471 157 65 44 19 1 - 23.6Science Female 12 588 590 657 386 149 72 78 40 - - 23.9 Male 2 238 222 270 221 93 35 40 17 2 - 24.7 Total 14 826 812 927 607 242 107 118 57 2 - 24.1Urban Affairs Female 1 18 40 65 72 38 37 53 39 3 - 32.5 Male - 9 32 51 44 40 15 23 27 - - 31.2 Total 1 27 72 116 116 78 52 76 66 3 - 32.0Law Female - - 2 75 57 21 12 15 13 1 - 29.9 Male - - 2 67 73 26 11 4 - 1 - 27.1 Total - - 4 142 130 47 23 19 13 2 - 28.6Undergraduate Female 123 248 42 22 15 6 2 6 34 66 - 27.8Studies Male 70 193 33 34 19 9 6 6 36 79 - 31.5 Total 193 441 75 56 34 15 8 12 70 145 - 29.5Undergraduate Female - 5 16 27 12 9 4 5 12 1 - 30.1Non-Degree Male - 3 6 26 11 4 7 10 11 - - 32.6 Total - 8 22 53 23 13 11 15 23 1 - 31.2Graduate Female - - - 4 5 - 1 - 1 - 1 29.5Studies Male - - - 2 4 2 1 1 2 - - 33.1 Total - - - 6 9 2 2 1 3 - 1 31.4Other1 Female - 5 2 9 7 2 1 2 - - - 25.8 Male 2 12 6 6 4 5 - 3 - - - 24.0 Total 2 17 8 15 11 7 1 5 - - - 24.8University Female 167 1,804 1,645 1,982 1,477 671 408 548 381 83 1 26.4 Male 83 1,449 1,408 1,883 1,426 604 318 308 215 93 - 25.8 Total 250 3,253 3,053 3,865 2,903 1,275 726 856 596 176 1 26.1
1Other includes students enrolled in Air Force, Career Services, English as a Second Language, Military Science, Special Programs and Study Abroad.
Note: Age is unknown for one male student in Engineering.
Average Median
University: 26.1 23Undergraduate: 24.5 21Graduate: 30.9 27Law: 28.6 26
Figure 2.15: Enrollment by Age Category - Fall 2016

19Section 2 - Campus Enrollment Characteristics & Trends
SEC
TIO
N
2
Table 2.16: Enrollment by Level and Residency Status - Fall 2016
Resident Type Undergraduate Undergraduate in % Graduate Graduate in % Law Law in % Total
Ohio Resident 11,275 91 3,211 77 372 98 14,858 Non-Ohio Resident 487 4 118 3 5 1 610 Non-Resident Alien 672 5 815 20 4 1 1,491 Total 12,434 100% 4,144 100% 381 100% 16,959
Note: Legal Studies (LGLS) who are associated with the College of Law, but working towards a graduate degree are shown in the Law column
Table 2.18: Enrollment by Ohio County Fall 2016
County Number of Students
Cuyahoga .......................................................................10,342Lake ..................................................................................1,307Lorain ...................................................................................965Medina .................................................................................496Summit ................................................................................452Geauga ................................................................................336Ashtabula ............................................................................156Trumbull ...............................................................................130Stark ....................................................................................108Erie ......................................................................................102Portage ..................................................................................95Mahoning ...............................................................................64Franklin ..................................................................................62Wayne ....................................................................................51Huron .....................................................................................47Lucas .....................................................................................32Sandusky ...............................................................................31Richland ................................................................................27Ottawa ...................................................................................23Tuscarawas ............................................................................24Ashland ..................................................................................19Hamilton ................................................................................17Fairfi eld ..................................................................................15Warren, Columbiana, Green (12/county) ...............................36Montgomery, Crawford (11/county).......................................22Bulter, Wood, Delaware (10/county) ......................................30Allen, Seneca (7/county) ........................................................14Foulton ....................................................................................6Pickaway .................................................................................5Licking, Clermont, Highland, Muskingum, Van Wert (4/county) ...............................................................................20Holmes, Darke, Perry, Defi ance, Madison, Williams, Carroll, Belmont, Coshocton (3/county) ............................................27Hancock, Clark, Morrow, Hardin, Union, Knox, Miami, Hocking, Jefferson (2/county) ...............................................................18Scioto, Auglaize, Hardon, Henry, Clinton, Washington, Adams, Mercer, Harrison, Logan, Shelby, Wyandot, Ross, Megis, Putnam (1/county) .................................................................15Total ............................................................................................... 15,094
* Excluding Non-Resident Aliens
Table 2.17: Enrollment by State Fall 2016
State Number of Students
Ohio .................................................................................... 15,094 Pennsylvania ........................................................................... 100 New York ................................................................................... 42 Michigan ................................................................................... 31 California ................................................................................... 19 Illinois ........................................................................................ 18 Wisconsin ................................................................................. 15 Florida ...................................................................................... 15 Indiana ...................................................................................... 13 Maryland ................................................................................... 10 New Jersey ............................................................................... 10 North Carolina ............................................................................. 9 Virginia ......................................................................................... 9 Kentucky ..................................................................................... 8 Texas ........................................................................................... 8 South Carolina ............................................................................ 7 Georgia, Minnesota, Connecticut, Colorado (5/state) ............ 20 Vermont, Washington, Arizona (4/state) .................................. 12 Nevada, Louisiana (3/state) ........................................................ 6 West Virginia, Missouri, Iowa, Nebraska, Kansas (2/state) ..... 10 New Hampshire, Mississippi, South Dakota, Arkansas, Oklahoma, Massachusetts, Tennessee, Oregon (1/state) ........ 8 Unknown State ........................................................................... 4 Non-Resident Alien ............................................................. 1,491 Total States........................................................................................... 16,959
Note: Table 2.16 is based on student’s residency for fee purposes,
while Table 2.17 and 2.18 are based on student’s address.
Non-Resident Aliens are those with a citizenship status of Alien Temporary.
A resident of Ohio may have mail sent to an out of state address. As a result,
Ohio resident totals may not match in the two tables.

Cleveland State University / 2017 Book of Trends20
Map of 2016 Fall Enrollment by Ohio County
Williams3
Fulton6
Defiance 3 Henry
1
Lucas32
Wood 10
PauldingPutnam
1Hancock 2
Van Wert 4 Allen
7
Mercer 1
Auglaize1
Shelby 1
Darke 3
Miami2
Clark 2
Champaign
Logan1
PrebleMontgomery
11 Greene12
Butler 10
Warren 12 Clinton
1Hamilton 17 Clermont
4
Highland 4
BrownAdams 1
Scioto 1
PikeJackson
Gallia
Meigs 1
VintonAthens
Hocking 2Ross
1
Pickaway5
Fairfield 15
Perry 3
Washington1
Morgan
Noble Monroe
Fayette
Madison 3
Franklin 62
Licking 4
Delaware10
Union 2
Knox 2
Morrow 2
Marion
Wyandot 1
Crawford11 Richland
27
Seneca 7
Hardin2
Muskingum 4
GuernseyBelmont
3
Harrison 1
Jefferson 2
Carroll3
Columbiana 12
Tuscarawas 24
Stark 108
Coshocton 3
Holmes 3
Wayne51
Ashland 19
Huron 47
Ottawa 23
Sandusky 31
Erie 102 Lorain
965
Cuyahoga10,342
1,307Lake
Geauga 336
Medina 496
Summit 452
Portage 95
Mahoning 64
Trumbull 130
Ashtabula 156
Lawrence
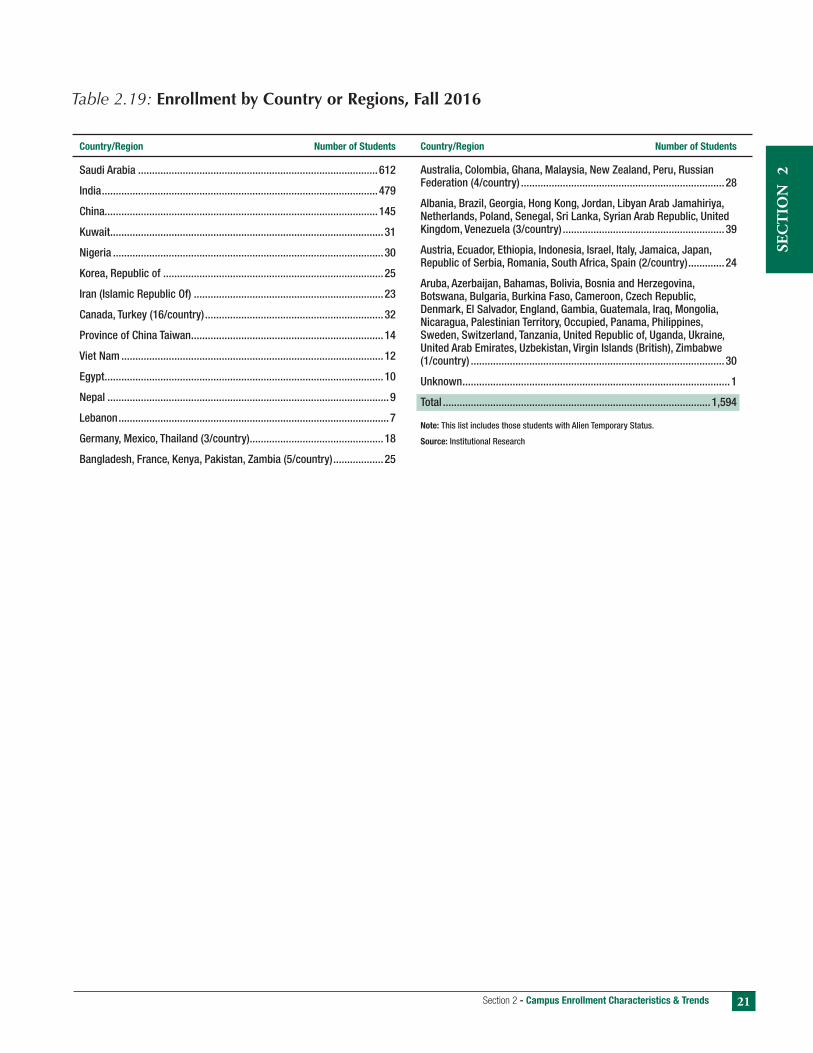
21Section 2 - Campus Enrollment Characteristics & Trends
SEC
TIO
N
2
Country/Region Number of Students
Saudi Arabia ......................................................................................612
India ...................................................................................................479
China..................................................................................................145
Kuwait ..................................................................................................31
Nigeria .................................................................................................30
Korea, Republic of ...............................................................................25
Iran (Islamic Republic Of) ....................................................................23
Canada, Turkey (16/country) ................................................................32
Province of China Taiwan .....................................................................14
Viet Nam ..............................................................................................12
Egypt ....................................................................................................10
Nepal .....................................................................................................9
Lebanon .................................................................................................7
Germany, Mexico, Thailand (3/country)................................................18
Bangladesh, France, Kenya, Pakistan, Zambia (5/country) ..................25
Table 2.19: Enrollment by Country or Regions, Fall 2016
Australia, Colombia, Ghana, Malaysia, New Zealand, Peru, Russian Federation (4/country) .........................................................................28
Albania, Brazil, Georgia, Hong Kong, Jordan, Libyan Arab Jamahiriya, Netherlands, Poland, Senegal, Sri Lanka, Syrian Arab Republic, United Kingdom, Venezuela (3/country) ..........................................................39
Austria, Ecuador, Ethiopia, Indonesia, Israel, Italy, Jamaica, Japan, Republic of Serbia, Romania, South Africa, Spain (2/country) .............24
Aruba, Azerbaijan, Bahamas, Bolivia, Bosnia and Herzegovina, Botswana, Bulgaria, Burkina Faso, Cameroon, Czech Republic, Denmark, El Salvador, England, Gambia, Guatemala, Iraq, Mongolia, Nicaragua, Palestinian Territory, Occupied, Panama, Philippines, Sweden, Switzerland, Tanzania, United Republic of, Uganda, Ukraine, United Arab Emirates, Uzbekistan, Virgin Islands (British), Zimbabwe (1/country) ...........................................................................................30
Unknown ................................................................................................1
Total ................................................................................................1,594
Note: This list includes those students with Alien Temporary Status.
Source: Institutional Research
Country/Region Number of Students

Cleveland State University / 2017 Book of Trends22
Table 2.20: Spring Enrollment by College: 5-Year Trend
2013 2014 2015 2016 2017 Percent Change
College Enrollment % Enrollment % Enrollment % Enrollment % Enrollment % 1-Year 5-Year
Business 3,201 19% 3,090 19% 3,290 20% 2,925 18% 2,934 18% 0% -8%CLASS 3,446 21% 3,389 20% 3,023 18% 2,879 18% 2,781 17% -3% -19%Education 2,285 14% 2,106 13% 1,894 12% 1,829 11% 1,705 11% -7% -25%Nursing 630 4% 641 4% 586 4% 639 4% 696 4% 9% 10%Engineering 1,534 9% 1,773 11% 1,931 12% 2,442 15% 2,390 15% -2% 56%Science 3,484 21% 3,605 22% 3,386 21% 3,455 21% 3,444 21% 0% -1%Urban Affairs 573 3% 562 3% 618 4% 617 4% 604 4% -2% 5%Law 474 3% 424 3% 417 3% 402 2% 359 2% -11% -24%Undergraduate Studies 763 5% 811 5% 867 5% 901 5% 865 5% -4% 13%Undergraduate Non-Degree 220 1% 192 1% 176 1% 184 1% 160 1% -13% -27%Graduate Studies 14 0% 27 0% 41 0% 23 0% 35 0% 52% 150%Other1 86 1% 75 0% 156 1% 105 1% 60 0% -43% -30% Total Enrollment 16,710 100% 16,695 100% 16,385 100% 16,401 100% 16,033 100% -2% -4%
Table 2.21: Spring Student Credit Hours (SCH) by College: 5-Year Trend
2013 2014 2015 2016 2017 Percent Change
College SCH % SCH % SCH % SCH % SCH % 1-Year 5-Year
Business 26,296 14% 26,563 14% 26,382 15% 25,431 14% 26,717 15% 5% 2%CLASS 55,955 31% 56,247 30% 49,903 28% 51,674 28% 50,165 28% -3% -10%Education 16,768 9% 16,065 9% 15,303 9% 15,317 8% 14,514 8% -5% -13%Nursing 5,481 3% 5,293 3% 5,123 3% 5,591 3% 5,791 3% 4% 6%Engineering 10,404 6% 12,606 7% 14,622 8% 18,991 10% 18,999 10% 0% 83%Science 50,493 28% 53,318 29% 49,300 28% 51,050 28% 51,345 28% 1% 2%Urban Affairs 9,993 5% 10,192 5% 9,028 5% 8,705 5% 8,384 5% -4% -16%Law 6,262 3% 5,498 3% 5,169 3% 4,930 3% 4,365 2% -11% -30%Undergraduate Studies 229 0% 215 0% 212 0% 258 0% 215 0% -17% -6%Honors 27 0% 57 0% 87 0% 74 0% 99 0% 34% 267%Other1 855 0% 935 1% 717 0% 887 0% 801 0% -10% -6%Total SCH 182,763 100% 186,989 100% 175,846 100% 182,908 100% 181,395 100% -1% -1%
1 Other includes students enrolled in Air Force, Career Services, English as a Second Language, Military Science, Special Program and Study Abroad.
Note: This table uses units progress rather than units taken. Undergraduate Non-Degree and Graduate Studies fl uctuations are due to procedural changes.
Figure 2.20 & 2.21: Spring Enrollment and FTE (SCH/15)
0
5,000
10,000
15,000
Enrollment FTE20172013 2014 2015 2016

23Section 2 - Campus Enrollment Characteristics & Trends
SEC
TIO
N
2
Table 2.22: Summer Enrollment by College: 5-Year Trend
2012 2013 2014 2015 2016 Percent Change
College Enrollment % Enrollment % Enrollment % Enrollment % Enrollment % 1-Year 5-Year
Business 1,733 24% 1,607 23% 1,684 25% 1,590 24% 1,357 21% -15% -22%CLASS 1,066 15% 987 14% 875 13% 802 12% 864 13% 8% -19%Education 1,374 19% 1,248 18% 1,082 16% 1,010 15% 898 14% -11% -35%Nursing 172 2% 170 2% 156 2% 152 2% 190 3% 25% 10%Engineering 445 6% 486 7% 495 7% 631 9% 853 13% 35% 92%Science 1,337 18% 1,356 20% 1,304 20% 1,279 19% 1,316 20% 3% -2%Urban Affairs 218 3% 204 3% 206 3% 245 4% 239 4% -2% 10%Law 189 3% 142 2% 133 2% 136 2% 96 1% -29% -49%Undergraduate Studies 155 2% 165 2% 214 3% 239 4% 279 4% 17% 80%Undergraduate Non-Degree 493 7% 463 7% 378 6% 473 7% 444 7% -6% -10%Graduate Studies 19 0% 16 0% 23 0% 12 0% 13 0% 8% -32%Other1 94 1% 85 1% 99 1% 88 1% 25 0% -72% -73% Total Enrollment 7,295 100% 6,929 100% 6,649 100% 6,657 100% 6,574 100% -1% -10%
Table 2.23: Summer Student Credit Hours (SCH) by College: 5-Year Trend 2012 2013 2014 2015 2016 Percent Change
College SCH % SCH % SCH % SCH % SCH % 1-Year 5-Year
Business 10,594 22% 9,902 22% 10,349 24% 9,342 23% 8,436 21% -10% -20%CLASS 10,490 22% 9,572 21% 9,170 21% 7,257 18% 8,023 20% 11% -24%Education 8,132 17% 7,220 16% 6,486 15% 6,250 15% 5,786 14% -7% -29%Nursing 1,250 3% 1,396 3% 1,312 3% 1,438 4% 1,539 4% 7% 23%Engineering 938 2% 905 2% 942 2% 1,484 4% 2,939 7% 98% 213%Science 11,951 25% 12,462 27% 11,367 26% 11,403 28% 10,872 27% -5% -9%Urban Affairs 3,041 6% 2,950 6% 2,783 6% 2,289 6% 2,074 5% -9% -32%Law 922 2% 667 1% 737 2% 699 2% 490 1% -30% -47%Undergraduate Studies - 0% - 0% - 0% 0 0% 0 0% - -Honors - 0% - 0% - 0% 0 0% 0 0% - -Other1 540 1% 461 1% 439 1% 473 1% 403 1% -15% -25%Total SCH 47,858 100% 45,535 100% 43,585 100% 40,635 100% 40,562 100% 0% -15%
1 Other includes students enrolled in Air Force, Career Services, English as a Second Language, Military Science, Special Program and Study Abroad.
Note: This table uses units progress rather than units taken. Undergraduate Non-Degree and Graduate Studies fl uctuations are due to procedural changes.
Figure 2.22 & 2.23: Summer Enrollment and FTE (SCH/15)
2016

Cleveland State University / 2017 Book of Trends24
Table 2.24: Annualized Student Credit Hours (SCH) by College: 5-Year Trend
2012-13 2013-14 2014-15 2015-16 2016-17 Percent Change
College SCH % SCH % SCH % SCH % SCH % 1-Year 5-Year
Business 63,779 16% 63,741 15% 63,761 16% 60,292 14% 62,428 15% 4% -2%
CLASS 125,253 31% 126,235 29% 114,304 28% 114,442 27% 113,539 27% -1% -9%
Education 41,065 10% 39,509 9% 36,798 9% 36,683 9% 33,906 8% -8% -17%
Nursing 11,295 3% 11,258 3% 10,799 3% 11,594 3% 12,248 3% 6% 8%
Engineering 21,396 5% 25,083 6% 29,756 7% 39,889 10% 41,551 10% 4% 94%
Science 118,805 29% 125,374 29% 115,223 28% 120,078 29% 119,146 29% -1% 0%
Urban Affairs 23,279 6% 23,318 5% 20,681 5% 20,065 5% 19,238 5% -4% -17%
Law 13,960 3% 12,281 3% 11,625 3% 10,910 3% 9,732 2% -11% -30%
Undergraduate Studies 1,648 0% 1,811 0% 1,639 0% 1,757 0% 1,852 0% 5% 12%
Graduate Studies - 0% - 0% - 0% - 0% - 0% - -
Honors 148 0% 177 0% 201 0% 206 0% 227 0% 10% 53%
Other1 2,679 1% 2,527 1% 2,337 1% 2,485 1% 2,264 1% -9% -15%
Total Annualized SCH 423,307 100% 431,314 100% 407,124 100% 418,401 100% 416,131 100% -1% -2%
Annualized FTE 14,110 14,377 13,571 13,947 13,871 -1% -2%(Annualized SCH/30)
Unduplicated Enrollment 21,510 21,523 21,025 20,922 20,394 -3% -5%
1Other includes students enrolled in Air Force, Career Services, English as a Second Language, Military Science, Physician Assistant, Special Programs and Study Abroad.
Figure 2.24: Annualized FTE (SCH/30) and Unduplicated Enrollment Trend
2016-17

25Section 2 - Campus Enrollment Characteristics & Trends
SEC
TIO
N
2
Table 2.25: Yearly Change in Enrollment by Campus Types for Ohio Institutions
Percent Change
Campus Type 2012 2013 2014 2015 2016 1-year 5-year
Community College 80,787 77,950 74,693 70,526 71,053 0.7% -12.0%State Community College 74,665 72,805 68,993 68,261 68,043 -0.3% -8.9%Technical College
†
37,279 37,038 34,729 31,866 19,837 -37.7% -46.8%University Branch Campus 55,013 53,916 52,634 51,996 51,996 0.0% -5.5%University Main Campus 287,306 288,452 288,428 289,098 289,099 0.0% 0.6%Note: (†) Stark State College of Technology was not included in Fall 2016 because their data had not yet been fi nalized. This likely accounts for most of the change observed for the Technical College category from 2015 to 2016. Because this lack of data creates a very misleading chart, we have chosen not to include Figure 2.25 from this year’s Book of Trends. Run Date: 10/12/2017.
Table 2.26: Main Campus Enrollment for Select Ohio Four Year Institutions
Percent Change
Institution 2012 2013 2014 2015 2016 1-year 5-year
UUniversity of Akron 26,930 25,573 24,563 23,505 21,511 -8.5% -20.1%Bowling Green State University 17,276 16,968 16,578 16,972 17,670 4.1% 2.3%University of Cincinnati 34,283 35,799† 36,976 37,102 37,452 0.9% 9.2%Cleveland State University 17,525 17,730 17,194 17,151 16,892 -1.5% -3.6%
Central State University 2,125 2,051 1,718 1,717 1,679 -2.2% -21.0%Kent State University 28,827 29,172† 29,674 30,215 30,272 0.2% 5.0%Miami University 18,107 18,513 18,919 19,257 19,852 3.1% 9.6%Ohio State University 57,516 58,398 59,099 59,422 60,267 1.4% 4.8%Ohio University 27,402 28,786 29,217 29,679 30,168 1.6% 10.1%Shawnee State University 4,620 4,320 4,230 3,898 3,764 -3.4% -18.5%University of Toledo 21,715 20,814 20,595 20,347 20,542 1.0% -5.4%Wright State University 16,665† 16,444† 16,528 16,745 16,401 -2.1% -1.6%Youngstown State University 13,769 13,363 12,512 12,432 12,649 1.7% -8.1%
Note: (†) Indicates institutions which had not fi nalized enrollment data by query date. Enrollment data excludes Study Abroad and Graduation Requirement course enrollments.Source: The Ohio Board of Regents HEI Student Enrollment query. Run Date: October 12, 2017.

Cleveland State University / 2017 Book of Trends26

Enrollment Characteristicsof Students in CSU Colleges
3Book of Trends
SEC
TIO
N
3

Cleveland State University / 2017 Book of Trends28
Tables 3.1 through 3.11a show the number of declared majors within
a given department and school, not the number of students.
The rest of the tables in this chapter are at the school level and do
follow the rubric of selecting students based on their primary major,
as determined by state reporting rules. As such, these tables do represent headcounts.

29Section 3 - Enrollment Characteristics of Students in CSU Colleges
SEC
TIO
N
3
Tabl
e 3.
1: C
olle
ge o
f Bus
ines
s: F
all E
nrol
lmen
t by
Leve
l and
Maj
or, 5
-Yea
r Tre
nd
Fall T
erm
P
erc
en
t C
han
ge
Dep
art
men
t/P
rog
ram
D
esc
rip
tion
2012
2013
2014
2015
2016
1 y
ear
5 y
ear
Un
derg
rad
uate
Acco
untin
g Ac
coun
ting
372
3
93
426
4
13
391
-5
%
5%Bu
sine
ss A
dmin
istr
atio
n Bu
sine
ss E
cono
mic
s 5
2
42
4
4
67
8
1
21%
56
%
Gene
ral B
usin
ess
546
5
44
523
5
04
513
2%
-6
%
Gene
ral B
usin
ess
- M
obile
-
7
3
2
27
3
3
22%
--
In
tern
atio
nal B
usin
ess
100
7
5
88
1
09
81
-2
6%
-19%
Pr
e-Ge
nera
l Bus
ines
s 2
1
3
1
-
-1
00%
-1
00%
Bu
sine
ss B
iote
chno
logy
(Cer
tifi c
ate)
1
1
-
-
-
--
-1
00%
Com
pute
r & In
form
atio
n Sc
ienc
e Co
mpu
ter a
nd In
form
atio
n Sc
ienc
e 21
3
206
2
50
-
-
--
-100
%
Com
pute
r Sci
ence
2
6
28
1
2
-
-
--
-100
%Fi
nanc
e Fi
nanc
e 1
31
142
2
35
272
3
01
11%
13
0%In
form
atio
n Sy
stem
s In
form
atio
n Sy
stem
s 1
09
108
1
31
156
1
61
3%
48%
Man
agem
ent
Man
agem
ent &
Lab
or R
elat
ions
9
5
84
1
10
157
2
05
31%
11
6%M
arke
ting
Inte
rnat
iona
l Bus
ines
s 2
1
-
-
1
--
-5
0%
Mar
ketin
g 2
14
206
2
58
271
3
00
11%
40
%Op
erat
ions
and
Sup
ply
Chai
n M
anag
emen
t Op
erat
ions
& S
uppl
y Ch
ain
Mgm
t 6
5
93
1
33
145
1
66
14%
15
5%
Man
ufac
turin
g M
anag
emen
t (Ce
rtifi
cate
) -
-
-
7
5
-2
9%
--Ot
her B
usin
ess
Busi
ness
Und
ecid
ed
83
3
8
27
4
1
-7
5%
-99%
Tota
l
2,0
11
1,9
69
2,2
72
2,1
33
2,2
39
5%
11%
Gra
du
ate
(ex
clu
din
g D
octo
ral)
Acco
untin
g Fi
nanc
ial A
ccou
ntin
g &
Audi
t 2
43
243
1
98
141
1
11
-21%
-5
4%
Tax
Prog
ram
4
4
42
4
1
33
2
4
-27%
-4
5%Bu
sine
ss A
dmin
istr
atio
n Ac
cele
rate
d Bu
sine
ss A
dmin
istr
atio
n 4
4
33
3
3
16
9
-4
4%
-80%
Ac
cele
rate
d M
obile
MBA
-
2
6
34
2
2
14
-3
6%
--
Busi
ness
Adm
inis
trat
ion
617
5
73
541
4
97
440
-1
1%
-29%
Ex
ecut
ive
Busi
ness
Adm
inis
trat
ion
31
4
1
43
2
7
20
-2
6%
-35%
M
aste
r of B
usin
ess
Adm
inis
trat
ion
3
5
5
4
5
25%
67
%
MBA
-Hea
lth C
are
49
5
2
35
3
2
41
28
%
-16%
Gl
obal
Bus
ines
s (C
ertifi
cat
e)
-
-
-
1
-
-100
%
--
Heal
th C
are
Info
rmat
ics
Cert
(Cer
tifi c
ate)
2
2
-
1
-
-1
00%
-1
00%
Or
gani
zatio
nal C
hang
e (C
ertifi
cat
e)
-
-
-
1
-
-100
%
--
Stra
tegi
c Bu
sine
ss A
naly
tics
(Cer
tifi c
ate)
-
-
-
1
1
5
-55%
--
Gr
adua
te B
usin
ess
(Non
-Deg
ree)
1
84
147
9
4
79
8
1
3%
-56%
Com
pute
r & In
form
atio
n Sc
ienc
e Co
mpu
ter a
nd In
form
atio
n Sc
ienc
e 9
1
102
1
11
-
-
--
-100
%In
form
atio
n Sy
stem
s In
form
atio
n Sy
stem
s -
-
-
2
0
70
25
0%
--M
anag
emen
t La
bor R
elat
ions
and
HR
73
7
3
44
2
7
26
-4
%
-64%
Mar
ketin
g M
arke
ting
Anal
ytic
s (C
ertifi
cat
e)
2
2
1
-
-
--
-100
%To
tal
1
,383
1
,341
1
,180
9
12
846
-7
%
-39%
cont
inue
d on
nex
t pag
e

Cleveland State University / 2017 Book of Trends30
Tabl
e 3.
1: C
olle
ge o
f Bus
ines
s: F
all E
nrol
lmen
t by
Leve
l and
Maj
or, 5
-Yea
r Tre
nd
Fa
ll T
erm
P
erc
en
t C
han
ge
Dep
art
men
t/P
rog
ram
D
esc
rip
tion
2012
2013
2014
2015
2016
1 y
ear
5 y
ear
Docto
ral
Bu
sine
ss A
dmin
istr
atio
n Fi
nanc
e 7
5
5
2
2
0%
-7
1%
Info
rmat
ion
Syst
ems
8
12
1
0
11
7
-3
6%
-13%
M
arke
ting
9
5
4
3
2
-33%
-7
8%
Mar
ketin
g-Gl
obal
Bus
ines
s Sp
ecia
lizat
ion
1
12
1
0
7
4
-43%
30
0%La
bor R
elat
ions
and
Hum
an R
esou
rces
M
anag
emen
t and
Lab
or R
elat
ions
-
6
3
2
2
0%
--
Oper
atio
n M
anag
emen
t and
Op
er M
gmt a
nd B
us S
tat
5
13
1
0
5
4
-20%
-2
0%Bu
sine
ss S
tatis
tics
To
tal
30
5
3
42
3
0
21
-3
0%
-30%
Tota
l Bus
ines
s
3,42
4 3,
363
3,49
4 3,
075
3,10
6 1%
-9
%
cont
inue
d fro
m p
revio
us p
age

31Section 3 - Enrollment Characteristics of Students in CSU Colleges
SEC
TIO
N
3
Tabl
e 3.
2 :
Col
lege
of L
iber
al A
rts
and
Soci
al S
cien
ces:
Fal
l Enr
ollm
ent
by L
evel
and
Maj
or, 5
-Yea
r Tre
nd
Fa
ll T
erm
P
erc
en
t C
han
ge
Dep
art
men
t/P
rog
ram
D
esc
rip
tion
2012
2013
2014
2015
2016
1 y
ear
5 y
ear
Un
derg
rad
uate
Art
Art E
duca
tion
20
18
14
8 5
-38%
-7
5%
Art H
isto
ry
77
78
22
19
19
0%
-75%
Ar
ts M
anag
emen
t & C
omm
unity
De
(Cer
tifi c
ate)
1
1 1
3 5
67%
40
0%
Grap
hic
Desi
gn (C
ertifi
cat
e)
5 6
2 4
3 -2
5%
-40%
St
udio
Art
-
- 36
59
75
27
%
--
Stud
io A
rt: D
raw
ing
15
15
9 9
3 -6
7%
-80%
St
udio
Art
: Gra
phic
Des
ign
70
74
82
84
70
-17%
0%
St
udio
Art
: Pai
ntin
g 10
8
- 2
- -1
00%
-1
00%
St
udio
Art
: Pho
togr
aphy
17
25
16
7
6 -1
4%
-65%
St
udio
Art
: Prin
t Mak
ing
2 1
1 -
- --
-1
00%
St
udio
Art
: Scu
lptu
re
4 6
2 1
- -1
00%
-1
00%
Blac
k St
udie
s Bl
ack
Stud
ies
10
7 8
11
14
27%
40
%Co
mm
unic
atio
n Co
mm
unic
atio
n 19
2 20
0 19
1 18
4 19
0 3%
-1
%
Com
mun
icat
ion
Man
agem
ent
37
53
52
50
76
52%
10
5%
Film
, TV
and
Inte
ract
ive
Med
ia
168
180
195
205
247
20%
47
%
Jour
nalis
m &
Pro
mot
iona
l Com
m
201
188
176
183
208
14%
3%
M
ultim
edia
Adv
ertis
ing
(Cer
tifi c
ate)
-
1 1
- 1
--
--Cr
imin
olog
y, An
thro
polo
gy, a
nd S
ocio
logy
An
thro
polo
gy
76
88
81
69
64
-7%
-1
6%
Crim
inal
Jus
tice
(Cer
tifi c
ate)
1
- -
- -
--
-100
%
Crim
inol
ogy
351
341
324
316
311
-2%
-1
1%
Ling
uist
ics
30
19
23
32
30
-6%
0%
So
cial
Sci
ence
8
11
6 6
3 -5
0%
-63%
So
ciol
ogy
166
161
146
134
124
-7%
-2
5%Ec
onom
ics
Econ
omic
s 46
46
39
46
37
-2
0%
-20%
Engl
ish
Engl
ish
206
209
106
100
96
-4%
-5
3%
Engl
ish-
Crea
tive
Writ
ing
Trac
k -
- 51
39
50
28
%
--
Engl
ish-
Intg
rted
Lan
guag
e Ar
ts
- -
30
30
29
-3%
--
Pr
of. W
ritin
g Ce
rtifi
cate
(Cer
tifi c
ate)
1
- 1
- -
--
-100
%Hi
stor
y Hi
stor
y 10
4 90
96
10
0 10
8 8%
4%
So
cial
Stu
dies
39
33
35
44
55
25
%
41%
So
cial
Stu
dies
- In
tegr
ated
SS
- -
- 3
4 33
%
--
Amer
ican
Stu
dies
Cer
tifi c
ate
(Cer
tifi c
ate)
-
- -
- 1
--
--In
terd
isci
plin
ary
Stud
ies
Clas
sica
l and
Med
ieva
l S
9 12
9
6 4
-33%
-5
6%
Libe
ral S
tudi
es
36
48
30
33
24
-27%
-3
3%M
usic
M
usic
20
17
27
26
35
35
%
75%
M
usic
Com
posi
tion
8 7
9 15
15
0%
88
%
Mus
ic E
duca
tion
35
29
47
42
40
-5%
14
%
Mus
ic P
erfo
rman
ce
29
19
26
30
31
3%
7%
Mus
ic T
hera
py
38
31
65
63
67
6%
76%
Pr
e-M
usic
32
68
16
18
15
-1
7%
-53%
Othe
r CLA
SS
Lib
Arts
& S
oc S
ci U
ndec
ided
34
7 39
8 23
8 61
24
-6
1%
-93%
cont
inue
d on
nex
t pag
e
N
ote
: Oth
er C
LAS
S (F
C) r
epre
sent
s fo
rmer
Firs
t Col
lege
stu
dent
s w
ith n
on-s
peci
fi c m
ajor
s, s
uch
as
Per
sona
lly D
esig
ned
Maj
or, w
ho h
ave
not d
ecla
red
a ne
w m
ajor
.

Cleveland State University / 2017 Book of Trends32
Tabl
e 3.
2 :
Col
lege
of L
iber
al A
rts
and
Soci
al S
cien
ces:
Fal
l Enr
ollm
ent
by L
evel
and
Maj
or, 5
-Yea
r Tre
nd
Li
b Ar
ts &
Soc
Sci
Cer
t (Ce
rtifi
cate
) -
- -
- 1
--
--
Expl
orat
ory
191
120
15
5 2
-60%
-9
9%Ph
iloso
phy
and
Com
para
tive
Relig
ion
Bioe
thic
s Ce
rtifi
cate
(Cer
tifi c
ate)
1
1 -
1 2
100%
10
0%
Com
para
tive
Relig
ion
21
23
16
15
4 -7
3%
-81%
Ph
iloso
phy
26
27
19
16
15
-6%
-4
2%
Philo
soph
y -
Ethi
cs T
rack
2
2 4
5 5
0%
150%
Polit
ical
Sci
ence
In
tern
atio
nal R
elat
ions
96
94
71
54
61
13
%
-36%
Po
litic
al S
cien
ce
148
126
135
124
132
6%
-11%
Soci
al W
ork
Pre-
Soci
al W
ork
143
167
133
144
133
-8%
-7
%
Soci
al W
ork
219
192
205
192
182
-5%
-1
7%Th
eatr
e an
d Da
nce
Thea
tre
Arts
63
81
86
85
90
6%
43
%W
omen
’s S
tudi
es
Wom
en’s
Stu
dies
7
10
4 7
8 14
%
14%
Wor
ld L
angu
ages
, Lite
ratu
re a
nd C
ultu
re
Arab
ic
- -
- -
3 --
--
Fr
ench
13
14
17
15
9
-40%
-3
1%
Span
ish
52
56
50
50
39
-22%
-2
5%To
tal
3,
393
3,40
1 2,
968
2,75
5 2,
775
1%
-18%
Grad
uate
(exc
ludi
ng D
octo
ral)
Ar
t Ar
t -
2 5
3 -
-100
%
--Co
mm
unic
atio
n Co
mm
unic
atio
n Th
ry a
nd M
ethd
y 22
19
20
16
16
0%
-2
7%
Com
mun
icat
ion
Thry
and
Met
hdy
4+1
1 1
- -
1 --
0%
Econ
omic
s Ec
onom
ics
29
27
22
16
12
-25%
-5
9%En
glis
h En
glis
h 77
70
52
44
34
-2
3%
-56%
M
str o
f Fin
e Ar
ts-C
reat
ive
Wri
20
20
19
24
29
21%
45
%Gr
adua
te S
tudi
es
Grad
Lib
Arts
&Soc
Sci N
on-d
egre
e (N
on-D
egre
e)
61
73
56
38
56
47%
-8
%Hi
stor
y Hi
stor
y 34
30
27
25
16
-3
6%
-53%
Hi
stor
y - A
rt H
isto
ry
- -
- -
1 --
--
Mus
ic
Mus
ic
32
25
24
20
29
45%
-9
%
Mus
ic P
erfo
rman
ce (C
ertifi
cat
e)
- -
5 3
3 0%
--
Philo
soph
y Ad
vanc
ed S
tudy
in B
ioet
hics
(Cer
tifi c
ate)
1
4 1
1 1
0%
0%
Philo
soph
y 14
8
7 8
5 -3
8%
-64%
Polit
ical
Sci
ence
Gl
obal
Inte
ract
ion
33
30
27
19
20
5%
-39%
Gl
obal
Inte
ract
ion
4+1
- -
- 1
2 10
0%
--So
cial
Wor
k So
cial
Wor
k 24
6 22
0 25
3 24
6 20
0 -1
9%
-19%
Soci
olog
y So
ciol
ogy
26
25
15
8 -
-100
%
-100
%W
orld
Lan
guag
es, L
itera
ture
and
Cul
ture
Sp
anis
h 7
11
16
10
12
20%
71
%To
tal
60
3 56
5 54
9 48
2 43
7 -9
%
-28%
Tota
l
3,99
6 3,
966
3,51
7 3,
237
3,21
2 -1
%
-20%
Fa
ll T
erm
P
erc
en
t C
han
ge
Dep
art
men
t/P
rog
ram
D
esc
rip
tion
2012
2013
2014
2015
2016
1 y
ear
5 y
ear
cont
inue
d fro
m p
revio
us p
age

33Section 3 - Enrollment Characteristics of Students in CSU Colleges
SEC
TIO
N
3
Tabl
e 3.
3: C
olle
ge o
f Edu
cati
on a
nd H
uman
Ser
vice
s: F
all E
nrol
lmen
t by
Lev
el a
nd M
ajor
, 5-Y
ear T
rend
Fa
ll T
erm
P
erc
en
t C
han
ge
Dep
art
men
t/P
rog
ram
D
esc
rip
tion
2012
2013
2014
2015
2016
1 y
ear
5 y
ear
Un
derg
rad
ua
te
Heal
th a
nd H
uman
Per
form
ance
Ex
erci
se/F
itnes
s Sp
ecia
list
25
3
1
30
3
4
34
0%
36
%
Phys
ical
Edu
catio
n 2
4
26
2
2
24
1
6
-33%
-3
3%
Spor
ts M
anag
emen
t 1
9
20
2
4
36
3
8
6%
100%
Ph
ysic
al E
duca
tion
PK-1
2 (L
icen
sure
) -
-
-
3
2
-3
3%
--Te
ache
r Edu
catio
n Ea
rly C
hild
hood
Edu
catio
n 1
94
218
2
24
215
1
53
-29%
-2
1%
Mid
Chi
ldho
od L
ang
Arts
& M
ath
18
1
6
16
1
7
11
-3
5%
-39%
M
id C
hild
hood
Lan
g Ar
ts &
Sci
6
6
5
7
4
-4
3%
-33%
M
id C
hild
hood
Lan
g Ar
ts &
SSt
1
8
22
2
3
24
1
8
-25%
0%
M
id C
hild
hood
Mat
h &
Scie
nce
30
2
8
26
2
6
19
-2
7%
-37%
M
id C
hild
hood
Mat
h &
Soc
St
19
1
7
14
1
3
14
8%
-2
6%
Mid
Chi
ldho
od S
cien
ce &
SSt
7
1
2
6
9
5
-44%
-2
9%
Mid
dle
Child
hood
Edu
catio
n 2
3
-
-
-
--
-1
00%
M
ild/M
oder
ate
Educ
atio
nal N
eed
85
9
7
85
8
6
62
-2
8%
-27%
M
oder
ate/
Inte
nsiv
e Ed
uc’lN
eeds
3
8
32
3
6
30
2
3
-23%
-3
9%
Spec
ial E
duca
tion
2
-
-
-
-
--
-100
%
TESO
L Ce
rtifi
cate
Und
ergr
ad (C
ertifi
cat
e)
3
2
-
1
-
-100
%
-100
%
Bilin
gual
End
orse
men
t (Li
cens
ure)
-
-
-
1
-
-1
00%
--
Ea
rly C
hild
hood
Edu
catio
n PK
-3 (L
icen
sure
) -
-
-
5
3
-4
0%
--
Educ
atio
n - V
isua
l Art
PK-
12 (L
icen
sure
) -
-
-
2
-
-1
00%
--
Ed
ucat
ion
(Lic
ensu
re)
-
-
-
118
9
6
-19%
--
Fo
reig
n La
ngua
ge-F
renc
h PK
-12
(Lic
ensu
re)
-
-
-
3
-
-100
%
--
Fore
ign
Lang
uage
-Spa
nish
PK1
2 (L
icen
sure
) -
-
-
2
1
-5
0%
--
Inte
grat
ed L
angu
age
Arts
7-1
2 (L
icen
sure
) -
-
-
6
6
0%
--
In
tegr
ated
Mat
h &
Phys
ics
7-12
(Lic
ensu
re)
-
-
-
1
1
0%
--
Inte
grat
ed M
ath
7-12
(Lic
ensu
re)
-
-
-
3
4
33%
--
In
tegr
ated
Sci
ence
(BIO
) 7-1
2 (L
icen
sure
) -
-
-
1
3
4
-69%
--
In
tegr
ated
Sci
ence
(CHM
) 7-1
2 (L
icen
sure
) -
-
-
1
1
0%
--
In
tegr
ated
Sci
ence
(PHY
) 7-1
2 (L
icen
sure
) -
-
-
1
-
-1
00%
--
In
tegr
ated
Sci
ence
, Ear
th 7
-12
(Lic
ensu
re)
-
-
-
1
3
200%
--
In
tegr
ated
Soc
ial S
tudi
es 7
-12
(Lic
ensu
re)
-
-
-
4
4
0%
--
Mid
Chi
ldho
od G
en-L
angA
rt/S
ci (L
icen
sure
) -
-
-
-
1
--
--
M
id C
hild
hood
Lan
g Ar
ts &
Mat
h (L
icen
sure
) -
-
-
3
1
-6
7%
--
Mid
Chi
ldho
od L
ang
Arts
& S
ci (L
icen
sure
) -
-
-
1
-
-1
00%
--
M
id C
hild
hood
Lan
g Ar
ts &
SSt
(Lic
ensu
re)
-
-
-
3
1
-67%
--
M
id C
hild
hood
Mat
h &
Scie
nce
(Lic
ensu
re)
-
-
-
4
3
-25%
--
M
id C
hild
hood
Mat
h &
Soci
al S
t (Li
cens
ure)
-
-
-
-
1
--
--
M
id C
hild
hood
Sci
ence
& S
St (L
icen
sure
) -
-
-
5
1
-8
0%
--
MId
Chi
ldho
od S
ocia
l Stu
dies
(Lic
ensu
re)
-
-
-
1
-
-100
%
--
Mus
ic E
duca
tion
PK-1
2 (L
icen
sure
) -
-
-
3
4
33
%
--
TESO
L En
dors
emen
t K-1
2 (L
icen
sure
) -
-
-
2
-
-1
00%
--
Othe
r Edu
catio
n Ed
uc &
Hum
an S
erv
Unde
cide
d 1
2
12
7
2
-
-1
00%
-1
00%
Pr
e-Ed
- E
arly
Chi
ldho
od E
d 4
2
-
-
-
--
-1
00%
Pr
e-Ed
uc &
Hum
an S
erv
(Edu
c)
118
1
20
87
8
1
77
-5
%
-35%
cont
inue
d on
nex
t pag
e

Cleveland State University / 2017 Book of Trends34
Tabl
e 3.
3: C
olle
ge o
f Edu
cati
on a
nd H
uman
Ser
vice
s: F
all E
nrol
lmen
t by
Lev
el a
nd M
ajor
, 5-Y
ear T
rend
Fa
ll T
erm
P
erc
en
t C
han
ge
Dep
art
men
t/P
rog
ram
D
esc
rip
tion
2012
2013
2014
2015
2016
1 y
ear
5 y
ear
cont
inue
d on
nex
t pag
e
Pr
e-Ed
ucat
ion
211
1
86
138
1
50
172
15
%
-18%
Pr
e-Ed
ucat
ion
- Sp
ecia
l Ed
1
1
1
1
-
-100
%
-100
%
Educ
atio
n (C
ertifi
cat
e)
2
1
2
-
1
--
-50%
Te
ache
r Cer
tifi c
atio
n (C
ertifi
cat
e)
67
5
7
66
1
-
-1
00%
-1
00%
Tota
l
90
5
90
9
81
2
94
3
78
4
-17
%
-13
%
Gra
du
ate
(excl
ud
ing
Do
cto
ral)
Coun
selin
g, A
dmin
istr
atio
n, S
uper
visi
on
Adul
t Lea
rnin
g an
d De
velo
pmen
t 9
9
90
7
8
92
9
4
2%
-5%
and
Adul
t Lea
rnin
g Cl
inic
al M
enta
l Hea
lth C
nslin
g 9
1
109
1
15
115
1
22
6%
34%
Co
unse
ling
and
Pupi
l Per
2
3
1
1
1
0%
-5
0%
Coun
selo
r Edu
catio
n 4
6
55
5
5
55
6
0
9%
30%
Ed
Sp
in A
d -
Pupi
l Svc
s Ad
min
-
-
1
-
-
--
--
Ed
Sp
in A
dmin
-C,I
& Pr
of D
ev
-
-
1
-
-
--
--
Educ
Spe
c in
Adm
in -
Prin
cipa
l -
-
4
-
-
--
--
Ed
ucat
ion
Adm
in S
peci
alis
t 2
4
14
-
-
-
--
-1
00%
Ed
ucat
iona
l Adm
inis
trat
ion
46
4
4
38
3
9
67
72
%
46%
He
alth
Pro
fess
ions
Edu
catio
n -
-
-
7
7
0%
--
Su
perv
isio
n 4
3
1
-
-
--
-1
00%
Ad
ult L
earn
ing
and
Deve
lopm
ent (
Cert
ifi ca
te)
6
3
2
-
1
--
-83%
Ch
emic
al D
epen
denc
y Co
unc
Cert
(Cer
tifi c
ate)
3
1
1
2
6
20
0%
100%
Ea
rly C
hild
hood
Men
tal H
ealth
(Cer
tifi c
ate)
-
3
2
1
1
0%
--
Cl
inic
al M
enta
l Hlth
Cou
nsel
(Lic
ensu
re)
-
-
-
1
-
-100
%
--
Insp
ired
Lead
ers
Prin
cipa
l (Li
cens
ure)
-
-
-
5
5
8
1060
%
--
Prin
cipa
l Lic
ensu
re (L
icen
sure
) -
-
-
2
1
-5
0%
--
Scho
ol C
ouns
elin
g (L
icen
sure
) -
-
-
5
5
0%
--
Su
perin
tend
ent (
Lice
nsur
e)
-
-
9
13
1
4
8%
--
Teac
her L
eade
r End
orse
men
t (Li
cens
ure)
1
3
-
-
-
--
-1
00%
Or
gani
zatio
nal L
eade
rshi
p (S
peci
aliz
atio
n)
10
3
-
-
-
--
-1
00%
Da
ta-B
ased
Dec
isio
n M
akin
g (C
ertifi
cat
e)
-
-
-
-
1
--
--Cu
rric
ulum
and
Fou
ndat
ions
C&
I-Adv
ance
d/Ap
plie
d Te
achi
ng
-
-
2
2
5
150%
--
C&
I-Chi
nese
Lan
guag
e -
8
1
3
22
1
2
-45%
--
C&
I-Edu
catio
n Re
sear
ch
-
10
7
6
8
33
%
--
C&I-E
duca
tiona
l Tec
hnol
ogy
-
38
3
9
32
2
0
-38%
--
C&
I-Gift
ed&T
alen
tedL
earn
ers
-
13
1
4
17
2
1
24%
--
C&
I-Sec
onda
ry-M
UST-
Engl
ish
-
4
4
5
8
60%
--
C&
I-Sec
onda
ry-M
UST-
Mat
h -
-
1
2
3
50
%
--
C&I-S
econ
dary
-MUS
T-M
oder
n La
ng
-
1
1
3
1
-67%
--
C&
I-Sec
onda
ry-M
UST-
Scie
nce
-
2
4
5
6
20%
--
C&
I-Sec
onda
ry-M
UST-
Soci
al S
tud
-
2
2
9
3
-67%
--
Cu
rric
ulum
and
Inst
ruct
ion
445
5
0
9
6
2
-67%
-1
00%
Gi
fted
Endo
rsem
ent (
Lice
nsur
e)
-
-
-
7
10
43
%
--He
alth
and
Hum
an P
erfo
rman
ce
Com
mun
ity H
ealth
Pro
mot
ion
20
2
7
26
2
5
23
-8
%
15%
Ex
erci
se S
cien
ce
42
5
9
61
5
7
54
-5
%
29%
Sp
ort M
anag
emen
t 2
9
27
2
4
29
2
5
-14%
-1
4%
Spor
ts M
anag
emen
t, Ex
erc
8
1
-
1
-
-100
%
-100
%

35Section 3 - Enrollment Characteristics of Students in CSU Colleges
SEC
TIO
N
3
Tabl
e 3.
3: C
olle
ge o
f Edu
cati
on a
nd H
uman
Ser
vice
s: F
all E
nrol
lmen
t by
Lev
el a
nd M
ajor
, 5-Y
ear T
rend
Fa
ll T
erm
P
erc
en
t C
han
ge
Dep
art
men
t/P
rog
ram
D
esc
rip
tion
2012
2013
2014
2015
2016
1 y
ear
5 y
ear
Teac
her E
duca
tion
C&I-E
arly
Chi
ld In
terv
Spe
c -
1
9
27
2
5
15
-4
0%
--
C&I-E
arly
Chi
ldho
od E
duc
-
42
5
8
56
4
5
-20%
--
C&
I-Ele
men
tary
-
4
4
3
3
0%
--
C&
I-Lite
racy
Dev
-Adu
lt Li
t -
2
1
-
1
--
--
C&
I-Lite
racy
Dev
-Bili
ngua
l -
-
-
1
-
-1
00%
--
C&
I-Lite
racy
Dev
elop
men
t-TE
SOL
-
20
2
7
24
1
8
-25%
--
C&
I-Lite
racy
Dev
-Rea
ding
-
4
0
47
4
6
48
4%
--
C&
I-Mild
/ M
oder
ate
-
110
1
07
75
5
6
-25%
--
C&
I-Mod
erat
e / I
nten
sive
-
4
1
28
2
5
20
-2
0%
--
C&I-S
choo
l Hea
lth
-
2
1
1
1
0%
--
C&I-S
econ
dary
-Art
-
3
1
-
-
--
--
C&
I-Sec
onda
ry-E
nglis
h -
2
2
2
1
-5
0%
--
C&I-S
econ
dary
-Mat
h -
2
3
1
-
-1
00%
--
C&
I-Sec
onda
ry-M
oder
n La
ngua
ge
-
1
-
-
1
--
--
C&I-S
econ
dary
-Sci
ence
-
2
4
-
-
--
--
C&
I-Sec
onda
ry-S
ocia
l Stu
dies
-
3
6
4
2
-5
0%
--
Autis
m S
pect
rum
Dis
orde
r/Fd
tn (C
ertifi
cat
e)
1
-
-
-
-
--
-100
%
Cert
ifi ca
te P
rogr
am in
TES
OL (C
ertifi
cat
e)
3
4
4
3
1
-67%
-6
7%
TESO
L En
dors
emen
t (Li
cens
ure)
-
-
-
-
3
--
--
Ea
rly C
hild
Inte
r Spe
c Pr
eK-3
(Lic
ensu
re)
-
-
1
5
4
-20%
--
Ea
rly C
hild
hood
Pre
K-3
(Lic
ensu
re)
-
-
-
2
1
-50%
--
Co
mpu
ter/
Tech
End
orse
men
t (Li
cens
ure)
-
-
-
-
4
--
--
M
od/In
tens
ive
Spec
K-1
2 (L
icen
sure
) -
-
-
4
1
-7
5%
--
Mild
/Mod
Inte
rven
tion
Spc
K-12
(Lic
ensu
re)
-
-
-
3
4
33%
--
Re
adin
g En
dors
emen
t (Li
cens
ure)
-
-
-
7
1
5
114%
--
Othe
r Edu
catio
n Gr
adua
te E
duca
tion
-
-
-
1
-
-100
%
--
Grad
uate
Edu
catio
n Li
cens
ure
(Lic
ensu
re)
245
2
54
197
1
16
42
-6
3%
-83%
Gr
adua
te E
duca
tion
(Non
degr
ee)
125
1
41
135
9
5
84
-1
2%
-35%
Tota
l
1,2
75
1
,26
5
1,1
68
1,0
65
1
,00
9
-5%
-1
9%
Docto
ral
Doct
oral
Ur
ban
Ed: A
dmin
istr
atio
n 1
3
9
8
11
8
-2
7%
-38%
Ur
ban
Ed: A
dult
Cont
inui
ng &
Hig
her E
d -
-
6
9
1
0
11%
--
Ur
ban
Ed: C
ouns
elin
g 1
6
21
1
1
6
1
-83%
-9
4%
Urba
n Ed
: Cou
nsel
ing
Psyc
holo
gy
16
1
3
19
2
0
27
35
%
69%
Ur
ban
Ed: L
eade
rshi
p an
d Li
felo
ng L
earn
ing
15
1
2
9
5
2
-60%
-8
7%
Urba
n Ed
: Lea
rnin
g an
d De
velo
pmen
t 3
1
26
2
3
19
1
2
-37%
-6
1%
Urba
n Ed
: Nur
sing
Edu
catio
n 2
2
2
3
2
-3
3%
0%
Urba
n Ed
: Pol
icy
Stud
ies
19
1
9
19
2
1
22
5%
16
%To
tal
1
12
1
02
9
7
94
8
4
-11
%
-25
%
Tota
l
2,2
92
2
,27
6
2,0
77
2,1
02
1
,87
7
-11
%
-17
%

Cleveland State University / 2017 Book of Trends36
Tabl
e 3.
4: S
choo
l of N
ursi
ng: F
all E
nrol
lmen
t by
Lev
el a
nd M
ajor
, 5-Y
ear T
rend
Fa
ll T
erm
P
erc
en
t C
han
ge
Dep
art
men
t/P
rog
ram
D
esc
rip
tion
2012
2013
2014
2015
2016
1 y
ear
5 y
ear
Un
derg
rad
ua
te
Nurs
ing
Nurs
ing,
Acc
eler
ated
65
70
66
70
71
1%
9%
Nu
rsin
g, B
asic
23
7 23
9 22
5 21
9 22
5 3%
-5
%
Prep
arat
ory/
Pre-
Nurs
ing
218
249
238
221
242
10%
11
%
RN to
BSN
19
14
22
31
65
11
0%
242%
Tota
l
53
9
57
2
55
1
54
1
60
3
11
%
12
%
Gra
du
ate
(excl
ud
ing
Do
cto
ral)
Nurs
ing
MS
Nurs
ing
& M
BA J
oint
Deg
ree
2 3
5 5
4 -2
0%
100%
Nu
rsin
g 50
45
43
41
48
17
%
-4%
Sc
hool
Nur
se L
icen
ce P
rep
(Lic
ensu
re)
2 2
- -
- --
-1
00%
Nu
rsin
g Ed
ucat
ion
Cert
(Cer
tifi c
ate)
-
1 -
- -
--
--
Grad
uate
Nur
sing
Non
degr
ee (N
onde
gree
) 4
4 3
4 3
-25%
-2
5%To
tal
5
8
55
5
1
50
5
5
10
%
-5%
Tota
l
59
7
62
7
60
2
59
1
65
8
11
%
10
%

37Section 3 - Enrollment Characteristics of Students in CSU Colleges
SEC
TIO
N
3
Tabl
e 3.
5: C
olle
ge o
f Eng
inee
ring
: Fal
l Enr
ollm
ent
by L
evel
and
Maj
or, 5
-Yea
r Tre
nd
Fa
ll T
erm
P
erc
en
t C
han
ge
Dep
art
men
t/P
rog
ram
D
esc
rip
tion
2012
2013
2014
2015
2016
1 y
ear
5 y
ear
Un
derg
rad
ua
te
Chem
ical
and
Bio
med
ical
Eng
inee
ring
Chem
ical
Eng
inee
ring
112
148
203
216
215
0%
92%
Civi
l and
Env
ironm
enta
l Eng
inee
ring
Civi
l Eng
inee
ring
109
110
129
148
167
13%
53
%El
ectr
ical
Eng
inee
ring
and
Com
pute
r Sci
ence
Co
mpu
ter E
ngin
eerin
g 89
10
8 11
1 11
5 13
1 14
%
47%
Co
mpu
ter S
cien
ce
- -
- 27
7 23
1 -1
7%
--
Elec
tric
al E
ngin
eerin
g 16
2 15
8 16
6 16
6 16
3 -2
%
1%En
gine
erin
g Te
chno
logy
El
ectr
onic
Egr
Tec
hnol
ogy
37
42
52
68
71
4%
92%
M
echa
nica
l Egr
Tec
hnol
ogy
35
51
94
99
85
-14%
14
3%M
echa
nica
l Eng
inee
ring
Mec
hani
cal E
ngin
eerin
g 24
3 30
0 35
5 42
5 47
2 11
%
94%
Othe
r Eng
inee
ring
Engi
neer
ing
Unde
cide
d 38
40
20
11
5
-55%
-8
7%
Pre-
Engi
neer
ing
344
362
264
295
366
24%
6%
Tota
l
1,1
69
1
,31
9
1,3
94
1
,82
0
1,9
06
5
%
63
%
Gra
du
ate
(excl
ud
ing
Do
cto
ral)
Chem
ical
and
Bio
med
ical
Eng
inee
ring
Biom
edic
al E
ngin
eerin
g 40
35
34
30
32
7%
-2
0%
Chem
ical
Eng
inee
ring
27
30
31
32
41
28%
52
%Ci
vil a
nd E
nviro
nmen
tal E
ngin
eerin
g Ci
vil E
ngin
eerin
g 28
41
55
60
64
7%
12
9%
Engi
neer
ing
Mec
hani
cs
2 3
3 4
- -1
00%
-1
00%
En
viro
nmen
tal E
ngin
eerin
g 7
6 3
6 17
18
3%
143%
Elec
tric
al E
ngin
eerin
g an
d Co
mpu
ter S
cien
ce
Com
pute
r Sci
ence
-
- -
80
71
-11%
--
El
ectr
ical
Eng
inee
ring
123
160
227
291
259
-11%
11
1%
Softw
are
Engi
neer
ing
35
35
28
36
18
-50%
-4
9%M
echa
nica
l Eng
inee
ring
Mec
hani
cal E
ngin
eerin
g 58
75
96
10
0 81
-1
9%
40%
Othe
r Eng
inee
ring
Grad
uate
Eng
inee
ring
(Non
degr
ee)
18
11
16
10
8 -2
0%
-56%
Tota
l
33
8
39
6
49
3
64
9
59
1
-9%
7
5%
Docto
ral
Do
ctor
of E
ngin
eerin
g Ap
plie
d Bi
omed
ical
Eng
inee
ring
24
26
29
20
16
-20%
-3
3%
Chem
ical
Eng
inee
ring
1 3
5 7
8 14
%
700%
Ci
vil E
ngin
eerin
g 9
5 6
6 3
-50%
-6
7%
Elec
tric
al E
ngin
eerin
g 23
22
22
24
24
0%
4%
M
echa
nica
l Eng
inee
ring
11
13
12
16
15
-6%
36
%To
tal
6
8
69
7
4
73
6
6
-10
%
-3%
Tota
l
1,5
75
1
,78
4
1,9
61
2
,54
2
2,5
63
1
%
63
%
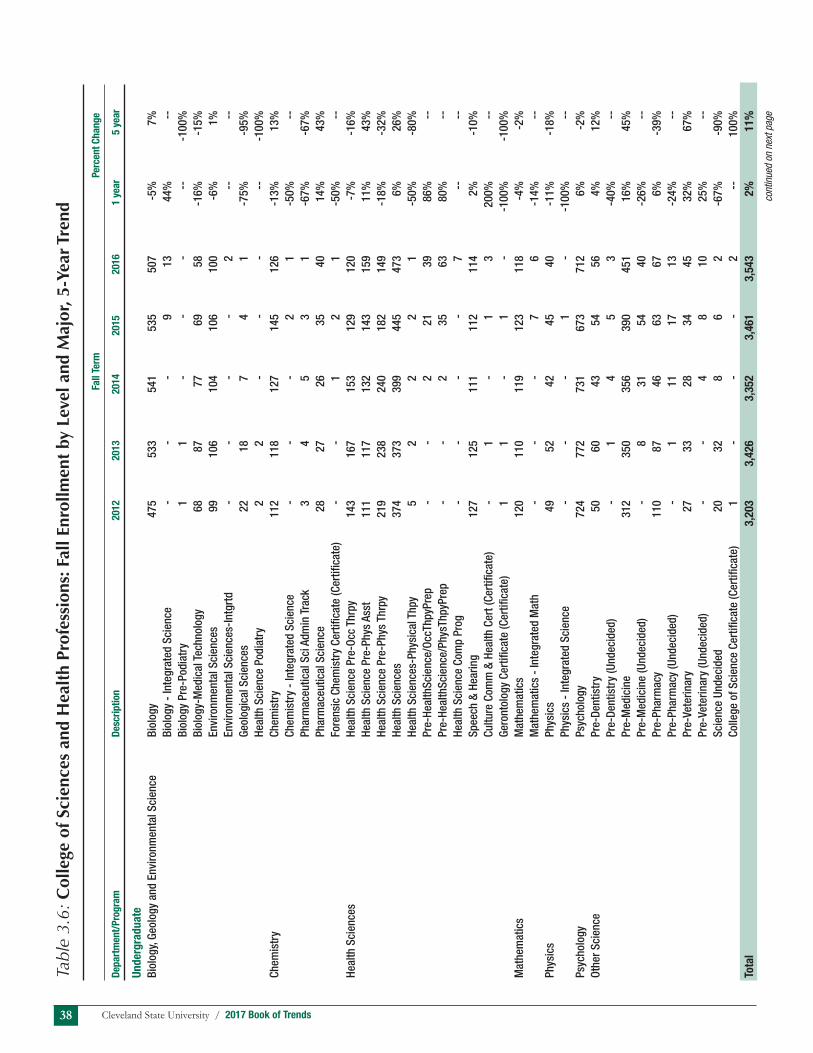
Cleveland State University / 2017 Book of Trends38
cont
inue
d on
nex
t pag
e
Tabl
e 3.
6: C
olle
ge o
f Sci
ence
s an
d H
ealt
h Pr
ofes
sion
s: F
all E
nrol
lmen
t by
Lev
el a
nd M
ajor
, 5-Y
ear T
rend
Fall T
erm
P
erc
en
t C
han
ge
Dep
art
men
t/P
rog
ram
D
esc
rip
tion
2012
2013
2014
2015
2016
1 y
ear
5 y
ear
Un
derg
rad
ua
te
Biol
ogy,
Geol
ogy
and
Envi
ronm
enta
l Sci
ence
Bi
olog
y 4
75
533
5
41
535
5
07
-5%
7%
Bi
olog
y -
Inte
grat
ed S
cien
ce
-
-
-
9
13
44
%
--
Biol
ogy
Pre-
Podi
atry
1
1
-
-
-
--
-1
00%
Bi
olog
y-M
edic
al T
echn
olog
y 6
8
87
7
7
69
5
8
-16%
-1
5%
Envi
ronm
enta
l Sci
ence
s 9
9
106
1
04
106
1
00
-6%
1%
En
viro
nmen
tal S
cien
ces-
Intg
rtd
-
-
-
-
2
--
--
Geol
ogic
al S
cien
ces
22
1
8
7
4
1
-75%
-9
5%
Heal
th S
cien
ce P
odia
try
2
2
-
-
-
--
-100
%Ch
emis
try
Chem
istr
y 1
12
118
1
27
145
1
26
-13%
13
%
Chem
istr
y -
Inte
grat
ed S
cien
ce
-
-
-
2
1
-50%
--
Ph
arm
aceu
tical
Sci
Adm
in T
rack
3
4
5
3
1
-6
7%
-67%
Ph
arm
aceu
tical
Sci
ence
2
8
27
2
6
35
4
0
14%
43
%
Fore
nsic
Che
mis
try
Cert
ifi ca
te (C
ertifi
cat
e)
-
-
1
2
1
-50%
--
Heal
th S
cien
ces
Heal
th S
cien
ce P
re-O
cc T
hrpy
1
43
167
1
53
129
1
20
-7%
-1
6%
Heal
th S
cien
ce P
re-P
hys
Asst
1
11
117
1
32
143
1
59
11%
43
%
Heal
th S
cien
ce P
re-P
hys
Thrp
y 2
19
238
2
40
182
1
49
-18%
-3
2%
Heal
th S
cien
ces
374
3
73
399
4
45
473
6%
26
%
Heal
th S
cien
ces-
Phys
ical
Thp
y 5
2
2
2
1
-5
0%
-80%
Pr
e-He
alth
Scie
nce/
OccT
hpyP
rep
-
-
2
21
3
9
86%
--
Pr
e-He
alth
Scie
nce/
Phys
Thpy
Prep
-
-
2
3
5
63
80
%
--
Heal
th S
cien
ce C
omp
Prog
-
-
-
-
7
--
--
Sp
eech
& H
earin
g 1
27
125
1
11
112
1
14
2%
-10%
Cu
lture
Com
m &
Hea
lth C
ert (
Cert
ifi ca
te)
-
1
-
1
3
200%
--
Ge
ront
olog
y Ce
rtifi
cate
(Cer
tifi c
ate)
1
1
-
1
-
-1
00%
-1
00%
Mat
hem
atic
s M
athe
mat
ics
120
1
10
119
1
23
118
-4
%
-2%
M
athe
mat
ics
- In
tegr
ated
Mat
h -
-
-
7
6
-1
4%
--Ph
ysic
s Ph
ysic
s 4
9
52
4
2
45
4
0
-11%
-1
8%
Phys
ics
- In
tegr
ated
Sci
ence
-
-
-
1
-
-1
00%
--
Psyc
holo
gy
Psyc
holo
gy
724
7
72
731
6
73
712
6%
-2
%Ot
her S
cien
ce
Pre-
Dent
istr
y 5
0
60
4
3
54
5
6
4%
12%
Pr
e-De
ntis
try
(Und
ecid
ed)
-
1
4
5
3
-40%
--
Pr
e-M
edic
ine
312
3
50
356
3
90
451
16
%
45%
Pr
e-M
edic
ine
(Und
ecid
ed)
-
8
31
5
4
40
-2
6%
--
Pre-
Phar
mac
y 1
10
87
4
6
63
6
7
6%
-39%
Pr
e-Ph
arm
acy
(Und
ecid
ed)
-
1
11
1
7
13
-2
4%
--
Pre-
Vete
rinar
y 2
7
33
2
8
34
4
5
32%
67
%
Pre-
Vete
rinar
y (U
ndec
ided
) -
-
4
8
1
0
25%
--
Sc
ienc
e Un
deci
ded
20
3
2
8
6
2
-67%
-9
0%
Colle
ge o
f Sci
ence
Cer
tifi c
ate
(Cer
tifi c
ate)
1
-
-
-
2
--
10
0%To
tal
3
,20
3
3,4
26
3
,35
2
3,4
61
3
,54
3
2%
1
1%

39Section 3 - Enrollment Characteristics of Students in CSU Colleges
SEC
TIO
N
3
Tabl
e 3.
6: C
olle
ge o
f Sci
ence
s an
d H
ealt
h Pr
ofes
sion
s: F
all E
nrol
lmen
t by
Lev
el a
nd M
ajor
, 5-Y
ear T
rend
Fall T
erm
P
erc
en
t C
han
ge
Dep
art
men
t/P
rog
ram
D
esc
rip
tion
2012
2013
2014
2015
2016
1 y
ear
5 y
ear
Gra
du
ate
(excl
ud
ing
Do
cto
ral)
Biol
ogy,
Geol
ogy
and
Envi
ronm
enta
l Sci
ence
Bi
olog
y 2
5
17
1
5
18
2
1
17%
-1
6%
Envi
ronm
enta
l Sci
ence
9
9
1
0
5
4
-20%
-5
6%Ch
emis
try
Chem
istr
y 4
6
43
3
2
25
1
5
-40%
-6
7%He
alth
Sci
ence
s He
alth
Sci
ence
7
6
76
4
7
35
3
9
11%
-4
9%
Heal
th S
cien
ce-
Phy.
A. T
rack
6
6
61
8
3
92
8
9
-3%
35
%
Mas
ter o
f Occ
upat
iona
l The
rapy
1
03
118
1
32
133
1
36
2%
32%
M
aste
r of P
ublic
Hea
lth
-
24
2
2
23
2
0
-13%
-2
0%
Phys
ics
Optic
s an
d M
edic
al Im
g 2
2
1
-
1
--
-5
0%
Spee
ch P
atho
logy
and
Aud
5
4
53
5
3
59
6
7
14%
24
%
Gero
ntol
ogic
al S
tudi
es (C
ertifi
cat
e)
-
1
1
1
-
-100
%
--M
athe
mat
ics
Appl
ied
Stat
istic
s 1
2
10
1
4
15
1
1
-27%
-8
%
Mat
hem
atic
s 3
5
31
2
9
30
3
0
0%
-14%
Ap
plie
d Pr
edic
tive
Mod
elin
g (C
ertifi
cat
e)
-
-
-
-
1
--
--Ph
ysic
s M
edic
al P
hysi
cs
-
-
-
3
9
200%
--
Ph
ysic
s 1
9
20
1
7
11
-
-1
00%
-1
00%
Ph
ysic
s Op
tics
and
Mat
eria
ls
-
-
-
3
7
133%
--
M
edic
al P
hysi
cs (C
ertifi
cat
e)
-
-
-
2
3
50%
--
Psyc
holo
gy
Psyc
holo
gy
4
2
1
2
2
0%
-50%
Ps
ycho
logy
- C
linic
al
24
1
7
21
2
4
19
-2
1%
-21%
Ps
ycho
logy
Spe
cial
ist
9
13
9
6
1
1
83%
22
%
Psyc
holo
gy-D
iver
sity
Mgm
t 2
3
15
1
5
12
8
-3
3%
-65%
Ps
ycho
logy
-Exp
erim
enta
l 1
7
11
1
4
12
1
2
0%
-29%
Ps
ycho
logy
-Indu
stria
l/Org
Rsc
h 1
3
10
1
1
13
1
3
0%
0%
Psyc
holo
gy-S
choo
l 2
4
20
2
0
22
2
4
9%
0%
Dive
rsity
Man
agem
ent (
Cert
ifi ca
te)
2
1
2
-
1
--
-50%
Othe
r Sci
ence
Gr
ad C
oll o
f Sci
ence
Non
-deg
re (N
onde
gree
) 6
1
70
6
3
57
6
4
12%
5%
Tota
l
62
4
62
4
61
2
60
3
60
7
1%
-6
%
Docto
ral
Bi
olog
y, Ge
olog
y an
d En
viro
nmen
tal S
cien
ce
Regu
lato
ry B
iolo
gy
69
67
49
46
48
4%
-30%
Chem
istr
y Cl
inic
al B
ioan
alyt
ical
Che
m
59
70
74
63
58
-8%
-2
%He
alth
Sci
ence
s Do
ctor
of P
hysi
cal T
hera
py
103
111
110
105
107
2%
4%Ps
ycho
logy
Ad
ult D
evel
opm
ent &
Agi
ng P
hD
7 8
9 8
6 -2
5%
-14%
Tota
l
23
8
25
6
24
2
22
2
21
9
-1%
-8
%
Tota
l
4,0
65
4
,30
6
4,2
06
4
,28
6
4,3
69
2
%
7%

Cleveland State University / 2017 Book of Trends40
Tabl
e 3.
7: C
olle
ge o
f Urb
an A
ffai
rs: F
all E
nrol
lmen
t by
Lev
el a
nd M
ajor
, 5-Y
ear T
rend
Fa
ll T
erm
P
erc
en
t C
han
ge
Dep
art
men
t/P
rog
ram
D
esc
rip
tion
2012
2013
2014
2015
2016
1 y
ear
5 y
ear
Un
derg
rad
ua
te
Econ
omic
Dev
elop
men
t Ec
onom
ic D
evel
opm
ent
- -
2 20
21
5%
--
Envi
ronm
enta
l Stu
dies
En
viro
nmen
tal S
tudi
es
16
22
36
33
24
-27%
50
%No
npro
fi t A
dmin
istr
atio
n No
n-Pr
ofi t
Adm
in (L
R)
7 2
3 6
11
83%
57
%
Nonp
rofi t
Adm
inis
trat
ion
60
64
82
77
70
-9%
17
%
Nonp
rofi t
Adm
inis
trat
ion
4+1
- 1
- -
2 --
--
Orga
niza
tiona
l Lea
ders
hip
Orga
niza
tiona
l Lea
ders
hip
(CSU
) 52
54
68
96
10
8 13
%
108%
Or
gani
zatio
nal L
eade
rshi
p (L
K)
17
24
34
38
41
8%
141%
Or
gani
zatio
nal L
eade
rshi
p (L
R)
- -
- -
2 --
--
Or
gani
zatio
nal L
eade
rshi
p (O
L)
- -
- 3
6 10
0%
--Pu
blic
Saf
ety
Man
agem
ent
Publ
ic S
afet
y M
anag
emen
t 44
48
46
35
37
6%
-1
6%
Publ
ic S
afet
y M
anag
emen
t (LK
) 1
3 5
8 2
-75%
10
0%
Publ
ic S
afet
y M
anag
emen
t (LR
) 3
3 2
5 5
0%
67%
Urba
n St
udie
s Ur
ban
Stud
ies
(CSU
) 12
9 10
8 10
8 10
1 99
-2
%
-23%
Ur
ban
Stud
ies
(LK)
2
2 11
7
6 -1
4%
200%
Ur
ban
Stud
ies
(LR)
8
5 8
13
8 -3
8%
0%Ce
rtifi
cate
Un
derg
rad
Cert
(Cer
tifi c
ate)
2
1 -
2 1
-50%
-5
0%To
tal
3
41
3
37
4
05
4
44
4
43
0
%
30
%
Gra
du
ate
(excl
ud
ing
Do
cto
ral)
Envi
ronm
enta
l Stu
dies
En
viro
nmen
tal S
tudi
es
15
8 8
5 11
12
0%
-27%
Nonp
rofi t
Adm
inis
trat
ion
& Le
ader
ship
No
npro
fi t A
dmin
istr
atio
n &
Lead
ersh
ip
30
22
20
14
19
36%
-3
7%
Nonp
rofi t
Adm
inis
trat
ion
& Le
ader
ship
4+
1 1
- 1
- -
--
-100
%Pu
blic
Adm
inis
trat
ion
Publ
ic A
dmin
istr
atio
n 99
79
62
65
56
-1
4%
-43%
Pu
blic
Adm
in -
4+
1 2
1 2
- 2
--
0%
Publ
ic A
dmin
- E
cono
mic
Dev
elop
men
t -
- -
1 -
-100
%
--
Publ
ic A
dmin
- H
ealth
Car
e Ad
min
-
- -
1 -
-100
%
--
Publ
ic A
dmin
- J
D/M
PA
- -
- 1
2 10
0%
--
Publ
ic A
dmin
- N
onpr
ofi t
Man
agem
ent
- -
- 4
1 -7
5%
--
Publ
ic A
dmin
- P
ublic
Fin
anci
al M
gmt
- -
- 1
- -1
00%
--
Urba
n Pl
anni
ng &
Dev
elop
men
t Ur
ban
Plan
ning
& D
evel
opm
ent
46
36
41
49
31
-37%
-3
3%
Urba
n Pl
anni
ng &
Law
1
1
2 1
-50%
0%
Urba
n St
udie
s Ur
ban
Stud
ies
23
13
14
14
8 -4
3%
-65%
Cert
ifi ca
te
Loca
l and
Urb
an M
anag
emen
t (Ce
rtifi
cate
) 1
- -
3 -
-100
%
-100
%
Nonp
rofi t
Man
agem
ent (
Cert
ifi ca
te)
3 2
5 4
3 -2
5%
0%
Urba
n Ec
onom
ic D
evel
opm
ent (
Cert
ifi ca
te)
2 1
- 1
2 10
0%
0%
Urba
n Ge
ogra
phic
Info
rmat
ion
Syst
ems
(Cer
tifi c
ate)
3
- -
2 3
50%
0%
Ur
ban
Real
Est
ate
Deve
lopm
ent &
Fin
ance
(Cer
tifi c
ate)
3
3 -
- 1
--
-67%
Non-
Degr
ee
Non-
Degr
ee (N
onde
gree
) 25
53
38
38
36
-5
%
44%
Tota
l
25
4
21
9
19
1
20
5
17
6
-14
%
-31
%
Do
cto
ral
Ur
ban
Stud
ies
& Pu
blic
Affa
irs
Urba
n St
udie
s &
Publ
ic A
ffairs
41
37
32
32
26
-1
9%
-37%
Tota
l
41
3
7
32
3
2
26
-1
9%
-3
7%
Tota
l
63
6
59
3
62
8
68
1
64
5
-5%
1
%

41Section 3 - Enrollment Characteristics of Students in CSU Colleges
SEC
TIO
N
3
Tabl
e 3.
8: C
olle
ge o
f Law
: Fal
l Enr
ollm
ent
by L
evel
and
Maj
or, 5
-Yea
r Tre
nd
Fa
ll T
erm
P
erc
en
t C
han
ge
Dep
art
men
t/P
rog
ram
D
esc
rip
tion
2012
2013
2014
2015
2016
1 y
ear
5 y
ear
La
w
La
w
497
442
405
375
333
-11%
-3
3%
Law
and
Env
ironm
enta
l Stu
dies
1
- -
- -
--
-100
%
Law
and
Urb
an P
lann
ing
1 2
1 2
2 0%
10
0%
Mas
ter o
f Law
s 5
10
10
11
8 -2
7%
60%
He
alth
Car
e Co
mpl
ianc
e (C
ertifi
cat
e)
- -
- 2
- -1
00%
--
He
alth
Law
(Cer
tifi c
ate)
-
2 1
2 1
-50%
--
La
w (N
on-D
egre
e)
- 2
- 1
1 0%
--
Tota
l
50
4
45
8
41
7
39
3
34
5
-12
%
-32
%
Gra
du
ate
(excl
ud
ing
Do
cto
ral)
Law
Le
gal S
tudi
es
- 12
26
37
36
-3
%
--To
tal
-
12
2
6
37
3
6
-3%
--
Tota
l
50
4
47
0
44
3
43
0
38
1
-11
%
-24
%
Tabl
e 3.
9: U
nder
grad
uate
Stu
dies
: Fa
ll En
rollm
ent
by L
evel
and
Maj
or, 5
-Yea
r Tre
nd
Fall T
erm
P
erc
en
t C
han
ge
Dep
art
men
t/P
rog
ram
D
esc
rip
tion
2012
2013
2014
2015
2016
1 y
ear
5 y
ear
Un
derg
rad
ua
te
Colle
ge C
redi
t Plu
s 23
0 28
9 28
4 22
1 19
0 -1
4%
-17%
Ex
plor
ator
y Nu
rsin
g 19
0 19
4 73
15
5
-67%
-9
7%
Pre-
Busi
ness
Adm
inis
tratio
n 25
24
18
26
8
-69%
-6
8%
Pre-
Colle
ge o
f Eng
inee
ring
8 5
7 18
34
89
%
325%
Pr
e-Ed
uc &
Hum
an S
erv
(Edu
c)
5 4
2 6
6 0%
20
%
Pre-
Libe
ral A
rts &
Soc
ial S
ci
42
60
37
28
19
-32%
-5
5%
Pre-
Mus
ic
1 1
- -
- --
-1
00%
Pr
e-Sc
ienc
e 23
22
16
18
17
-6
%
-26%
Pr
e-So
cial
Wor
k 2
3 1
- 2
--
0%
Pre-
Urba
n Af
fairs
1
2 1
2 5
150%
40
0%
Proj
ect 6
0 (N
on-D
egre
e)
212
214
231
227
209
-8%
-1
%
Seni
or Y
ear A
ccel
erat
ion
Prog
1
- -
- -
--
-100
%
Tran
sitio
nal B
usin
ess
- -
15
3 19
53
3%
--
Tran
sitio
nal E
duca
tion
- -
11
4 12
20
0%
--
Tran
sitio
nal E
ngin
eerin
g -
- 23
19
18
-5
%
--
Tran
sitio
nal E
xplo
rato
ry
- -
121
367
335
-9%
--
Tr
ansi
tiona
l Lib
Arts
/Soc
Sci
-
- 13
10
16
60
%
--
Tran
sitio
nal N
ursi
ng
- -
72
93
126
35%
--
Tr
ansi
tiona
l Sci
ence
-
- 6
8 6
-25%
--
Tr
ansi
tiona
l Urb
an
- -
4 5
4 -2
0%
--
Univ
ersi
ty S
tudi
es U
ndec
ided
43
47
33
25
20
-2
0%
-53%
Tota
l
78
3
86
5
96
8
1,0
95
1
,05
1
-4%
3
4%

Cleveland State University / 2017 Book of Trends42
Tabl
e 3.
10: U
nder
grad
uate
Non
-Deg
ree:
Fal
l Enr
ollm
ent
by L
evel
and
Maj
or, 5
-Yea
r Tre
nd
P
erc
en
t C
han
ge
Dep
art
men
t/P
rog
ram
D
esc
rip
tion
2012
2013
2014
2015
2016
1 y
ear
5 y
ear
Un
derg
rad
ua
te N
on
-Deg
ree
Cr
oss
Regi
stra
tion
Unde
rgra
duat
e (N
on-D
egre
e)
11
14
12
15
13
-13%
18
%
Nond
egre
e Po
st-b
acca
laur
eate
(Non
-Deg
ree)
-
1 -
- -
--
--
Nond
egre
e Un
derg
radu
ate
(Non
-Deg
ree)
18
3 16
9 11
9 15
6 12
3 -2
1%
-33%
Ug
rd T
rans
ient
(Non
-Deg
ree)
46
37
39
39
36
-8
%
-22%
Vi
sitin
g (N
on-D
egre
e)
5 -
- -
- --
-1
00%
Na
tiona
l Stu
dent
Exc
hang
e (N
on-D
egre
e)
2 -
- 1
- -1
00%
-1
00%
Tota
l
24
7
22
1
17
0
21
1
17
2
-18
%
-30
%
Tabl
e 3.
11: G
radu
ate
Stud
ies:
Fal
l Enr
ollm
ent
by L
evel
and
Maj
or, 5
-Yea
r Tre
nd
P
erc
en
t C
han
ge
Dep
art
men
t/P
rog
ram
D
esc
rip
tion
2012
2013
2014
2015
2016
1 y
ear
5 y
ear
Gra
du
ate
(excl
ud
ing
Do
cto
ral)
Grad
uate
Non
degr
ee
Grad
uate
Non
degr
ee (N
on-D
egre
e)
12
6 3
3 2
-33%
-8
3%
Cros
s Re
gist
ratio
n Gr
adua
te (N
on-D
egre
e)
- 13
14
16
19
19
%
--
Grad
Tra
nsie
nt (N
on-D
egre
e)
9 10
7
4 3
-25%
-6
7%To
tal
2
1
29
2
4
23
2
4
4%
1
4%
Tabl
e 3.
11a:
Oth
er: F
all E
nrol
lmen
t by
Lev
el a
nd M
ajor
, 5-Y
ear T
rend
P
erc
en
t C
han
ge
Dep
art
men
t/P
rog
ram
D
esc
rip
tion
2012
2013
2014
2015
2016
1 y
ear
5 y
ear
Un
derg
rad
ua
te
ESL
Inte
nsiv
e La
ngua
ge P
rogr
am
ESL
Inte
nsiv
e La
ngua
ge P
rogr
am
163
150
152
122
68
-44%
-5
8%To
tal
1
63
1
50
1
52
12
2
68
-4
4%
-5
8%
No
te: E
SL
= E
nglis
h as
a S
econ
d La
ngua
ge

43Section 3 - Enrollment Characteristics of Students in CSU Colleges
SEC
TIO
N
3
Tabl
e 3.
12: C
olle
ge o
f Bus
ines
s
Fall
Enro
llmen
t by
Cla
ss S
tand
ing
and
Stud
ent
Cre
dit
Hou
rs b
y C
ours
e Le
vel:
5-Ye
ar T
rend
Tab
le 3
.12a
: E
nro
llm
en
t b
y C
lass S
tan
din
g
Perc
en
t C
ha
ng
e
Cla
ss S
tan
din
g
2012
%
2013
%
2014
%
2015
%
20
16
%
1
Yea
r 5
Yea
r
Fres
hmen
320
9%
399
12%
38
5 11
%
379
13%
37
0 12
%
-2%
16
%So
phom
ores
265
8%
232
7%
378
11%
35
7 12
%
390
13%
9%
47
%Ju
nior
s
410
12%
38
7 12
%
472
14%
44
7 15
%
466
15%
4%
14
%Se
nior
s
978
29%
92
3 28
%
1,01
0 29
%
895
30%
95
5 31
%
7%
-2%
Mas
ter’s
1,36
6 41
%
1,30
7 40
%
1,16
1 34
%
901
30%
84
4 28
%
-6%
-3
8%Do
ctor
al
30
1%
53
2%
42
1%
30
1%
21
1%
-3
0%
-30%
Gra
nd
Tota
l
3,3
69
10
0%
3
,30
1
10
0%
3
,44
8
10
0%
3
,00
9
10
0%
3
,04
6
10
0%
1
%
-10
%
Ta
ble
3.1
2b
: S
tud
en
t C
red
it H
ou
rs b
y C
ou
rse L
evel
P
erc
en
t C
ha
ng
e
Cla
ss L
evel
2012
%
2013
%
2014
%
2015
%
20
16
%
1
Yea
r 5
Yea
r
Low
er
5,
363
20%
5,
839
21%
6,
544
24%
6,
233
24%
6,
588
24%
6%
23
%
Uppe
r
11,5
30
43%
11
,420
42
%
11,8
05
44%
12
,533
49
%
14,2
51
52%
14
%
24%
Mas
ter’s
9,86
4 37
%
9,74
5 36
%
8,49
3 31
%
6,61
4 26
%
6,33
4 23
%
-4%
-3
6%
Doct
oral
132
0%
272
1%
188
1%
139
1%
102
0%
-27%
-2
3%
Gra
nd
Tota
l
26
,88
9
10
0%
2
7,2
76
1
00
%
27
,03
0
10
0%
2
5,5
19
1
00
%
27
,27
5
10
0%
7
%
1%
Figu
re 3
.12a
: Enr
ollm
ent
by C
lass
Sta
ndin
gFi
gure
3.1
2b: S
tude
nt C
redi
t Hou
rs b
y C
ours
e Le
vel
0
30
0
60
0
90
0
1,2
00
1,5
00
Do
cto
ral
Ma
ste
r'sS
en
iors
Jun
iors
So
ph
om
ore
sF
resh
me
n
2012
2013
2014
2015
2016
0
3,0
00
6,0
00
9,0
00
12,0
00
15,0
00
Doct
ora
l (700-8
99)
Mast
ers
(500-6
99)
Upper
(300-4
99)
Low
er
(100-2
99)
2012
2013
2014
2015
2016

Cleveland State University / 2017 Book of Trends44
Tabl
e 3.
13:
Col
lege
of L
iber
al A
rts
and
Soci
al S
cien
ces
Fall
Enro
llmen
t by
Cla
ss S
tand
ing
& S
tude
nt C
redi
t H
ours
by
Cou
rse
Leve
l: 5-
Year
Tre
nd
Ta
ble
3.1
3a
: E
nro
llm
en
t b
y C
lass S
tan
din
g
P
erc
en
t C
ha
ng
e
Cla
ss S
tan
din
g
2012
%
2013
%
2014
%
2015
%
20
16
%
1
Yea
r 5
Yea
r
Fres
hmen
75
9 20
%
757
21%
61
7 19
%
490
16%
46
6 16
%
-5%
-3
9%So
phom
ores
53
4 14
%
584
16%
47
7 15
%
431
14%
45
2 15
%
5%
-15%
Juni
ors
673
18%
68
7 19
%
642
20%
63
3 21
%
632
22%
0%
-6
%Se
nior
s 1,
169
31%
1,
114
30%
97
9 30
%
944
32%
94
2 32
%
0%
-19%
Mas
ter’s
59
6 16
%
549
15%
53
7 17
%
481
16%
43
7 15
%
-9%
-2
7%G
ran
d T
ota
l 3
,73
1
10
0%
3
,69
1
10
0%
3
,25
2
10
0%
2
,97
9
10
0%
2
,92
9
10
0%
-2
%
-21
%
Tab
le 3
.13b
: S
tud
en
t C
red
it H
ou
rs b
y C
ou
rse L
evel
P
erc
en
t C
ha
ng
e
Co
urs
e L
evel
2012
%
2013
%
2014
%
2015
%
20
16
%
1
Yea
r 5
Yea
r
Deve
lopm
enta
l 39
4 1%
38
6 1%
37
0 1%
41
8 1%
39
8 1%
-5
%
1%Lo
wer
35
,976
61
%
37,5
04
62%
35
,074
64
%
35,7
99
64%
35
,322
64
%
-1%
-2
%Up
per
17,3
47
29%
17
,860
30
%
14,9
28
27%
15
,105
27
%
15,8
49
29%
5%
-9
%M
aste
r’s
5,08
3 9%
4,
662
8%
4,85
9 9%
4,
185
8%
3,78
1 7%
-1
0%
-26%
Doct
oral
8
0%
4 0%
-
0%
4 0%
1
0%
-75%
-8
8%G
ran
d T
ota
l 5
8,8
08
10
0%
6
0,4
16
1
00
%
55
,23
1
10
0%
5
5,5
11
1
00
%
55
,35
1
10
0%
0
%
-6%
Figu
re 3
.13a
: Enr
ollm
ent
by C
lass
Sta
ndin
gFi
gure
3.1
3b: S
tude
nt C
redi
t Hou
rs b
y C
ours
e Le
vel
0
20
0
40
0
60
0
80
0
1,0
00
1,2
00
Ma
ste
r'sS
en
iors
Jun
iors
So
ph
om
ore
sF
resh
me
n
2012
2013
2014
2015
2016
0
5,0
00
10,0
00
15,0
00
20,0
00
25,0
00
30,0
00
35,0
00
40,0
00
Doct
ora
l (700-8
99)
Mast
ers
(500-6
99)
Upper
(300-4
99)
Low
er
(100-2
99)
Deve
lopm
enta
l 2012
2013
2014
2015
2016

45Section 3 - Enrollment Characteristics of Students in CSU Colleges
SEC
TIO
N
3
Tabl
e 3.
14:
Col
lege
of E
duca
tion
and
Hum
an S
ervi
ces
Fa
ll En
rollm
ent
by C
lass
Sta
ndin
g &
Stu
dent
Cre
dit
Hou
rs b
y C
ours
e Le
vel:
5-Ye
ar T
rend
Ta
ble
3.1
4a
: E
nro
llm
en
t b
y C
lass S
tan
din
g
P
erc
en
t C
ha
ng
e
Cla
ss S
tan
din
g
2012
%
2013
%
2014
%
2015
%
20
16
%
1
Yea
r 5
Yea
r
Fres
hmen
12
0 5%
14
9 7%
11
5 6%
13
5 7%
11
8 7%
-1
3%
-2%
Soph
omor
es
135
6%
114
5%
109
5%
109
6%
88
5%
-19%
-3
5%Ju
nior
s 15
8 7%
19
3 9%
15
5 8%
16
2 8%
13
5 8%
-1
7%
-15%
Seni
ors
484
21%
44
8 20
%
424
21%
40
5 21
%
342
19%
-1
6%
-29%
Mas
ter’s
1,
257
55%
1,
253
55%
1,
153
56%
1,
048
54%
1,
003
57%
-4
%
-20%
Doct
oral
11
2 5%
10
2 5%
96
5%
93
5%
84
5%
-1
0%
-25%
Gra
nd
Tota
l 2
,26
6
10
0%
2,2
59
1
00
%
2,0
52
1
00
%
1,9
52
1
00
%
1,7
70
1
00
%
-9%
-2
2%
Tab
le 3
.14b
: S
tud
en
t C
red
it H
ou
rs b
y C
ou
rse L
evel
P
erc
en
t C
ha
ng
e
Co
urs
e L
evel
2012
%
2013
%
2014
%
2015
%
20
16
%
1
Yea
r 5
Yea
r
Low
er
981
6%
1,50
1 9%
1,
451
10%
1,
208
8%
1,17
3 9%
-3
%
20%
Uppe
r 6,
360
39%
5,
938
37%
5,
721
38%
6,
384
42%
5,
237
38%
-1
8%
-18%
Mas
ter’s
7,
925
49%
7,
884
49%
7,
168
48%
6,
886
46%
6,
449
47%
-6
%
-19%
Doct
oral
89
9 6%
90
1 6%
66
9 4%
63
8 4%
74
7 5%
17
%
-17%
Tota
l 1
6,1
65
10
0%
16
,22
4
10
0%
1
5,0
09
1
00
%
15
,11
6
10
0%
1
3,6
06
1
00
%
-10
%
-16
%
Figu
re 3
.14a
: Enr
ollm
ent
by C
lass
Sta
ndin
gFi
gure
3.1
4b: S
tude
nt C
redi
t Hou
rs b
y C
ours
e Le
vel
0
30
0
60
0
90
0
1,2
00
1,5
00
Do
cto
ral
Ma
ste
r'sS
en
iors
Jun
iors
So
ph
om
ore
sF
resh
me
n
2012
2013
2014
2015
2016
0
1,0
00
2,0
00
3,0
00
4,0
00
5,0
00
6,0
00
7,0
00
8,0
00
Doct
ora
l (700-8
99)
Mast
er's
(500-6
99)
Upper
(300-4
99)
Low
er
(100-2
99)
2012
2013
2014
2015
2016

Cleveland State University / 2017 Book of Trends46
Figu
re 3
.15a
: Enr
ollm
ent
by C
lass
Sta
ndin
gFi
gure
3.1
5b: E
nrol
lmen
t by
Cou
rse
Leve
l
Tabl
e 3.
15:
Scho
ol o
f Nur
sing
Fa
ll En
rollm
ent
by C
lass
Sta
ndin
g &
Stu
dent
Cre
dit
Hou
rs b
y C
ours
e Le
vel:
5-Ye
ar T
rend
Ta
ble
3.1
5a
: E
nro
llm
en
t b
y C
lass S
tan
din
g
P
erc
en
t C
ha
ng
e
Cla
ss S
tan
din
g
2012
%
2013
%
2014
%
2015
%
20
16
%
1
Yea
r 5
Yea
r
Fres
hmen
13
3 22
%
156
25%
14
1 24
%
160
27%
16
3 25
%
2%
23%
Soph
omor
es
88
15%
10
1 16
%
101
17%
85
14
%
113
17%
33
%
28%
Juni
ors
89
15%
88
14
%
82
14%
71
12
%
91
14%
28
%
2%Se
nior
s 22
4 38
%
228
36%
22
5 38
%
223
38%
23
4 36
%
5%
4%M
aste
r’s
58
10%
55
9%
51
9%
50
8%
55
8%
10
%
-5%
Gra
nd
Tota
l 5
92
10
0%
6
28
1
00
%
60
0
10
0%
5
89
10
0%
6
56
1
00
%
11
%
11
%
Tab
le 3
.15b
: S
tud
en
t C
red
it H
ou
rs b
y C
ou
rse L
evel
P
erc
en
t C
ha
ng
e
Co
urs
e L
evel
2012
%
2013
%
2014
%
2015
%
20
16
%
1
Yea
r 5
Yea
r
Low
er
1,04
1 23
%
1,05
6 23
%
1,00
5 23
%
1,09
2 24
%
1,11
4 23
%
2%
7%Up
per
3,19
2 70
%
3,17
7 70
%
3,09
2 71
%
3,20
7 70
%
3,52
5 72
%
10%
10
%M
aste
r’s
331
7%
328
7%
267
6%
266
6%
276
6%
4%
-17%
Doct
oral
-
0%
8 0%
-
0%
- 0%
3
0%
--
--G
ran
d T
ota
l 4,5
64
10
0%
4,5
69
1
00
%
4,3
64
1
00
%
4,5
65
1
00
%
4,9
18
1
00
%
8%
8
%
0
50
10
0
15
0
20
0
25
0
Ma
ste
r'sS
en
iors
Jun
iors
So
ph
om
ore
sF
resh
me
n
2012
2013
2014
2015
2016
0
500
1,0
00
1,5
00
2,0
00
2,5
00
3,0
00
3,5
00
4,0
00
Doct
ora
l (700-8
99)
Mast
er's
(500-6
99)
Upper
(300-4
99)
Low
er
(100-2
99)
2012
2013
2014
2015
2016

47Section 3 - Enrollment Characteristics of Students in CSU Colleges
SEC
TIO
N
3
Tabl
e 3.
16:
Col
lege
of E
ngin
eeri
ng
Fall
Enro
llmen
t by
Cla
ss S
tand
ing
& S
tude
nt C
redi
t H
ours
by
Cou
rse
Leve
l: 5-
Year
Tre
nd
Tab
le 3
.16a
: E
nro
llm
en
t b
y C
lass S
tan
din
g
Perc
en
t C
ha
ng
e
Cla
ss S
tan
din
g
2012
%
2013
%
2014
%
2015
%
20
16
%
1
Yea
r 5
Yea
r
Fres
hmen
33
1 21
%
359
20%
33
8 17
%
414
16%
41
5 16
%
0%
25%
Soph
omor
es
200
13%
24
4 14
%
233
12%
30
1 12
%
350
14%
16
%
75%
Juni
ors
213
14%
26
0 15
%
289
15%
35
4 14
%
377
15%
6%
77
%Se
nior
s 42
2 27
%
452
26%
52
9 27
%
740
29%
75
2 30
%
2%
78%
Mas
ter’s
33
5 21
%
391
22%
48
9 25
%
646
26%
59
0 23
%
-9%
76
%Do
ctor
al
68
4%
65
4%
70
4%
72
3%
65
3%
-10%
-4
%To
tal
1,5
69
10
0%
1
,77
1
10
0%
1
,94
8
10
0%
2
,52
7
10
0%
2
,54
9
10
0%
1
%
62
%
Tab
le 3
.16b
: S
tud
en
t C
red
it H
ou
rs b
y C
ou
rse L
evel
P
erc
en
t C
ha
ng
e
Cou
rse L
evel
2012
%
2013
%
2014
%
2015
%
20
16
%
1
Yea
r 5
Yea
r
Low
er
2,50
7 25
%
3,16
7 27
%
4,13
8 29
%
5,44
4 28
%
5,98
9 31
%
10%
13
9%Up
per
4,87
6 48
%
5,28
7 46
%
5,76
3 41
%
7,93
0 41
%
8,43
6 43
%
6%
73%
Mas
ter’s
2,
281
23%
2,
831
24%
3,
905
28%
5,
651
29%
4,
800
24%
-1
5%
110%
Doct
oral
39
0 4%
28
7 2%
38
6 3%
38
9 2%
38
8 2%
0%
-1
%To
tal
1
0,0
54
10
0%
11
,57
2
10
0%
1
4,1
92
1
00
%
19
,41
4
10
0%
1
9,6
13
1
00
%
1%
9
5%
Figu
re 3
.16b
: Stu
dent
Cre
dit H
ours
by
Cou
rse
Leve
lFi
gure
3.1
6a: E
nrol
lmen
t by
Cla
ss S
tand
ing
0
10
0
20
0
30
0
40
0
50
0
60
0
70
0
80
0
Do
cto
ral
Ma
ste
r'sS
en
iors
Jun
iors
So
ph
om
ore
sF
resh
me
n
2012
2013
2014
2015
2016
0
2,0
00
4,0
00
6,0
00
8,0
00
10,0
00
Doct
ora
l (700-8
99)
Mast
er's
(500-6
99)
Upper
(300-4
99)
Low
er
(100-2
99)
2012
2013
2014
2015
2016

Cleveland State University / 2017 Book of Trends48
Tabl
e 3.
17:
Col
lege
of S
cien
ces
& H
ealt
h Pr
ofes
sion
s
Fa
ll En
rollm
ent
by C
lass
Sta
ndin
g &
Stu
dent
Cre
dit
Hou
rs b
y C
ours
e Le
vel:
5-Ye
ar T
rend
Ta
ble
3.1
7a
: E
nro
llm
en
t b
y C
lass S
tan
din
g
P
erc
en
t C
ha
ng
e
Cla
ss S
tan
din
g
2012
%
2013
%
2014
%
2015
%
20
16
%
1
Yea
r 5
Yea
r
Fres
hmen
57
1 15
%
629
16%
51
3 14
%
583
16%
54
0 15
%
-7%
-5
%So
phom
ores
47
1 13
%
510
13%
51
2 14
%
496
13%
54
9 15
%
11%
17
%Ju
nior
s 62
4 17
%
630
16%
64
4 17
%
663
18%
64
5 17
%
-3%
3%
Seni
ors
1,21
0 32
%
1,22
5 32
%
1,17
5 32
%
1,12
7 31
%
1,15
4 31
%
2%
-5%
Mas
ter’s
61
7 17
%
594
15%
60
2 16
%
599
16%
60
5 16
%
1%
-2%
Doct
oral
23
4 6%
25
3 7%
24
1 7%
22
1 6%
21
9 6%
-1
%
-6%
Gra
nd
Tota
l 3,7
27
10
0%
3,8
41
1
00
%
3,6
87
1
00
%
3,6
89
1
00
%
3,7
12
1
00
%
1%
0
%
Tab
le 3
.17b
: S
tud
en
t C
red
it H
ou
rs b
y C
ou
rse L
evel
P
erc
en
t C
ha
ng
e
Co
urs
e L
evel
2012
%
2013
%
2014
%
2015
%
20
16
%
1
Yea
r 5
Yea
r
Deve
lopm
enta
l 2,
232
4%
2,46
4 4%
1,
485
3%
1,36
5 2%
1,
539
3%
13%
-3
1%Lo
wer
31
,226
55
%
33,5
89
56%
31
,561
58
%
34,1
73
59%
33
,075
58
%
-3%
6%
Uppe
r 15
,458
27
%
16,1
47
27%
14
,198
26
%
14,7
10
26%
14
,863
26
%
1%
-4%
Mas
ter’s
5,
769
10%
5,
511
9%
5,47
8 10
%
5,61
6 10
%
5,67
0 10
%
1%
-2%
Doct
oral
1,
676
3%
1,88
3 3%
1,
834
3%
1,76
1 3%
1,
782
3%
1%
6%G
ran
d T
ota
l 5
6,3
61
10
0%
59
,59
4
10
0%
5
4,5
56
1
00
%
57
,62
5
10
0%
5
6,9
29
1
00
%
-1%
1
%
Figu
re 3
.17b
: Stu
dent
Cre
dit H
ours
by
Cou
rse
Leve
lFi
gure
3.1
7a: E
nrol
lmen
t by
Cla
ss S
tand
ing
0
30
0
60
0
90
0
1,2
00
1,5
00
Do
cto
ral
Ma
ste
r'sS
en
iors
Jun
iors
So
ph
om
ore
sF
resh
me
n
2012
2013
2014
2015
2016
0
5,0
00
10,0
00
15,0
00
20,0
00
25,0
00
30,0
00
35,0
00
Doct
ora
l (700-8
99)
Mast
er's
(500-6
99)
Upper
(300-4
99)
Low
er
(100-2
99)
Deve
lopm
enta
l 2012
2013
2014
2015
2016

49Section 3 - Enrollment Characteristics of Students in CSU Colleges
SEC
TIO
N
3
Tabl
e 3.
18:
Col
lege
of U
rban
Aff
airs
Fa
ll En
rollm
ent
by C
lass
Sta
ndin
g &
Stu
dent
Cre
dit
Hou
rs b
y C
ours
e Le
vel:
5-Ye
ar T
rend
Ta
ble
3.1
8a
: E
nro
llm
en
t b
y C
lass S
tan
din
g
P
erc
en
t C
ha
ng
e
Cla
ss S
tan
din
g
2012
%
2013
%
2014
%
2015
%
20
16
%
1
Yea
r 5
Yea
r
Fres
hmen
31
5%
20
3%
27
4%
28
4%
22
4%
-2
1%
-29%
Soph
omor
es
38
6%
35
6%
54
9%
51
8%
53
9%
4%
39%
Juni
ors
91
15%
10
5 18
%
107
18%
13
7 21
%
124
20%
-9
%
36%
Seni
ors
167
27%
16
4 28
%
199
33%
20
6 32
%
211
35%
2%
26
%M
aste
r’s
253
41%
21
6 38
%
187
31%
19
9 30
%
172
28%
-1
4%
-32%
Doct
oral
40
6%
36
6%
32
5%
32
5%
25
4%
-2
2%
-38%
Gra
nd
Tota
l 6
20
10
0%
5
76
1
00
%
60
6
10
0%
6
53
10
0%
6
07
1
00
%
-7%
-2
%
Tab
le 3
.18b
: S
tud
en
t C
red
it H
ou
rs b
y C
ou
rse L
evel
P
erc
en
t C
ha
ng
e
Co
urs
e L
evel
2012
%
2013
%
2014
%
2015
%
20
16
%
1
Yea
r 5
Yea
r
Low
er
4,81
1 47
%
4,84
4 48
%
3,98
0 45
%
3,90
0 43
%
3,72
6 42
%
-4%
-2
3%Up
per
3,18
8 31
%
3,30
3 32
%
3,14
8 35
%
3,30
9 36
%
3,51
7 40
%
6%
10%
Mas
ter’s
2,
045
20%
1,
818
18%
1,
577
18%
1,
736
19%
1,
429
16%
-1
8%
-30%
Doct
oral
20
1 2%
21
1 2%
16
5 2%
12
6 1%
10
8 1%
-1
4%
-46%
Gra
nd
Tota
l 1
0,2
45
10
0%
10
,17
6
10
0%
8
,87
0
10
0%
9
,07
1
10
0%
8
,78
0
10
0%
-3
%
-14
%
Figu
re 3
.18a
: Enr
ollm
ent
by C
lass
Sta
ndin
gFi
gure
3.1
8b: S
tude
nt C
redi
t Hou
rs b
y C
ours
e Le
vel
0
50
10
0
15
0
20
0
25
0
30
0
Do
cto
ral
Ma
ste
r'sS
en
iors
Jun
iors
So
ph
om
ore
sF
resh
me
n
2012
2013
2014
2015
2016
0
1,0
00
2,0
00
3,0
00
4,0
00
5,0
00
Doct
ora
l (700-8
99)
Mast
er's
(500-6
99)
Upper
(300-4
99)
Low
er
(100-2
99)
2012
2013
2014
2015
2016

Cleveland State University / 2017 Book of Trends50
Tabl
e 3.
19:
Col
lege
of L
aw
Fall
Enro
llmen
t by
Cla
ss S
tand
ing
& S
tude
nt C
redi
t H
ours
by
Cou
rse
Leve
l: 5-
Year
Tre
nd
Tab
le 3
.19a
: E
nro
llm
en
t b
y C
lass S
tan
din
g
P
erc
en
t C
ha
ng
e
Cla
ss S
tan
din
g
2012
%
2013
%
2014
%
2015
%
20
16
%
1
Yea
r 5
Yea
r
Law
50
1 10
0%
469
100%
44
2 10
0%
428
100%
38
1 10
0%
-11%
-2
4%G
ran
d T
ota
l 5
01
10
0%
4
69
1
00
%
44
2
10
0%
4
28
1
00
%
38
1
10
0%
-1
1%
-2
4%
Ta
ble
3.1
9b
: S
tud
en
t C
red
it H
ou
rs b
y C
ou
rse L
evel
P
erc
en
t C
ha
ng
e
Co
urs
e L
evel
2012
%
2013
%
2014
%
2015
%
20
16
%
1
Yea
r 5
Yea
r
Law
6,
776
100%
6,
116
100%
5,
720
100%
5,
282
100%
4,
877
100%
-8
%
-28%
Gran
d To
tal
6,77
6 10
0%
6,11
6 10
0%
5,72
0 10
0%
5,28
2 10
0%
4,87
7 10
0%
-8%
-2
8%
Figu
re 3
.19a
: Enr
ollm
ent
by C
lass
Sta
ndin
gFi
gure
3.1
9b: S
tude
nt C
redi
t Hou
rs b
y C
ours
e Le
vel
0
10
0
20
0
30
0
40
0
50
0
60
0
La
w
2012
2013
2014
2015
2016
0
1,0
00
2,0
00
3,0
00
4,0
00
5,0
00
6,0
00
7,0
00
8,0
00
La
w
2012
2013
2014
2015
2016

51Section 3 - Enrollment Characteristics of Students in CSU Colleges
SEC
TIO
N
3
Tabl
e 3.
20:
Und
ergr
adua
te S
tudi
es
Fall
Enro
llmen
t by
Cla
ss S
tand
ing
& S
tude
nt C
redi
t H
ours
by
Cou
rse
Leve
l: 5-
Year
Tre
nd
Ta
ble
3.2
0a
: E
nro
llm
en
t b
y C
lass S
tan
din
g
P
erc
en
t C
ha
ng
e
Cla
ss S
tan
din
g
2012
%
2013
%
2014
%
2015
%
20
16
%
1
Yea
r 5
Yea
r
Fres
hmen
60
5 78
%
632
73%
72
8 75
%
845
77%
81
6 78
%
-3%
35
%So
phom
ores
94
12
%
110
13%
14
2 15
%
126
12%
12
0 11
%
-5%
28
%Ju
nior
s 36
5%
56
6%
52
5%
65
6%
59
6%
-9
%
64%
Seni
ors
45
6%
65
8%
43
4%
58
5%
54
5%
-7%
20
%G
ran
d T
ota
l 7
80
10
0%
8
63
1
00
%
96
5
10
0%
1
,09
4
10
0%
1
,04
9
10
0%
-4
%
34
%
Tab
le 3
.20b
: S
tud
en
t C
red
it H
ou
rs b
y C
ou
rse L
evel
P
erc
en
t C
ha
ng
e
Co
urs
e L
evel
2012
%
2013
%
2014
%
2015
%
20
16
%
1
Yea
r 5
Yea
r
Low
er
1,41
9 10
0%
1,59
6 10
0%
1,42
7 10
0%
1,49
9 10
0%
1,52
3 10
0%
2%
7%G
ran
d T
ota
l 1,4
19
10
0%
1,5
96
1
00
%
1,4
27
1
00
%
1,4
99
1
00
%
1,5
23
1
00
%
2%
7
%
Figu
re 3
.20a
: Enr
ollm
ent
by C
lass
Sta
ndin
gFi
gure
3.2
0b: S
tude
nt C
redi
t Hou
rs b
y C
ours
e Le
vel
0
20
0
40
0
60
0
80
0
1,0
00
Se
nio
rsJu
nio
rsS
op
ho
mo
res
Fre
shm
en 20
1220
1320
1420
1520
16
0
500
1,0
00
1,5
00
2,0
00
Low
er
(100-2
99)
2012
2013
2014
2015
2016

Cleveland State University / 2017 Book of Trends52
Tabl
e 3.
21: C
SU T
otal
Fal
l Enr
ollm
ent
by C
olle
ge a
nd E
thni
city
: 5-Y
ear T
rend
2012
2013
2014
20
15
2
01
6
Perc
en
t C
ha
ng
e
Co
lleg
e
Ra
ce
En
roll
men
t
%
En
roll
men
t
%
E
nro
llm
en
t
%
E
nro
llm
en
t
%
En
rollm
en
t
%
1 y
ea
r
5
yea
r
Busi
ness
Am
eric
an In
dian
/Ala
ska
Nativ
e
6 0%
4
0%
3 0%
5
0%
5 0%
0%
-1
7%
Asia
n
128
4%
122
4%
151
4%
126
4%
133
4%
6%
4%
Blac
k/Af
rican
Am
eric
an
51
4 15
%
462
14%
46
6 14
%
405
13%
39
0 13
%
-4%
-2
4%
Hisp
anic
/Lat
ino
108
3%
116
4%
127
4%
120
4%
140
5%
17%
30
%
Nativ
e Ha
wai
ian
or O
ther
Pac
ifi c
Isla
nd
3
0%
5 0%
4
0%
2 0%
5
0%
150%
67
%
Non
Resi
dent
Alie
n
396
12%
45
9 14
%
427
12%
30
5 10
%
303
10%
-1
%
-23%
Tw
o or
mor
e ra
ces
38
1%
50
2%
62
2%
57
2%
53
2%
-7
%
39%
Un
know
n
130
4%
75
2%
73
2%
55
2%
54
2%
-2%
-5
8%
Whi
te
2,
046
61%
2,
008
61%
2,
135
62%
1,
934
64%
1,
963
64%
1%
-4
%B
usin
ess T
ota
l 3,3
69
1
00
%
3,3
01
1
00
%
3,4
48
1
00
%
3,0
09
1
00
%
3,0
46
1
00
%
1%
-1
0%
CLAS
S Am
eric
an In
dian
/Ala
ska
Nativ
e
11
0%
9 0%
4
0%
7 0%
8
0%
14%
-2
7%
Asia
n
50
1%
63
2%
44
1%
32
1%
32
1%
0%
-36%
Bl
ack/
Afric
an A
mer
ican
929
25%
90
7 25
%
829
25%
76
0 26
%
733
25%
-4
%
-21%
Hi
span
ic/L
atin
o
18
6 5%
21
3 6%
19
0 6%
17
3 6%
16
3 6%
-6
%
-12%
Na
tive
Haw
aiia
n or
Oth
er P
acifi
c Is
land
3 0%
3
0%
3 0%
4
0%
2 0%
-5
0%
-33%
No
n Re
side
nt A
lien
58
2%
52
1%
51
2%
53
2%
50
2%
-6
%
-14%
Tw
o or
mor
e ra
ces
93
2%
10
8 3%
12
1 4%
10
6 4%
10
7 4%
1%
15
%
Unkn
own
18
8 5%
13
9 4%
80
2%
42
1%
43
1%
2%
-7
7%
Whi
te
2,
213
59%
2,
197
60%
1,
930
59%
1,
802
60%
1,
791
61%
-1
%
-19%
CLA
SS
Tota
l
3,7
31
1
00
%
3,6
91
1
00
%
3,2
52
1
00
%
2,9
79
1
00
%
2,9
29
1
00
%
-2%
-2
1%
Educ
atio
n Am
eric
an In
dian
/Ala
ska
Nativ
e
1 0%
3
0%
6 0%
4
0%
4 0%
0%
30
0%
Asia
n
20
1%
20
1%
23
1%
16
1%
11
1%
-31%
-4
5%
Blac
k/Af
rican
Am
eric
an
53
3 24
%
503
22%
47
7 23
%
479
25%
41
1 23
%
-14%
-2
3%
Hisp
anic
/Lat
ino
75
3%
83
4%
85
4%
82
4%
90
5%
10%
20
%
Nativ
e Ha
wai
ian
or O
ther
Pac
ifi c
Isla
nd
2
0%
2 0%
4
0%
4 0%
2
0%
-50%
0%
No
n Re
side
nt A
lien
65
3%
89
4%
98
5%
10
3 5%
74
4%
-2
8%
14%
Tw
o or
mor
e ra
ces
26
1%
40
2%
42
2%
46
2%
46
3%
0%
77
%
Unkn
own
14
1 6%
80
4%
62
3%
39
2%
20
1%
-4
9%
-86%
W
hite
1,40
3 62
%
1,43
9 64
%
1,25
5 61
%
1,17
9 60
%
1,11
2 63
%
-6%
-2
1%E
du
ca
tion
Tota
l 2
,26
6
10
0%
2
,25
9
10
0%
2
,05
2
10
0%
1
,952
1
00
%
1,7
70
1
00
%
-9%
-2
2%
Engi
neer
ing
Amer
ican
Indi
an/A
lask
a Na
tive
1
0%
- 0%
1
0%
4 0%
3
0%
-25%
20
0%
Asia
n
54
3%
58
3%
63
3%
99
4%
118
5%
19%
11
9%
Blac
k/Af
rican
Am
eric
an
12
0 8%
11
9 7%
12
7 7%
15
1 6%
17
9 7%
19
%
49%
Hi
span
ic/L
atin
o
48
3%
54
3%
56
3%
77
3%
83
3%
8%
73
%
Nativ
e Ha
wai
ian
or O
ther
Pac
ifi c
Isla
nd
2
0%
1 0%
1
0%
1 0%
1
0%
0%
-50%
No
n Re
side
nt A
lien
36
9 24
%
508
29%
63
9 33
%
857
34%
78
5 31
%
-8%
11
3%
Two
or m
ore
race
s
16
1%
25
1%
31
2%
41
2%
49
2%
20%
20
6%
Unkn
own
63
4%
59
3%
39
2%
40
2%
35
1%
-1
3%
-44%
W
hite
896
57%
94
7 53
%
991
51%
1,
257
50%
1,
296
51%
3%
45
%E
ng
ineeri
ng
Tota
l 1
,56
9
10
0%
1
,77
1
10
0%
1
,94
8
10
0%
2
,527
1
00
%
2,5
49
1
00
%
1%
6
2%
cont
inue
d on
nex
t pag
e

53Section 3 - Enrollment Characteristics of Students in CSU Colleges
SEC
TIO
N
3
cont
inue
d fro
m p
revio
us p
age
Ta
ble
3.21
: CSU
Tot
al F
all E
nrol
lmen
t by
Col
lege
and
Eth
nici
ty: 5
-Yea
r Tre
nd
2012
2013
2014
20
15
2
01
6
Perc
en
t C
ha
ng
e
Colleg
e
Ra
ce
En
roll
men
t
%
En
roll
men
t
%
E
nro
llm
en
t
%
E
nro
llm
en
t
%
En
rollm
en
t
%
1 y
ea
r
5
yea
r
Grad
uate
As
ian
2
11%
4
14%
1
4%
- 0%
2
8%
- 0%
Stud
ies
Blac
k/Af
rican
Am
eric
an
2
11%
2
7%
1 4%
3
13%
1
4%
-67%
-5
0%
Hisp
anic
/Lat
ino
- 0%
-
0%
- 0%
-
0%
- 0%
-
-
Non
Resi
dent
Alie
n
- 0%
1
4%
1 4%
1
4%
1 4%
0%
-
Tw
o or
mor
e ra
ces
1
5%
- 0%
-
0%
- 0%
-
0%
- -1
00%
Un
know
n
1 5%
14
50
%
15
63%
17
74
%
20
83%
18
%
1900
%
Whi
te
13
68
%
7 25
%
6 25
%
2 9%
-
0%
-100
%
-100
%G
rad
ua
te S
tud
ies T
ota
l 1
9
10
0%
2
8
10
0%
2
4
10
0%
2
3
10
0%
2
4
10
0%
4
%
26
%
Law
Am
eric
an In
dian
/Ala
ska
Nativ
e
1 0%
3
1%
2 0%
2
0%
- 0%
-1
00%
-1
00%
As
ian
12
2%
14
3%
8
2%
10
2%
10
3%
0%
-17%
Bl
ack/
Afric
an A
mer
ican
40
8%
41
9%
36
8%
40
9%
40
10%
0%
0%
Hi
span
ic/L
atin
o
20
4%
21
4%
16
4%
21
5%
17
4%
-1
9%
-15%
No
n Re
side
nt A
lien
7
1%
9 2%
9
2%
6 1%
4
1%
-33%
-4
3%
Two
or m
ore
race
s
5 1%
8
2%
8 2%
10
2%
8
2%
-20%
60
%
Unkn
own
9
2%
11
2%
13
3%
16
4%
14
4%
-13%
56
%
Whi
te
40
7 81
%
362
77%
35
0 79
%
323
75%
28
8 76
%
-11%
-2
9%La
w T
ota
l
50
1
10
0%
4
69
1
00
%
44
2
10
0%
4
28
1
00
%
38
1
10
0%
-1
1%
-2
4%
Nurs
ing
Amer
ican
Indi
an/A
lask
a Na
tive
-
0%
1 0%
1
0%
1 0%
1
0%
0%
-
Asia
n
21
4%
18
3%
19
3%
29
5%
32
5%
10%
52
%
Blac
k/Af
rican
Am
eric
an
79
13
%
86
14%
80
13
%
63
11%
76
12
%
21%
-4
%
Hisp
anic
/Lat
ino
23
4%
34
5%
27
5%
26
4%
35
5%
35%
52
%
Nativ
e Ha
wai
ian
or O
ther
Pac
ifi c
Isla
nd
1
0%
1 0%
-
0%
- 0%
1
0%
- 0%
No
n Re
side
nt A
lien
12
2%
15
2%
14
2%
7
1%
11
2%
57%
-8
%
Two
or m
ore
race
s
14
2%
18
3%
15
3%
17
3%
19
3%
12%
36
%
Unkn
own
18
3%
10
2%
6
1%
7 1%
9
1%
29%
-5
0%
Whi
te
42
4 72
%
445
71%
43
8 73
%
439
75%
47
2 72
%
8%
11%
Nu
rsin
g T
ota
l
59
2
10
0%
6
28
1
00
%
60
0
10
0%
5
89
1
00
%
65
6
10
0%
1
1%
1
1%
Othe
r As
ian
-
0%
- 0%
-
0%
1 1%
-
0%
-100
%
-
Non
Resi
dent
Alie
n
104
98%
82
99
%
149
99%
11
5 98
%
65
98%
-4
3%
-38%
Un
know
n
2 2%
-
0%
1 1%
-
0%
1 2%
-
-50%
W
hite
- 0%
1
1%
1 1%
1
1%
- 0%
-1
00%
-
Oth
er
Tota
l
10
6
10
0%
8
3
10
0%
1
51
1
00
%
11
7
10
0%
6
6
10
0%
-4
4%
-3
8%
cont
inue
d on
nex
t pag
e

Cleveland State University / 2017 Book of Trends54
cont
inue
d fro
m p
revio
us p
age
Ta
ble
3.21
: CSU
Tot
al F
all E
nrol
lmen
t by
Col
lege
and
Eth
nici
ty: 5
-Yea
r Tre
nd
2012
2013
2014
20
15
2
01
6
Perc
en
t C
ha
ng
e
Co
lleg
e
Ra
ce
En
roll
men
t
%
En
roll
men
t
%
E
nro
llm
en
t
%
E
nro
llm
en
t
%
En
rollm
en
t
%
1 y
ea
r
5
yea
r
Scie
nce
Amer
ican
Indi
an/A
lask
a Na
tive
13
0%
10
0%
8
0%
10
0%
9 0%
-1
0%
-31%
As
ian
11
3 3%
11
6 3%
13
6 4%
15
2 4%
16
1 4%
6%
42
%
Blac
k/Af
rican
Am
eric
an
57
3 15
%
556
14%
52
9 14
%
542
15%
55
1 15
%
2%
-4%
Hi
span
ic/L
atin
o
12
7 3%
14
3 4%
14
8 4%
17
9 5%
18
2 5%
2%
43
%
Nativ
e Ha
wai
ian
or O
ther
Pac
ifi c
Isla
nd
6
0%
2 0%
5
0%
7 0%
3
0%
-57%
-5
0%
Non
Resi
dent
Alie
n
192
5%
198
5%
173
5%
156
4%
160
4%
3%
-17%
Tw
o or
mor
e ra
ces
95
3%
10
0 3%
11
8 3%
11
8 3%
12
7 3%
8%
34
%
Unkn
own
15
3 4%
11
2 3%
86
2%
79
2%
64
2%
-1
9%
-58%
W
hite
2,45
5 66
%
2,60
4 68
%
2,48
4 67
%
2,44
6 66
%
2,45
5 66
%
0%
0%S
cie
nce T
ota
l
3,7
27
1
00
%
3,8
41
1
00
%
3,6
87
1
00
%
3,6
89
1
00
%
3,7
12
1
00
%
1%
0
%
Unde
rgra
duat
e As
ian
15
6%
11
5%
13
8%
8
4%
14
8%
75%
-7
%No
n-De
gree
Bl
ack/
Afric
an A
mer
ican
26
11%
26
12
%
21
12%
22
11
%
12
7%
-45%
-5
4%
Hisp
anic
/Lat
ino
7 3%
10
5%
8
5%
8 4%
6
4%
-25%
-1
4%
Non
Resi
dent
Alie
n
2 1%
4
2%
3 2%
14
7%
5
3%
-64%
15
0%
Two
or m
ore
race
s
2 1%
4
2%
3 2%
7
3%
4 2%
-4
3%
100%
Un
know
n
22
9%
15
7%
13
8%
18
9%
16
9%
-11%
-2
7%
Whi
te
17
1 70
%
150
68%
10
9 64
%
132
63%
11
3 66
%
-14%
-3
4%U
nd
erg
rad
ua
te N
on
-Deg
ree T
ota
l 2
45
1
00
%
22
0
10
0%
1
70
1
00
%
20
9
10
0%
1
70
1
00
%
-19
%
-31
%
Unde
rgra
duat
e Am
eric
an In
dian
/Ala
ska
Nativ
e
3 0%
1
0%
1 0%
4
0%
1 0%
-7
5%
-67%
Stud
ies
Asia
n
34
4%
40
5%
46
5%
52
5%
51
5%
-2%
50
%
Blac
k/Af
rican
Am
eric
an
22
7 29
%
242
28%
23
6 24
%
236
22%
23
1 22
%
-2%
2%
Hi
span
ic/L
atin
o
24
3%
31
4%
46
5%
49
4%
56
5%
14
%
133%
Na
tive
Haw
aiia
n or
Oth
er P
acifi
c Is
land
1
0%
1
0%
- 0%
2
0%
2 0%
0%
10
0%
Non
Resi
dent
Alie
n
7 1%
5
1%
6 1%
5
0%
8 1%
60
%
14%
Tw
o or
mor
e ra
ces
21
3%
21
2%
24
2%
40
4%
37
4%
-8
%
76%
Un
know
n
84
11%
95
11
%
105
11%
11
7 11
%
101
10%
-1
4%
20%
W
hite
379
49%
42
7 49
%
501
52%
58
9 54
%
562
54%
-5
%
48%
Un
derg
rad
ua
te S
tud
ies T
ota
l 7
80
1
00
%
86
3
10
0%
9
65
1
00
%
1,0
94
1
00
%
1,0
49
1
00
%
-4%
3
4%
cont
inue
d on
nex
t pag
e

55Section 3 - Enrollment Characteristics of Students in CSU Colleges
SEC
TIO
N
3
cont
inue
d fro
m p
revio
us p
age
Ta
ble
3.21
: CSU
Tot
al F
all E
nrol
lmen
t by
Col
lege
and
Eth
nici
ty: 5
-Yea
r Tre
nd
2012
2013
2014
20
15
2
01
6
Perc
en
t C
ha
ng
e
Co
lleg
e
Ra
ce
En
roll
men
t
%
En
roll
men
t
%
E
nro
llm
en
t
%
E
nro
llm
en
t
%
En
rollm
en
t
%
1 y
ea
r
5
yea
r
Urba
n Af
fairs
Am
eric
an In
dian
/Ala
ska
Nativ
e
1 0%
-
0%
- 0%
1
0%
1 0%
0%
0%
As
ian
5
1%
7 1%
7
1%
6 1%
5
1%
-17%
0%
Bl
ack/
Afric
an A
mer
ican
1
61
26%
16
3 28
%
156
26%
17
8 27
%
154
25%
-1
3%
-4%
Hi
span
ic/L
atin
o
18
3%
16
3%
28
5%
34
5%
36
6%
6%
10
0%
Nativ
e Ha
wai
ian
or O
ther
Pac
ifi c
Isla
nd
- 0%
-
0%
1 0%
-
0%
- 0%
-
-
Non
Resi
dent
Alie
n
31
5%
26
5%
24
4%
25
4%
25
4%
0%
-19%
Tw
o or
mor
e ra
ces
7
1%
10
2%
11
2%
14
2%
14
2%
0%
100%
Un
know
n
33
5%
19
3%
16
3%
7 1%
3
0%
-57%
-9
1%
Whi
te
36
4 59
%
335
58%
36
3 60
%
388
59%
36
9 61
%
-5%
1%
Urb
an
Aff
air
s T
ota
l 6
20
1
00
%
57
6
10
0%
6
06
1
00
%
65
3
10
0%
6
07
1
00
%
-7%
-2
%
Gra
nd
Tota
l
17
,52
5
1
7,7
30
17
,34
5
1
7,2
69
16
,95
9
-2
%
-3%

Cleveland State University / 2017 Book of Trends56
Tabl
e 3.
22:
CSU
Und
ergr
adua
te F
all E
nrol
lmen
t by
Col
lege
& E
thni
city
: 5-Y
ear T
rend
2012
2013
2014
20
15
2
01
6
Perc
en
t C
ha
ng
e
Colleg
e
Ra
ce
En
roll
men
t
%
En
roll
men
t
%
En
roll
men
t
%
En
rollm
en
t
%
En
rollm
en
t
%
1 y
ea
r
5 y
ea
r
Busi
ness
Am
eric
an In
dian
/Ala
ska
Nativ
e
3 0%
1
0%
2 0%
5
0%
4 0%
-2
0%
33%
As
ian
72
4%
62
3%
88
4%
74
4%
89
4%
20
%
24%
Bl
ack/
Afric
an A
mer
ican
366
19%
32
7 17
%
329
15%
28
7 14
%
297
14%
3%
-1
9%
Hisp
anic
/Lat
ino
72
4%
82
4%
95
4%
91
4%
111
5%
22%
54
%
Nativ
e Ha
wai
ian
or O
ther
Pac
ifi c
Isla
nd
3
0%
5 0%
4
0%
2 0%
4
0%
100%
33
%
Non
Resi
dent
Alie
n
130
7%
156
8%
163
7%
151
7%
139
6%
-8%
7%
Tw
o or
mor
e ra
ces
30
2%
34
2%
45
2%
43
2%
42
2%
-2
%
40%
Un
know
n
69
3%
43
2%
42
2%
34
2%
38
2%
12%
-4
5%
Whi
te
1,
228
62%
1,
231
63%
1,
477
66%
1,
391
67%
1,
457
67%
5%
19
%B
usin
ess T
ota
l
1,9
73
1
00
%
1,9
41
1
00
%
2,2
45
1
00
%
2,0
78
1
00
%
2,1
81
1
00
%
5%
1
1%
CLAS
S Am
eric
an In
dian
/Ala
ska
Nativ
e
11
0%
8 0%
3
0%
7 0%
8
0%
14%
-2
7%
Asia
n
45
1%
55
2%
38
1%
28
1%
27
1%
-4%
-4
0%
Blac
k/Af
rican
Am
eric
an
78
6 25
%
745
24%
66
6 25
%
626
25%
61
9 25
%
-1%
-2
1%
Hisp
anic
/Lat
ino
168
5%
191
6%
167
6%
148
6%
145
6%
-2%
-1
4%
Nativ
e Ha
wai
ian
or O
ther
Pac
ifi c
Isla
nd
3
0%
3 0%
3
0%
4 0%
2
0%
-50%
-3
3%
Non
Resi
dent
Alie
n
40
1%
36
1%
30
1%
28
1%
30
1%
7%
-25%
Tw
o or
mor
e ra
ces
85
3%
10
3 3%
10
8 4%
95
4%
91
4%
-4
%
7%
Unkn
own
14
5 5%
11
5 4%
66
2%
37
1%
37
1%
0%
-7
4%
Whi
te
1,
852
59%
1,
886
60%
1,
634
60%
1,
525
61%
1,
533
62%
1%
-1
7%C
LA
SS
Tota
l
3,1
35
1
00
%
3,1
42
1
00
%
2,7
15
1
00
%
2,4
98
1
00
%
2,4
92
1
00
%
0%
-2
1%
Educ
atio
n Am
eric
an In
dian
/Ala
ska
Nativ
e
1 0%
3
0%
4 0%
3
0%
2 0%
-3
3%
100%
As
ian
6
1%
7 1%
8
1%
5 1%
3
0%
-40%
-5
0%
Blac
k/Af
rican
Am
eric
an
21
4 24
%
196
22%
16
2 20
%
166
20%
13
9 20
%
-16%
-3
5%
Hisp
anic
/Lat
ino
41
5%
47
5%
47
6%
43
5%
42
6%
-2%
2%
Na
tive
Haw
aiia
n or
Oth
er P
acifi
c Is
land
1
0%
1
0%
2 0%
2
0%
1 0%
-5
0%
0%
Non
Resi
dent
Alie
n
12
1%
13
1%
11
1%
11
1%
9 1%
-1
8%
-25%
Tw
o or
mor
e ra
ces
13
1%
22
2%
24
3%
25
3%
26
4%
4%
10
0%
Unkn
own
35
4%
23
3%
17
2%
14
2%
10
1%
-2
9%
-71%
W
hite
574
64%
59
2 65
%
528
66%
54
2 67
%
451
66%
-1
7%
-21%
Ed
uca
tion
Tota
l 8
97
1
00
%
90
4
10
0%
8
03
1
00
%
811
1
00
%
68
3
10
0%
-1
6%
-2
4%
cont
inue
d on
nex
t pag
e

57Section 3 - Enrollment Characteristics of Students in CSU Colleges
SEC
TIO
N
3
Tabl
e 3.
22:
CSU
Und
ergr
adua
te F
all E
nrol
lmen
t by
Col
lege
& E
thni
city
: 5-Y
ear T
rend
2012
2013
2014
20
15
2
01
6
Perc
en
t C
ha
ng
e
Co
lleg
e
Ra
ce
En
roll
men
t
%
En
roll
men
t
%
En
roll
men
t
%
En
rollm
en
t
%
En
rollm
en
t
%
1 y
ea
r
5
yea
r
Engi
neer
ing
Amer
ican
Indi
an/A
lask
a Na
tive
-
0%
- 0%
1
0%
4 0%
3
0%
-25%
-
As
ian
35
3%
40
3%
50
4%
82
5%
99
5%
21
%
183%
Bl
ack/
Afric
an A
mer
ican
1
09
9%
103
8%
112
8%
138
8%
166
9%
20%
52
%
Hisp
anic
/Lat
ino
40
3%
49
4%
49
4%
74
4%
78
4%
5%
95%
Na
tive
Haw
aiia
n or
Oth
er P
acifi
c Is
land
1
0%
1 0%
1
0%
1 0%
1
0%
0%
0%
Non
Resi
dent
Alie
n
177
15%
26
2 20
%
293
21%
35
5 20
%
332
18%
-6
%
88%
Tw
o or
mor
e ra
ces
16
1%
22
2%
26
2%
37
2%
48
3%
30
%
200%
Un
know
n
41
4%
40
3%
24
2%
28
2%
27
1%
-4%
-3
4%
Whi
te
74
7 64
%
798
61%
83
3 60
%
1,09
0 60
%
1,14
0 60
%
5%
53%
En
gin
eeri
ng
Tota
l 1
,16
6
10
0%
1
,31
5
10
0%
1
,38
9
10
0%
1
,809
1
00
%
1,8
94
1
00
%
5%
6
2%
Nurs
ing
Amer
ican
Indi
an/A
lask
a Na
tive
-
0%
1 0%
1
0%
1 0%
1
0%
0%
-
Asia
n
20
4%
17
3%
17
3%
28
5%
31
5%
11%
55
%
Blac
k/Af
rican
Am
eric
an
70
13
%
77
13%
69
13
%
51
9%
62
10%
22
%
-11%
Hi
span
ic/L
atin
o
21
4%
31
5%
25
5%
25
5%
32
5%
28
%
52%
Na
tive
Haw
aiia
n or
Oth
er P
acifi
c Is
land
1
0%
1 0%
-
0%
- 0%
1
0%
- 0%
No
n Re
side
nt A
lien
11
2%
14
2%
14
3%
7
1%
11
2%
57%
0%
Tw
o or
mor
e ra
ces
13
2%
17
3%
14
3%
17
3%
19
3%
12
%
46%
Un
know
n
13
2%
7 1%
6
1%
7 1%
8
1%
14%
-3
8%
Whi
te
38
5 72
%
408
71%
40
3 73
%
403
75%
43
6 73
%
8%
13%
Nu
rsin
g T
ota
l
53
4
10
0%
5
73
1
00
%
54
9
10
0%
5
39
1
00
%
60
1
10
0%
1
2%
1
3%
Othe
r As
ian
-
0%
- 0%
-
0%
1 1%
-
0%
-100
%
-
Non
Resi
dent
Alie
n
104
98%
82
99
%
149
99%
11
5 98
%
65
98%
-4
3%
-38%
Un
know
n
2 2%
-
0%
1 1%
-
0%
1 2%
-
-50%
W
hite
- 0%
1
1%
1 1%
1
1%
- 0%
-1
00%
-
Oth
er
Tota
l
10
6
10
0%
8
3
10
0%
1
51
1
00
%
117
1
00
%
66
1
00
%
-44
%
-38
%
Scie
nce
Amer
ican
Indi
an/A
lask
a Na
tive
13
0%
10
0%
6 0%
9
0%
8 0%
-1
1%
-38%
As
ian
85
3%
92
3%
11
2 4%
12
8 4%
14
0 5%
9%
65
%
Blac
k/Af
rican
Am
eric
an
517
18
%
510
17%
48
2 17
%
486
17%
49
6 17
%
2%
-4%
Hi
span
ic/L
atin
o
11
5 4%
13
2 4%
13
3 5%
15
5 5%
15
1 5%
-3
%
31%
Na
tive
Haw
aiia
n or
Oth
er P
acifi
c Is
land
5
0%
2 0%
5
0%
7 0%
3
0%
-57%
-4
0%
Non
Resi
dent
Alie
n
53
2%
56
2%
50
2%
49
2%
62
2%
27%
17
%
Two
or m
ore
race
s
89
3%
94
3%
112
4%
110
4%
117
4%
6%
31%
Un
know
n
115
4%
89
3%
70
2%
65
2%
52
2%
-20%
-5
5%
Whi
te
1,
884
66%
2,
009
67%
1,
874
66%
1,
860
65%
1,
859
64%
0%
-1
%S
cie
nce T
ota
l
2,8
76
1
00
%
2,9
94
1
00
%
2,8
44
1
00
%
2,8
69
1
00
%
2,8
88
1
00
%
1%
0
%
cont
inue
d fro
m p
revio
us p
age
cont
inue
d on
nex
t pag
e

Cleveland State University / 2017 Book of Trends58
Tabl
e 3.
22:
CSU
Und
ergr
adua
te F
all E
nrol
lmen
t by
Col
lege
& E
thni
city
: 5-Y
ear T
rend
2012
2013
2014
20
15
2
01
6
Perc
en
t C
ha
ng
e
Colleg
e
Ra
ce
En
roll
men
t
%
En
roll
men
t
%
En
roll
men
t
%
En
rollm
en
t
%
En
rollm
en
t
%
1 y
ea
r
5
yea
r
Unde
rgra
duat
e As
ian
15
6%
11
5%
13
8%
8
4%
14
8%
75%
-7
%No
n-De
gree
Bl
ack/
Afric
an A
mer
ican
26
11%
26
12
%
21
12%
22
11
%
12
7%
-45%
-5
4%
Hisp
anic
/Lat
ino
7 3%
10
5%
8
5%
8 4%
6
4%
-25%
-1
4%
Non
Resi
dent
Alie
n
2 1%
4
2%
3 2%
14
7%
5
3%
-64%
15
0%
Two
or m
ore
race
s
2 1%
4
2%
3 2%
7
3%
4 2%
-4
3%
100%
Un
know
n
22
9%
15
7%
13
8%
18
9%
16
9%
-11%
-2
7%
Whi
te
17
1 70
%
150
68%
10
9 64
%
132
63%
11
3 66
%
-14%
-3
4%U
nd
erg
rad
ua
te N
on
-Deg
ree T
ota
l 2
45
1
00
%
22
0
10
0%
1
70
1
00
%
20
9
10
0%
1
70
1
00
%
-19
%
-31
%
Unde
rgra
duat
e Am
eric
an In
dian
/Ala
ska
Nativ
e
3
0%
1
0%
1 0%
4
0%
1 0%
-7
5%
-67%
Stud
ies
Asia
n
34
4%
40
5%
46
5%
52
5%
51
5%
-2%
50
%
Blac
k/Af
rican
Am
eric
an
227
29
%
242
28%
23
6 24
%
236
22%
23
1 22
%
-2%
2%
Hi
span
ic/L
atin
o
24
3%
31
4%
46
5%
49
4%
56
5%
14
%
133%
Na
tive
Haw
aiia
n or
Oth
er P
acifi
c Is
land
1
0%
1 0%
-
0%
2 0%
2
0%
0%
100%
No
n Re
side
nt A
lien
7
1%
5 1%
6
1%
5 0%
8
1%
60%
14
%
Two
or m
ore
race
s
21
3%
21
2%
24
2%
40
4%
37
4%
-8%
76
%
Unkn
own
84
11
%
95
11%
10
5 11
%
117
11%
10
1 10
%
-14%
20
%
Whi
te
37
9 49
%
427
49%
50
1 52
%
589
54%
56
2 54
%
-5%
48
%U
nd
erg
rad
ua
te S
tud
ies T
ota
l 7
80
1
00
%
86
3
10
0%
9
65
1
00
%
1,0
94
1
00
%
1,0
49
1
00
%
-4%
3
4%
Urba
n Af
fairs
Am
eric
an In
dian
/Ala
ska
Nativ
e
1
0%
-
0%
- 0%
-
0%
1 0%
-
0%
Asia
n
2 1%
2
1%
3 1%
2
0%
3 1%
50
%
50%
Bl
ack/
Afric
an A
mer
ican
1
04
32%
10
9 34
%
117
30%
12
6 30
%
119
29%
-6
%
14%
Hi
span
ic/L
atin
o
11
3%
7
2%
18
5%
26
6%
27
7%
4%
145%
Na
tive
Haw
aiia
n or
Oth
er P
acifi
c Is
land
-
0%
- 0%
1
0%
- 0%
-
0%
- -
No
n Re
side
nt A
lien
4
1%
7 2%
8
2%
11
3%
11
3%
0%
175%
Tw
o or
mor
e ra
ces
3
1%
3 1%
8
2%
11
3%
9 2%
-1
8%
200%
Un
know
n
16
5%
13
4%
9 2%
4
1%
3 1%
-2
5%
-81%
W
hite
186
57%
18
3 56
%
223
58%
24
2 57
%
237
58%
-2
%
27%
Urb
an
Aff
air
s T
ota
l 3
27
1
00
%
32
4
10
0%
3
87
1
00
%
42
2
10
0%
4
10
1
00
%
-3%
2
5%
Gra
nd
Tota
l
12
,03
9
1
2,3
59
12
,21
8
1
2,4
46
12
,43
4
0
%
3%
cont
inue
d fro
m p
revio
us p
age

59Section 3 - Enrollment Characteristics of Students in CSU Colleges
SEC
TIO
N
3
Tabl
e 3.
23:
CSU
Gra
duat
e &
Law
Fal
l Enr
ollm
ent
by C
olle
ge &
Eth
nici
ty: 5
-Yea
r Tre
nd
2
012
2013
2014
20
15
2
01
6
Perc
en
t C
ha
ng
e
Colleg
e
Ra
ce
En
roll
men
t
%
En
roll
men
t
%
En
roll
men
t
%
En
rollm
en
t
%
En
rollm
en
t
%
1 y
ea
r
5
yea
r
Busi
ness
Am
eric
an In
dian
/Ala
ska
Nativ
e
3
0%
3
0%
1 0%
-
0%
1 0%
-
-67%
As
ian
56
4%
60
4%
63
5%
52
6%
44
5%
-1
5%
-21%
Bl
ack/
Afric
an A
mer
ican
1
48
11%
13
5 10
%
137
11%
11
8 13
%
93
11%
-2
1%
-37%
Hi
span
ic/L
atin
o
36
3%
34
3%
32
3%
29
3%
29
3%
0%
-1
9%
Nativ
e Ha
wai
ian
or O
ther
Pac
ifi c
Isla
nd
-
0%
- 0%
-
0%
- 0%
1
0%
- -
No
n Re
side
nt A
lien
26
6 19
%
303
22%
26
4 22
%
154
17%
16
4 19
%
6%
-38%
Tw
o or
mor
e ra
ces
8
1%
16
1%
17
1%
14
2%
11
1%
-21%
38
%
Unkn
own
61
4%
32
2%
31
3%
21
2%
16
2%
-2
4%
-74%
W
hite
818
59%
77
7 57
%
658
55%
54
3 58
%
506
58%
-7
%
-38%
Bu
sin
ess T
ota
l
1,3
96
1
00
%
1,3
60
1
00
%
1,2
03
1
00
%
93
1
10
0%
8
65
1
00
%
-7%
-3
8%
CLAS
S Am
eric
an In
dian
/Ala
ska
Nativ
e
-
0%
1
0%
1 0%
-
0%
- 0%
-
-
Asia
n
5 1%
8
1%
6 1%
4
1%
5 1%
25
%
0%
Blac
k/Af
rican
Am
eric
an
143
24
%
162
30%
16
3 30
%
134
28%
11
4 26
%
-15%
-2
0%
Hisp
anic
/Lat
ino
18
3%
22
4%
23
4%
25
5%
18
4%
-28%
0%
No
n Re
side
nt A
lien
18
3%
16
3%
21
4%
25
5%
20
5%
-2
0%
11%
Tw
o or
mor
e ra
ces
8
1%
5 1%
13
2%
11
2%
16
4%
45
%
100%
Un
know
n
43
7%
24
4%
14
3%
5 1%
6
1%
20%
-8
6%
Whi
te
36
1 61
%
311
57%
29
6 55
%
277
58%
25
8 59
%
-7%
-2
9%C
LA
SS
Tota
l
5
96
1
00
%
54
9
10
0%
5
37
1
00
%
48
1
10
0%
4
37
1
00
%
-9%
-2
7%
Educ
atio
n Am
eric
an In
dian
/Ala
ska
Nativ
e
-
0%
-
0%
2 0%
1
0%
2 0%
10
0%
-
Asia
n
14
1%
13
1%
15
1%
11
1%
8 1%
-2
7%
-43%
Bl
ack/
Afric
an A
mer
ican
3
19
23%
30
7 23
%
315
25%
31
3 27
%
272
25%
-1
3%
-15%
Hi
span
ic/L
atin
o
34
2%
36
3%
38
3%
39
3%
48
4%
23
%
41%
Na
tive
Haw
aiia
n or
Oth
er P
acifi
c Is
land
1
0%
1 0%
2
0%
2 0%
1
0%
-50%
0%
No
n Re
side
nt A
lien
53
4%
76
6%
87
7%
92
8%
65
6%
-2
9%
23%
Tw
o or
mor
e ra
ces
13
1%
18
1%
18
1%
21
2%
20
2%
-5
%
54%
Un
know
n
106
8%
57
4%
45
4%
25
2%
10
1%
-60%
-9
1%
Whi
te
82
9 61
%
847
63%
72
7 58
%
637
56%
66
1 61
%
4%
-20%
Ed
uca
tion
Tota
l
1
,36
9
10
0%
1
,35
5
10
0%
1
,24
9
10
0%
1
,14
1
10
0%
1
,08
7
10
0%
-5
%
-21
%
cont
inue
d on
nex
t pag
e

Cleveland State University / 2017 Book of Trends60
Tabl
e 3.
23:
CSU
Gra
duat
e &
Law
Fal
l Enr
ollm
ent
by C
olle
ge &
Eth
nici
ty: 5
-Yea
r Tre
nd
2012
2013
2014
20
15
2
01
6
Perc
en
t C
ha
ng
e
Colleg
e
Ra
ce
En
roll
men
t
%
En
roll
men
t
%
En
roll
men
t
%
En
rollm
en
t
%
En
rollm
en
t
%
1 y
ea
r
5
yea
r
Engi
neer
ing
Amer
ican
Indi
an/A
lask
a Na
tive
1
0%
- 0%
-
0%
- 0%
-
0%
- -1
00%
As
ian
19
5%
18
4%
13
2%
17
2%
19
3%
12
%
0%
Blac
k/Af
rican
Am
eric
an
11
3%
16
4%
15
3%
13
2%
13
2%
0%
18
%
Hisp
anic
/Lat
ino
8 2%
5
1%
7 1%
3
0%
5 1%
67
%
-38%
Na
tive
Haw
aiia
n or
Oth
er P
acifi
c Is
land
1
0%
- 0%
-
0%
- 0%
-
0%
- -1
00%
No
n Re
side
nt A
lien
19
2 48
%
246
54%
34
6 62
%
502
70%
45
3 69
%
-10%
13
6%
Two
or m
ore
race
s
- 0%
3
1%
5 1%
4
1%
1 0%
-7
5%
-
Unkn
own
22
5%
19
4%
15
3%
12
2%
8
1%
-33%
-6
4%
Whi
te
14
9 37
%
149
33%
15
8 28
%
167
23%
15
6 24
%
-7%
5%
En
gin
eeri
ng
Tota
l
40
3
10
0%
4
56
1
00
%
55
9
10
0%
71
8
10
0%
6
55
1
00
%
-9%
6
3%
Grad
uate
As
ian
2
11%
4
14%
1
4%
- 0%
2
8%
- 0%
Stud
ies
Blac
k/Af
rican
Am
eric
an
2
11%
2
7%
1 4%
3
13%
1
4%
-67%
-5
0%
Non
Resi
dent
Alie
n
- 0%
1
4%
1 4%
1
4%
1 4%
0%
-
Tw
o or
mor
e ra
ces
1
5%
- 0%
-
0%
- 0%
-
0%
- -1
00%
Un
know
n
1 5%
14
50
%
15
63%
17
74
%
20
83%
18
%
1900
%
Whi
te
13
68
%
7 25
%
6 25
%
2 9%
-
0%
-100
%
-100
%G
rad
ua
te S
tud
ies T
ota
l
19
1
00
%
28
1
00
%
24
1
00
%
23
1
00
%
24
1
00
%
4%
2
6%
Law
Am
eric
an In
dian
/Ala
ska
Nativ
e
1
0%
3
1%
2 0%
2
0%
- 0%
-1
00%
-1
00%
As
ian
12
2%
14
3%
8
2%
10
2%
10
3%
0%
-17%
Bl
ack/
Afric
an A
mer
ican
40
8%
41
9%
36
8%
40
9%
40
10%
0%
0%
Hi
span
ic/L
atin
o
20
4%
21
4%
16
4%
21
5%
17
4%
-1
9%
-15%
No
n Re
side
nt A
lien
7
1%
9 2%
9
2%
6 1%
4
1%
-33%
-4
3%
Two
or m
ore
race
s
5 1%
8
2%
8 2%
10
2%
8
2%
-20%
60
%
Unkn
own
9
2%
11
2%
13
3%
16
4%
14
4%
-13%
56
%
Whi
te
40
7 81
%
362
77%
35
0 79
%
323
75%
28
8 76
%
-11%
-2
9%La
w T
ota
l
5
01
1
00
%
46
9
10
0%
4
42
1
00
%
42
8
10
0%
3
81
1
00
%
-11
%
-24
%
cont
inue
d fro
m p
revio
us p
age
cont
inue
d on
nex
t pag
e

61Section 3 - Enrollment Characteristics of Students in CSU Colleges
SEC
TIO
N
3
Tabl
e 3.
23:
CSU
Gra
duat
e &
Law
Fal
l Enr
ollm
ent
by C
olle
ge &
Eth
nici
ty: 5
-Yea
r Tre
nd
2012
2013
2014
20
15
2
01
6
Perc
en
t C
ha
ng
e
Co
lleg
e
Ra
ce
En
roll
men
t
%
En
roll
men
t
%
En
roll
men
t
%
En
rollm
en
t
%
En
rollm
en
t
%
1 y
ea
r
5
yea
r
Nurs
ing
Asia
n
1 2%
1
2%
2 4%
1
2%
1 2%
0%
0%
Bl
ack/
Afric
an A
mer
ican
9 16
%
9 16
%
11
22%
12
24
%
14
25%
17
%
56%
Hi
span
ic/L
atin
o
2
3%
3 5%
2
4%
1 2%
3
5%
200%
50
%
Non
Resi
dent
Alie
n
1 2%
1
2%
- 0%
-
0%
- 0%
-
-100
%
Two
or m
ore
race
s
1 2%
1
2%
1 2%
-
0%
- 0%
-
-100
%
Unkn
own
5
9%
3 5%
-
0%
- 0%
1
2%
- -8
0%
Whi
te
39
67
%
37
67%
35
69
%
36
72%
36
65
%
0%
-8%
Nu
rsin
g T
ota
l
58
1
00
%
55
1
00
%
51
1
00
%
50
1
00
%
55
1
00
%
10
%
-5%
Scie
nce
Amer
ican
Indi
an/A
lask
a Na
tive
-
0%
- 0%
2
0%
1 0%
1
0%
0%
-
Asia
n
28
3%
24
3%
24
3%
24
3%
21
3%
-13%
-2
5%
Blac
k/Af
rican
Am
eric
an
56
7%
46
5%
47
6%
56
7%
55
7%
-2
%
-2%
Hi
span
ic/L
atin
o
12
1%
11
1%
15
2%
24
3%
31
4%
29
%
158%
Na
tive
Haw
aiia
n or
Oth
er P
acifi
c Is
land
1
0%
- 0%
-
0%
- 0%
-
0%
- -1
00%
No
n Re
side
nt A
lien
13
9 16
%
142
17%
12
3 15
%
107
13%
98
12
%
-8%
-2
9%
Two
or m
ore
race
s
6 1%
6
1%
6 1%
8
1%
10
1%
25%
67
%
Unkn
own
38
4%
23
3%
16
2%
14
2%
12
1%
-1
4%
-68%
W
hite
571
67%
59
5 70
%
610
72%
58
6 71
%
596
72%
2%
4%
Scie
nce T
ota
l
85
1
10
0%
8
47
1
00
%
84
3
10
0%
8
20
1
00
%
82
4
10
0%
0
%
-3%
Urba
n Af
fairs
Am
eric
an In
dian
/Ala
ska
Nativ
e
- 0%
-
0%
- 0%
1
0%
- 0%
-1
00%
-
As
ian
3
1%
5 2%
4
2%
4 2%
2
1%
-50%
-3
3%
Blac
k/Af
rican
Am
eric
an
57
19
%
54
21%
39
18
%
52
23%
35
18
%
-33%
-3
9%
Hisp
anic
/Lat
ino
7 2%
9
4%
10
5%
8 3%
9
5%
13%
29
%
Non
Resi
dent
Alie
n
27
9%
19
8%
16
7%
14
6%
14
7%
0%
-48%
Tw
o or
mor
e ra
ces
4
1%
7 3%
3
1%
3 1%
5
3%
67%
25
%
Unkn
own
17
6%
6
2%
7 3%
3
1%
- 0%
-1
00%
-1
00%
W
hite
178
61%
15
2 60
%
140
64%
14
6 63
%
132
67%
-1
0%
-26%
Urb
an
Aff
air
s T
ota
l 2
93
1
00
%
25
2
10
0%
2
19
1
00
%
231
1
00
%
19
7
10
0%
-1
5%
-3
3%
Gra
nd
Tota
l
5,4
86
5,3
71
5,1
27
4,8
23
4,5
25
-6%
-1
8%
cont
inue
d fro
m p
revio
us p
age

Cleveland State University / 2017 Book of Trends62
Table 3.24: Undergraduate Fall Enrollment by College & Load: 5-Year Trend Undergraduate Full-Time
Percent Change
College 2012 2013 2014 2015 2016 1 Year 5 Year
Business 1,313 1,340 1,648 1,593 1,704 7% 30%CLASS 2,454 2,529 2,079 1,924 1,929 0% -21%Education 634 646 553 566 467 -17% -26%Engineering 930 1,045 1,136 1,472 1,570 7% 69%Nursing 467 502 458 457 497 9% 6%Other - - 1 - - -- --Science 2,218 2,332 2,165 2,266 2,228 -2% 0%Undergraduate Non-Degree 24 14 16 24 11 -54% -54%Undergraduate Studies 353 383 412 612 602 -2% 71%Urban Affairs 197 209 206 221 213 -4% 8%Full-Time Total 8,590 9,000 8,674 9,135 9,221 1% 7%
Undergraduate Part-Time
Percent Change
College 2012 2013 2014 2015 2016 1 Year 5 Year
Business 660 601 597 485 477 -2% -28%CLASS 681 613 636 574 563 -2% -17%Education 263 258 250 245 216 -12% -18%Engineering 236 270 253 337 324 -4% 37%Nursing 67 71 91 82 104 27% 55%Other 106 83 150 117 66 -44% -38%Science 658 662 679 603 660 9% 0%Undergraduate Non-Degree 221 206 154 185 159 -14% -28%Undergraduate Studies 427 480 553 482 447 -7% 5%Urban Affairs 130 115 181 201 197 -2% 52%Part-Time Total 3,449 3,359 3,544 3,311 3,213 -3% -7%

63Section 3 - Enrollment Characteristics of Students in CSU Colleges
SEC
TIO
N
3
Table 3.25: Graduate & Law Fall Enrollment by College & Load: 5-Year Trend Graduate & Law Full-Time
Percent Change
College 2012 2013 2014 2015 2016 1 Year 5 Year
Business 457 444 400 314 339 8% -26%CLASS 237 227 267 266 243 -9% 3%Education 241 290 241 307 262 -15% 9%Engineering 74 78 131 479 389 -19% 426%Graduate Studies 4 - - - 1 -- --Law 350 308 288 247 241 -2% -31%Nursing 19 20 12 7 12 71% -37%Science 436 408 442 595 583 -2% 34%Urban Affairs 58 52 37 54 51 -6% -12%Full-Time Total 1,876 1,827 1,818 2,269 2,121 -7% 13%
Graduate & Law Part-Time
Percent Change
College 2012 2013 2014 2015 2016 1 Year 5 Year
Business 939 916 803 617 526 -15% -44%CLASS 359 322 270 215 194 -10% -46%Education 1,128 1,065 1,008 834 825 -1% -27%Engineering 329 378 428 239 266 11% -19%Graduate Studies 15 28 24 23 23 0% 53%Law 151 161 154 181 140 -23% -7%Nursing 39 35 39 43 43 0% 10%Science 415 439 401 225 241 7% -42%Urban Affairs 235 200 182 177 146 -18% -38%Part-Time Total 3,610 3,544 3,309 2,554 2,404 -6% -33%

Cleveland State University / 2017 Book of Trends64
West CenterThe opening of Cleveland State University West Center (Westlake) in August 2003 established a suburban presence for
the University’s thriving downtown campus. The mission of the centers is dedicated to serving all students and offering
the highest level of customer service. Academic offerings include programs for educators (teachers and administrators),
business and public service professionals seeking to complete their university degree, and traditional college-age students
and high school students in post-secondary educational option programs.
Table 3.26: West Center Student Credit Hours: Fall Semesters
West Center
Undergraduate Graduate/Law Total
College 2012 2013 2014 2015 2016 2012 2013 2014 2015 2016 2012 2013 2014 2015 2016
Business 272 - - - - 131 - 222 107 - 403 - 222 107 -Education - - - - - 204 194 157 60 63 204 194 157 60 63Science 112 - - 15 - - - - - 93 112 - - 15 93Law - - - - - - - - - 51 - - - - 51Grand Total 384 - - 15 - 335 194 379 167 207 719 194 379 182 207
Table 3.26a: Annual West Center Historical Enrollment and SCH Trends
West Center
Enrollment Percent Change SCH Percent Change
College 2012-13 2013-14 2014-15 2015-16 2016-17 1-Year 5-Year 2012-13 2013-14 2014-15 2015-16 2016-17 1-Year 5-Year
Summer 173 137 13 30 22 -27% -87% 540 476 46 101 66 -35% -88%Fall 170 42 99 57 52 -9% -69% 719 194 379 182 207 14% -71%Spring 188 58 175 80 46 -43% -76% 694 221 566 234 208 -11% -70%Grand Total 531 237 287 167 120 -28% -77% 1953 891 991 517 481 -7% -75%
Figure 3.26a: Annual West Center Historical Enrollment and SCH Trends
2012-13 2013-14 2014-15 2015-16 2016-17 2012-13 2013-14 2014-15 2015-16 2016-17

65Section 3 - Enrollment Characteristics of Students in CSU Colleges
SEC
TIO
N
3
Table 3.27a: Annual Historical Enrollment and SCH Trends at Lorain County Community College Lorain County Community College
Enrollment Percent Change SCH Percent Change
Term 2012-13 2013-14 2014-15 2015-16 2016-17 1-Year 5-Year 2012-13 2013-14 2014-15 2015-16 2016-17 1-Year 5-Year
Summer 9 3 8 10 7 -30% -22% 36 12 32 30 21 -30% -42%Fall 65 82 71 65 64 -2% -2% 332 424 336 327 321 -2% -3%Spring 88 84 86 76 69 -9% -22% 487 461 387 357 366 3% -25%Grand Total 162 169 165 151 140 -7% -14% 855 897 755 714 708 -1% -17%
Figure 3.27a: Annual Lorain County Community College Historical Enrollment and SCH Trends
2012-13 2013-14 2014-15 2015-16 2016-17 2012-13 2013-14 2014-15 2015-16 2016-17

Cleveland State University / 2017 Book of Trends66
Table 3.27b: Annual Historical Enrollment and SCH Trends at Lakeland Community College
Lakeland Community College
Enrollment Percent Change SCH Percent Change
Term 2012-13 2013-14 2014-15 2015-16 2016-17 1-Year 5-Year 2012-13 2013-14 2014-15 2015-16 2016-17 1-Year 5-Year
Summer 29 61 68 7 3 -57% -90% 91 228 251 21 9 -57% -90%Fall 92 90 77 93 65 -30% -29% 447 466 391 374 306 -18% -32%Spring 112 118 98 94 69 -27% -38% 500 673 424 355 312 -12% -38%Grand Total 233 269 243 194 137 -29% -41% 1,038 1,367 1,066 750 627 -16% -40%
Partnerships with Lakeland Community College and Lorain County Community College The partnerships foster direct collaboration with community colleges to offer degree programs on the community college
campus in addition to easy transfer through dual admission and various articulation agreements. All locations have grown
in popularity as transfer students recognize the value and convenience of gaining an associate’s degree and a degree from
CSU. Liaison with these community colleges has been well planned and highly successful due to a shared passion for
educating students.
Figure 3.27b: Annual Lakeland Community College Historical Enrollment and SCH Trends
2012-13 2013-14 2014-15 2015-16 2016-17 2012-13 2013-14 2014-15 2015-16 2016-17

67Section 3 - Enrollment Characteristics of Students in CSU Colleges
SEC
TIO
N
3
Table 3.27c: Annual Historical Enrollment and SCH Trends at Other Off-Campus Locations
Other Locations*
Enrollment Percent Change SCH Percent Change
Term 2012-13 2013-14 2014-15 2015-16 2016-17 1-Year 5-Year 2012-13 2013-14 2014-15 2015-16 2016-17 1-Year 5-Year
Summer 165 259 163 113 74 -35% -55% 1,008 1,400 1,106 443 182 -59% -82%Fall 832 691 307 232 254 9% -69% 4,018 3,557 1,326 982 934 -5% -77%Spring 630 799 320 261 304 16% -52% 2,510 4,215 1,371 1,068 1,441 35% -43%Grand Total 1,627 1,749 790 606 632 4% -61% 7,536 9,172 3,803 2,493 2,557 3% -66%
Note: Student is counted once even if attending multiple off-campus locations
Figure 3.27c: Annual Other Off-Campus Locations Historical Enrollment and SCH Trend
*Other Off-Campus Locations include all off campus locations except East, West, Lorain and Lakeland.
2012-13 2013-14 2014-15 2015-16 2016-17 2012-13 2013-14 2014-15 2015-16 2016-17

Cleveland State University / 2017 Book of Trends68

SEC
TIO
N
4
Sponsored Research
4Book of Trends

Cleveland State University / 2017 Book of Trends70

71Section 4 - Sponsored Programs and Research
SEC
TIO
N
4
Fiscal Year Percent Change
Source FY 2011 FY 2012 FY 2013 FY 2014 FY 2015 FT 2016 1 Year 5 Year
Awards $17,093,917 $13,483,748 $12,047,738 $12,900,819 $9,655,599 $24,676,110 156% 44% CSU Expenditures $16,913,731 $20,617,912 $16,707,432 $22,027,038 $13,456,328 $12,786,385 -5% -24% CCF Expenditures $43,642,969 $44,925,258 $51,124,607 $44,570,226 $43,877,270 $51,360,079 17% 18% CSU & CCF Exp Total $60,556,700 $65,543,170 $67,832,039 $66,597,264 $57,333,598 $64,146,464 12% -6%
Sponsored Programs and Research at Cleveland State UniversityThe University is committed to enhancing the research environment in support of its faculty and students. As such, efforts are underway to expand
the research services currently offered to assist those seeking external funding for research, scholarship, and creative projects. Cleveland State
University established a new offi ce, Sponsored Programs & Research Services (SPRS). By merging Grants Accounting of the Controller’s Offi ce
and the Offi ce of Sponsored Programs we are now able to serve faculty as a “one-stop-shop” SPRS is headed by the Vice President for Research,
who is responsible for raising the research profi le at Cleveland State University and for establishing the University as a recognized contributor to the
local, regional, national and global research priorities. The creation of this expanding offi ce will enable the University to achieve its mission, in which
scholarship and research are held as major tenets.
Bringing discoveries from the laboratory to the classroom and to the world is a long and very expensive undertaking, one that is at the heart of what
a university should do and do well. While Cleveland State is a “young” institution, it has committed itself to discovery and to becoming a research-
focused university. And, while we are still in the early phases of that steep research incline, CSU has much to show for its initial efforts - efforts that
presage a promising future.
It is important to note that the sponsored program proposals and awards that are described by the numbers and charts to follow would not have
been possible without the drive, dedication and intellect of the University’s talented and diverse faculty and the contributions of graduate students
and postdocs.
Table 4.1: Sponsored Program Awards and Expenditures, Fiscal Years 2011-2016
Figure 4.1: Sponsored Program Awards and Expenditures, Fiscal Years 2011-2016
Notes:1 The Total Award amount for FY 2010 & forward differs from that listed in the Monthly Activity Reports previously published by SPRS (http://www.csuohio.edu/offi ces/spr/monthlyactivityreports/index.html)
for two reasons: 1) the reports in the Book of Trends include State Appropriations as a separate line-item while the Monthly Activity Reports do not. The amount stated here is higher because not all State
Appropriation funding has been allocated to a Sponsored Program account. 2) The Award amount in the Monthly Activity Report for FY 2010 and the Award Amount numbers published in the Book of Trends
for previous years were based on the Award amount received during that period for each project. For FY 2010 and forward, the Total Project Award Amount is reported. 2 From FY 2010 forward, CSU is including research expenditures from the Lerner Research Institute (LRI) at the Cleveland Clinic Foundation. These expenditures are only for those grants held by LRI faculty
who engage with Cleveland State University students.
FY 2011 FY 2012 FY 2013 FY 2014 FY 2015 FY 2016
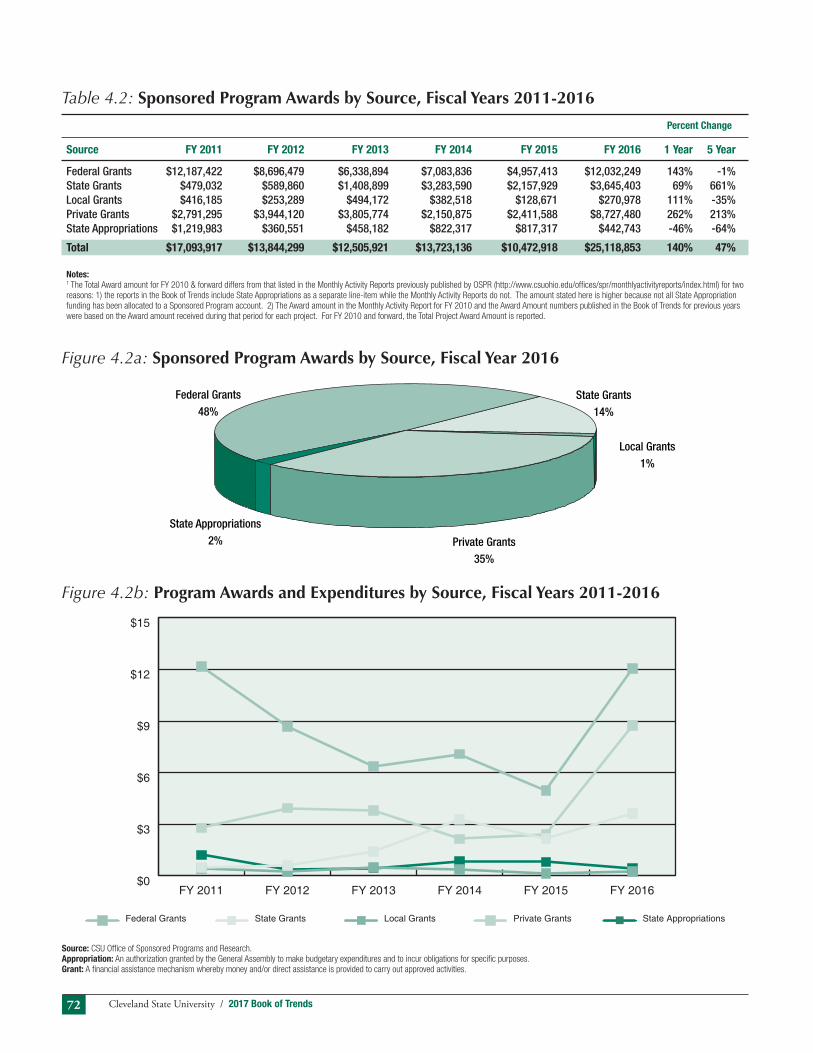
Cleveland State University / 2017 Book of Trends72
Table 4.2: Sponsored Program Awards by Source, Fiscal Years 2011-2016
Figure 4.2a: Sponsored Program Awards by Source, Fiscal Year 2016
Percent Change
Source FY 2011 FY 2012 FY 2013 FY 2014 FY 2015 FY 2016 1 Year 5 Year
Federal Grants $12,187,422 $8,696,479 $6,338,894 $7,083,836 $4,957,413 $12,032,249 143% -1%State Grants $479,032 $589,860 $1,408,899 $3,283,590 $2,157,929 $3,645,403 69% 661%Local Grants $416,185 $253,289 $494,172 $382,518 $128,671 $270,978 111% -35%Private Grants $2,791,295 $3,944,120 $3,805,774 $2,150,875 $2,411,588 $8,727,480 262% 213%State Appropriations $1,219,983 $360,551 $458,182 $822,317 $817,317 $442,743 -46% -64%
Total $17,093,917 $13,844,299 $12,505,921 $13,723,136 $10,472,918 $25,118,853 140% 47%
Notes:1 The Total Award amount for FY 2010 & forward differs from that listed in the Monthly Activity Reports previously published by OSPR (http://www.csuohio.edu/offi ces/spr/monthlyactivityreports/index.html) for two
reasons: 1) the reports in the Book of Trends include State Appropriations as a separate line-item while the Monthly Activity Reports do not. The amount stated here is higher because not all State Appropriation
funding has been allocated to a Sponsored Program account. 2) The Award amount in the Monthly Activity Report for FY 2010 and the Award Amount numbers published in the Book of Trends for previous years
were based on the Award amount received during that period for each project. For FY 2010 and forward, the Total Project Award Amount is reported.
Figure 4.2b: Program Awards and Expenditures by Source, Fiscal Years 2011-2016
Source: CSU Offi ce of Sponsored Programs and Research.
Appropriation: An authorization granted by the General Assembly to make budgetary expenditures and to incur obligations for specifi c purposes.
Grant: A fi nancial assistance mechanism whereby money and/or direct assistance is provided to carry out approved activities.
Federal Grants48%
State Appropriations2% Private Grants
35%
Local Grants1%
State Grants14%
$0
$3
$6
$9
$12
$15
State AppropriationsPrivate GrantsLocal GrantsState GrantsFederal Grants
FY 2016FY 2015FY 2014FY 2013FY 2012FY 2011

73Section 4 - Sponsored Programs and Research
SEC
TIO
N
4
Table 4.3: Sponsored Program Expenditures by Source, Fiscal Years 2011-2016
Figure 4.3a: Sponsored Program Expenditures by Source, Fiscal Year 2016
Source: CSU Offi ce of Sponsored Programs and Research
Source: CSU Offi ce of Sponsored Programs and Research.
Appropriation: An authorization granted by the General Assembly to make budgetary expenditures and to incur obligations for specifi c purposes.
Grant: A fi nancial assistance mechanism whereby money and/or direct assistance is provided to carry out approved activities.
Figure 4.3b: Sponsored Program Expenditures by Source, Fiscal Years 2011-2016
Percent Change
Source FY 2011 FY 2012 FY 2013 FY 2014 FY 2015 FY 2016 1 Year 5 Year
Federal Grants $8,875,304 $10,128,616 $8,956,841 $7,665,390 $6,904,644 $6,657,880 -4% -34%State Grants $4,837,728 $6,807,950 $4,838,751 $10,593,078 $2,846,101 $2,731,114 -4% -60%Local Grants $536,053 $514,801 $463,756 $515,601 $297,326 $265,261 -11% -48%Private Grants $2,105,142 $2,648,247 $2,227,770 $3,171,219 $3,394,620 $3,132,130 -8% 18%State Appropriations $559,504 $518,299 $220,314 $81,750 $13,638 $0 -100% -100%LRI-CCF Expenditures $43,642,969 $44,925,258 $51,124,607 $44,570,226 $43,877,270 $51,360,079 17% 14%
Total $60,556,700 $65,543,171 $67,832,038 $66,597,264 $66,597,264 $64,146,464 -4% 6%
Notes:
The fi gures below only detail Cleveland State University expenditures.
Federal Grants52%
Private Grants25%
Local Grants2%
State Grants21%
$0
$2
$4
$6
$8
$10
$12
State AppropriationsPrivate GrantsLocal GrantsState GrantsFederal Grants
FY 2016FY 2015FY 2014FY 2013FY 2012FY 2011

Cleveland State University / 2017 Book of Trends74
National Science Foundation Rankings of Cleveland State University and Other Selected SchoolsThe NSF rankings are widely recognized as a valuable benchmark in comparing the level of research taking place at institutions across the country.
The fi rst table (4.4) below compares Cleveland State with other Northern Ohio institutions, while Table 4.5a shows other institutions ranked similarly
to Cleveland State. In addition to seeking and receiving funding for research and development, the University places a heavy emphasis on graduate
education and involving those students in the research laboratory.
2015 (Dollars in Thousands)
Institution Ranking 2010 2011 2012 2013 2014 2015
University of Akron 177 $52,884 $65,536 $66,413 $69,640 $69,528 $58,512
University of Toledo 190 $70,399 $74,149 $68,228 $69,072 $61,900 $52,354
Cleveland State University 182 $34,235 $55,502 $61,111 $67,378 $61,783 $57,662
Kent State University 214 $26,331 $27,455 $26,507 $23,149 $25,666 $38,069
Bowling Green State University 345 $8,124 $8,999 $8,566 $13,157 $8,861 $7,995
Youngstown State University 438 $4,523 $4,732 $3,598 $3,785 $3,464 $3,348
Source: Data retrieved from the National Science Foundation website on June 30, 2016 at the following link: https://ncsesdata.nsf.gov/herd/2014/html/HERD2014_DST_17.html
Table 4.4: National Science Foundation Ranking of Research and Development Expenditures,Fiscal Years 2010-2015

75Section 4 - Sponsored Programs and Research
SEC
TIO
N
4
Indirect Cost RecoveryIndirect cost recovery is defi ned as the agreed upon revenue received from a sponsoring agency to pay a grant or contract’s share to reimburse the
university for the indirect costs it incurs. Indirect costs are real costs. Indirect cost calculations are based upon such items as space, utilities, security,
maintenance, custodial, payroll, purchasing, accounting, personnel and many other expenses associated with project administration and implementation.
A portion of indirect costs recovered at Cleveland State University (CSU) become part of the general fund budget for the entire university.
40% of all indirect costs returned on sponsored programs remain in the university’s general fund. This money is set aside for covering administrative
expenses for sponsored program administration. It is also used to cover costs of facilities, depreciation on buildings and equipment, operation and
maintenance of facilities, and library expenses. The other half of the indirect costs recovered are distributed as follows: 10% to project director, 10% to
project director’s department, 10% to relevant dean’s offi ce, and 30% to the Vice President for Research & Graduate Studies.
Table 4.5: Indirect Cost (IDC) Recovery and Total Sponsored Program Expenditures by Year, Fiscal Years 2011-2016
Percent Change
Research Activities FY 2011 FY 2012 FY 2013 FY 2014 FY 2015 FY 2016 1 Year 5 Year
Direct Sponsored Program $15,351,047 $18,844,807 $15,197,977 $20,518,525 $11,913,435 $11,064,618 -7% -28%Expenditures
Indirect Cost Recovered $1,562,684 $1,773,105 $1,509,455 $1,508,513 $1,542,893 $1,721,767 12% 10%
Total Sponsored Program Expenditures $16,913,731 $20,617,912 $16,707,432 $22,027,038 $13,456,328 $12,786,385 -5% -24%
% IDC of Direct Research Expenditures1 10% 9% 10% 7% 13% 16%
Notes: 1 The % IDC is calculated by dividing the actual indirect cost recovered by the actual direct expenditures for each year.
Source: CSU Offi ce of Sponsored Programs and Research
2013 2014 2015
Institution Ranking Institution Ranking Institution Ranking
University of North Dakota 171 Georgia Regents University 173 Colorado School of Mines 179
University of Tennessee, Agric. Institute 172 American University 174 American University 180
University of California, President’s Offi ce 173 University of Toledo 175 University of Alabama, Tuscaloosa 181
Cleveland State University 174 Cleveland State University 176 Cleveland State University 182
University of Wyoming 175 University of Massachusetts, Boston 177 So. Illinois University, Carbondale 183
Georgia Regents University 176 Ohio University 178 University of Wyoming 184
South Dakota State University 177 University of Wisconsin, Milwaukee 179 Indiana University - Purdue 185 University, Indianapolis
Table 4.5a: National Science Foundation Ranking of Research Results, Fiscal Years 2013-2015
Source: Data retrieved from the National Science Foundation website on August 8, 2017 at the following link:
https://ncsesdata.nsf.gov/profi les/site?method=rankingBySource&ds=herd

Cleveland State University / 2017 Book of Trends76
Proposal Submission and Success Rates for Externally Funded ProgramsThe three sections of Table 4.6 below show the Success Rates for Awards broken down by sponsor type.
Table 4.6: Proposals Submitted and Awards Received by Source, Fiscal Years 2010-2016
Source Proposals Submitted FY 2010 FY 2011 FY 2012 FY 2013 FY 2014 FY 2015 FY 2016
Government Sources Federal 128 141 128 107 120 145 136 State 25 20 21 21 25 34 35 Local 24 13 14 9 16 12 12Total Government Sources 177 174 163 137 161 191 183
Non-Government Sources Corporate Contracts 8 10 13 7 9 12 7 Foundation and Non-Profi t 71 58 81 62 73 79 78Total Non-Government Sources 79 68 94 69 82 91 85
Sponsored Programs Total 256 242 257 206 243 282 268
Source Awards Received FY 2010 FY 2011 FY 2012 FY 2013 FY 2014 FY 2015 FY 2016
Government Sources Federal 57 45 48 49 29 35 53 State 25 19 20 14 24 12 24 Local 17 14 11 8 13 10 10Total Government Sources 99 78 79 71 66 57 87
Non-Government Sources Corporate Contracts 5 5 8 10 4 3 5 Foundation and Non-Profi t 55 48 62 51 37 64 58Total Non-Government Sources 60 53 70 61 41 67 63
Sponsored Programs Total 159 131 149 132 107 124 150
Source Success Rate* FY 2010 FY 2011 FY 2012 FY 2013 FY 2014 FY 2015 FY 2016
Government Sources Federal 37% 35% 34% 38% 27% 29% 37% State 66% 76% 100% 67% 114% 48% 71% Local 113% 58% 85% 57% 144% 63% 83%Total Government Sources 48% 44% 45% 44% 48% 35% 46%
Non-Government Sources Corporate Contracts 45% 63% 80% 77% 57% 33% 42% Foundation and Non-Profi t 59% 68% 107% 63% 60% 88% 73%Total Non-Government Sources 58% 67% 103% 65% 59% 82% 69%
Sponsored Programs Total 51% 51% 62% 51% 52% 51% 53%
Source: CSU Offi ce of Sponsored Programs and Research
* * The success rate for each year is calculated by dividing the Awards Received for that year by the Proposals Submitted during the immediately preceding year. Although it is reasonable to assume that most
Awards are based on Proposals submitted during the immediately preceding year, this can create instances where the Success Rate exceeds 100%. This is because some of those years’ awards are based on
Proposals submitted during both the prior and current year.

77Section 4 - Sponsored Programs and Research
SEC
TIO
N
4
Table 4.7: Proposals Submitted and Awards Received by College or Division, Fiscal Years 2011-2016
Table 4.7a: Fiscal Year 2016 Proposals Submitted by College
Fiscal Year
Proposals and Grant Awards FY 2011 FY 2012 FY 2013 FY 2014 FY 2015 FY 2016
Proposals Submitted 242 257 206 243 282 268Awards Received 131 149 132 107 124 150
Success Rate 51% 62% 51% 52% 51% 53%
Source: CSU Offi ce of Sponsored Programs and Research
Note: The Success Rate for each year is calculated by dividing the Awards Received for that year by the Proposals Submitted during the immediately preceding year.
College or Division Direct Indirect Total Count
College of Business Administration $252,000 $0 $252,000 3College of Education & Human Services $4,625,363 $1,204,602 $5,829,965 29College of Engineering $13,970,606 $4,246,805 $18,217,411 51College of Law $0 $0 $0 0College of Liberal Arts & Social Sciences $664,726 $151,896 $816,622 21School of Nursing $174,816 $9,980 $184,796 3College of Sciences & Health Professions $23,389,357 $8,929,819 $32,319,176 82College of Urban Affairs $3,231,734 $504,945 $3,736,679 55Central Administration $7,261,545 $729,751 $7,991,296 24Continuing Education $0 Undergraduate Studies $0 Fiscal Year 2016 Totals $53,570,147 $15,777,798 $69,347,945 268
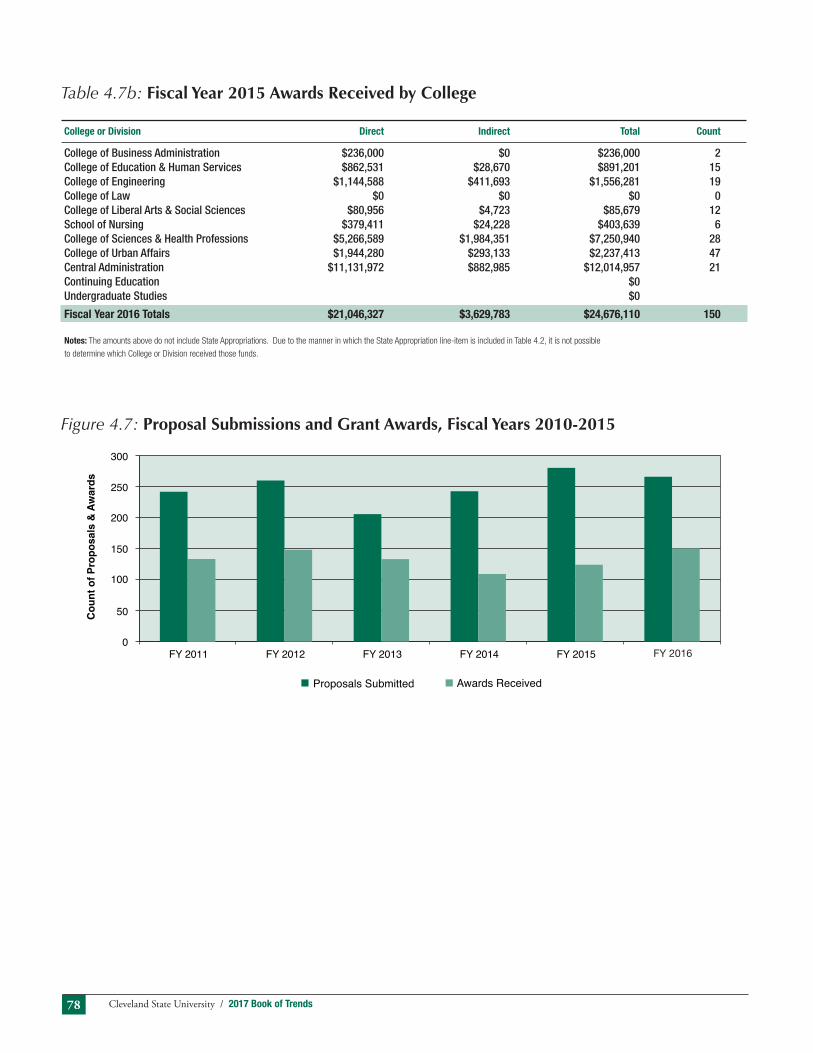
Cleveland State University / 2017 Book of Trends78
College or Division Direct Indirect Total Count
College of Business Administration $236,000 $0 $236,000 2College of Education & Human Services $862,531 $28,670 $891,201 15College of Engineering $1,144,588 $411,693 $1,556,281 19College of Law $0 $0 $0 0College of Liberal Arts & Social Sciences $80,956 $4,723 $85,679 12School of Nursing $379,411 $24,228 $403,639 6College of Sciences & Health Professions $5,266,589 $1,984,351 $7,250,940 28College of Urban Affairs $1,944,280 $293,133 $2,237,413 47Central Administration $11,131,972 $882,985 $12,014,957 21Continuing Education $0 Undergraduate Studies $0
Fiscal Year 2016 Totals $21,046,327 $3,629,783 $24,676,110 150
Table 4.7b: Fiscal Year 2015 Awards Received by College
Figure 4.7: Proposal Submissions and Grant Awards, Fiscal Years 2010-2015
Notes: The amounts above do not include State Appropriations. Due to the manner in which the State Appropriation line-item is included in Table 4.2, it is not possible
to determine which College or Division received those funds.
FY 2016

79Section 4 - Sponsored Programs and Research
SEC
TIO
N
4
Intellectual PropertyContemporary universities committed to teaching, research, service, and dissemination of knowledge increasingly fi nd themselves in a position
of having created knowledge or materials with commercial value through patents, copyrights, and/or trademarks. Creation of such knowledge
or materials, also referred to as intellectual property, is a much coveted outcome of any vibrant research program. Activities that result in the
creation of intellectual property raise the reputation of the university and involved researchers. They also create rich educational opportunities
for students participating in such programs. Universities may gain signifi cant revenue through commercialized intellectual property.
FISCAL YEAR Percent Change
Source FY 2011 FY 2012 FY 2013 FY 2014 FY 2015 FY 2016 1 Year 5 Year
Disclosures 7 3 5 10 3 11 267% 57%
Non-Provisional Patent Apps. Filed 3 6 4 3 2 3 50% 0%
Provisional Patent Applications Filed 3 1 2 7 3 8 167% 167%
Licenses Approved - 1 - 1 3 4 33% -
Source: Technology Transfer Offi ce
5 Year Percent Change is from the period 2011 to 2016.
Notes: The following defi nitions are from the US Patent and Trademark Offi ce (www.uspto.gov)
Disclosure: Description of an invention in a patent or patent application.
Patent: Granting of a property right to the inventor, issued by the United States Patent and Trademark Offi ce.
Licenses approved: The patent law provides for the transfer or sale of a patent, or of an application for a patent, by an instrument in writing. Such an instrument is referred to as an assignment of license.
Table 4.8: Intellectual Property: Patents and Disclosures, Fiscal Years 2011-2016
Percent Change
Source 2011 2012 2013 2014 2015 2016 1 Year 5 Year
Business $1,375 $0 $5,768 $17,278 $16,529 $2,784 -83% 102%
Education $137,717 $174,568 $126,740 $44,969 $88,092 $65,093 -26% -53%
Engineering $270,646 $175,893 $209,268 $334,208 $256,582 $296,071 15% 9%
Liberal Arts/Social Science $0 $6,300 $1,600 $1,600 $6,026 $3,080 -49% -
Science $472,280 $293,496 $456,115 $365,324 $266,440 $315,059 18% -33%
Nursing $0 $0 $0 $0 $13,920 $20,836 50% -
Urban Affairs $77,475 $48,786 $115,308 $120,842 $51,830 $108,801 110% 40%
Total $959,493 $959,493 $914,799 $884,221 $699,419 $811,724 16% -15%
Source: CSU Controller’s Offi ce
Table 4.9: Cleveland State University Graduate Student Support from Externally Funded Research, Fiscal Years 2011-2016

Cleveland State University / 2017 Book of Trends80
Growth in Graduate EducationGraduate education at Cleveland State has seen unprecedented growth in recent years, from 3,000 students in the 1980’s, to 4,000 in the 1990’s, to
approximately 5,000 students pursuing graduate and post-graduate programs at the University. Such growth in graduate programs has implications for
strengthening the quality of these offerings and seizing opportunities for supporting educational goals of students by creating new and tailored program
offerings. Growth in graduate programs at CSU points to numerous research opportunities for future students and faculty researchers. Institutional
investments in graduate education are closely linked with strategies for promoting sponsored research, which lead to an increased opportunity for the
contributions of graduate, doctoral and post-doctoral students.
Institution 2012 2013 2014 2015 2016 Grad SCH
University of Akron 10% 11% 11% 10% 10% 26,795Bowling Green State University 8% 8% 8% 9% 9% 20,457University of Cincinnati 20% 20% 20% 20% 19% 81,306Cleveland State University 19% 18% 18% 17% 16% 31,370
Central State University 1% 1% 0% 0% 0% 53Kent State University 13% 13% 13% 14% 13% 50,584Miami University 7% 7% 6% 6% 6% 16,686Ohio State University 13% 12% 13% 12% 12% 96,035Ohio University 11% 12% 13% 12% 12% 44,448Shawnee State University 2% 2% 3% 3% 3% 1,658University of Toledo 11% 11% 11% 10% 10% 25,767Wright State University 12% 13% 14% 14% 13% 24,630Youngstown State University 5% 5% 6% 6% 6% 9,794
Total 12% 12% 12% 12% 12% 429,583 Note: Graduate students include the following ranks: DS (Doctoral), MS (Master’s), ND, NM and NG (non degree-seeking graduate students).
Source: The Ohio Board of Regents HEI Course Enrollment (CN) query. Run Date: August 11, 2017
Table 4.10: Percentage of Total Student Credit Hours Taken by Graduate Level Students at Selected Ohio 4-Year Institutions-Main Campuses Only, Fall Terms 2012-2016

81Section 4 - Sponsored Programs and Research
SEC
TIO
N
4
Table 4.11: Selected Research & Grant Highlights by College
College Department Project Description
Business
Education and
Human Services
Centers for Outreach and Engagement
Counseling, Administration and Adult Learning
Curriculum and Foundations
Small Business Development Center (SBDC):
The College received $75,000 from the State of Ohio to run the Small Business Development Center (SBDC). The Cleveland State University (CSU) SBDC is funded by the Ohio Department of Development and the Small Business Administration (SBA). The CSU SBDC serves Cuyahoga County and provides high-quality business and economic development assistance to small businesses and nascent entrepreneurs to promote growth, expansion, innovation, increased productivity and management improvement.
MOCA Fellowship Collaboration:
The Museum of Contemporary Art Cleveland (MOCA) and the Cleveland State University Monte Ahuja College of Business are partnering to connect the classroom to the workplace through experiential learning. CSU and MOCA work together annually to select four outstanding individuals who will spend 12 months at MOCA Cleveland serving as part-time, junior staff members in the MOCA-CSU Fellowship Program. The Program grant is for $400,000 from July 2015 through July 2017.
Civic Engagement Grant:
The Civic Engagement Grant provides $2,500 to support the SBDC with the development of curriculum and materials to support self-paced learning as well as group workshops and training of entrepreneurs. The SBDC addresses the need of economic development and job creation within the Cleveland area. In 2015, 49 jobs were created, 20 new businesses started, and total capital formation (loans and owner investment) of $1,389,145 was acquired by local entrepreneurs. We serve the community by offering free advising and workshops that educate anyone interested in business topics that help entrepreneurs to start businesses as well as to continue to grow their businesses. With our new materials, workshops, and self-paced learning stations, our entrepreneurs will have access to the newest up to date materials and curriculum to assist them in their business ventures.
Export Assistance Center (EAN):
The College received $130,000 from the State of Ohio to run the Export Assistance Center (EAN) for Regions 8 and 9. International trade specialists provide export assistance and focus new-to-export businesses and exporters toward expanding overseas markets. They promote business development and support future competitiveness through international market opportunities, increased small business export transactions, and export sales.
Center for Educational Leadership: Evolved from the nationally recognized First Ring Leadership Academy, the Center for Educational Leadership partners with urban school districts to offer professional development for principals and academic programs to develop and sustain inspired leaders for today’s schools. Most notably is the Inspired Leaders Principal Licensure Program, which is launching its fi fth cohort. Also offered are the Master of Education in Organizational Leadership, the Empowered Leaders Teacher Endorsement Program and the Education Policy Fellowship Program. The Center also coordinates the First Ring Leadership Academy that is funded by a grant from the Martha Holden Jennings Foundation. This is a year-long training program promoting transformational leadership in the teachers and administrators working in the Cleveland Municipal School District and the thirteen inner ring school districts bordering Cleveland.
Career Passport Program currently called Making My Future Work: A three-year $1,000,000 USDE Institute of Education Sciences grant. It continues to develop, refi ne, implement and evaluate a college and career readiness program for use in urban secondary schools as an intervention to prevent school dropouts. A state-of-the art, user-friendly curriculum manual consisting of 100 lessons and four modules has been created by key personnel, public high school teachers, graduate assistants and a graphics design consultant. A training and orientation video to accompany the manual is being developed in collaboration with the Center for Educational Technology.
Gifted Education Enters Cyberspace: The graduate program in Gifted Education is offering all six required courses online, extending outreach to meet teachers’ needs in serving gifted, talented, and advanced learners in schools across the country. This is the only program in the state to receive National Recognition from the National Association of Gifted Children.
The Center for Urban Education Carries out part of its mission by assisting faculty at CSU and external partners in P-20 education with the identifi cation, development and/or submission of grant proposals including the execution and management of grants at post-award. The Center is currently involved in 18 projects. During the 2015-16 academic year, the Center was awarded a research grant from the Spencer Foundation, led by Center Director Adam Voight, for a project that investigates how young people analyze and understand social issues that affect their lives. This academic year, the Center also led the evaluation of the “Project PASS” reading tutoring program in Youngstown City Schools, supported by the Ohio Department of Education. With support from the CSU Offi ce of Research, the Center also conducted a research study of a district-wide student voice initiative in the Cleveland Metropolitan School District (CMSD) during the 2015-16

Cleveland State University / 2017 Book of Trends82
school year to understand the effects of the initiative on participating students and schools. In spring 2016, the Center partnered with CMSD to create a research policy fellowship for a CSU doctoral student in the Research and Evaluation Department at the district that will be renewed in the upcoming year.
Master of Urban Secondary Teaching Residency Program – This graduate-level licensure program offers a yearlong residency in an urban secondary school to fully prepare teachers for successful classroom teaching. The MUST Residency Program partners with the Cleveland Metropolitan School District and the Euclid School District to develop teachers who are committed to social justice and the success of students in urban schools.
The Cleveland Schools Book Fund: This program is designed to supply all Pre-K through Grade 3 classrooms in the Cleveland Municipal School District with libraries of children’s literature as well as provide teachers professional development to increase young students’ interest in and ability to read, comprehend and enjoy.
The Stocker Foundation grant - Lorain Reads: The grant provides home library building activities through an interactive web-site for all children in Lorain City Schools in grades Pre-K through 3.
Martha Holden Jennings Foundation grant: “Building a Better On-Ramp for Advanced High School Mathematics” provides over 50 teachers and principals from the Innovative Network of Cleveland Metropolitan School District with professional learning activities in a year-round blended program.
United Way/CEIE Community Wrap-Around School (Walton) grant provides support for the community wrap-around model at Walton School. The grant provides support for CSU involvement in coordinating partner services and engages CSU students in a range of service and outreach activities. In addition, the grant provides support in identifying school needs and locating service providers as potential partners.
CMSD/CEIE Tutor Partnership provides CSU students the opportunity to serve as tutors – and CMSD early elementary classrooms the opportunity to have additional supports for early literacy. Hundreds of hours of tutoring has been provided to CMSD through CSU students while CMSD has provided the CSU students with an opportunity for student employment.
Children’s Museum of Cleveland/CEIE partnership funded through the State of Ohio provides the Children’s Museum of Cleveland with CSU interns to support programming, development and marketing.
Project Reach: A major fi ve-year grant to improve Cleveland State University’s ability to prepare all teachers to provide effective instruction for Limited English Profi cient students, professional development for content area teachers to improve academic achievement of Limited English Profi cient students, and to become a region that provides strong support in both language acquisition and content learning for all classrooms that serve Limited English Profi cient students.
Highly Qualifi ed Teachers Program: A fi ve-year U.S. Department of Education grant to enhance the Special Education Programs. The emphasis is on graduating candidates who meet the highly qualifi ed teacher guidelines under the No Child Left Behind and Individuals with Disabilities Education Act legislation.
CSUTeach: With the support of the NSF Noyce Scholars Program and Cleveland State’s partners (National Math and Science Initiative, UTeach Institute, Ohio STEM Learning Network, and the Cleveland Metropolitan School District) Cleveland State is bringing the UTeach model to Ohio transforming the teacher education experience for pre-service teachers to be licensed to teach grades 7-12, with an emphasis on preparing for underserved, urban classrooms. The program provides project-based instruction and inquiry design in mathematics and science classrooms. Students participate in internships with local schools and non-profi t organizations. Scholarship funds are available to eligible STEM students. Noyce Scholars will be eligible to become licensed STEM teachers.
Choose Ohio First: This scholarship program which provides renewable scholarships of up to $4,700 per year is designed to attract and graduate qualifi ed STEMM Education students. Scholarship recipients are required to tutor in an academic environment to support classroom education. As part of the Ohio Innovation Partnership and funded through the Ohio Board of Regents, the scholarships are designed to signifi cantly strengthen Ohio’s competitiveness in science, technology, engineering, mathematics and medicine (STEMM) and STEM education.
The Masters of Urban Secondary Teaching (MUST) STEM Fellows Program: The program awards full tuition scholarships to eligible students pursuing licensure in math or science and will also fund up to 8 hours of undergraduate credit for students who need to complete pre or co-requisites for the MUST program.
Careers in Health and Medical Professions (CHAMPS): An ongoing year-round program developed to recruit minorities into high skill level health care careers by increasing awareness and knowledge. The
College Department Project Description
Center for Excellence and Innovation in Education (CEIE)
Teacher Education

83Section 4 - Sponsored Programs and Research
SEC
TIO
N
4
College Department Project Description
program provides two or more years of intensive academic enrichment by engaging high school students in skill enhancement, in-depth medical career experiences and thought-provoking science activities while helping them develop into a unifi ed, cohesive cohort. The program is funded by the Martha Holden Jennings Foundation.
The Campus International School (CIS): Conceived as a professional development school with the Cleveland Metropolitan School District (CMSD), Campus International School is a public school currently offering instruction in Kindergarten through 5th grade to an economically and socially diverse population of students. The aim of the school is to develop well-rounded, knowledgeable, internationally minded students who recognize their common humanity and shared guardianship of the planet. In all areas of the school, the teachers and staff model the learners’ profi les to help teachers and students establish goals, plan units of inquiry, and assess performance. CIS teachers collaborate within and across grade levels to ensure that each student’s instructional needs are met. Professional development is institutionalized with two hours of professional development each week with varied topics based on need. Cleveland State provides a Professor-in-Residence to the school staff and serves as an intermediary between the school and university. Interactions with the university include student fi eld experiences, speech, hearing, psychology and occupational therapy assessments, regular after-school physical science experiences, daily Mandarin language and cultural instruction, facilities for physical education classes, administrative support and grant funding to support school instruction.
Differentiating Instruction at the Campus International School: Supported by the Martha Holden Jennings Foundation the project was developed by an observation that some of the CIS teachers were tracking students by dividing them into static ability groups rather than differentiating instruction by developing multilevel activities that provide opportunities for all children to participate and achieve. The CSU project team introduced and/or extended their knowledge of and ability to implement specifi c ways to differentiate instruction. The project consisted of numerous phases during the school year and included two levels of evaluation: a formative evaluation and an external evaluation. The resulting summary and recommendations were ways Differentiated Instruction can be sustained at the Campus International School and transferred to other CMSD schools. The teachers assessed their students’ learning and the faculty members and external evaluator assessed teacher learning.
The Community Learning Center: Formerly the Educational Services Center, the Community Learning Center for Children and Youth (CLC) provides an engaged-learning experience for students at Cleveland State while serving the community by offering free assessment and tutoring programs for children at the elementary and middle-school grade levels who have diffi culties with reading, math, or learning in general. The children’s positive learning experiences with the CLC have been recognized both by their families at home and their teachers at school. Under the supervision of the Department of Teacher Education, the CLC has grown from supporting two classes serving thirty children from the community to nine serving 180 children from the community. Continuously expanding, the CLC now offers a program for children learning English as a second or foreign language for university students pursuing a degree or endorsement in TESOL (Teaching English to Speakers of Other Languages).As an integral part of the teacher-education program, the CLC allows for both undergraduate and graduate students to engage in real-life experiences assessing and teaching children from diverse backgrounds. Through interactions with the children at the CLC, faculty provides supervised opportunities in their courses for university students pursuing licenses and/or degrees in education to explore the links between research, theory, and practice. Additionally, the CLC hosts a range of educational resources, including assessment and curriculum materials and assistive technology devices, for faculty to demonstrate in classes and for students to examine and use.
MOCA Fellowship Collaboration: The Museum of Contemporary Art Cleveland (MOCA) and the Cleveland State University College of Education, Department of Teacher Education are partnering to connect the classroom to the workplace through experiential learning. Early Childhood Education program has been identifi ed to be a part of a fellowship program that partners with the Museum of Contemporary Art. The fellowship is classifi ed as an internship and MOCA Cleveland will fund this part time position for ECE teacher candidates in the amount of $15,600.00. The internships are for 12 months and begin September 2016.
Multicultural Learning and Teaching International Journal: Multicultural Learning and Teaching, a De Gruyter publication, is now housed in CoEHS, Department of Teacher Education. Multicultural Learning and Teaching (MLT) is a multidisciplinary international journal that explores the education of people from diverse multicultural backgrounds in a variety of learning environments, inside and outside the classroom. The journal focuses on the broad implications of multicultural learning and teaching practices around the world, going beyond traditional education journals to offer analysis and practical recommendations of interest to teachers, counseling and community-service providers, school administrators, urban program specialists, education policymakers, and any professionals who grapple with questions of multicultural communication. The journal will provide national and international recognition, and will support efforts to build a distinctive image for CSU, CoEHS and the Department of Teacher Education. The journal publishes two issues a year.

Cleveland State University / 2017 Book of Trends84
Engineering
College Department Project Description
The STEMM Education Center at Cleveland State University includes faculty members from the Colleges of Education and Human Services, Science and Health Professions and the Washkewicz College of Engineering. The STEMM Education Center provides a mechanism for connecting the STEMM education efforts across campus, not as a gatekeeper, but as a place to connect and collaborate across the colleges, disciplines, and with K-12 and other outside STEMM entities. In recent years the faculty associated with the center have received over $10 million in external grant funds with collaboration of over 20 faculty members from across the colleges. MC2STEM High School is also a major partner in the center. MC2STEM High School was created in 2008 as the platform school for northeast Ohio. In addition to the on campus agenda, the STEMM Education Center also houses the Center for Innovation in STEM Education (CISE) and the northeast Ohio hub of the Ohio STEM Learning Network (OSLN). CISE provides professional development around project-based instruction and fabrication laboratories to K-12 administrators and teachers, providing support for state STEM initiatives and STEM schools across the state of Ohio and also has connections to the national STEMx Network.
Workplace Health Programs: Working in collaboration with CSU’s VikeHealth program, Departmental faculty in Health and Exercise Physiology oversee the Fitness for Life employee fi tness program and offer a multitude of health promotion and fi tness programs for the Journey to Wellness program for CSU employees.
Human Performance Laboratory: The Human Performance Laboratory is a state of the art facility designed for teaching and research. Currently the laboratory is working on several projects with Orbital Research Inc., including a pilot physiological assessment system aimed to monitor hypoxia (lack of oxygen) in the Air Force’s F-22 Raptor pilots. The lab is equipped to simulate fl ight physiology of pilots up to 25,000 feet altitude and is testing Orbital’s sensors to predict hypoxia before the pilots become impaired and unable to fl y. Another Orbital Research project is the development and testing of a microsystem to sense and control warfi ghter physiology, in particular Special Forces in extreme military dive operations. During this research, the lab will test sensors developed by Orbital that can monitor and deliver proper breathing gas mixtures during rapid descent from altitude. Currently several graduate students are conducting research involving devices to enhance recovery in athletes, prevent hyperthermia, and to correlate power with speed and agility. The lab will be expanding into new areas for subcellular research.
Development of the Additive Manufacturing Instructional and Training Laboratory at Cleveland State
University: This project, funded by the State of Ohio (OBOR), will lead to the establishment of a laboratory for additive manufacturing (3D printing) in the Washkewicz College of Engineering. The aim is to train employees from the regional industry and educate students to develop a workforce in the fi eld of additive manufacturing and contribute to the economic development of the region and State.
CPS-Synergy: Cyber-Enabled Exercise Machines: Researchers from Mechanical Engineering, Electrical Engineering & Computer Science, and Health and Human Performance (College of Education and Human Services) have been collaborating in a National Science Foundation project on advanced machines for exercise and rehabilitation. The machines measure and process biomechanical variables and generate adjustments to their own resistance, providing users with cues that will ultimately maximize training or rehabilitation effectiveness and guarantee safety. The machines will be reconfi gurable by software, permitting a wide range of exercises with the same hardware.
Optimal Prosthesis Design with Energy Regeneration: This collaborative project between the departments of Electrical & Computer Engineering and Mechanical Engineering, funded by NSF, combines human motion, control, optimization, estimation, robotics and mechatronics. Its objective is to develop innovative prosthetic legs, which enable natural gaits with very low power consumption.
Mechanistic Study of Developmental Neurotoxicity on 3D Cultured Stem Cell Microarrays: There is a critical need for improved human toxicology testing to rapidly advance therapeutic drug candidates to preclinical evaluation or to prioritize potential environmental toxicants. The ability to predict developmental neurotoxicity in vivo is of particular importance in identifying drug candidates and environmental toxicants that should be fl agged as potentially harmful to the developing brain. The primary objective of our NIH-funded research project is to investigate the mechanisms of neurotoxicity on human neural stem cells (NSCs) cultured in three dimension (3D) on a high-throughput microarray chip platform. The outcomes from this work could help in precisely measuring various cellular and molecular pathways involved in human developmental toxicology.
Microstructural Analysis of MICAST2-12: Al-7wt% Si Alloy Directionally Solidifi ed on the International
Space Station: The purpose of this project is to characterize dendritic microstructure of Al-7wt% Si samples directionally solidifi ed on the International Space Station under low gravity environment of space. Primary dendrite spacing and primary dendrite trunk diameters are being measured for steady-state and transient growth conditions. Comparison of terrestrially and space processed sample microstructures will help us understand the role of convection in the formation of defects during casting of metallic alloys.
STEMM Center
Health and Human Performance
College-Wide andInterdepartmental
Chemical and Biomedical Engineering

85Section 4 - Sponsored Programs and Research
SEC
TIO
N
4
College Department Project Description
Pore-Mushy Zone Interaction during Directional Solidifi cation of Alloys - Three-Dimensional Simulation and
Comparison with PFMI-Experiments: Formation of shrinkage porosity and bubbles during solidifi cation disturbs the dendritic array and degrades the mechanical property of castings. The purpose of this research is to study the pore-dendrite interaction during directional solidifi cation of Succinonitrile-0.4 percent water alloy, as observed by previous NASA experiments on the International Space Station. Video recordings available from the NASA-PFMI (Pore Formation and Mobility Investigation) project will be reviewed to extract growth speed-morphology-pore interaction observations and compare them with the results from the numerical simulations to be conducted under this project. This is a joint project among California State University, Los Angeles, the University of Akron and Cleveland State University.
Development of a Particle-Based Non-Invasive Inspection Technique for Paint: Understanding the drying process is critical to improving coatings performance. Defects could potentially be reduced by knowing how parameters such as fi lm thickness and evaporation rate affect the transient material properties of the coating. Unfortunately, there are few methods capable of tracking material properties of a coating during cure. In this project, funded by PPG Industries, a particle-based microrheology technique is proposed as a non-invasive method for tracking the transient properties of a paint during cure. Preliminary results suggest that microrheology is an appropriate technique for measuring the viscosity of paint in both the absence and presence of drying. The proposed research work seeks to further extend these preliminary results to paints at (1) varying drying conditions, (2) with varying optical properties, and to (3) to track coating properties in 3D during cure.
Chip-Based, Miniaturized 3D Bioprinting for Chemical Toxicity Assessment: Since preclinical evaluations with animal models are often inaccurate due to differences in genetic makeup between animals and humans, there has been an emergence of in vitro three-dimensional (3D) cell culture techniques that attempt to recapitulate tissue structures in vivo. While the advantages of 3D cell cultures are clear compared to 2D cell cultures, limited effort has been directed towards the miniaturization of 3D cell/tissue models that are compatible with high-throughput compound screening. The primary goal of this project, funded by the NSF-based Ohio I-Corps program, is to commercialize various human tissues on a 384-pillar plate with sidewalls via our proprietary “3D bioprinting” technology, which could potentially revolutionize regenerative medicine, oncology, and drug discovery. With the realization of fully developed mini-tissues on the 384-pillar plate, the pharmaceutical, cosmetics, and chemical industries will be able to generate highly predictive toxicity, effi cacy, and pharmacokinetic information needed to determine whether to advance therapeutic and other new product candidates from early stage development to later stage evaluation.
Next Generation Oxygen Concentrators: This project, funded by the Invacare Corporation, aims at improving oxygen concentrators for persons who need oxygen therapy. The heart of these devices is a “molecular sieve bed” which concentrates oxygen from ambient air at 21% to about 98%. CSU’s research expertise in gas separation and storage by adsorption and in modeling chemical processes will perfect the next generation portable oxygen concentrators with higher effi ciency.
Directional Solidifi cation Experiments on The International Space Station-MICAST12: The purpose of this project is to study the role of convection on microstructure development during directional solidifi cation of metallic alloys. Al-7% dendritic monocrystal samples grown on earth at Cleveland State University are being compared with those processed under similar conditions on the International Space Station in convection-free environment. This is a joint NASA-ESA research project partnering researchers from Cleveland State University and the University of Arizona.
Effect of Varying Convection on Dendrite Morphology and Macrosegregation: This NASA project aims to: (a) study directional solidifi cation of Al-Cu alloys that are compatible with the Space Station facilities; (b) conduct experiments involving solidifi cation through cross-section decrease and through cross-section increase; and (c) examine array morphology changes and macrosegregation associated with DS through cross-section changes.
Acquisition of an Integrated Atomic Force Microscope/Inverted Optical Microscope for Interdisciplinary
Research at Cleveland State University: CSU researchers were funded a Major Research Instrumentation grant from NSF to acquire an integrated atomic force microscope. This equipment will enable sub-molecular high-resolution imaging, low-noise precision force spectroscopy measurements, and epi-fl uorescence imaging capabilities. It is anticipated that students and faculty whose research and teaching include materials science (biomedical, electronics, energy applications), biosensors, thermo-responsive polymers, nano-scale systems, biomechanics, and soft materials, will immensely benefi t from this equipment.
Evaluation of Safety Practices for Short Duration Work Zones: This research project has been conducted in collaboration with the Texas A&M Transportation Institute for the Ohio Department of Transportation. It involves observing maintenance crews in Columbus and Cleveland to evaluate the use of new strategies and technologies to improve the safety of work zone operations. During Phase I, several key pieces of equipment were identifi ed for further analysis. Phase II includes the fi eld evaluation of a mobile barrier, a worker basket for the setup and removal of temporary traffi c control, and equipment mounted lighting. It is expected that the use of this equipment will add to the continued safe and effi cient fl ow of traffi c in short duration work zones.
Civil and Environmental Engineering

Cleveland State University / 2017 Book of Trends86
A Practical Approach for Remediation Performance Assessment and Optimization at DNAPL Sites for Early
Identifi cation and Correction of Problems Considering Uncertainty: The goal of this project, funded by the US DOD, is to develop and test a methodology to periodically assess and optimize remediation systems and monitoring of the US DOD’s dense non-aqueous phase liquid contaminated sites with remedies in place. Methods will be developed and tested to periodically estimate the value of additional characterization data in terms of life cycle cost savings; to refi ne model calibration considering new data from monitoring; to assess the probability of the current operations to meet cleanup objectives; and to reoptimize system operation and monitoring variables to minimize expected life cycle cost taking into consideration performance and cost uncertainty.
Evaluation of High Performance Pavement and Bridge Deck Wearing Surface Repair Materials: To improve repairs of concrete bridge decks and concrete and asphalt pavements, different repair materials are being installed and analyzed along fi eld test sections near Xenia, Ohio. Approximately 100 repair patches with six different repair materials were installed in March and June 2014. The performance of the patching materials will be monitored over two winters to determine which are suitable for adoption by ODOT.
A Spiral Computer Engineering Lab Framework: This project is establishing a “spiral” laboratory framework for a computer engineering curriculum in which the key concepts are revisited at increasing levels of sophistication and interconnection. Instead of treating each course as an isolated topic, the project is developing a sequence of laboratory experiments and projects weaving through the entire curriculum, from freshman engineering to senior capstone design. This approach will help students see the big picture of the discipline and enhance their integration skills to address complex and realistic problems.
Transactive Uncertainty and Flexibility for High-Penetration of Semi-dispatchable Renewable in Electricity
Market: This project, funded by the National Science Foundation, will develop theoretically sound, yet practical, model and scheduling tool to potentially address the fundamental challenge of uncertainty management in renewable energy integration. The increasing penetration of renewables, such as solar and wind generation, is challenging traditional power system operations and electricity market mechanisms. Due to their intrinsic intermittency and variability, renewables lead to increased uncertainty in the power grid. The aim of the project is to integrate renewables optimally, cost-effectively, and environment-friendly.
Usable, Memorable, and Secure Mobile Authentication: As mobile devices, such as smartphones, are becoming increasingly popular, so has the realization that security is an important requirement for the use of mobile devices in our daily life. Authentication, the fi rst defense mechanism preventing unauthorized access to a mobile device, allows owners of mobile devices to unlock and use their devices. We investigate approaches for mobile authentication in this project. The approaches are applicable to a wide range of electronic platforms, including smartphones, computers, ATMs, and other high-risk electronic gateways. Consequently, the potential to benefi t society with more secure systems should have an enormous impact.
Computer Science for All Students in the Cleveland Metropolitan School District: The central goal of this project, which is funded by the Cleveland Foundation, is to create a robust foundation for the implementation of a CSforAll program in Cleveland Schools. The key priority outcomes that will be generated by this project are: (1) The establishment of computer science as a viable and supported subject offering for high school students in the Cleveland Metropolitan School District. (2) The creation of a corps of teachers in the district who can serve as a resource base for the district as CSforAll is implemented at full scale. (3) The development of a set of “adoption guides” for principals and administrators that clearly outline various issues that arise when implementing CS for All in schools, and document best practices, including course coding, teacher credentialing, scheduling, advising, etc. (4) The creation of a replicable model for CSforAll implementation, in diverse and high-needs school districts, with equity as a primary design consideration.
A Privacy-Aware Compliance Tracking System with Realtime Feedback: A signifi cant fraction of workplace injuries are the result of workers not following best practices. The technology we developed is based on a novel computer-vision-based system that aims to increase the workers’ compliance to best practices. The system is designed to track the activities of consented workers using the depth sensors, alert them discreetly on detection of noncompliant activities, and produce cumulative reports on their performance. Hence, the system provides a valuable set of services for both workers and administrators toward a healthier and more productive workplace. In this project, funded by the NSF-based I-Corps program, we are tasked to develop a set of value propositions for our technology, validate our hypothesis, and come up with a business plan. These will be accomplished via entrepreneurship training and via interviewing 100 potential customers.
Computing in Secondary Schools - Engaging Teachers in Computing Education for the Next-Generation
Workforce: Computer Science is a subject area that all high school graduates need at least some knowledge and familiarity with; yet, the quality of Computer Science instruction in the United States high schools is far lower than what is necessary. The Computing in Secondary Schools program, funded by NSF, is aimed at providing teacher professional development and online curriculum support to teachers across Ohio to teach the new Computer Science Principles course. The project is also exploring research questions surrounding the
College Department Project Description
Electrical Engineering and Computer Science

87Section 4 - Sponsored Programs and Research
SEC
TIO
N
4
College Department Project Description
delivery of such professional development using online instruction.
The Game Changer: A New Model for Password Security: The motivation for this EAGER NSF project is the fact that existing password security systems are either memorable or secure, but not both. The plan is to develop a new model for password security which is secure, memorable, and usable.
Acquisition of a 4G/LTE Wireless Communications Test Set: This Major Research Instrumentation grant from NSF is to acquire an E6621A PXT 4G/LTE wireless communication test set. The aim is to enable studies on security and privacy of 4G communications, fast indoor positioning in large-scale, chaotic venues, effi cient modulation and coding for 4G mobile communications, characterization of noise in wireless channels with statistical physics approaches, and security of medical communication systems. The system would also enable research on complex topics that require multidisciplinary approaches.
Ultraconductive Copper Wire: The Ultraconductive Copper (UCC) research team at Cleveland State University was successful at the development of nanocomposite Copper/Mg/MWCNT lab scale wire segments exhibiting higher electrical conductivity (ultraconductivity) at room temperature than pure metals including silver. The objective of this project funded by the Ohio Board of Regents is to develop a stable platform technology of UCC with a tangible program deliverable of a long length of UCC wire (several inches-foot), which can carry at least 10Amps at a conductivity of at least 40% above that of pure copper. Once refi ned and fully developed, this revolutionary, cost effective technology will have the disruptive potential to dramatically improve the performance and reduce the energy consumption of virtually all-electrical machines/devices. Much as carbon transformed iron to steel, carbon nanotubes are poised to transform copper and other metals into revolutionary ultraconductive materials.Design and Manufacturing of Plasma Cutting Equipment and Consumables: This project, funded by Lincoln Electric, focuses on developing new materials for plasma cutting torch via the spark plasma sintering (SPS) process. SPS has many advantages over conventional powder metallurgy methods, including the ease of operation, high reproducibility, accurate control of sintering energy, as well as high sintering speed, safety, and reliability. In SPS, a local high-temperature state is generated when spark discharges in a gap or at the contact point between the particles of powder causing the evaporation and melting on the surface of the powder particles to help obtain fully dense nanocomposites. Temperature is the main governing parameter for controlling microstructural features, which are responsible for controlling the mechanical properties of metals.
Engineering and Computing in Rehabilitation and Assistive Technology: The overall objective of this project, funded by the National Science Foundation, is to create an immersive experience in rehabilitation research that will help motivate and prepare a diverse group of students to pursue careers in rehabilitation engineering and assistive technology. This overall objective can be broken down into the following, measurable objectives: (1) immerse a diverse group of undergraduate engineering and computer science students in the challenges of developing technology to restore daily function to people who have limited ability to move their arms and legs; (2) motivate students to pursue future opportunities in rehabilitation and assistive technology; and (3) empower students to succeed in careers in rehabilitation and assistive technology.
Design, Control, and Optimization of Robotic Systems with Energy Regeneration: This National Science Foundation project focuses on research in advanced methods for robot motion control with explicit regard to energy effi ciency. The control theories being developed allow for optimal energy redistribution and storage among robotic joints and across robots in a manner compatible with motion control requirements. The technologies resulting from this research can be used in biomedical, industrial and mobile robots.
Hot Extrusion of Ultraconductive Nanocomposite Copper: The project seeks to extend the ultraconductivity results achieved in patented (US Patent 8,347,944) work from the millimeter scale to longer ultraconductive wire on the meter-Kilometer scale. The project also aims to prefect the manufacturing process that will be used to mass produce the ultraconductive copper wire.Campressor: The NSF-based Ohio I-Corp program provided mechanical engineering students with an entrepreneurial grant to develop a business around a capstone senior design project. Students have established a company to develop and commercialize an innovative air compressor unit that does not have a storage tank; the device is intended to have house-hold and industrial use. I-Corp provides training opportunities for the grantees, including introduction of the grant recipients to industrial mentors, fund-raising opportunities, and market studies.
ASHRAE Level II Commercial Energy Audits: This project has been sub-contracted from the University of Dayton Research Institute under the State of Ohio Development Services Agency for participating in the State Energy Program. It involves conducting and completing eight ASHRAE Level II commercial energy audits using faculty and students from CSU. The program aims at identifying clients, helping buildings become more energy effi cient, and training students in energy effi ciency.
Mechanical Engineering

Cleveland State University / 2017 Book of Trends88
In AY 2016-2017 CLASS faculty published or sent to press 23 books and 41 book chapters. Departments represented include Art; Communication; Criminology, Anthropology, and Sociology; Social Work; Communication; English; History; Music; Political Science; and World Languages, Literatures, and Cultures. CLASS faculty also published 83 journal articles; gave 173 presentations at conferences, meetings, and symposia; and gave 15 poster presentations. CLASS faculty from the Art Department gave 66 creative performances and produced 51 creative works. New and continuing research/creative work was funded by 36 grants, including those from the NIH, Cyrus Eaton Foundation, US Offi ce of Personnel Management, Nord Family Foundation, Ohio Arts Council, Ohio History Connection, Case Western Reserve University, Bellefaire, Cleveland Foundation, George Gund Foundation, and Veterans Administration. CLASS faculty were awarded 11 Faculty Scholarship Initiative grants, 1 Multi-College Interdisciplinary Research Program grant, and 3 Undergraduate Summer Research Awards.
Geriatric Work Force Enhancement Program: Funding for three years from the Health Resources & Services Administration (HRSA) has established a multi-site education initiative aimed at teaching health professions students to work on interprofessional teams. Students from various health care professions, including nursing, physical therapy, occupational therapy, social work, speech and hearing, pharmacy, medicine, and spiritual care, learn to work together through simulation, case studies, and the use of standardized patients. The program also works with professionals already working in health care to improve interprofessional teamwork and its application to the management of patient health care.
Ohio Medicaid Technical Assistance & Policy Program (MedTAPP) Healthcare Access (HCA) Initiative: This continuing program is sponsored by the Ohio Department of Medicaid and administered by The Ohio State University. The CSU School of Nursing, working with project partners (CSU School of Social Work, Sisters of Charity Foundation, St. Vincent Charity Medical Center, Care Source, Care Alliance, MetroHealth System, and University Hospitals), trained 15 mentors and 39 mentees from the Schools of Nursing and Social Work (both undergraduate and graduate students) through a mentor training project. The objectives included increasing the health care practitioners working with Medicaid patients; facilitating interdisciplinary collaboration; and fostering readiness and knowledge of entry-level health care practitioners to meet the needs of the Medicaid population.
Educating for the Future of Nursing: Building Capacity with Nursing Educators - Nurse Faculty Loan Program (NFLP): Funding from the Health Resources & Services Administration (HRSA) enables CSU to offer forgivable loans to MSN and PhD Nursing candidates who plan to embark on a career in nursing education after graduation. Up to 85% of the loan is cancelled if the borrower completes four years of full-time employment as a faculty member at an accredited school of nursing.
Area Health Education Center (AHEC): Continued funding for the Cleveland Regional Interprofessional (CRI) AHEC at Cleveland State University (CSU) addresses health concerns and well-being of the Northeast Ohio population through recruiting and advancing of education for students and health professionals by: (1) Provision of academic quality in order to succeed in the health professions (2), Commitment to primary care and preventative care health professions, (3) Commitment to serve the medically under-served who lack access to health care and (4) Provision of a student body and health professionals that represent the diversity and value of northeast Ohio. The purpose of this project is to bring AHEC to the Cleveland area and surrounding counties.
MedTAPP Healthcare Access (HCA) Initiative Community Health Worker Program: Year two of funding from the Department of Health and Human Services, through the Ohio Department of Medicaid (ODM), allowed the CSU School of Nursing to develop sustainable curriculum and training programs to recruit, train, and retain quality future healthcare professional to care for the underserved. Called I-Hope (Improved Health Outcomes of Populations through Education), the program is an interdisciplinary initiative designed to empower low-income residents with a high prevalence of chronic disease. Funding is being used to create a sustainable community support network of Community Health Workers which has additional training in chronic disease self-management concepts designed by Stanford University.
Choose Ohio First (COF) Nursing Scholarship Initiative: Funding from the State of Ohio provided scholarship support and mentoring for ten senior and ten junior nursing students. Criteria was based on fi nancial need and academic merit. Each scholarship recipient is required to provide ten hours of service to the School of Nursing each semester during which a COF award is received.
Critical Thinking Cards as a Strategy to Improve Critical Thinking in Nursing Students: This project is in collaboration with Wright State University. The current trends in healthcare require nurses to be knowledgeable and prepared to care for patients at all levels of acuity. Nursing faculty must be creative to be able to bridge the gap between classroom content and clinical practice. Students must be able to connect theory to practice when thinking through problems and caring for patients. The use of critical thinking cards during clinical practice is one answer to help students transfer and apply the knowledge learned in the
College Department Project Description
Liberal Arts and
Social Sciences
School of
Nursing
Nursing

89Section 4 - Sponsored Programs and Research
SEC
TIO
N
4
classroom to the clinical arena. Stress and Animal Therapy in College Students: This study examines the effect of play with canines on stress levels in college students during midterm and fi nal examination periods using cortisol levels and a self-assessment questionnaire.
Postpartum Skin-to-Skin Contact (SSC) to Reduce Neonatal Abstinence Syndrome Severity: Each year 800,000 newborns are prenatally exposed to opioid drugs, and between 12% and 90% of opioid-exposed newborns will develop drug withdrawal symptoms, called neonatal abstinence syndrome. A new intervention to reduce neonatal abstinence syndrome severity using skin-to-skin, chest-to-chest contact between newborn and mother, is being studied to determine if skin-to-skin contact reduces withdrawal symptoms in infants experiencing opioid withdrawal.
GRHD received a $1 million gift. The support, provided by an anonymous donor, will be used to fund graduate scholarships, post-doctoral fellowships, pilot and bridge research projects, and equipment needs. It will also assist in drawing additional private and public investment to further expand and strengthen the Center’s research portfolio.
GRHD received a $100,000 gift from CSU alumni John and Patricia Thompson to support the creation of the John and Patricia Thompson GRHD Seminar Series.
Roman Kondratov was awarded a grant from the National Institute of Aging (NIH) in the total amount of $1,522,125 for his research on circadian clock system.
Valentin Boerner’s group published a manuscript in the prestigious journal Science entitled “Control of Meiotic Pairing and Recombination by Chromosomally Tethered 26S Proteosome.”
Anton A. Komar’s and his colleagues’ recent Molecular Cell paper entitled “Synonymous Codons Direct Cotranslational Folding Toward Different Protein Conformations” has been recommended by the Faculty of 1000 as being of special signifi cance.
Bibo Li was awarded a grant by the the National Institute of Allergy and Infectious Diseases (NIH) of $2,182,500 for her research on antigenic variation/variant surface glycoprotein (VSG) switching in Trypanosoma brucei. She also was awarded $295,000 in funding from NSF as part of a collaboration with Carnegie Mellon University to investigate telomerase regulation in deep branching eukaryotes.
Barsanjit Mazumder was awarded a grant from the National Heart, Lung, and Blood Institute (NIH) in the amount of $1.45 million for his research on translational control of infl ammation.
Aaron Severson was awarded a grant from the National Institutes of Health AREA (R15) grant in the amount of $349,200 for his research on meiosis in model organism Caenorhabditis elegans.
Anton A. Komar received CSU’s Dr. Jennie S. Hwang Award for Faculty Excellence and a Distinguished Faculty Award for Research.
DAPCEL, Inc. donated $15,000 to support research at the Center for Gene Regulation in Health and Disease (GRHD)..
Andrew Resnick is Co-Investigator on an NIH award titled ‘Salt-Sensitive Hypertension: Role of Renal superoxide’ and recently published the following in peer-reviewed journals: Resnick, A. “HIF stabilization weakens primary cilia” PLoS ONE, and Nag, S. and Resnick, A. “Biophysics and Biofl uiddynamics of Primary Cilia” (INVITED REVIEW); American Journal of Physiology - Renal Physiology.
Anthony Berdis continues his research toward developing better treatments and diagnostics tests against cancer. His group published manuscripts in the prestigious journals Oncotarget and the Journal of Molecular Biology exploring the roles of DNA polymerases in generating drug resistance to chemotherapy.
Aimin Zhou co-authored a paper published in the very prestigious journal Cell. The paper explains the origin of transmembrane and coiled-coil domains 1 (TMCO1) defect syndrome, which commonly leads to distinctive craniofacial dysmorphism, skeletal anomalies, mental retardation, ataxia, and many other symptoms.
John Holcomb, Debbie Jackson, Stephen Duffy, Andy Resnick, Jenna Van Sickle, Susan Carver, and Elaine
Barnes continue the work of $1 million in funding from the National Science Foundation to conduct Operation STEM, an initiative to help students who begin mathematics classes at the pre-calculus and calculus levels complete their mathematics requirements to obtain a STEM degree.
Greg Lupton and John Oprea, together with Michael Farber and Mark Grant, were hosted at the
College Department Project Description
Sciences
and Health
Professions
Center for Gene Regulation in Health and Disease (GRHD)
Mathematics

Cleveland State University / 2017 Book of Trends90
Oberwolfach Mathematics Research Institute in Germany to conduct research on “Topological Complexity of Aspherical Spaces” for two weeks, as part of the institute’s Research in Pairs program.
Barb Margolius is PI in over $1.5 million in funding from the Ohio Department of Higher Education for scholarships for STEM students at CSU through 2019.
Daniel Munther and Shawn Ryan received a $10,000 grant from the Public Health Agency of Canada through York University to study “Mechanisms of Bacterial Contamination in Poultry Chill Tanks”. This supported CSU graduate student Zach McCarthy and has resulted in two recently published articles.
Daniel Munther, Partha Srinivasan, and Shawn Ryan co-organized the 2017 Northeast Ohio Applied Math Forum on April 6, 2017, bringing together 30 researchers from CSU, CWRU, Kent State, U. Akron, YSU, John Carroll. and the Cleveland Clinic to discusses recent breakthroughs and outline future collaborations in applied mathematics research.
Partha Srinivasan, Daniel Munther, and Chandra Kothapalli received a $258,000 research grant from the U.S. Department of Agriculture National Institute of Food and Agriculture to mathematically model pathogen cross-contamination and chlorine dynamics in fresh produce wash cycles.
Carol Phillips-Bey is PI on an NSF grant and local foundation support for MathCorps for over $200,000 per year. This program is designed as providing a math camp experience for local students in 7th and 8th grades to receive mathematics enrichment in a fun and affi rming environment.
Jenna Van Sickle continues the work of a $693,000 grant from the Ohio Department of Higher Education to develop a program (College Credit Plus Teacher Credentialing) to enable high school teachers to teach college-level courses.
Yuping Wu is a co-PI on a $3.1 million NIH grant with the Cleveland Clinic titled “Diet, Gut Microbiota, and Heart Failure”. The goal is to test the hypothesis that gut microbes, via metabolism of specifi c dietary nutrients, participate in the development of heart failure. She also received the College of Sciences and Health Professions 2017 Outstanding Research Award.
Ivan Soprunov published three papers in international mathematics journals on toric codes and the Bezout inequality.
Kiril A. Streletzky (PI) and Jessica Bickel (Co-PI) have been funded by the National Science Foundation (NSF) to establish a Research Experiences for Undergraduates (REU) Site at CSU. The project, titled “Synthesis, Assembly and Characterization of Soft Matter Systems,” received $312,303 in funding over three years.
Kiril Streletzky co-authored a paper with CSU physics alum, Krista Freeman, her PhD advisor, and others: “Portal Stability Controls Dynamics of DNA Ejection from Phage” in The Journal of Physical Chemistry B.
Jacqueline Vitali co-authored a paper titled, “Structural and enzymatic studies of pyrimidine biosynthesis” and “Characterization of the Dihydroorotase from Methanococcus jannaschii” in The Protein Journal.
Miron Kaufman and Petru Fodor co-authored the paper “Erosion in Extruder Flow: a Numerical and Analytical Study,” to appear in AIP Conference Proceedings.
Miron Kaufman and Sandra Kaufman co-authored the paper, “H. T. Diep Scenarios of social confl ict dynamics on duplex networks” to appear in The Journal for Policy and Complex Systems.
Miron Kaufman and Sandra Kaufman co-authored the paper “Dynamics of two-group confl icts: A statistical physics model,” in Physica A.
Jearl Walker continues to rewrite his number one best-selling textbook Fundamentals of Physics to make it an online, digital, interactive book.
Valentin Gogonea and colleagues published an article about lysine oxidation to 2-aminoadipic acid (2-AAA), a posttranslational modifi cation that is elevated in subjects at risk for diabetes. They reported that protein bound 2-AAA and lysine nitrile (LysCN) are both formed by hypochlorous acid and the MPO/H2O2/Cl- system of leukocytes.
Xue-Long Sun and his research group published seven papers in the past year, including a review paper on sialyltransferases as drug targets in BBA Proteins and Proteomics.
College Department Project Description
Physics
Chemistry(Except GRHD Faculty)

91Section 4 - Sponsored Programs and Research
SEC
TIO
N
4
Fasong Yuang was awarded a grant from The Ohio Sea Grant Program in the total amount of $119, 856 for his research project “Anthropogenic Phosphorus Storage, Bioavailability, and Cycling in the Maumee Bay and Western Lake Erie”.
Amir Poreh and former students published an article Archives of Assessment Psychology on the construct validity of a memory test; and the Journal of Applied Neuropsychology on norms for the Rey Auditory Verbal Learning Embedded Performance Validity Indicator.
Albert F. Smith and colleagues published articles in the British Journal of Nutrition, Journal of the Academy of Nutrition and Dietetics, Journal of Hunger and Environmental Nutrition, and Appetite on the topic of accuracy of memory of dietary intake.
Conor McLennan was invited to present a paper on spoken word recognition at the June 2017 Workshop on Conversational Speech and Lexical Representations at Radboud University in the Netherlands, he (with recent Ph.D. graduate Sara Incera and colleagues) published papers in Aging, Neuropsychology, and Cognition on bilingualism, age, and cognitive functioning and Acta Psychologica on perceptions of foreign accents. He also published a paper with a former student and colleagues in the International Journal of Human-Computer Studies on a new approach to computer password security.
Katherine Judge was a Distinguished Scholar for the Nethersole School of Nursing at the Chinese University of Hong Kong where she presented several research colloquia from her program of research from Project ANSWERS and Partners in Dementia Care; she received funding from the American Psychological Association Division 20 to develop a set of educational resource that reviewed and examined key research theories, methodology, and fi ndings using the Lifespan Developmental Approach in the fi eld of Adult Development and Aging, is adapting a successful intervention protocol (Project ANSWERS) for veterans who have suffered a stroke or traumatic brain injury (TBI) and their informal family caregivers, with funding from the Veterans Administration Health Services Research and Development Service ($1.1 million), and she was featured in Crain’s Cleveland Business magazine for conducting one of fi ve “research projects to watch”.
Boaz Kahana co-authored papers published in: The Gerontologist on age bias and discrimination in academia; Gerontology on a new measure of perceived success in aging; a book chapter on resourcefulness and problems among LGBT older adults; and the Journal of Gerontology & Geriatric Research on the coping strategies of elderly cancer survivors.
Michael Horvath, with a former student and emeritus professor Brian Blake, had an article accepted for publication in Internet Research on how best to measure perceptions of vendors’ websites.
Debbie Espy, Cole Galloway (Go Baby Go Primary Investigator from University of Delaware), Ann Reinthal,
Andrina Sabet (Go Baby Go Project Manager), and Madalynn Wendland made an educational presentation on their work on Harnessed Mobility: A New Paradigm to Expand Participation Across the Lifespan at the American Physical Therapy Association Combined Sections Meeting in February 2017.
Don Allensworth-Davies was a co-author on a paper on perceived discrimination, racial identity, and health behaviors among black primary-care patients who use drugs, published in the Journal of Ethnicity in Substance Abuse.
Sue Bazyk presented widely during 2016-2017 on her work on occupational therapy’s distinct value in mental health promotion, prevention and intervention.
Kelle DeBoth published a systematic review of autism subtypes in Research on Autism Spectrum Disorders in 2017 and presented on autism-related topics at the American Occupational Therapy Association national conference in April 2017.
Jodi DeMarco presented papers on health coaching programs in traditional professional preparation programs and career pathways for health promotion students as part of the new health care team at the Society for Public Health Education National Conference in March 2017.
Beth Domholdt secured $50,000 in funding from the University of Delaware to continue with the Go Baby Go project being implemented by project manager Andrina Sabet. The project, under the direction of Cole Galloway of the University of Delaware, has brought a total of $332,000 to Cleveland State University since 2014.
Beth Ekelman was the primary author of a paper on the participation and meaning in a wellness program for
College Department Project Description
Biological, Geological & Environmental Sciences (BGES) (except GRHD faculty)
Psychology
School of Health Sciences
Cleveland State University / 2017 Book of Trends92
men with spinal cord injury that was published in the Occupational Therapy Journal of Research in 2017 and presented on the experiences and meaning of participating in the co-occupation of peer mentoring at the Society for the Study of Occupation: USA and Canadian Joint Conference in September 2016.
Debbie Espy and Ann Reinthal were co-authors of a presentation on proactive and reactive adaptations during locomotor-balance control at the American Congress of Rehabilitation Medicine ACRM Annual Conference, Progress in Rehabilitation Research (PIRR) in November 2016 as well as a presentation on a taxonomy for prescribing balance intervention programs at the Combined Sections Meeting of the American Physical Therapy Association in February 2017. In addition, their paper on the relationship of intensity of balance task intensity to physical exertion has been accepted for publication by the Journal of Novel Physiotherapies.
Debbie Espy, Ann Reinthal, Beth Ekelman and Glenn Goodman, along with engineering colleague Wenbing
Zhao and nursing colleague Joan Niederriter, published a paper on privacy-aware human motion tracking with realtime haptic feedback in the Proceedings of the 4th IEEE International Conference on Mobile Services in 2016. This work stems from the $250,000 project funded by the Ohio Bureau of Workers’ Compensation on Safe Patient Handling among State Tested Nurse Aides in Nursing Homes.
Suzanne Giuffre published a revision of a chapter on pediatric physical therapy in the 20th edition of O’Sullivan and Siegelman’s TherapyEd’s National Physical Therapy Examination Review and Study Guide.
Monica Gordon Pershey presented on helping elementary school learners with language-based learning disabilities develop written language and on a clinician’s guide to assess the negative effects of medications on swallowing at the American Speech-Language-Hearing Association Annual Convention in November 2016 and on communicative behaviors of sibling dyads with a child with autism and a typically developing child at the International Clinical Phonetics and Linguistics Association Conference in June 2016.
Jane Keehan and Karen McIntye presented on an innovative educational collaboration between the Cleveland State University DPT Program and the Cleveland Museum of Art at the American Physical Therapy Association Combined Sections Meeting in February 2017.
Karen Keptner has had a paper on long-term follow-up of an occupation-based group addressing occupational performance and satisfaction in transitioning young adults accepted for publication in Occupational Therapy in Mental Health in 2017.
The Leadership Academy ran its 26th class this year and graduated 27 participants in May 2017. The Leadership Academy is a nine-month professional development program that brings together policy makers, elected offi cials, senior administrators, and community leaders to analyze, design and collaborate on contemporary urban issues.
The Ladders to Success Federal Transit Authority Grant is in its fi nal grant year. The Center for Leadership Development worked with The Federal Transit Authority, in partnership with the Greater Cleveland Regional Transit Authority (GCRTA), to conduct professional development training for 60 employees. The two-year grant supports two cohorts of 30 employees each to attend 15 full-day sessions. The purpose of the grant is to improve the supervisory and managerial skills of GCRTA employees thereby increasing their chances for promotion into leadership positions and creating a career path for the management staff.
The Center for Emergency Preparedness annually receives grant funding from the Public Utilities
Commission of Ohio (PUCO) to deliver hazardous materials (hazmat) classes at no charge to fi rst responders in Ohio. The Center also provides quality hazmat, homeland security and business continuity education training, taught by professionals utilizing industry standards and best practices.
Analysis of Supply Chain Opportunities for Fuel Cell Buses Using Industrial Classifi cations: The Center investigated possible niche-market growth for the fuel cell market in the transit bus industry. The study created a catalog using the North American Industrial Code System (NAICS) to provide suppliers and bus manufacturers a list of NAICS categories of fuel cell developers that manufacture components, or may do so in the future, to determine the concentration of suppliers and relative costs. NASA Glenn Research Center: An Economic Impact Study Fiscal Year 2016. This study is an annual update of the economic impact NASA Glenn is making on the regional economy. The study used an input-output (I-O) model to estimate the effect of NASA Glenn’s FY 2016 spending on the economies of Northeast Ohio and Ohio. This model assesses economic impact in terms of fi ve measures: output (sales), value added (output less intermediary goods), number of new and existing jobs, labor income and tax revenues. It shows NASA Glenn’s operations create a signifi cant input into the regional economy by bringing federal dollars into the Ohio economy and employing highly-skilled and well-paid labor in the region.
College Department Project Description
Maxine
Goodman
Levin College
of Urban Affairs
Center for Leadership Development
Center forEmergency Preparedness
Center forEconomic Development

93Section 4 - Sponsored Programs and Research
SEC
TIO
N
4
Midstream Challenges and Downstream Opportunities in the Tri-State Region: This study analyzed the best strategies and challenges associated with the development of a petrochemical industry within the Tri-State region – Ohio, Pennsylvania, and West Virginia. The study found that the target area will likely see growth in wet gas production over the next fi ve years, and will realize a competitive advantage due to its existing infrastructure and a highly-skilled labor force.
JobsOhio: Economic Impact of Potential Expansions and Relocations. The Center partnered with JobsOhio, a private, nonprofi t economic development organization, to assess the potential economic impact of companies looking to expand or relocate in Ohio. The potential economic impact was measured through new construction as well as operations of existing facilities (ranging from IT companies to manufacturing operations). The Center also assisted JobsOhio in preparing data for use in their annual report.
Economic Development Administration (EDA): University Center. As an EDA University Center, the Center focuses on providing technical assistance to local and state public and nonprofi t agencies, assisting in the entrepreneurship, innovation ecology and advanced manufacturing, economic inclusion initiatives and providing data and advisory assistance to governments and nonprofi t organizations within Northeast Ohio and Ohio.
Measuring Entrepreneurial Ecosystems: The Center, in partnership with JumpStart Inc., conducted research for the Ewing Marion Kauffman Foundation to quantitatively and qualitatively explore the indicators of entrepreneurial ecosystems. This study, with support from the Ewing Marion Kauffman Foundation, focuses on two major questions: 1) what are the indicators of an entrepreneurial ecosystem, and which of these indicators best refl ect the ecosystem’s vibrancy and 2) what indicators of entrepreneurial ecosystems are most valuable for entrepreneurs?
2015 Economic Impact of Companies Funded and/or Assisted by the Northeast Ohio Entrepreneurial Signature
Program: This report measures the economic impact of early-stage companies that have been supported by JumpStart Inc. and its partners in the Northeast Ohio Entrepreneurial Signature Program in 2016. Companies included in this report have received signifi cant technical assistance and often direct investment funding from entrepreneurial support organizations in the Entrepreneurial Signature Program.
Housing Impact of Shale Development in Eastern Ohio: The Center, in partnership with the Center for Community Planning and Development, prepared three reports monitoring the Utica shale industry and its effect on the housing market in eight counties in Ohio (Belmont, Carroll, Columbiana, Guernsey, Harrison, Jefferson, Monroe, and Noble). The study, commissioned by the Ohio Housing Finance Agency (OHFA), aims to illustrate trends of the housing market, including affordable housing, in relation to the oil and gas shale development industry and possible infl ux of the transient workers. The study published three reports and three data dashboards.
Staging Cleveland: A Theater Industry Study: This study analyzes the economic impact of the theater industry within Cuyahoga County as well as providing a descriptive analysis of businesses and occupations associated with the industry, and the geographic locations of theaters within the county. The study fi nds that the theater sector is invaluable to the county’s overall economy due to its intrinsic participation within the artistic community along with other industries in the region. Challenges to this industry were qualitatively evaluated and presented.
Defi ning Place Image: This study evaluates defi ning a place’s image through its brand, visual image, reputation, sense of place, and identity. The study concludes that place image is a signifi cant factor in terms of investment, site selection, and tourism.
Cleveland Development Advisors: Analysis of the New Market Tax Credits. The Center prepared several reports for the Cleveland Development Advisors detailing the economic impact of New Markets Tax Credit (NMTC) projects and demographics of census tracts of NMTC projects.
Cleveland Foundation: Evaluation of the Greater University Circle Community Wealth Building Initiative. The evaluation of the Greater University Circle assesses progress toward four goals: buy local, hire local, live local, and community engagement. The Center’s study assessed the overall governance, identifi ed strengths and challenges, and measured the progress of specifi c strategies and programs implemented under each goal.
The Center had numerous grants and projects this year with the City of Cleveland on a market analysis for Mayor Frank Jackson’s Neighborhood Transformation Initiative; also with Bioenterprise and Health Tech Corridor on development of a regional economic strategy focused on the growth of Cleveland’s life science and health sectors; with the Cleveland Foundation on “The Pulse,” which monitors Cleveland’s economic restructuring; and ongoing programmatic initiatives and analysis for Cleveland’s community leaders.
The Center for Community Planning and Development continues work with The Cleveland Foundation on the Cleveland Foundation Public Service Fellowship program for recent College graduates. This year-long fellowship offers emerging young leaders from across the country the skills and experience they will need to launch careers in the public sector. Nine Fellows were in residence yearlong and in paid Fellowship
College Department Project Description
Center for Population Dynamics
Center for Community Planning and Development

Cleveland State University / 2017 Book of Trends94
College Department Project Description
placements through September 2016 with six public sector organizations in Greater Cleveland.
Economic Inclusion Program and Initiative of Greater University Circle works closely with the Cleveland Foundation, City of Cleveland, and anchor partners Cleveland Clinic, University Hospitals, and Case Western Reserve University to connect the economic strength of the anchors to the community through projects focused on hiring, procurement, and community engagement and housing. As the qualitative data and evaluation partner, CSU’s Levin College provides an annual evaluation and has tracked metrics of the key project elements above and published a summary of the work in collaboration with the Democracy Collaborative (see Cleveland’s Greater University Circle Initiative: An Anchor Based Strategy for Change; Wright, Hexter and Downer, 2016)
The Center, working with Norman Krumholz, presented a symposium on Equity Planning that resulted in a book to be published by Cornell University Press.
The Center also coordinates College Forums during the year. This past year, Levin has collaborated with Organize Ohio for Ohio Fair Lending Forums; City Club commemorating Hough Riots; Cleveland Restoration Society for Cleveland’s Suburb in the City: The Development and Growth of Lee Harvard; and Center for Ecological Culture, Inc. for Vital Neighborhoods-Local Money/Local Finance Public Forum.
The Unger Program serves to foster economic and community development through independent research, civic education, and engagement.
The Community Planning Program completed a housing study for the City of Oberlin, a retail analysis for Slavic Village; and an impact study for Westown CDC.
The Center has led a set of projects funded by the Nonprofi t Academic Centers Council (NACC), including board leadership and development and service as host institution for national member organization of Universities. Projects include program development involving accreditation processes for nonprofi t academic program pedagogy, and building the fi eld as an autonomous body of research, education and service. The Center obtained two other grants this year working with Aerozone Alliance and the Cleveland-Marshall College of Law Alumni Association. The Center also held an Author’s Conference jointly with the National Center on Nonprofi t Enterprise (NCNE) titled “Wise Decision-Making in Uncertain Times.” The Center is in year two of a grant from the Mott Foundation to achieve open access status for the journal Nonprofi t Policy Forum. Dr. Stuart Mendel researched and co-authored a book titled “Partnerships the Nonprofi t Way: What Works, What Doesn’t.”
The Center performed an Electricity Competition Study commissioned by the Northeast Ohio Public Energy
Council. The Center also published its fi rst Ohio Shale Investment Dashboard which was commissioned by JobsOhio. Finally, the Center was awarded a $200,000 grant for Microgrid Planning. The study is driven by renewable power and smart grid technology and how these grids might be built and to assign a value identifi able to economic development stimulus.
The Center provides analysis and reports on city-wide housing indicators, vacant properties, residential abatements, and American Community Survey (ACS) data for local census geographies. It also provides large format maps of Ohio General Assembly districts to the University for distribution to the legislators. The Center also teaches introductory workshops for a GIS course.
The Center continues to provide a Co-op Internship Program along with mentoring opportunities for students and has received $150,000 in the past two years from the Ohio Board of Regents (OBOR).
Dr. Sanda Kaufman collaborated with two physicists, M. Kaufman and H. Diep (France), on a project examining social confl ict dynamics through a network model. This model provides information a group can use to devise its strategy in response to the dynamics at work. This anticipatory approach supports decisions robust to contextual challenges, needed in planning and policy-making. This project has yielded three, peer-reviewed articles and several peer-reviewed conference presentations. The end-of-year editorial of the journal Nature (2016) recognized the anticipation approach is sensible given failures to correctly predict outcomes of some recent events: “Physicists last month published such a mean-fi eld model, which they say describes the dynamics of two-group confl icts on the basis of the interactions between group members, opponents and how willing people are to change their minds (Diep et al. 2017). The model’s output shows whether each side in a political dispute will tend towards negotiation or confl ict, and the often wild swings and oscillations in their attitudes towards each outcome along the way. It is not a tool of prediction, the physicist’s caution, but rather one of anticipation for strategic purposes. That seems a sensible approach given recent events, which have shaken faith in predictions of all sorts.”
Center for Nonprofi t Policy & Practice
Energy Policy Center
Norther Ohio Data Information Service (NODIS) Center
Ohio Center for the Advancement of Women in Public Service
Urban Studies

95Section 4 - Sponsored Programs and Research
SEC
TIO
N
4
College Department Project Description
Dr. Meghan Rubado published a paper entitled “Preventing the Use of Deadly Force: The Relationship between Police Agency Policies and Rates of Offi cer-Involved Gun Deaths,” with co-author Jay T. Jennings, in a special issue of Public Administration Review dedicated to the topic of policing and race. The article examined the incidence of offi cer-involved fatal shootings of civilians by police departments across the United States and found that agencies that require an offi cer to fi le a report when they point their gun at someone have systematically lower rates of these fatalities.
Dr. Meghan Rubado also published “Local Response to Water Crisis: Explaining Variation in Usage Restrictions during a Texas Drought,” with co-author Megan Mullin, in Urban Affairs Review. The article used data on drought conditions, population demographics, and institutional features of water districts in Texas to examine why some districts imposed restrictions on their users during extreme drought, while others did not.
Professors J. Rosie Tighe, Megan Hatch, and Joe Mead published “Source of Income Discrimination and Fair Housing Policy” in the Journal of Planning Literature. The article discusses the housing choice voucher program, and the challenges to achieving its two primary goals: reducing concentrations of poverty and the social problems it causes; and providing poor households with greater access to higher-opportunity neighborhoods. One of the most prominent barriers to success is that, in most cities and states, local law allows landlords to discriminate against potential tenants on the grounds of their ‘‘source of income’’ (SOI). This article reviews the literature on discrimination of voucher recipients and the potential for SOI antidiscrimination laws to mitigate some of these negative outcomes.
Drs. Joanna Ganning and J. Rosie Tighe received funding from the National Institute for Transportation and Communities, a consortium funded by the U.S. Department of Transportation, for the project What Do We Know About Location Affordability in U.S. Shrinking Cities. The project sought to evaluate the Location Affordability Index (LAI), which estimates housing and transportation costs for various household types at the neighborhood level, including its methods and assumptions, and its applicability to shrinking cities like Cleveland. Dr. Joanna Ganning authored the fi rst article to emerge from the project. The piece titled “It’s Good but is it Right? An Under-the-Hood View of the Location Affordability Index” has been published as open access in Housing Policy Debate. The article fi nds that the LAI generally overestimates housing costs, but more in urban settings and more for renters. The cost estimates for transportation could not be replicated, suggesting the need for more reliable data on transit use and better availability of other data. Beyond this publication, the funded research also included a survey of approximately 500 households in neighborhoods in Cleveland. The survey reinforces the research from the fi rst half of the project: the LAI over-estimates housing costs. The survey also reveals that the LAI over-estimates transportation costs. Despite facing lower-than-expected costs both in housing and transportation, however, households in our survey still face severe challenges with affordability.
Dr. Stephanie Ryberg-Webster published “Heritage Amid an Urban Crisis” in the journal Cities, in which she explores the role of preservation in neighborhood development within the context of urban shrinkage. Using the qualitative case study of Cleveland’s Slavic Village, Dr. Ryberg-Webster fi nds that neighborhood leaders value heritage, yet historic fabric is in peril as traditional preservation regulations and incentives are insuffi cient given the scale of decline. Dr. Ryberg-Webster concludes the preservation profession needs to consider new, creative, and even radical approaches that respond to the challenges of urban shrinkage.
With Dr. Kelly Kinahan, former doctoral student at Levin, Dr. Stephanie Ryberg-Webster published “Historic Preservation in Declining City Neighborhoods” in the journal Urban Studies. This study explores the use of federal historic tax credits across neighborhoods in declining, “legacy” cities such as Cleveland. The research demonstrates that tax credit investments take place across all neighborhoods, including very low-income and highly distressed communities, countering arguments that there is no viable real estate market in this context.
Department Chair Dr. Wendy Kellogg published two articles this past year with co-authors. The fi rst article, “The Economic Value of Tree Preservation in a Weak Land Development Market,” appeared in the Journal of Arboriculture & Urban Forestry with co-authors Dr. Brian Mikelbank, Dr. Robert Laverne (former Levin doctoral student), and Kathryn Hexter, Center for Planning and Community Development, Levin College. The research investigated the value of preservation of tree canopy on sale prices of homes in six counties of northeast Ohio. The work was funded by the Ohio Lake Erie Commission and the Ohio Water Resources Council. A second article, “Network Structure and Adaptive Capacity in Watershed Governance,” was published in the Journal of Environmental Planning and Management with co-author Dr. Aritree Samanta, a former doctoral student at the Levin College. The research investigated how changes to the structure of inter-organizational networks in the Chagrin River watershed facilitated adaptation in function to achieve improved capacity for watershed management. The work was partially funded by a Faculty Scholarship Initiative grant from the CSU Research Offi ce.
Source: Highlights were submitted to the Offi ce of Research by the Deans’ Offi ces of the Colleges.

Cleveland State University / 2017 Book of Trends96
Name Established Website
Bioethics Center 2002 http://www.csuohio.edu/class/bioethics/
Center for Advanced Control Technologies (CACT) 1995 http://cact.csuohio.edu/
Center for Advancements in Renewable Energy (CARE) 2010 http://www.csuohio.edu/engineering/care/home.html
Center for Arts and Innovation 2005 http://www.csuohio.edu/class/cai/
Center for Community Planning and Development 2009 http://www.urban.csuohio.edu/community_planning/
Center for Economic Development 1986 http://www.urban.csuohio.edu/economicdevelopment/
Center for Emergency Preparedness 1984 http://urban.csuohio.edu/cep/
Center for Gene Regulation in Health and Disease 2008 http://www.csuohio.edu/sciences/grhd.html
Center for Healing Across Cultures 2005 http://www.csuohio.edu/sciences/dept/chac/
Center for Health Law and Policy 2009 http://www.law.csuohio.edu/academics/chlp
Center for Innovation and Entrepreneurship 2008 http://www.csuohio.edu/business/business-centers/ center-for-innovation-and-entrepreneurship
Center for Leadership Development 1993 http://www.urban.csuohio.edu/leadership/
Center for Nonprofi t Policy and Practice 1970 http://www.urban.csuohio.edu/nonprofi t/
Center for Population Dynamics 2014 http://urban.csuohio.edu/cpd/
Center for Public History and Digital Humanities 2008 http://csudigitalhumanities.org
Center for Public Management 1982 http://www.urban.csuohio.edu/publicmanagement/
Center for Research in Electronics and Aerospace 2003 http://www.csuohio.edu/engineering/create/ Technology (CREATE)
Center for Rotating Machinery Dynamics and Control (RoMaDyC) 2006 http://academic.csuohio.edu/romadyc/
Center for Urban Education (CUE) 2010 http://www.csuohio.edu/cehs/centers/cue.html
Communication Research Center 1976 http://csuw3.csuohio.edu/class/com/CRChome.html
Criminology Research Center 2008 http://www.csuohio.edu/class/criminologyresearch/
Fenn Research and Development Institute (FRDI) 2009 http://www.csuohio.edu/engineering/frdi/home.html
Global Business Center 2002 http://www.csuohio.edu/business/global/
Great Lakes Environmental Finance Center 1995 http://www.urban.csuohio.edu/glefc/
Housing Research and Policy Program 1982 http://urban.csuohio.edu/housing/
Northern Ohio Data and Information Service (NODIS) 1982 http://www.urban.csuohio.edu/nodis/
Paul J. Everson Center for the Study of Real Estate 1992 http://www.csuohio.edu/business/realestate/ Brokerage/Agency and Markets
Poetry Center 1962 http://www.csuohio.edu/poetrycenter/
The Ohio Center for the Advancement of Women in Public Service 2001 http://www.urban.csuohio.edu/womenscenter/
The Sustainable Business Center 2005 http://www.csuohio.edu/business/sustainability
The Urban Center 1979 http://www.urban.csuohio.edu/urban_center/
University Transportation Center 2004 http://www.csuohio.edu/engineering/utc/
Wright Center for Sensor System Engineering (WCSSE) 2007 http://www.csuohio.edu/research/wcsse/
Table 4.12: Cleveland State University Research Centers and Institutes
Notes: N/A Data unavailable; Source: http://www.csuohio.edu/research/centers.html

97Section 4 - Sponsored Programs and Research
SEC
TIO
N
4
Tabl
e 4.
13:
Past
Rec
ipie
nts
of D
isti
ngui
shed
Fac
ulty
Aw
ards
by
Aw
ard
Type
199
5-20
15
cont
inue
d on
nex
t pag
e
Typ
e A
wa
rd
Tea
ch
ing
Serv
ice
R
esea
rch
Yea
r N
am
e
Dep
art
men
t N
am
e
Dep
art
men
t N
am
e
Dep
art
men
t
1996
Sh
erw
ood
D. S
illim
an
M
ath
em
ati
cs
Mu
rali D
. Na
ir
Socia
l W
ork
S
ara
h M
att
hew
s
Socio
log
y
1997
Ra
vin
dra
R. K
am
ath
Fin
an
ce
Da
vid
F. F
ort
e
La
w
Jose J
. La
bra
dor
Mod
ern
La
ng
ua
ges
R
ob
ert
N. S
ollod
P
sych
olo
gy
1998
Willia
m A
. Bea
sle
y
Cu
rric
ulu
m &
Fou
nd
ati
on
s
Va
leri
e D
. Georg
e
Nu
rsin
g
Ric
ha
rd B
ing
ha
m
Urb
an
Stu
die
s
M
ajid
Ra
sh
idi
Mech
an
ica
l E
ng
ineeri
ng
E
dw
ard
W. H
ill
Urb
an
Stu
die
s
1999
Sa
nd
a K
au
fma
n
Urb
an
Stu
die
s
Lyn
n D
eeri
ng
H
PE
RD
R
am
a S
. R. G
orl
a
Mech
an
ica
l E
ng
ineeri
ng
Joh
n P
. Wilson
P
sych
olo
gy
Ric
ha
rd M
. Perl
off
C
om
mu
nic
ati
on
2000
Ed
wa
rd G
. Th
om
as
Ma
rketi
ng
D
avid
Atk
in
Com
mu
nic
ati
on
M
ich
ael J. T
evesz
BG
ES
2001
Lee A
. Ma
ka
la
His
tory
Jill M
. Bla
ck
H
PE
RD
Th
om
as D
on
ald
son
A
rt
H
eid
i M
eie
r A
ccou
nti
ng
N
orm
an
Kru
mh
olz
U
rba
n S
tud
ies
Joh
n G
rep
pin
E
ng
lish
2002
Da
vid
W. B
all
Ch
em
istr
y
Da
nie
l D
. Dra
ke
CA
SA
L
Ma
rk A
sh
cra
ft
Psych
olo
gy
C
aro
lyn
Lin
C
om
mu
nic
ati
on
2003
Gle
nn
Good
ma
n
Occu
pa
tion
al Th
era
py
Pa
tric
ia F
alk
La
w
Ba
hm
an
Gh
ora
sh
i C
hem
ica
l E
ng
ineeri
ng
R
alp
h M
aw
dsle
y
CA
SA
L
Bh
ush
an
Wa
dh
wa
M
ath
em
ati
cs
Ba
och
ua
n G
uo
Ch
em
istr
y
2004
Ra
ma
S. R
. Gorl
a
Mech
an
ica
l E
ng
ineeri
ng
S
usa
n E
. Kog
ler
Hill
Com
mu
nic
ati
on
A
nd
rew
Rin
dfl
eis
ch
M
usic
E
liza
beth
Welf
el
CA
SA
L
Mie
ko K
. Sm
ith
S
ocia
l W
ork
Jerz
y T
. Sa
wic
ki
Mech
an
ica
l E
ng
ineeri
ng
2005
Eri
c Z
iole
k
Mu
sic
R
avin
dra
R. K
am
ath
Fin
an
ce
Mic
ha
el K
ala
fati
s
Ch
em
istr
y
Joh
n P
. Holc
om
b, J
r.
Ma
them
ati
cs
Ch
ery
l P.
McC
ah
on
N
urs
ing
C
ath
eri
ne H
an
sm
an
C
AS
AL
2006
Don
ald
Ra
mos
His
tory
A
nd
rew
Gro
ss
Ma
rketi
ng
Leo W
.Jeff
res
Com
mu
nic
ati
on
E
ileen
Berl
in R
ay
Com
mu
nic
ati
on
O
rha
n T
alu
C
hem
ica
l &
Bio
med
ica
l
En
gin
eeri
ng
2007
Ste
ph
en
La
zaru
s
La
w
Lily N
g
Ch
em
istr
y
Mir
on
Ka
ufm
an
P
hysic
s
M
ek
ki B
aya
ch
ou
C
hem
istr
y
2008
Ellio
t R
. In
gers
oll
CA
SA
L
Sh
eld
on
Gelm
an
La
w
An
gelin
Ch
an
g
Mu
sic
D
avid
F. F
ort
e
La
w
Ba
rba
ra H
. Ma
rgoliu
s
Ma
them
ati
cs
Joh
n F
. Op
rea
M
ath
em
ati
cs
2009
Jea
rl D
. Wa
lker
Ph
ysic
s
Ba
rba
ra K
. Mod
ney
BG
ES
C
rysta
l M
. Weym
an
B
GE
S
M
ura
li D
. Na
ir
Socia
l W
ork
W
illia
m M
. Bow
en
U
rba
n S
tud
ies
Den
a S
. Da
vis
La
w
2010
Su
sa
n S
. Ba
zyk
H
ea
lth
Scie
nces
Da
vid
Bell
Ch
em
istr
y
Joh
n A
.C. G
rep
pin
E
ng
lish
S
usa
n J
. Beck
er
La
w
Ma
gg
ie J
ack
son
S
ocia
l W
ork
B
ars
an
jit
Ma
zum
der
BG
ES
2011
Din
ah
Volk
Te
ach
er
Ed
uca
tion
B
eth
Ek
elm
an
H
ea
lth
Scie
nces
Ja
mes L
ock
P
hysic
s
V
era
Vog
els
an
g-C
oom
bs
Urb
an
Stu
die
s
Ma
ry E
llen
Wa
ith
e
Ph
ilosop
hy

Cleveland State University / 2017 Book of Trends98
Tabl
e 4.
13:
Past
Rec
ipie
nts
of D
isti
ngui
shed
Fac
ulty
Aw
ards
by
Aw
ard
Type
199
5-20
17
2012
Ka
thry
n C
. Ma
cC
lusk
ie
CA
SA
L
Ron
ald
J. A
ba
te
Tea
ch
er
Ed
uca
tion
X
ue-L
on
g S
un
C
hem
istr
y
Joh
n J
. Jezi
oro
wsk
i H
ea
lth
Scie
nces
Ch
risto
ph
er
a. M
aller
Socia
l W
ork
2013
Pete
r S
. Du
nh
am
A
nth
rop
olo
gy
Ash
uto
sh
Dix
it
Ma
rketi
ng
S
iu-T
un
g Y
au
E
lectr
ica
l &
Com
pu
ter
En
gin
eeri
ng
C
ath
eri
ne H
. Mon
ag
ha
n
CA
SA
L
Ken
neth
E. S
pa
rks
Hea
lth
, Ph
ysic
al E
du
ca
tion
, Ju
sti
n C
lem
en
t P
err
y
CA
SA
L
Recre
ati
on
, an
d D
an
ce
2014
Mek
ki B
aya
ch
ou
C
hem
istr
y
Joa
nn
e E
liza
beth
Good
ell
Tea
ch
er
Ed
uca
tion
A
min
Zh
ou
C
hem
istr
y
Jill E
. Ru
dd
C
om
mu
nic
ati
on
M
ich
ael J. G
eit
her
En
glish
S
am
an
tha
Ba
sk
ind
A
rt
2015
Holly A
. Hols
ing
er
Th
ea
ter
an
d D
an
ce
Jorg
e E
. Ga
tica
C
hem
ica
l a
nd
Bio
med
ica
l D
an
iel S
imon
E
lectr
ica
l a
nd
Com
pu
ter
En
gin
eeri
ng
B
ria
n E
. Ha
rper
Cu
rric
ulu
m a
nd
Fou
nd
ati
on
s
E
ng
ineeri
ng
C
hri
sto
ph
er
L. S
ag
ers
L
aw
2016
Mic
ha
el B
ord
en
La
w
Ch
ery
l B
rack
en
C
om
mu
nic
ati
on
A
nto
n K
om
ar
Bio
log
y, G
eolo
gy &
En
vir
on
men
tal
Scie
nce
P
on
g C
hu
E
lectr
ica
l a
nd
Com
pu
ter
Joa
n T
hom
an
N
urs
ing
K
ath
eri
ne J
ud
ge
Psych
olo
gy
En
gin
eeri
ng
2017
Petr
u F
od
or
Ph
ysic
s
Deb
bie
Ja
ck
son
Te
ach
er
Ed
uca
tion
B
ibo L
i
Bio
log
y, G
eolo
gy &
En
vir
on
men
tal
Scie
nce
W
en
bin
g Z
ha
o
Ele
ctr
ica
l E
ng
ineeri
ng
&
Fre
deri
ck
Ka
rem
E
ng
lish
Z
hiq
ian
g G
ao
Ele
ctr
ica
l E
ng
ineeri
ng
&
Com
pu
ter
Scie
nce
C
om
pu
ter
Scie
nce
So
urc
e: C
SU
Pro
vost’s O
ffi c
e
Typ
e A
wa
rd
Tea
ch
ing
Serv
ice
R
esea
rch
Yea
r N
am
e
Dep
art
men
t N
am
e
Dep
art
men
t N
am
e
Dep
art
men
t

SEC
TIO
N
5
Retention & Graduation
5Book of Trends

Cleveland State University / 2015 Book of Trends100
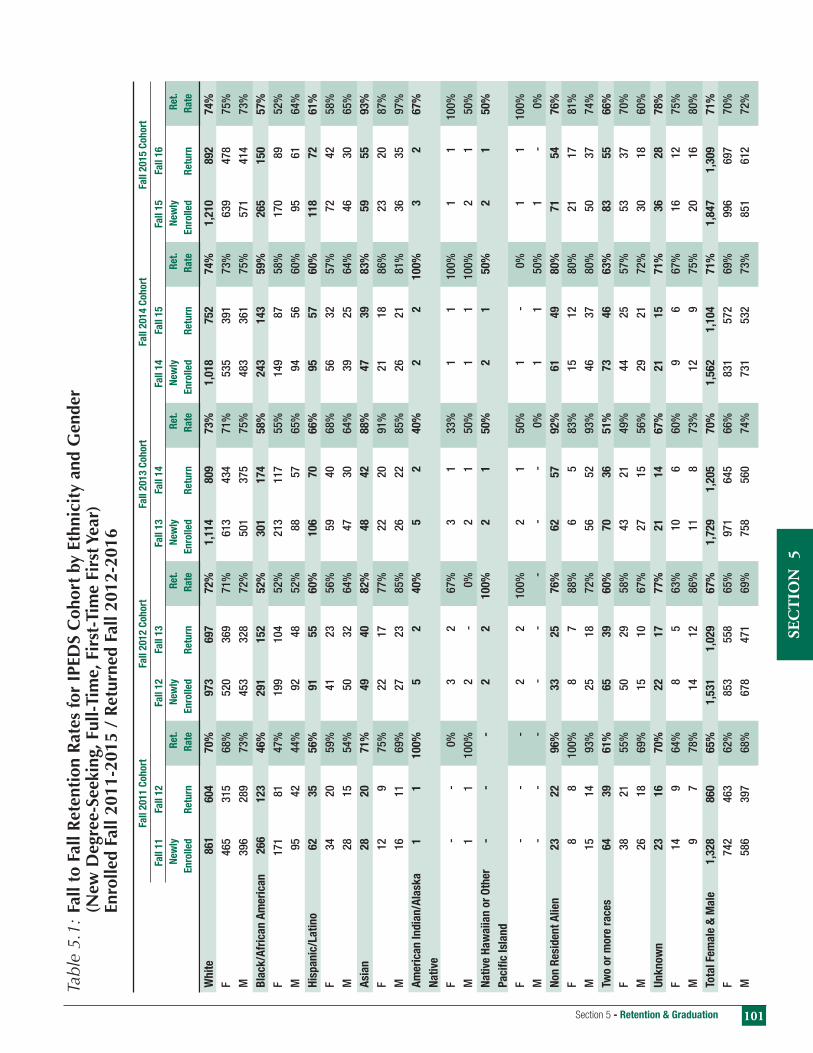
101Section 5 - Retention & Graduation
SEC
TIO
N
5
Fa
ll 2
011 C
oh
ort
Fa
ll 2
012 C
oh
ort
Fa
ll 2
013 C
oh
ort
Fa
ll 2
01
4 C
oh
ort
Fa
ll 2
01
5 C
oh
ort
Fall 1
1
Fall 1
2
Fa
ll 1
2
Fall
13
Fa
ll 1
3
Fall
14
Fa
ll 1
4
Fall 1
5
Fa
ll 1
5
Fall 1
6
New
ly
R
et.
N
ew
ly
R
et.
N
ew
ly
R
et.
N
ew
ly
R
et.
N
ew
ly
R
et.
En
rolled
R
etu
rn
Ra
te
En
roll
ed
R
etu
rn
Ra
te
En
roll
ed
R
etu
rn
Ra
te
En
rolled
R
etu
rn
Ra
te
En
rolled
R
etu
rn
Ra
te
Wh
ite
86
1
60
4
70
%
97
3
69
7
72
%
1,1
14
8
09
7
3%
1
,01
8
75
2
74
%
1,2
10
8
92
7
4%
F
465
315
68%
52
0 36
9 71
%
613
434
71%
53
5 39
1 73
%
639
478
75%
M
39
6 28
9 73
%
453
328
72%
50
1 37
5 75
%
483
361
75%
57
1 41
4 73
%B
lack
/Afr
ica
n A
meri
ca
n
26
6
12
3
46
%
29
1
15
2
52
%
30
1
17
4
58
%
24
3
14
3
59
%
26
5
15
0
57
%
F
171
81
47%
19
9 10
4 52
%
213
117
55%
14
9 87
58
%
170
89
52%
M
95
42
44
%
92
48
52%
88
57
65
%
94
56
60%
95
61
64
%H
isp
an
ic/L
ati
no
62
3
5
56
%
91
5
5
60
%
10
6
70
6
6%
9
5
57
6
0%
1
18
7
2
61
%
F
34
20
59%
41
23
56
%
59
40
68%
56
32
57
%
72
42
58%
M
28
15
54
%
50
32
64%
47
30
64
%
39
25
64%
46
30
65
%A
sia
n
28
2
0
71
%
49
4
0
82
%
48
4
2
88
%
47
3
9
83
%
59
5
5
93
%
F
12
9 75
%
22
17
77%
22
20
91
%
21
18
86%
23
20
87
%M
16
11
69%
27
23
85
%
26
22
85%
26
21
81
%
36
35
97%
Am
eri
ca
n I
nd
ian
/Ala
sk
a
1
1
10
0%
5
2
4
0%
5
2
4
0%
2
2
1
00
%
3
2
67
%
Na
tive
F
- -
0%
3 2
67%
3
1 33
%
1 1
100%
1
1 10
0%M
1 1
100%
2
- 0%
2
1 50
%
1 1
100%
2
1 50
%N
ati
ve H
aw
aii
an
or
Oth
er
-
- -
2
2
10
0%
2
1
5
0%
2
1
5
0%
2
1
5
0%
Pa
cifi
c I
sla
nd
F
- -
- 2
2 10
0%
2 1
50%
1
- 0%
1
1 10
0%M
- -
- -
- -
- -
0%
1 1
50%
1
- 0%
Non
Resid
en
t A
lien
2
3
22
96
%
33
2
5
76
%
62
5
7
92
%
61
4
9
80
%
71
5
4
76
%
F
8 8
100%
8
7 88
%
6 5
83%
15
12
80
%
21
17
81%
M
15
14
93
%
25
18
72%
56
52
93
%
46
37
80%
50
37
74
%Tw
o o
r m
ore
ra
ces
64
3
9
61
%
65
3
9
60
%
70
3
6
51
%
73
4
6
63
%
83
5
5
66
%
F
38
21
55%
50
29
58
%
43
21
49%
44
25
57
%
53
37
70%
M
26
18
69
%
15
10
67%
27
15
56
%
29
21
72%
30
18
60
%U
nk
now
n
23
1
6
70
%
22
1
7
77
%
21
1
4
67
%
21
1
5
71
%
36
2
8
78
%
F
14
9 64
%
8 5
63%
10
6
60%
9
6 67
%
16
12
75%
M
9
7 78
%
14
12
86%
11
8
73%
12
9
75%
20
16
80
%To
tal
Fem
ale
& M
ale
1,3
28
8
60
65
%
1,5
31
1
,02
9
67
%
1,7
29
1
,20
5
70
%
1,5
62
1
,10
4
71
%
1,8
47
1
,30
9
71
%
F
742
463
62%
85
3 55
8 65
%
971
645
66%
83
1 57
2 69
%
996
697
70%
M
58
6 39
7 68
%
678
471
69%
75
8 56
0 74
%
731
532
73%
85
1 61
2 72
%
Tabl
e 5.
1: F
all t
o Fa
ll R
eten
tion
Rat
es fo
r IP
EDS
Coh
ort
by E
thni
city
and
Gen
der
(N
ew D
egre
e-Se
ekin
g, F
ull-
Tim
e, F
irst
-Tim
e Fi
rst Y
ear)
En
rolle
d Fa
ll 20
11-2
015
/ R
etur
ned
Fall
2012
-201
6

Cleveland State University / 2017 Book of Trends102
Tabl
e 5.
2: F
all t
o Fa
ll Re
tent
ion
Rate
s fo
r IP
EDS
Coh
ort (
New
Deg
ree-
Seek
ing,
Ful
l-Tim
e) b
y C
olle
ge
Enro
lled
Fall
2011
-201
5 /
Ret
urne
d Fa
ll 20
12-2
016
Fa
ll 2
011 C
oh
ort
Fa
ll 2
012 C
oh
ort
Fa
ll 2
013 C
oh
ort
Fa
ll 2
01
4 C
oh
ort
Fa
ll 2
01
5 C
oh
ort
Fall 1
1
Fall 1
2
Fa
ll 1
2
Fall
13
Fa
ll 1
3
Fall
14
Fa
ll 1
4
Fall 1
5
Fa
ll 1
5
Fall 1
6
Ret.
R
et.
R
et.
R
et.
R
et.
En
rolled
R
etu
rn
Ra
te
En
roll
ed
R
etu
rn
Ra
te
En
roll
ed
R
etu
rn
Ra
te
En
roll
ed
R
etu
rn
Ra
te
En
rolled
R
etu
rn
Ra
te
Busi
ness
1
39
79
5
7%
1
85
118
6
4%
2
39
173
7
2%
2
27
170
7
5%
2
40
164
6
8%
CLAS
S 4
65
287
6
2%
4
48
289
6
5%
5
17
355
6
9%
4
31
306
7
1%
2
90
204
7
0%
Educ
atio
n 8
9
51
5
7%
6
9
43
6
2%
9
7
57
5
9%
5
5
38
6
9%
8
6
54
6
3%
Engi
neer
ing
148
1
19
80
%
203
1
62
80
%
215
1
79
83
%
223
1
70
76
%
296
2
33
79
%
Nurs
ing
82
5
7
70
%
116
8
0
69
%
135
9
2
68
%
121
7
9
65
%
141
9
4
67
%
Scie
nce
316
2
23
71
%
393
2
83
72
%
416
2
88
69
%
357
2
56
72
%
451
3
41
76
%
Urba
n Af
fairs
1
3
9
69
%
9
7
78
%
8
5
63
%
12
1
0
83
%
8
7
88
%
Unde
rgra
duat
e St
udie
s 7
6
35
4
6%
1
08
47
4
4%
1
02
56
5
5%
1
36
75
5
5%
3
35
212
6
3%
TO
TAL
1,3
28
8
60
65
%
1,5
31
1
,02
9
67
%
1,7
29
1
,20
5
70
%
1,5
62
1
,10
4
71
%
1,8
47
1
,30
9
71
%

103Section 5 - Retention & Graduation
SEC
TIO
N
5
Table 5.3: Attended, Graduated and Retained Fall to Fall Student Tracking (IPEDS Cohort)Fall
Fall 2009 Cohort 2010 2011 2012 2013 2014 2015 2016
Attended 1,127 718 559 504 260 96 46 25 Graduated - - 3 22 249 401 447 463 % Graduated of Cohort 0% 0% 0% 2% 22% 36% 40% 41%% Retained 100% 64% 50% 46% 30% 13% 7% 4%
Figure 5.3: Fall 2009 IPEDS Cohort Attended, Graduated and Retained
Table 5.4: Attended, Graduated and Retained Fall to Fall Student Tracking (Transfer Cohort*)
Fall
Fall 2009 Cohort 2010 2011 2012 2013 2014 2015 2016
Attended 979 699 408 192 85 32 23 13 Graduated - 52 231 410 501 549 563 570 % Graduated of Cohort 0% 5% 24% 42% 51% 56% 58% 58%% Retained 100% 75% 55% 34% 18% 7% 6% 3%
Figure 5.4: Fall 2009 Full-Time Transfer Cohort Attended & Graduated*
Notes: Cohorts are First-Time, Full-Time, Degree-Seeking Freshmen or Transfers students as of Fall Semester 2009 enrollment fi le. “Attended” or “Graduated” status is determined from the IR
enrollment and graduation tables for each term listed. These charts measure the number of students who have graduated by the end of a given fall semester. Offi cal IPEDS graduation rates are
based on the number of students who graduate by the end of each summer semester. See table 5.5a for offi cial 6 year grad rates.
0
200
400
600
800
1,000
1,200
2016201520142013201220112010Fall 2009Cohort
0
200
400
600
800
1,000
2016201520142013201220112010Fall 2009Cohort

Cleveland State University / 2017 Book of Trends104
Table 5.5a: Undergraduate First-Year, Full-Time Degree-Seeking IPEDS Cohort Graduation
Cohort Cohort Size 1st Year 2nd Year 3rd Year 4th Year 5th Year 6th Year 7th Year 8th Year
Fall 2006 947
Graduated 0 0 6 108 259 318 350 363
% Graduated 0% 0% 1% 11% 27% 34% 37% 38%
Fall 2007 1,132
Graduated 0 1 15 121 276 361 385 401
% Graduated 0% 0% 1% 11% 24% 32% 34% 35%
Fall 2008 1,007
Graduated 0 2 14 150 324 395 415 424
% Graduated 0% 0% 1% 15% 32% 39% 41% 42%
Fall 2009 1,127
Graduated 0 2 10 181 361 437 459
% Graduated 0% 0% 1% 16% 32% 39% 41%
Fall 2010 1,148
Graduated 0 5 25 237 416 470
% Graduated 0% 0% 2% 21% 36% 41%
Fall 2011 1,328
Graduated 0 3 25 292 505
% Graduated 0% 0% 2% 22% 38%
Fall 2012 1,531
Graduated 0 3 48 364
% Graduated 0% 0% 3% 24%
Fall 2013 1,729
Graduated 0 4 54
% Graduated 0% 0% 3%
Fall 2014 1,562
Graduated 0 9
% Graduated 0% 1%
Fall 2015 1,847
Graduated 0
% Graduated 0%
Graduated: represents the cumulative number of distinct cohort students receiving a CSU baccalaureate award between the student’s fi rst term and the term prior to a given year.

105Section 5 - Retention & Graduation
SEC
TIO
N
5
Tabl
e 5.
5b: U
nder
grad
uate
Fir
st-Y
ear,
Full-
Tim
e D
egre
e-Se
ekin
g IP
EDS
Coh
ort
Ret
enti
on R
ate
En
rolled
: re
pres
ents
the
num
ber
of c
ohor
t st
uden
ts e
nrol
led
as a
n un
derg
radu
ate
in a
giv
en t
erm
exc
ludi
ng t
hose
who
have
rec
eive
d a
bach
elor
’s d
egre
e fr
om C
SU
prior
to
the
repo
rted
ter
m.
Gra
du
ati
on
: W
e ha
ve d
ecid
ed t
o ad
d gr
adua
tion
data
to
this
tab
le. U
nlik
e en
rollm
ent
num
bers
, whi
ch r
epre
sent
the
disc
rete
num
ber
of s
tude
nts
enro
lled
in a
giv
en t
erm
, gra
duat
ion
num
bers
rep
rese
nt t
he t
otal
num
ber
of s
tude
nts
from
the
coho
rt w
ho h
ave
grad
uate
d up
to
a gi
ven
poin
t in
tim
e. A
dditi
onal
ly, g
radu
atio
n da
ta la
gs b
ehin
d en
rollm
ent
data
; as
suc
h,
ther
e ar
e ty
pica
lly t
wo
sem
este
rs f
or a
giv
en c
ohor
t w
hich
we
have
com
plet
e en
rollm
ent
data
but
inco
mpl
ete
grad
uatio
n
data
. In
thes
e tw
o se
mes
ters
, we
do n
ot c
alcu
late
the
“%
Gra
d,”
“% E
nrol
led/
Gra
d,”
or t
he %
Sto
pped
Out
” ra
tes.
Note
: C
ohor
t D
efi n
ition
1) A
stu
dent
att
endi
ng a
ny in
stitu
tion
of h
ighe
r le
arni
ng f
or t
he fi r
st t
ime
at t
he u
nder
grad
uate
leve
l, in
clud
es s
tude
nts
enro
lled
in t
he f
all t
erm
who
att
ende
d co
llege
for
the
fi r
st t
ime
in t
he p
rior
sum
mer
ter
m, a
lso
incl
udes
stu
dent
s w
ho
ente
red
CSU
with
adv
ance
d st
andi
ng (co
llege
cre
dits
ear
ned
befo
re g
radu
atio
n fr
om h
igh
scho
ol).
2) B
y th
e un
iver
sity
cen
sus
date
, the
stu
dent
has
reg
iste
red
for
12 o
r m
ore
cred
it ho
urs
in t
he f
all s
emes
ter.
3) T
he s
tude
nt is
see
king
a b
acca
laur
eate
deg
ree.
Ye
ar
One
Year
Two
Year
Thre
e Ye
ar
Four
Year
Five
Ye
ar
Six
Ye
ar
Sev
en
Year
Eig
ht
TER
M
C
ohor
t S
ize
1st S
pri
ng
2nd F
all
2nd S
pri
ng
3rd F
all
3rd S
pri
ng
4th F
all
4th S
pri
ng
5th F
all
5th S
pri
ng
6th F
all
6th S
pri
ng
7th F
all
7th S
pri
ng
8th F
all
8th S
pri
ng
Fall
2008
Enro
lled
1,0
07
884
665
606
529
482
453
349
240
141
89
59
36
28
21
17
%
Stil
l Enr
olle
d
88%
66
%
60%
53
%
48%
45
%
35%
24
%
14%
9%
6%
4%
3%
2%
2%
Gr
adua
ted
1
4 13
27
12
8 22
6 31
3 35
1 38
6 40
2 41
1 41
9 42
4
% G
radu
ated
0%
0%
1%
3%
13%
22
%
31%
35
%
38%
40
%
41%
42
%
42%
St
oppe
d Ou
t
123
342
400
474
512
527
530
541
553
567
562
569
568
567
566
%
Sto
pped
Out
12%
34
%
40%
47
%
51%
52
%
53%
54
%
55%
56
%
56%
57
%
56%
56
%
56%
Fall
2009
Enro
lled
1,1
27
969
718
630
559
524
504
355
260
147
96
62
46
31
% S
till E
nrol
led
86
%
64%
56
%
50%
46
%
45%
31
%
23%
13
%
9%
6%
4%
3%
Grad
uate
d
1 3
9 22
15
8 24
9 34
5 40
1 42
9 44
7 45
7
%
Gra
duat
ed
0%
0%
1%
2%
14
%
22%
31
%
36%
38
%
40%
41
%
Stop
ped
Out
15
8 40
9 49
6 56
5 59
4 60
1 61
4 61
8 63
5 63
0 63
6 63
4 63
9
%
Sto
pped
Out
14%
36
%
44%
50
%
53%
53
%
54%
55
%
56%
56
%
56%
56
%
57%
Fall
2010
Enro
lled
1,1
48
991
757
681
619
582
525
347
224
124
91
63
% S
till E
nrol
led
86
%
66%
59
%
54%
51
%
46%
30
%
20%
11
%
8%
5%
Grad
uate
d
4 7
20
41
200
311
406
433
462
% G
radu
ated
0%
1%
2%
4%
17%
27
%
35%
38
%
40%
St
oppe
d Ou
t
157
391
463
522
546
582
601
614
619
625
624
% S
topp
ed O
ut
14
%
34%
40
%
45%
48
%
51%
52
%
53%
54
%
54%
54
%
Fa
ll 2011
Enro
lled
1,3
28
1157
860
810
722
681
632
405
266
150
% S
till E
nrol
led
87
%
65%
61
%
54%
51
%
48%
30
%
20%
11
%
Grad
uate
d
1
2 6
22
49
268
377
489
% G
radu
ated
0%
0%
0%
2%
4%
20
%
28%
37
%
Stop
ped
Out
17
1 46
7 51
6 60
0 62
5 64
7 65
5 68
5 68
9
%
Sto
pped
Out
13%
35
%
39%
45
%
47%
49
%
49%
52
%
52%
Fall
2012
Enro
lled
1,5
31
1373
1029
927
823
759
704
432
% S
till E
nrol
led
90
%
67%
61
%
54%
50
%
46%
28
%
Grad
uate
d
2 7
40
79
333
% G
radu
ated
0%
0%
3%
5%
22%
St
oppe
d Ou
t
158
502
602
701
732
748
766
% S
topp
ed O
ut
10
%
33%
39
%
46%
48
%
49%
50
%
Fa
ll 2013
Enro
lled
1,7
29
1557
1205
1062
968
888
% S
till E
nrol
led
90
%
70%
61
%
56%
51
%
Grad
uate
d
0
3 11
47
%
Gra
duat
ed
0%
0%
1%
3%
Stop
ped
Out
17
2 52
4 66
4 75
0 79
4
%
Sto
pped
Out
10%
30
%
38%
43
%
46%
Fall
2014
Enro
lled
1,5
62
1380
1104
973
% S
till E
nrol
led
88
%
71%
62
%
Grad
uate
d
9
%
Gra
duat
ed
1%
St
oppe
d Ou
t
182
458
580
% S
topp
ed O
ut
29%
37
%
Fa
ll 2015
Enro
lled
1,8
47
1655
% S
till E
nrol
led
90
%
Grad
uate
d
0
%
Gra
duat
ed
0%
St
oppe
d Ou
t
192
% S
topp
ed O
ut
10
%
Fa
ll 2016
Enro
lled
1,8
92
1696
% S
till E
nrol
led
90
%
Grad
uate
d
0
%
Gra
duat
ed
0%
St
oppe
d Ou
t
196
% S
topp
ed O
ut
10
%

Cleveland State University / 2017 Book of Trends106
P
erc
en
t C
ha
ng
e
2011-2
012
2012-2
013
2013-2
014
201
4-2
01
5
20
15
-20
16
1
Yea
r 5
Yea
r
Deg
ree L
evel
Ma
jor
Fem
ale
M
ale
Fe
ma
le
Ma
le
Fem
ale
M
ale
Fe
ma
le
Ma
le
Fem
ale
M
ale
Ba
ch
elo
r’s D
eg
ree
Acco
untin
g 4
2
36
4
0
39
3
2
38
3
1
41
4
0
50
25
%
15%
Bu
sine
ss E
cono
mic
s 3
8
2
8
3
1
0
1
5
-
4
-33%
-6
4%
Com
pute
r and
Info
rmat
ion
Scie
nce
2
8
3
18
2
1
6
5
20
1
2
3
-4%
14
0%
Com
pute
r Sci
ence
-
1
-
7
1
3
-
2
-
5
15
0%
400%
Fi
nanc
e 1
3
28
1
6
31
8
2
5
13
3
5
15
4
0
15%
34
%
Gene
ral B
usin
ess
47
5
9
57
5
4
54
4
7
60
5
4
36
4
8
-26%
-2
1%
Gene
ral B
usin
ess
- M
obile
-
-
-
-
1
1
6
7
7
9
23
%
--
Info
rmat
ion
Syst
ems
8
27
7
1
8
2
21
4
1
9
7
22
26
%
-17%
In
tern
atio
nal B
usin
ess
20
2
0
13
1
3
10
5
7
9
8
1
0
13%
-5
5%
Man
agem
ent &
Lab
or R
elat
ions
2
3
18
2
4
7
16
1
3
16
8
1
8
9
13%
-3
4%
Mar
ketin
g 2
8
33
3
0
28
2
1
29
2
1
25
2
6
29
20
%
-10%
Op
erat
ions
& S
uppl
y Ch
ain
4
13
7
2
5
11
2
6
19
2
3
18
2
5
2%
153%
Man
agem
ent
To
tal
1
90
2
51
1
99
2
48
1
61
2
34
1
83
2
48
1
76
2
74
4
%
2%
Tabl
e 5.
7: A
nnua
l Deg
rees
/Cer
tifi
cate
s A
war
ded
by M
ajor
and
Gen
der
- C
olle
ge o
f Bus
ines
s
cont
inue
d on
nex
t pag
e
P
erc
en
t C
ha
ng
e
2011-2
012
2012-2
013
2013-2
014
201
4-2
01
5
20
15
-20
16
1
Yea
r 5
Yea
r
Deg
ree L
evel
Fe
ma
le
Ma
le
Fem
ale
M
ale
Fe
ma
le
Ma
le
Fem
ale
M
ale
Fe
ma
le
Ma
le
Bach
elor
’s D
egre
e 1,
192
874
1,21
0 90
7 1,
288
964
1,3
55
962
1
,298
1
,018
0%
12
%M
aste
r’s D
egre
e
830
633
798
628
806
550
838
6
22
814
6
12
-2%
-3
%Po
st-M
aste
r’s C
ertifi
cat
e 19
4
12
7 19
2
13
7
6
2
-6
0%
-65%
Doct
oral
-Res
earc
h 13
22
24
20
22
16
3
4
25
3
1
23
-8
%
54%
Doct
oral
-Pro
fess
iona
l 98
10
6 79
99
92
10
0 7
0
77
6
6
82
1%
-2
7%To
tal
2
,15
2
1,6
39
2
,12
3
1,6
61
2
,22
7
1,6
32
2
,31
0
1,6
93
2
,21
5
1,7
37
-1
%
4%
No
tes: D
egre
es/C
ertifi
cat
es a
war
ded
sum
mer
thr
ough
spr
ing.
In
clud
es A
ltern
ate
Deg
rees
Tabl
e 5.
6: A
nnua
l Deg
rees
/Cer
tifi
cate
s A
war
ded
by A
cade
mic
Lev
el a
nd G
ende
r -
Uni
vers
ity
Tota
l

107Section 5 - Retention & Graduation
SEC
TIO
N
5
cont
inue
d fro
m p
revi
ous
page
P
erc
en
t C
ha
ng
e
2011-2
012
2012-2
013
2013-2
014
201
4-2
01
5
20
15
-20
16
1
Yea
r 5
Yea
r
Deg
ree L
evel
Ma
jor
Fem
ale
M
ale
Fe
ma
le
Ma
le
Fem
ale
M
ale
Fe
ma
le
Ma
le
Fem
ale
M
ale
Ma
ste
r’s D
eg
ree
Ac
cele
rate
d Bu
sine
ss A
dmin
istr
atio
n 1
6
14
1
1
24
1
3
12
1
1
13
1
4
10
0%
-2
0%
Acce
lera
ted
Mob
ile M
BA
-
-
2
6
8
11
8
9
9
1
5
41%
--
Bu
sine
ss A
dmin
istr
atio
n 9
5
147
9
9
150
1
11
111
9
6
132
7
9
118
-1
4%
-19%
Co
mpu
ter a
nd In
form
atio
n Sc
ienc
e 8
1
8
6
18
1
0
12
1
2
9
-
-
-100
%
-100
%
Exec
utiv
e Bu
sine
ss A
dmin
istr
atio
n 6
1
2
8
15
4
1
2
9
14
7
1
0
-26%
-6
%
Fina
ncia
l Acc
ount
ing
and
Audi
t 2
7
31
4
2
32
2
9
41
3
5
37
4
1
33
3%
28
%
Info
rmat
ion
Syst
ems
-
-
-
-
-
-
-
-
-
2
--
--
Labo
r Rel
atio
ns &
Hum
an R
esou
rces
1
2
10
2
1
8
26
9
2
6
4
9
3
-60%
-4
5%
MBA
-Hea
lth C
are
10
9
8
2
8
2
1
0
7
4
6
-41%
-4
7%
Tax
Prog
ram
6
9
8
9
4
7
1
2
9
8
4
-43%
-2
0%
Tota
l 1
80
2
50
2
05
2
64
2
13
2
17
2
19
2
34
1
71
2
01
-1
8%
-1
3%
Docto
ral-
Resea
rch
Fi
nanc
e 1
-
-
1 -
1
1 -
1
-
0%
0%
Info
rmat
ion
Syst
ems
-
-
-
-
-
1 -
-
-
1
--
--
Labo
r Rel
atio
ns a
nd H
uman
Res
ourc
es
-
1 -
-
-
-
-
-
-
-
--
-1
00%
M
arke
ting
-
1 -
-
-
1
1 -
-
-
-1
00%
-1
00%
M
arke
ting-
Glob
al B
usin
ess
Spec
ializ
atio
n -
-
-
-
1
-
-
2 -
-
-1
00%
--
Op
erat
ion
Man
agem
ent &
Bus
ines
s
-
1 -
-
-
1
2 2
-
-
-100
%
-100
%
St
atis
tics
Tota
l 1
3
-
1
1
4
4
4
1
1
-7
5%
-5
0%
Tota
l B
usin
ess
Ba
chel
or’s
Deg
ree
190
2
51
199
2
48
161
2
34
183
2
48
176
2
74
4%
2%
Mas
ter’s
Deg
ree
180
2
50
205
2
64
213
2
17
219
2
34
171
2
01
-18%
-1
3%
Doct
oral
-Pro
fess
iona
l 1
3
-
1
1
4
4
4
1
1
-7
5%
-50%
To
tal
37
1
50
4
40
4
51
3
37
5
45
5
40
6
48
6
34
8
47
6
-8%
-6
%
No
tes:
Deg
rees
/Cer
tifi c
ates
aw
arde
d su
mm
er t
hrou
gh s
prin
g.
Incl
udes
Alte
rnat
e D
egre
es
Tabl
e 5.
7: A
nnua
l Deg
rees
/Cer
tifi
cate
s A
war
ded
by M
ajor
and
Gen
der
- C
olle
ge o
f Bus
ines
s

Cleveland State University / 2017 Book of Trends108
cont
inue
d on
nex
t pag
e
Tabl
e 5.
8: A
nnua
l Deg
rees
/Cer
tifi
cate
s A
war
ded
by M
ajor
and
Gen
der
- C
olle
ge o
f Lib
eral
Art
s an
d So
cial
Sci
ence
s
P
erc
en
t C
ha
ng
e
2011-2
012
2012-2
013
2013-2
014
20
14
-20
15
2
01
5-2
01
6
1 Y
ea
r 5
Yea
r
Deg
ree L
evel
M
ajo
r Fe
ma
le
Ma
le
Fem
ale
M
ale
Fe
ma
le
Ma
le
Fem
ale
M
ale
Fe
ma
le
Ma
le
Ba
ch
elo
r’s D
eg
ree
An
thro
polo
gy
14
7
1
2
11
7
5
2
1
7
11
3
-5
0%
-33%
Ar
t 2
1
6
4
2
-
-
-
-
-
-
--
-100
%
Art E
duca
tion
2
1
2
1
8
-
1
1
-
-
-100
%
-100
%
Art H
isto
ry
-
-
-
-
4
1
1
2
5
2
133%
--
Bl
ack
Stud
ies
-
1
-
-
1
-
-
-
1
2
--
200%
Cl
assi
cal a
nd M
edie
val S
tudi
es
-
1
-
-
-
3
1
2
1
2
0%
200%
Co
mm
unic
atio
n 3
4
26
2
7
23
3
1
19
2
6
23
3
4
21
12
%
-8%
Co
mm
unic
atio
n M
anag
emen
t 8
2
1
5
4
9
8
11
7
1
7
9
44%
16
0%
Com
para
tive
Relig
ion
3
-
4
5
6
4
-
-
3
3
--
100%
Cr
imin
olog
y 4
1
25
3
2
35
3
6
41
4
1
30
4
8
32
13
%
21%
Dr
amat
ic A
rts
& Th
eatr
e Ar
ts
4
-
3
3
1
6
4
2
10
3
11
7%
225%
Ec
onom
ics
6
4
3
6
2
11
2
1
2
1
14
7%
50
%
Engl
ish
46
1
6
42
2
3
25
1
6
25
1
0
14
9
-3
4%
-63%
En
glis
h-Cr
eativ
e W
ritin
g Tr
ack
-
-
-
-
4
5
9
7
11
6
6%
--
En
glis
h-Se
cond
ary
Lic
Trac
k -
-
-
-
-
2
4
5
6
3
0%
--
Fi
lm, T
V an
d In
tera
ctiv
e M
edia
1
2
20
7
2
6
10
2
1
13
1
8
14
2
3
19%
16
%
Fren
ch
1
-
1
1
1
2
6
3
2
1
-67%
20
0%
Hist
ory
7
24
9
3
3
12
1
7
8
11
5
2
1
37%
-1
6%
Inte
rnat
iona
l Rel
atio
ns
5
11
7
1
4
21
1
1
10
8
6
4
-4
4%
-38%
Jo
urna
lism
& P
rom
otio
nal
27
25
3
2
15
2
8
25
3
7
18
2
0
8
-49%
-4
6%
Co
mm
unic
atio
n
Li
bera
l Stu
dies
7
6
6
4
1
3
5
8
6
7
7
0%
8%
Ling
uist
ics
5
2
7
1
2
1
3
1
2
3
25%
-2
9%
Mus
ic
2
4
-
-
-
4
2
3
-
1
-80%
-8
3%
Mus
ic C
ompo
sitio
n -
-
1
-
-
3
-
-
-
3
--
--
M
usic
Edu
catio
n 2
1
5
1
4
2
-
3
4
2
10
0%
100%
M
usic
Per
form
ance
-
2
3
3
3
3
1
1
-
6
20
0%
200%
M
usic
The
rapy
-
-
3
-
2
1
3
-
3
1
33
%
--
Philo
soph
y -
3
1
8
1
6
2
5
1
3
-4
3%
33%
Ph
iloso
phy
- Et
hics
Tra
ck
-
-
-
-
-
1
-
1
-
-
-100
%
--
Polit
ical
Sci
ence
2
3
17
1
7
17
1
1
22
1
2
19
1
6
27
39
%
8%
Soci
al S
cien
ce
2
-
2
-
1
1
1
-
-
1
0%
-50%
So
cial
Stu
dies
1
7
3
9
2
1
1
2
4
2
4
0%
-25%
So
cial
Stu
dies
- In
tegr
ated
SS
-
-
-
-
-
-
-
-
-
1
Soci
al W
ork
69
1
5
76
1
8
80
2
5
70
2
0
82
1
7
10%
18
%

109Section 5 - Retention & Graduation
SEC
TIO
N
5
Tabl
e 5.
8: A
nnua
l Deg
rees
/Cer
tifi
cate
s A
war
ded
by M
ajor
and
Gen
der
- C
olle
ge o
f Lib
eral
Art
s an
d So
cial
Sci
ence
sco
ntin
ued
from
pre
viou
s pa
ge
Perc
en
t C
ha
ng
e
2011-2
012
2012-2
013
2013-2
014
201
4-2
01
5
20
15
-20
16
1
Yea
r 5
Yea
r
Deg
ree L
evel
Ma
jor
Fem
ale
M
ale
Fe
ma
le
Ma
le
Fem
ale
M
ale
Fe
ma
le
Ma
le
Fem
ale
M
ale
Ba
ch
elo
r’s D
eg
ree c
on
tin
ued
So
ciol
ogy
46
2
4
31
2
7
41
2
7
54
1
5
32
1
5
-32%
-3
3%
Span
ish
8
3
7
8
16
2
1
4
3
9
3
-29%
9%
Stud
io A
rt (T
rack
s Co
llaps
ed)
5
3
17
4
2
2
22
1
9
10
2
0
10
3%
27
5%
Wom
en’s
Stu
dies
3
-
2
-
-
-
1
-
1
-
0%
-6
7%To
tal
40
4
25
6
38
1
30
2
40
4
33
3
41
2
25
7
38
8
27
0
-2%
0
%
Ma
ste
r’s D
eg
ree
Co
mm
unic
atio
n Th
eory
and
7
6
2
3
3
2
1
4
7
3
10
0%
-23%
M
etho
dolo
gy
Ec
onom
ics
5
5
4
6
3
8
5
13
1
1
0
-39%
10
%
Engl
ish
6
3
7
3
13
3
8
6
7
3
-2
9%
11%
Gl
obal
Inte
ract
ion
6
9
9
7
5
6
8
6
3
3
-57%
-6
0%
Hist
ory
6
11
6
8
3
7
4
3
3
6
29
%
-47%
Hi
stor
y -
Mus
eum
Stu
dies
-
-
-
-
-
-
2
1
2
1
0%
--
M
aste
r of A
rts
in H
isto
ry -
Art
His
tory
-
-
-
-
-
-
-
-
2
-
--
--
Mas
ter o
f Fin
e Ar
ts-C
reat
ive
Writ
ing
1
2
7
3
3
2
2
2
3
2
25%
67
%
Mus
ic
6
11
4
5
8
3
4
6
7
3
0%
-4
1%
Philo
soph
y 4
5
-
3
-
6
1
1
-
5
15
0%
-44%
So
cial
Wor
k 5
2
13
6
2
16
7
4
15
8
7
13
7
5
18
-7
%
43%
So
ciol
ogy
9
2
11
2
9
2
1
2
1
5
4
-31%
-1
8%
Span
ish
4
-
1
5
5
-
2
1
4
-
33%
0%
Tota
l
10
6
67
1
13
6
1
12
6
54
1
36
5
7
11
9
58
-8
%
2%
Tota
l C
LA
SS
Ba
chel
or’s
Deg
ree
404
2
56
381
3
02
404
3
33
412
2
57
388
2
70
-2%
0%
M
aste
r’s D
egre
e 1
06
67
1
13
61
1
26
54
1
36
57
1
19
58
-8
%
2%
Tota
l 5
10
3
23
4
94
3
63
5
30
3
87
5
48
3
14
5
07
3
28
-3
%
0%
No
te:
Deg
rees
/Cer
tifi c
ates
aw
arde
d su
mm
er t
hrou
gh s
prin
g.
Incl
udes
Alte
rnat
e D
egre
es

Cleveland State University / 2017 Book of Trends110
cont
inue
d on
nex
t pag
e
Tabl
e 5.
9: A
nnua
l Aw
ards
by
Maj
or a
nd G
ende
r -
Col
lege
of E
duca
tion
and
Hum
an S
ervi
ces
cont
inue
d fro
m p
revi
ous
page
P
erc
en
t C
ha
ng
e
2011-2
012
2012-2
013
2013-2
014
20
14
-20
15
2
01
5-2
01
6
1 Y
ea
r 5
Yea
r
Deg
ree L
evel
Ma
jor
Fem
ale
M
ale
Fe
ma
le
Ma
le
Fem
ale
M
ale
Fe
ma
le
Ma
le
Fem
ale
M
ale
Ba
ch
elo
r’s D
eg
ree
Early
Chi
ldho
od E
duca
tion
60
7
4
8
5
58
6
6
1
8
66
3
0%
3%
Exer
cise
/Fitn
ess
Spec
ialis
t 1
5
5
4
4
7
4
3
6
2
14
%
33%
Mid
dle
Child
hood
Edu
catio
n 6
4
-
-
-
-
-
-
-
-
--
-1
00%
Mid
dle
Child
hood
Lan
guag
e Ar
ts a
nd M
ath
4
-
2
-
5
-
6
1
3
2
-29%
25
%M
iddl
e Ch
ildho
od L
angu
age
Arts
and
Sci
ence
1
-
3
-
2
-
1
-
2
-
10
0%
100%
Mid
dle
Child
hood
Lan
guag
e Ar
ts a
nd S
oc. S
tudi
es
2
1
6
1
5
1
3
4
4
3
0%
133%
Mid
dle
Child
hood
Mat
h an
d Sc
ienc
e 3
3
6
4
9
5
5
7
7
3
-1
7%
67%
Mid
dle
Child
hood
Mat
h an
d So
cial
Stu
dies
2
1
1
3
2
6
3
4
1
1
-7
1%
-33%
Mid
dle
Child
hood
Sci
ence
and
Soc
ial S
tudi
es
-
1
1
-
2
3
1
1
-
1
-50%
0%
Mild
/Mod
erat
e Ed
ucat
iona
l Nee
d 2
4
4
24
5
2
2
7
21
4
2
3
8
24%
11
%M
oder
ate/
Inte
nsiv
e Ed
ucat
iona
l Nee
ds
13
-
1
6
1
12
1
7
3
8
1
-1
0%
-31%
Phys
ical
Edu
catio
n 1
6
1
4
3
1
2
2
2
4
50
%
-14%
Spor
ts M
anag
emen
t 1
5
2
6
3
3
1
2
-
6
10
0%
0%To
tal
11
8
37
1
15
3
3
12
7
40
1
15
3
9
12
2
34
1
%
1%
Ma
ste
r’s D
eg
ree
Adul
t Lea
rnin
g an
d De
velo
pmen
t 4
5
6
38
1
0
30
4
3
8
11
1
8
6
-51%
-5
3%Cu
rric
ulum
and
Inst
ruct
ion
Tota
l 1
87
51
1
41
51
1
37
43
1
42
45
1
46
33
-4
%
-25%
Cu
rric
ulum
and
Inst
ruct
ion
187
5
1
141
5
1
-
-
-
-
-
-
--
-100
%
C&I-A
dvan
ced/
Appl
ied
Teac
hing
-
-
-
-
-
-
-
-
1
-
C&
I-Chi
nese
Lan
guag
e -
-
-
-
6
1
4
1
9
1
10
0%
--
C&I-E
arly
Chi
ld In
terv
Spe
c -
-
-
-
1
0
1
7
4
9
3
9%
--
C&I-E
arly
Chi
ldho
od E
duc
-
-
-
-
17
1
1
6
1
12
3
-1
2%
--
C&I-E
duca
tion
Rese
arch
-
-
-
-
1
2
1
2
1
-
-6
7%
--
C&I-E
duca
tiona
l Tec
hnol
ogy
-
-
-
-
7
13
2
7
10
1
5
5
-46%
--
C&
I-Ele
men
tary
-
-
-
-
-
-
1
-
1
-
C&
I-Gift
ed&T
alen
tedL
earn
ers
-
-
-
-
9
-
10
1
6
1
-3
6%
--
C&I-L
itera
cy D
evel
opm
ent-
TESO
L -
-
-
-
6
1
1
0
3
15
5
54
%
--
C&I-L
itera
cy D
ev-R
eadi
ng
-
-
-
-
19
3
1
4
-
29
2
12
1%
--
C&I-M
ild /
Mod
erat
e -
-
-
-
3
7
8
30
1
4
26
6
-2
7%
--
C&I-M
oder
ate
/ Int
ensi
ve
-
-
-
-
16
4
1
4
2
12
1
-1
9%
--
C&I-S
choo
l Hea
lth
-
-
-
-
-
2
-
1
-
-
-100
%
--
C&I-S
econ
dary
-Art
-
-
-
-
-
1
1
-
-
-
-1
00%
--
C&
I-Sec
onda
ry-E
nglis
h -
-
-
-
1
1
1
-
1
1
10
0%
--
C&I-S
econ
dary
-Mat
h -
-
-
-
-
-
1
-
3
-
C&
I-Sec
onda
ry-M
UST-
Engl
ish
-
-
-
-
5
-
1
3
4
-
0%
--
C&I-S
econ
dary
-MUS
T-M
ath
-
-
-
-
-
-
-
1
-
1
C&I-S
econ
dary
-MUS
T-M
oder
n La
ng
-
-
-
-
1
-
2
-
-
-
-100
%
--
C&I-S
econ
dary
-MUS
T-Sc
ienc
e -
-
-
-
-
1
-
2
1
2
50
%
--
C&I-S
econ
dary
-MUS
T-So
cial
Stu
d -
-
-
-
-
4
2
-
-
1
-5
0%
--
C&I-S
econ
dary
-Sci
ence
-
-
-
-
2
-
-
-
-
-
--
--
C&
I-Sec
onda
ry-S
ocia
l Stu
dies
-
-
-
-
-
-
-
-
1
1
--
--

111Section 5 - Retention & Graduation
SEC
TIO
N
5
Tabl
e 5.
9: A
nnua
l Aw
ards
by
Maj
or a
nd G
ende
r -
Col
lege
of E
duca
tion
and
Hum
an S
ervi
ces
cont
inue
d fro
m p
revi
ous
page
P
erc
en
t C
ha
ng
e
2011-2
012
2012-2
013
2013-2
014
20
14
-20
15
2
01
5-2
01
6
1 Y
ea
r 5
Yea
r
Deg
ree L
evel
Ma
jor
Fem
ale
M
ale
Fe
ma
le
Ma
le
Fem
ale
M
ale
Fe
ma
le
Ma
le
Fem
ale
M
ale
Ma
ste
r’s D
eg
ree c
on
tin
ued
Clin
ical
Men
tal H
ealth
Cns
ling
10
2
1
4
2
21
3
1
3
3
31
1
3
175%
26
7%Co
mm
unity
Hea
lth E
duca
tion
6
1
2
-
5
-
9
3
5
-
-58%
-2
9%Co
unse
lor E
duca
tion
30
4
1
0
5
9
2
12
2
1
5
2
21%
-5
0%Ed
ucat
iona
l Adm
inis
trat
ion
13
9
5
8
1
5
12
1
4
3
14
2
-6
%
-27%
Educ
atio
n an
d Hu
man
Ser
vice
s -
-
-
-
-
-
-
-
1
-
Exer
cise
Sci
ence
9
4
1
1
13
1
3
13
1
8
9
13
7
-2
6%
54%
Mas
ter o
f Pub
lic H
ealth
4
6
4
1
5
-
-
-
-
-
--
-1
00%
Orga
niza
tiona
l Lea
ders
hip
9
3
3
4
1
1
-
-
-
-
--
-100
%Sp
orts
Man
agem
ent
5
10
4
4
3
8
3
1
0
3
5
-38%
-4
7%Sp
orts
Man
agem
ent a
nd E
xerc
ise
Scie
nce
-
-
-
1
-
-
-
-
-
-
--
--Su
perv
isio
n 2
-
-
-
-
1
1
-
-
-
-1
00%
-1
00%
Tota
l 3
20
9
6
23
2
99
2
38
8
7
25
0
86
2
46
6
8
-7%
-2
5%
Post-
Ma
ste
r’s C
ert
ifi c
ate
Ed S
p in
Ad
- Pu
pil S
vcs
Adm
in
-
-
-
-
1
-
-
1
-
-
-100
%
--Ed
Sp
in A
d -
Supe
rinte
nden
t -
-
-
-
-
-
1
1
-
-
Ed S
p in
Ad
- Pr
inci
pal
-
-
-
-
2
-
2
1
-
-
-100
%
--Ed
ucat
ion
Adm
in S
peci
alis
t 9
1
4
3
1
-
1
-
-
-
-1
00%
-1
00%
Tota
l 9
1
4
3
4
-
4
3
-
-
-1
00
%
-10
0%
Docto
ral-
Resea
rch
Urba
n Ed
ucat
ion:
Adm
inis
trat
ion
2
1
1
1
-
1
-
-
2
1
--
0%Ur
ban
Educ
atio
n: A
dult
Cont
inui
ng &
Hig
her E
d -
-
-
-
-
-
-
-
-
1
Urba
n Ed
ucat
ion:
Cou
nsel
-
-
-
-
1
1
1
-
-
-
-1
00%
--
Urba
n Ed
ucat
ion:
Cou
nsel
ing
Psyc
holo
gy
1
-
4
1
2
-
5
2
1
1
-71%
10
0%Ur
ban
Educ
atio
n: P
olic
y 1
-
2
-
1
-
2
-
3
1
10
0%
300%
Urba
n Ed
ucat
ion:
Lea
rnin
g &
Deve
lopm
ent
-
1
3
1
3
1
2
1
5
1
100%
50
0%Ur
ban
Educ
atio
n: L
eade
rshi
p &
Life
-long
Lea
rnin
g 1
1
5
-
1
1
2
1
3
-
0%
50
%Ur
ban
Educ
atio
n: N
ursi
ng E
duca
tion
-
-
-
-
-
-
-
-
-
1
To
tal
5
3
15
3
8
4
1
2
4
14
5
1
9%
1
38
%
Tota
l C
oll
eg
e o
f E
du
ca
tio
n a
nd
Hu
ma
n S
erv
ices
Bach
elor
’s D
egre
e 1
18
37
1
15
33
1
27
40
1
15
39
1
22
34
1%
1%
Mas
ter’s
Deg
ree
320
9
6
232
9
9
238
8
7
250
8
6
246
6
8
-7%
-2
5%Po
st-M
aste
r’s C
ertifi
cat
e 9
1
4
3
4
-
4
3
-
-
-1
00%
-1
00%
Doct
oral
-Res
earc
h 5
3
1
5
3
8
4
12
4
1
4
5
19%
13
8%To
tal
45
2
13
7
36
6
13
8
37
7
13
1
38
1
13
2
38
2
10
7
-5%
-1
7%
No
tes: D
egre
es/C
ertifi
cat
es a
war
ded
sum
mer
thr
ough
spr
ing.
Incl
udes
Alte
rnat
e D
egre
es

Cleveland State University / 2017 Book of Trends112
P
erc
en
t C
ha
ng
e
2011-2
012
2012-2
013
2013-2
014
201
4-2
01
5
20
15
-20
16
1
Yea
r 5
Yea
r
Deg
ree L
evel
Ma
jor
Fem
ale
M
ale
Fe
ma
le
Ma
le
Fem
ale
M
ale
Fe
ma
le
Ma
le
Fem
ale
M
ale
Ba
ch
elo
r’s D
eg
ree
Ch
emic
al E
ngin
eerin
g 6
1
3
5
18
8
1
7
12
1
5
8
32
48
%
111%
Ci
vil E
ngin
eerin
g 7
1
8
6
16
3
1
8
6
15
4
2
1
19%
0%
Co
mpu
ter E
ngin
eerin
g -
1
4
-
5
-
7
3
17
2
1
5
-15%
21
%
Com
pute
r Sci
ence
-
-
-
-
-
-
-
-
-
3
El
ectr
ical
Eng
inee
ring
5
31
6
3
0
3
32
4
2
7
2
36
23
%
6%
Elec
tron
ic E
ngin
eerin
g Te
chno
logy
1
2
1
1
13
1
1
2
-
13
-
1
3
0%
-41%
In
dust
rial E
ngin
eerin
g -
-
-
1
-
1
-
-
-
-
--
--
M
echa
nica
l Eng
inee
ring
5
37
3
4
6
5
43
1
3
37
1
0
47
14
%
36%
M
echa
nica
l Eng
inee
ring
Tech
nolo
gy
1
16
-
9
2
1
2
1
12
1
3
2
154%
94
%To
tal
25
1
50
2
1
13
8
22
1
42
3
9
13
6
27
1
99
2
9%
2
9%
Ma
ste
r’s D
eg
ree
Bi
omed
ical
Eng
inee
ring
5
7
3
10
5
1
0
5
8
7
4
-15%
-8
%
Chem
ical
Eng
inee
ring
5
8
2
4
2
5
4
8
2
7
-25%
-3
1%
Civi
l Eng
inee
ring
3
11
2
9
6
1
1
6
19
1
2
1
-12%
57
%
Com
pute
r and
Info
rmat
ion
Scie
nce
-
-
-
-
-
-
-
-
13
1
5
--
--
Elec
tric
al E
ngin
eerin
g 1
2
55
1
6
35
7
5
0
18
1
02
23
1
10
11%
99
%
Engi
neer
ing
Mec
hani
cs
-
-
-
-
-
1
-
-
-
-
--
--
Envi
ronm
enta
l Eng
inee
ring
1
-
-
-
-
-
1
1
-
-
-100
%
-100
%
Indu
stria
l Eng
inee
ring
3
13
-
7
-
4
3
1
0
-
-
-100
%
-100
%
Mec
hani
cal E
ngin
eerin
g 1
0
12
-
1
4
5
11
3
1
2
6
31
14
7%
68%
So
ftwar
e En
gine
erin
g 1
4
1
1
5
3
11
8
8
2
8
-3
8%
100%
Tota
l
4
0
11
0
24
9
4
28
1
03
4
8
16
8
54
1
96
1
6%
6
7%
Docto
ral-
Resea
rch
Ap
plie
d Bi
omed
ical
Eng
inee
ring
-
1
2
4
-
-
-
5
2
4
20%
50
0%
Chem
ical
Eng
inee
ring
-
1
-
-
-
-
-
-
-
-
--
-100
%
Civi
l Eng
inee
ring
-
-
-
-
-
2
-
-
-
-
--
--
Elec
tric
al E
ngin
eerin
g 1
5
-
-
-
2
2
2
1
1
-5
0%
-67%
M
echa
nica
l Eng
inee
ring
-
1
-
1
-
1
-
-
-
1
--
0%To
tal
1
8
2
5
-
5
2
7
3
6
0%
0
%
Tota
l E
ng
ineeri
ng
Ba
chel
or’s
Deg
ree
25
1
50
21
1
38
22
1
42
39
1
36
27
1
99
29%
29
%
Mas
ter’s
Deg
ree
40
1
10
24
9
4
28
1
03
48
1
68
54
1
96
16%
67
%
Doct
oral
-Res
earc
h 1
8
2
5
-
5
2
7
3
6
0%
0%
Tota
l
6
6
26
8
47
2
37
5
0
25
0
89
3
11
8
4
40
1
21
%
45
%
No
te:
Deg
rees
/Cer
tifi c
ates
aw
arde
d su
mm
er t
hrou
gh s
prin
g.
Incl
udes
Alte
rnat
e D
egre
es
Tabl
e 5.
10: A
nnua
l Deg
rees
/Cer
tifi
cate
s A
war
ded
by M
ajor
and
Gen
der
- C
olle
ge o
f Eng
inee
ring

113Section 5 - Retention & Graduation
SEC
TIO
N
5
P
erc
en
t C
ha
ng
e
2011-2
012
2012-2
013
2013-2
014
201
4-2
01
5
20
15
-20
16
1
Yea
r 5
Yea
r
Deg
ree L
evel M
ajo
r Fe
ma
le
Ma
le
Fem
ale
M
ale
Fe
ma
le
Ma
le
Fem
ale
M
ale
Fe
ma
le
Ma
le
Ba
ch
elo
r’s D
eg
ree
Nu
rsin
g, B
SN (N
UR, N
URBC
CC)
11
1
7
1
9
2
6
3
9
1
11
%
-17%
Nu
rsin
g, B
SN -
Acc
eler
ated
5
2
11
5
5
12
5
4
10
5
0
12
4
6
14
-3
%
-5%
Nu
rsin
g, B
SN (L
K) (N
URLK
) 2
-
1
-
1
-
-
-
-
-
--
-1
00%
Nu
rsin
g, B
SN/R
N (N
UB,N
UBBC
CC,N
UBPB
) 4
3
9
61
8
6
3
12
5
5
15
5
9
9
-3%
31
%To
tal
10
8
21
1
24
2
1
12
7
24
1
11
3
0
11
4
24
-2
%
7%
Ma
ste
r’s D
eg
ree
NN
ursi
ng (G
NR)
13
-
5
1
1
9
1
12
-
1
3
1
17%
8%
Tota
l
13
-
5
1
1
9
1
12
-
1
3
1
17
%
8%
Tota
l N
urs
ing
Ba
chel
or’s
Deg
ree
108
2
1
124
2
1
127
2
4
111
3
0
114
2
4
-2%
7%
M
aste
r’s D
egre
e 1
3
-
5
1
19
1
1
2
-
13
1
17
%
8%To
tal
12
1
21
1
29
2
2
14
6
25
1
23
3
0
12
7
25
-1
%
7%
No
te:
Deg
rees
/Cer
tifi c
ates
aw
arde
d su
mm
er t
hrou
gh s
prin
g.
Incl
udes
Alte
rnat
e D
egre
es
P
erc
en
t C
ha
ng
e
2011-2
012
2012-2
013
2013-2
014
201
4-2
01
5
20
15
-20
16
1
Yea
r 5
Yea
r
Deg
ree L
evel M
ajo
r Fe
ma
le
Ma
le
Fem
ale
M
ale
Fe
ma
le
Ma
le
Fem
ale
M
ale
Fe
ma
le
Ma
le
Ba
ch
elo
r’s D
eg
ree
Bi
olog
y 4
6
30
5
1
44
5
3
34
5
2
34
4
8
33
-6
%
7%
Biol
ogy
- In
tegr
ated
Sci
ence
-
-
-
-
-
-
1
-
1
1
--
--
Bi
olog
y-M
edic
al T
echn
olog
y 1
0
2
10
1
5
2
8
5
1
0
7
31%
42
%
Chem
istr
y 3
1
1
10
8
6
1
0
11
1
0
13
7
-5
%
43%
Ch
emis
try
- In
tegr
ated
Sci
ence
-
-
-
-
-
-
-
-
-
1
--
--
En
viro
nmen
tal S
cien
ces
2
9
6
11
9
1
4
10
1
2
14
9
5%
10
9%
Geol
ogic
al S
cien
ces
2
3
-
2
2
1
-
3
-
-
-100
%
-100
%
Heal
th S
cien
ce P
odia
try
1
-
-
-
-
-
-
-
-
-
--
-100
%
Heal
th S
cien
ce P
re-O
ccup
atio
nal T
hera
py
26
7
2
3
7
25
7
3
3
2
35
3
9%
15
%
Heal
th S
cien
ce P
re-P
hysi
cal T
hera
py
17
1
3
16
1
1
16
1
8
19
1
9
23
2
0
13%
43
%
Heal
th S
cien
ce P
re-P
hysi
cian
Ass
ista
nt
14
2
1
7
6
17
6
1
9
13
1
9
9
-13%
75
%
Heal
th S
cien
ces
BS
47
2
0
57
1
8
92
3
2
98
4
6
110
3
5
1%
116%
M
athe
mat
ics
9
13
3
1
2
9
19
9
1
7
10
1
7
4%
23%
Ph
arm
aceu
tical
Sci
ence
-
-
1
-
1
1
2
3
-
4
-2
0%
--
Phar
mac
eutic
al S
cien
ces
Adm
. Tra
ck
-
-
1
-
-
-
-
2
1
1
0%
--
Phys
ics
2
9
-
6
3
3
2
5
1
6
0%
-36%
Ph
ysic
s -
Inte
grat
ed S
cien
ce
-
-
-
-
-
-
-
-
-
1
--
--
Psyc
holo
gy
142
4
3
157
5
2
179
4
9
205
5
7
167
4
7
-18%
16
%
Spee
ch &
Hea
ring
16
2
2
1
-
31
3
2
3
3
18
2
-2
3%
11%
Tota
l
33
7
16
4
37
3
17
8
44
8
19
9
49
2
23
1
47
0
20
3
-7%
3
4%
Tabl
e 5.
12: A
nnua
l Aw
ards
by
Maj
or a
nd G
ende
r -
Col
lege
of S
cien
ces
and
Hea
lth
Prof
essi
ons
cont
inue
d on
nex
t pag
e
Tabl
e 5.
11: A
nnua
l Deg
rees
/Cer
tifi
cate
s A
war
ded
by M
ajor
and
Gen
der
- Sc
hool
of N
ursi
ng

Cleveland State University / 2017 Book of Trends114
cont
inue
d fro
m p
revi
ous
page
P
erc
en
t C
ha
ng
e
2011-2
012
2012-2
013
2013-2
014
201
4-2
01
5
20
15
-20
16
1
Yea
r 5
Yea
r
Deg
ree L
evel
Ma
jor
Fem
ale
M
ale
Fe
ma
le
Ma
le
Fem
ale
M
ale
Fe
ma
le
Ma
le
Fem
ale
M
ale
Mast
er’s
Deg
ree
Ap
plie
d St
atis
tics
-
3
2
5
3
2
3
4
4
5
29%
20
0%
Biol
ogy
4
6
4
5
3
3
3
3
3
1
-33%
-6
0%
Chem
istr
y 3
1
2
11
8
9
7
8
9
9
5
-1
8%
-7%
En
viro
nmen
tal S
cien
ces
3
-
2
1
2
-
-
-
1
1
--
-33%
H
ealth
Sci
ence
2
5
12
1
0
5
30
1
0
10
5
1
1
2
-13%
-6
5%
Hea
lth S
cien
ce-P
hy. A
. Tra
ck
1
-
25
1
0
4
2
18
6
2
6
5
29%
30
00%
M
athe
mat
ics
4
12
6
5
9
5
3
4
9
6
11
4%
-6%
M
edic
al P
hysi
cs
-
-
-
-
-
-
-
1
2
2
Occ
upat
iona
l The
rapy
2
3
5
28
4
2
5
4
38
6
3
5
9
0%
57%
Ph
ysic
s -
3
2
5
-
9
1
2
-
2
-3
3%
-33%
Ph
ysic
s -
Opt
ics
and
Med
ical
Imag
ing
-
-
-
-
1
-
1
-
-
3
200%
--
Sp
ecia
lizat
ion
Ps
ycho
logy
2
-
3
1
2
1
-
-
-
2
--
0%
Ps
ycho
logy
- C
linic
al
5
2
11
5
8
3
5
1
8
6
13
3%
100%
Ps
ycho
logy
-Con
s.In
dus.
Rese
arch
1
1
1
-
4
2
2
-
2
1
50
%
50%
Ps
ycho
logy
-Div
ersi
ty M
gmt
7
2
9
3
7
2
8
3
5
3
-27%
-1
1%
Psyc
holo
gy-E
xper
imen
tal
3
2
4
1
2
1
3
1
6
1
75%
40
%
Psyc
holo
gy-S
choo
l 5
2
1
2
2
8
1
6
1
8
2
43%
43
%
Publ
ic H
ealth
(MPH
-CEO
) -
-
-
-
5
2
9
2
3
2
-5
5%
--
Spee
ch P
atho
logy
and
Aud
iolo
gy
30
1
2
8
-
17
2
2
4
-
32
1
38
%
6%To
tal
1
16
6
3
15
8
60
1
39
5
6
14
2
48
1
64
5
9
17
%
25
%
Post-
Ma
ste
r’s C
ert
ifi c
ate
Ps
ycho
logy
Spe
cial
ist
9
2
6
2
13
1
7
1
5
1
-2
5%
-45%
Tota
l
9
2
6
2
1
3
1
7
1
5
1
-25
%
-45
%
Docto
ral-
Resea
rch
Ad
ult D
evel
opm
ent &
Agi
ng P
hD
-
-
-
-
1
-
1
-
2
-
100%
--
Cl
inic
al-B
ioan
alyt
ical
Che
mis
try
2
3
3
6
7
1
6
5
4
6
-9%
10
0%
Regu
lato
ry B
iolo
gy
4
2
2
2
3
1
8
4
3
4
-42%
17
%To
tal
6
5
5
8
11
2
1
5
9
9
10
-2
1%
7
3%
Docto
ral-
Pro
fessio
na
l
Do
ctor
of P
hysi
cal T
hera
py
22
9
1
6
7
26
1
1
21
1
6
19
1
4
-11%
6%
Tota
l
2
2
9
16
7
2
6
11
2
1
16
1
9
14
-1
1%
6
%
Tota
l S
cie
nce
Ba
chel
or’s
Deg
ree
337
1
64
373
1
78
448
1
99
492
2
31
470
2
03
-7%
34
%
Mas
ter’s
Deg
ree
116
6
3
158
6
0
139
5
6
142
4
8
164
5
9
17%
25
%
Post
-Mas
ter’s
Cer
tifi c
ate
9
2
6
2
13
1
7
1
5
1
-2
5%
-45%
Do
ctor
al-R
esea
rch
6
5
5
8
11
2
1
5
9
9
10
-2
1%
73%
Do
ctor
al-P
rofe
ssio
nal
22
9
1
6
7
26
1
1
21
1
6
19
1
4
-11%
6%
Tota
l
49
0
24
3
55
8
25
5
63
7
26
9
67
7
30
5
66
7
28
7
-3%
3
0%
No
te: D
egre
es/C
ertifi
cat
es a
war
ded
Sum
mer
thr
ough
Spr
ing.
Incl
udes
Alte
rnat
e D
egre
es
Tabl
e 5.
12: A
nnua
l Aw
ards
by
Maj
or a
nd G
ende
r -
Col
lege
of S
cien
ces
and
Hea
lth
Prof
essi
ons

115Section 5 - Retention & Graduation
SEC
TIO
N
5
P
erc
en
t C
ha
ng
e
2011-2
012
2012-2
013
2013-2
014
201
4-2
01
5
20
15
-20
16
1
Yea
r 5
Yea
r
Deg
ree L
evel
Ma
jor
Fem
ale
M
ale
Fe
ma
le
Ma
le
Fem
ale
M
ale
Fe
ma
le
Ma
le
Fem
ale
M
ale
Ba
ch
elo
r’s D
eg
ree
Ec
onom
ic D
evel
opm
ent
-
-
-
-
-
-
-
-
1
8
--
--
Envi
ronm
enta
l Stu
dies
5
4
1
-
5
1
4
5
3
6
0%
0%
No
nPro
fi t A
dmin
istr
atio
n 2
3
4
16
5
1
2
4
23
4
1
7
3
-26%
-2
6%
Orga
niza
tiona
l Lea
ders
hip
16
8
1
4
7
6
3
6
2
4
3
-13%
-7
1%
Orga
niza
tiona
l Lea
ders
hip
Com
-
-
-
-
-
-
4
-
3
1
Or
gani
zatio
nal L
eade
rshi
p M
gmt
-
-
3
2
8
6
13
5
1
6
9
39%
--
Pu
blic
Saf
ety
Man
agem
ent
6
8
-
11
4
1
0
3
19
4
8
-4
5%
-14%
Pu
blic
Saf
ety
Man
agem
ent (
LK)
2
4
1
1
-
-
-
3
-
-
-100
%
-100
%
Urba
n St
udie
s -
Env
Pol &
Mgm
t -
-
-
-
-
-
2
2
1
2
-2
5%
--
Urba
n St
udie
s -
Publ
ic M
gmt
22
2
1
17
1
8
22
2
4
14
7
7
1
1
-14%
-5
8%
Urba
n St
udie
s -
Regi
onal
Pln
g -
-
-
-
-
-
5
6
4
5
-1
8%
--
Tota
l
74
4
9
52
4
4
57
4
8
74
5
3
59
4
8
-16
%
-13
%
Ma
ste
r’s D
eg
ree
Econ
omic
Dev
elop
men
t -
-
-
-
-
-
-
3
-
1
-6
7%
--
Envi
ronm
enta
l Stu
dies
-
-
8
3
-
-
-
-
-
-
--
--
En
viro
nmen
tal S
tudi
es a
nd L
aw
-
1
-
-
-
-
-
-
-
-
--
-100
%
Envi
ronm
enta
l Stu
dies
M.A
. 6
1
0
-
-
-
4
2
1
2
-
-33%
-8
8%
Envi
ronm
enta
l Sus
tain
abili
ty
-
-
-
-
-
-
-
2
-
-
-100
%
--
Geog
raph
ic In
form
atio
n Sy
stem
s -
-
-
-
-
-
-
2
-
-
-1
00%
--
Hi
stor
ic P
rese
rvat
ion
Spec
ialis
t -
-
-
-
-
-
1
-
-
1
0%
--
Ho
usin
g &
Neig
hbor
hood
Dev
elop
-
-
-
-
-
-
-
1
-
-
-1
00%
--
No
nPro
fi t A
dmin
& L
eade
rshi
p 1
3
1
10
2
8
1
5
2
8
-
14
%
-43%
No
nPro
fi t M
anag
emen
t -
-
-
-
-
-
4
-
3
-
-2
5%
--
Publ
ic A
dmin
- P
ublic
Fin
anci
al M
gmt
-
-
-
-
-
-
-
-
1
-
Publ
ic A
dmin
Acc
el 4
+1
-
1
1
2
-
-
1
1
-
-
-100
%
-100
%
Publ
ic A
dmin
istr
atio
n 2
2
17
2
9
24
2
6
16
1
1
6
18
6
41
%
-38%
Re
al E
stat
e De
v &
Fina
nce
-
-
-
-
-
-
3
1
-
-
-100
%
--
Urba
n St
udie
s 3
4
4
4
3
1
1
7
3
4
-1
3%
0%
Urba
n Pl
anni
ng a
nd D
evel
opm
ent
11
1
3
9
14
6
1
0
3
2
7
12
28
0%
-21%
Tota
l
55
4
7
61
4
9
43
3
2
31
2
8
42
2
4
12
%
-35
%
Docto
ral-
Resea
rch
Ur
ban
Stud
ies
& Pu
blic
Affa
irs
-
3
2
3
2
1
1
1
4
-
100%
33
%
Tota
l
-
3
2
3
2
1
1
1
4
-
10
0%
3
3%
Tota
l U
rba
n A
ffa
irs
Bach
elor
’s D
egre
e 7
4
49
5
2
44
5
7
48
7
4
53
5
9
48
-1
6%
-13%
M
aste
r’s D
egre
e 5
5
47
6
1
49
4
3
32
3
1
28
4
2
24
12
%
-35%
Do
ctor
al-R
esea
rch
-
3
2
3
2
1
1
1
4
-
100%
33
%
Tota
l
12
9
99
1
15
9
6
10
2
81
1
06
8
2
10
5
72
-6
%
-22
%
No
te: D
egre
es/C
ertifi
cat
es a
war
ded
sum
mer
thr
ough
spr
ing.
Incl
udes
Alte
rnat
e D
egre
es
Tabl
e 5.
13: A
nnua
l Deg
rees
/Cer
tifi
cate
s A
war
ded
by M
ajor
and
Gen
der
- C
olle
ge o
f Urb
an A
ffai
rs

Cleveland State University / 2017 Book of Trends116
P
erc
en
t C
ha
ng
e
2011-2
012
2012-2
013
2013-2
014
20
14
-20
15
2
01
5-2
01
6
1 Y
ea
r 5
Yea
r
Deg
ree L
evel
Ma
jor
Fem
ale
M
ale
Fe
ma
le
Ma
le
Fem
ale
M
ale
Fe
ma
le
Ma
le
Fem
ale
M
ale
Post
Ma
ste
r’s C
ert
ifi c
ate
M
aste
r of L
aws
1
1
2
2
2
1
2
3
1
1
-60%
0%
Tota
l
1
1
2
2
2
1
2
3
1
1
-60
%
0%
Ma
ste
r’s D
eg
ree
Le
gal S
tudi
es
-
-
-
-
-
-
1
1
5
5
400%
--
Tota
l
-
-
-
-
-
-
1
1
5
5
40
0%
--
Docto
ral-
Pro
fessio
na
l
Ju
ris D
octo
r 7
6
97
6
3
92
6
6
89
4
9
61
4
7
68
5%
-3
4%
Tota
l
76
9
7
63
9
2
66
8
9
49
61
4
7
68
5
%
-34
%
Tota
l La
w
Po
st M
aste
r’s C
ertifi
cat
e 1
1
2
2
2
1
2
3
1
1
-6
0%
0%
Mas
ter’s
Deg
ree
-
-
-
-
-
-
1
1
5
5
Doct
oral
-Pro
fess
iona
l 7
6
97
6
3
92
6
6
89
4
9
61
4
7
68
5%
-3
4%
Tota
l
77
9
8
65
9
4
68
9
0
52
65
5
3
74
9
%
-27
%
No
te:
Deg
rees
/Cer
tifi c
ates
aw
arde
d su
mm
er t
hrou
gh s
prin
g.
Incl
udes
Alte
rnat
e D
egre
es
Tabl
e 5.
14: A
nnua
l Deg
rees
/Cer
tifi
cate
s A
war
ded
by M
ajor
and
Gen
der
- C
olle
ge o
f Law

117Section 5 - Retention & Graduation
SEC
TIO
N
5
P
erc
en
t C
ha
ng
e
2011-2
012
2012-2
013
2013-2
014
20
14
-20
15
2
01
5-2
01
6
1 Y
ea
r 5
Yea
r
Ra
ce
Deg
ree L
evel
Fem
ale
M
ale
Fe
ma
le
Ma
le
Fem
ale
M
ale
Fe
ma
le
Ma
le
Fem
ale
M
ale
Bla
ck
/Afr
ica
n A
meri
ca
n
Ba
chel
or’s
Deg
ree
250
102
258
99
249
113
230
104
225
98
-3%
-8
%
Mas
ter’s
Deg
ree
119
34
116
46
116
36
119
53
138
51
10%
24
%
Post
-Mas
ter’s
Cer
tifi c
ate
6 -
1 -
2 1
2 -
- -
-100
%
-100
%
Doct
oral
-Res
earc
h 2
2 3
2 2
2 4
- 3
1 0%
0%
Do
ctor
al-P
rofe
ssio
nal
10
8 5
4 8
8 6
3 4
2 -3
3%
-67%
Tota
l
38
7
14
6
38
3
15
1
37
7
16
0
36
1
16
0
37
0
15
2
0%
-2
%
His
pa
nic
/La
tin
o
Bach
elor
’s D
egre
e 52
24
51
21
68
25
76
30
52
54
0%
39
%
Mas
ter’s
Deg
ree
21
10
18
17
18
13
27
12
32
11
10%
39
%
Post
-Mas
ter’s
Cer
tifi c
ate
2 -
- -
- -
- -
- -
--
-100
%
Doct
oral
-Res
earc
h -
- -
- -
- 1
- 1
1 10
0%
--
Doct
oral
-Pro
fess
iona
l 2
1 2
1 3
4 2
1 4
4 16
7%
167%
Tota
l
77
3
5
71
3
9
89
4
2
10
6
43
8
9
70
7
%
42
%
Asia
n
Bach
elor
’s D
egre
e 31
29
30
27
30
28
33
23
43
28
27
%
18%
M
aste
r’s D
egre
e 22
20
27
20
14
16
16
21
22
16
3%
-1
0%
Post
-Mas
ter’s
Cer
tifi c
ate
- -
- -
- -
- -
1
--
--
Doct
oral
-Res
earc
h -
1 -
- 2
- 1
- -
2 10
0%
100%
Do
ctor
al-P
rofe
ssio
nal
3 2
2 -
3 4
1 2
- 2
-33%
-6
0%To
tal
56
5
2
59
4
7
49
4
8
51
46
6
6
48
1
8%
6
%
Am
eri
ca
n I
nd
ian
/Ala
sk
a N
ati
ve
Bach
elor
’s D
egre
e 6
2 5
3 4
3 2
1 2
1 0%
-6
3%
Mas
ter’s
Deg
ree
1 -
- -
- 1
2 2
1 -
-75%
0%
Po
st-M
aste
r’s C
ertifi
cat
e 1
- -
- -
- -
- -
- --
-1
00%
Do
ctor
al-R
esea
rch
- -
- -
- -
- -
- -
--
--
Doct
oral
-Pro
fess
iona
l -
- -
- 1
1 -
- 1
1 --
--
Tota
l
8
2
5
3
5
5
4
3
4
2
-14
%
-40
%
Na
tive H
aw
aii
an
or
Oth
er
Pa
cifi
c I
sla
nd
Ba
chel
or’s
Deg
ree
- -
1 -
2 1
- 1
1 3
300%
--
M
aste
r’s D
egre
e -
- -
- 1
1 -
- 1
- --
--
Po
st-M
aste
r’s C
ertifi
cat
e -
- -
- -
- -
- -
- --
--
Do
ctor
al-R
esea
rch
- -
- -
- -
- -
- -
--
--
Doct
oral
-Pro
fess
iona
l -
- -
- -
- -
- -
- --
--
Tota
l
-
-
1
-
3
2
-
1
2
3
40
0%
--
Tabl
e 5.
15: A
nnua
l Aw
ards
by
Ethn
icit
y an
d G
ende
r
cont
inue
d on
nex
t pag
e
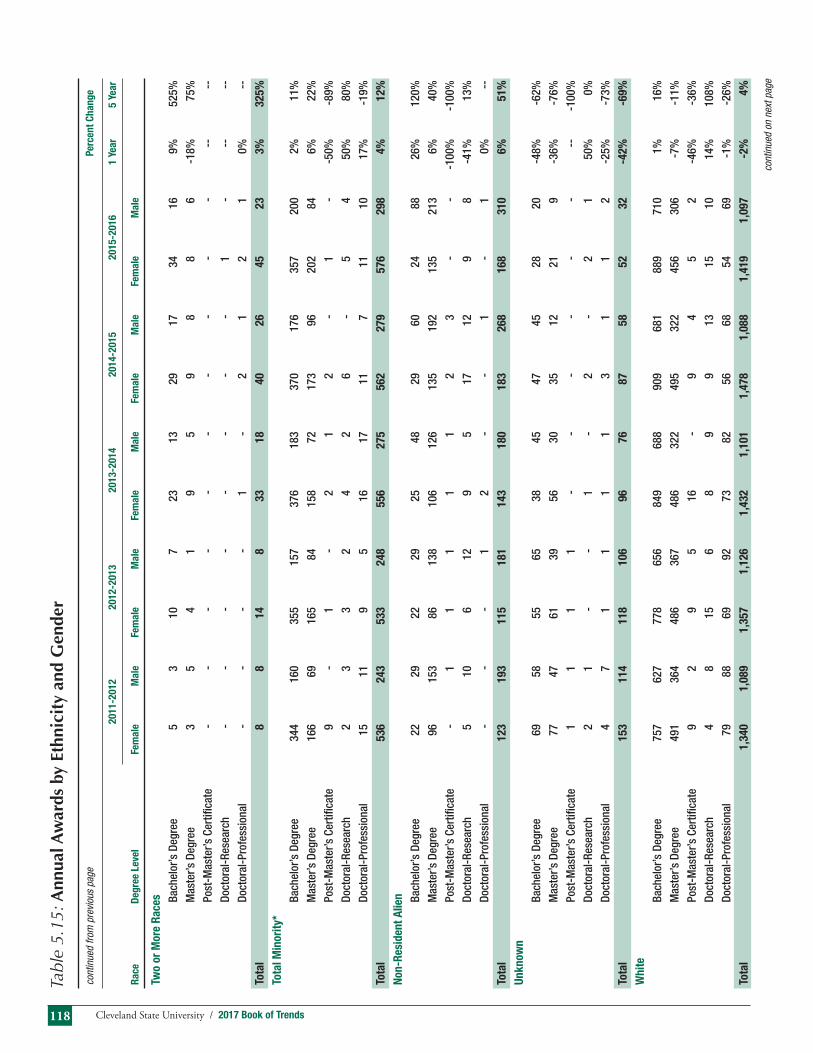
Cleveland State University / 2017 Book of Trends118
cont
inue
d fro
m p
revi
ous
page
P
erc
en
t C
ha
ng
e
2011-2
012
2012-2
013
2013-2
014
20
14
-20
15
2
01
5-2
01
6
1 Y
ea
r 5
Yea
r
Ra
ce
Deg
ree L
evel
Fem
ale
M
ale
Fe
ma
le
Ma
le
Fem
ale
M
ale
Fe
ma
le
Ma
le
Fem
ale
M
ale
Two o
r M
ore
Ra
ces
Ba
chel
or’s
Deg
ree
5 3
10
7 23
13
29
17
34
16
9%
52
5%
Mas
ter’s
Deg
ree
3 5
4 1
9 5
9 8
8 6
-18%
75
%
Post
-Mas
ter’s
Cer
tifi c
ate
- -
- -
- -
- -
- -
--
--
Doct
oral
-Res
earc
h -
- -
- -
- -
- 1
- --
--
Do
ctor
al-P
rofe
ssio
nal
- -
- -
1 -
2 1
2 1
0%
--To
tal
8
8
1
4
8
33
1
8
40
2
6
45
2
3
3%
3
25
%
Tota
l M
inori
ty*
Bach
elor
’s D
egre
e 3
44
160
3
55
157
3
76
183
3
70
176
3
57
200
2%
11
%
Mas
ter’s
Deg
ree
166
6
9
165
8
4
158
7
2
173
9
6
202
8
4
6%
22%
Po
st-M
aste
r’s C
ertifi
cat
e 9
-
1
-
2
1
2
-
1
-
-5
0%
-89%
Do
ctor
al-R
esea
rch
2
3
3
2
4
2
6
-
5
4
50%
80
%
Doct
oral
-Pro
fess
iona
l 1
5
11
9
5
1
6
17
1
1
7
11
1
0
17%
-1
9%To
tal
5
36
2
43
5
33
2
48
5
56
2
75
5
62
2
79
5
76
2
98
4
%
12
%
Non
-Resid
en
t A
lien
Ba
chel
or’s
Deg
ree
22
29
22
29
25
48
29
60
24
88
26%
12
0%
Mas
ter’s
Deg
ree
96
153
86
138
106
126
135
192
135
213
6%
40%
Po
st-M
aste
r’s C
ertifi
cat
e -
1 1
1 1
1 2
3 -
- -1
00%
-1
00%
Do
ctor
al-R
esea
rch
5 10
6
12
9 5
17
12
9 8
-41%
13
%
Doct
oral
-Pro
fess
iona
l -
- -
1 2
- -
1 -
1 0%
--
Tota
l
12
3
19
3
11
5
18
1
14
3
18
0
18
3
26
8
16
8
31
0
6%
5
1%
Un
kn
ow
n
Bach
elor
’s D
egre
e 69
58
55
65
38
45
47
45
28
20
-4
8%
-62%
M
aste
r’s D
egre
e 77
47
61
39
56
30
35
12
21
9
-36%
-7
6%
Post
-Mas
ter’s
Cer
tifi c
ate
1 1
1 1
- -
- -
- -
--
-100
%
Doct
oral
-Res
earc
h 2
1 -
- 1
- 2
- 2
1 50
%
0%
Doct
oral
-Pro
fess
iona
l 4
7 1
1 1
1 3
1 1
2 -2
5%
-73%
Tota
l
15
3
11
4
11
8
10
6
96
7
6
87
5
8
52
3
2
-42
%
-69
%
Wh
ite
Bach
elor
’s D
egre
e 75
7 62
7 77
8 65
6 84
9 68
8 90
9 68
1 88
9 71
0 1%
16
%
Mas
ter’s
Deg
ree
491
364
486
367
486
322
495
322
456
306
-7%
-1
1%
Post
-Mas
ter’s
Cer
tifi c
ate
9 2
9 5
16
- 9
4 5
2 -4
6%
-36%
Do
ctor
al-R
esea
rch
4 8
15
6 8
9 9
13
15
10
14%
10
8%
Doct
oral
-Pro
fess
iona
l 79
88
69
92
73
82
56
68
54
69
-1
%
-26%
Tota
l
1,3
40
1
,08
9
1,3
57
1
,12
6
1,4
32
1
,10
1
1,4
78
1
,08
8
1,4
19
1
,09
7
-2%
4
%
cont
inue
d on
nex
t pag
e
Tabl
e 5.
15: A
nnua
l Aw
ards
by
Ethn
icit
y an
d G
ende
r

119Section 5 - Retention & Graduation
SEC
TIO
N
5
cont
inue
d fro
m p
revi
ous
page
P
erc
en
t C
ha
ng
e
2011-2
012
2012-2
013
2013-2
014
20
14
-20
15
2
01
5-2
01
6
1 Y
ea
r 5
Yea
r
Ra
ce
Deg
ree L
evel
Fem
ale
M
ale
Fe
ma
le
Ma
le
Fem
ale
M
ale
Fe
ma
le
Ma
le
Fem
ale
M
ale
Un
ivers
ity T
ota
ls
Ba
chel
or’s
Deg
ree
1,1
92
874
1
,210
9
07
1,2
88
964
1
,355
9
62
1,2
98
1,0
18
0%
12%
M
aste
r’s D
egre
e 8
30
633
7
98
628
8
06
550
8
38
622
8
14
612
-2
%
-3%
Po
st-M
aste
r’s C
ertifi
cat
e 1
9
4
12
7
1
9
2
13
7
6
2
-6
0%
-65%
Do
ctor
al-R
esea
rch
13
2
2
24
2
0
22
1
6
34
2
5
31
2
3
-8%
54
%
Doct
oral
-Pro
fess
iona
l 9
8
106
7
9
99
9
2
100
7
0
77
6
6
82
1%
-2
7%To
tal
2
,15
2
1,6
39
2
,12
3
1,6
61
2
,22
7
1,6
32
2
,31
0
1,6
93
2
,21
5
1,7
37
-1
%
4%
No
te:
Deg
rees
/Cer
tifi c
ates
aw
arde
d su
mm
er t
hrou
gh s
prin
g.
*Tot
al M
inor
ity e
xclu
des
Whi
te, U
nkno
wn
and
Non
-Res
iden
t Alie
n.
Tabl
e 5.
15: A
nnua
l Aw
ards
by
Ethn
icit
y an
d G
ende
r

Cleveland State University / 2017 Book of Trends120

SEC
TIO
N
6
Academic & Administrative Programs
6Book of Trends

Cleveland State University / 2017 Book of Trends122

Section 6 - Selected Strategic Indicators
SEC
TIO
N
6
123
Honors ProgramJack, Joseph & Morton Mandel Honors College
New Enrollment by Cohort Year Percent Change
College 2012 2013 2014 2015 2016 1-year 5-year
Business 4 8 7 4 4 0% -43%CLASS 14 21 16 9 16 78% 14%Education 2 0 2 0 0 - -100%Nursing 5 4 1 4 0 -100% -Engineering 13 13 11 18 15 -17% 200%Science 23 26 31 20 22 10% -27%Urban Affairs 0 5 1 3 2 -33% 0%Undergraduate Studies 0 0 0 3 0 -100% -100%Total1 61 77 69 61 59 -3% -13% In Top 10% of High School Rank2 91% 77% 94% 87% 87% 0% 58%High School GPA 4.15 4.02 4.03 4.10 4.19 2% 5%ACT Composite 30 30 30 30 30 0% 0%SAT Composite3 1,930 1,922 1,983 1,932 1,958 1% 1%
Major Features of the Honors Program Enriched curriculum Leadership development Honors community and experiences
Table 6.1: Characteristics of New Honors Students - Fall 2012-2016
Table 6.2: Scholarship Aid for Honors Students by Financial Aid Year
Cleveland State University inaugurated its new Honors Program in Fall 2004 with a class of 40 highly motivated, academically talented fi rst-year students. In 2014 the Program was reconstituted as the Jack, Joseph & Morton Mandel Honors College. There are currently approximately 250 students in the Honors Program.
Freshmen admitted to the program receive renewable scholarships covering tuition and academic fees. Most Juniors admitted to the program receive renewable scholarships of $5000 per academic year. Honors students accept the challenge of participating in intensive and specialized versions of general education classes, advanced curricula in their chosen majors, and are granted special consideration in several areas including preference in registration and extended university library borrowing privileges.
As juniors and seniors, Honors students focus on their majors. Upper division Honors students have the opportunity to do additional honors work under faculty supervision in established courses, enroll in graduate courses, participate in a faculty member’s research project or laboratory, do an independent research project, a service learning project, and/or an internship, job, or engage in a co-op experience. The specifi c program depends on the student’s major.
First year students admitted in Fall 2016 were chosen from among applicants who were in the top 10% of their high school class or had a composite ACT score of at least 30. The Program also has an Upper-Division admission pathway for transfer students or rising CSU juniors with a GPA in college coursework of at least 3.5.
Honor student data reported in this table are provided by the Jack, Joseph & Morton Mandel Honors
College. Cohort Year includes newly admitted students in both lower and upper levels. High School
ranking, GPA, ACT and SAT scores reported are for “active” and “lower level” students only.
Starting in 2014 some upper divison honors students were admitted without scholarship, thus more
students were admitted then in previous years. 1 Total is not the sum of the students due to “dual” majors. 2 Please note: in any given year, roughly 15% of the Honors cohort comes from schools that do not rank
their students. These results should be read with caution. 3 All three SAT components (Math, Verbal, & Writing) are included. Not all students report SAT scores.
Financial Aid Year
2013-14 2014-15 2015-16 2016-2017
Type of Financial Aid Enrollment Total Average Enrollment Total Average Enrollment Total Average Enrollment Total Average
Need Based Tuition 89 $827,461 $9,297 77 $658,343 $8,550 74 $627,237 $8,476 72 $661,497 $9,187Merit Based Tuition 115 $1,196,001 $10,400 118 $1,151,753 $9,761 120 $1,082,920 $9,024 124 $1,127,576 $9,093Books 93 $66,400 $800 29 $23,200 $800 0 $0 $0 0 $0 $0On-Campus Housing 40 $83,666 $2,092 53 $107,636 $2,031 19 $36,000 $1,895 8 $21,272 $2,659Total 204 $2,173,528 $10,655 195 $1,940,932 $9,953 194 $1,746,157 $9,001 196 $1,810,345 $9,239
Source: Cleveland State University Financial Aid Offi ce

Cleveland State University / 2017 Book of Trends124
Tabl
e 6.
3: I
PED
S C
ohor
t C
hara
cter
isti
cs
US
Dep
artm
ent
of E
duca
tion,
Inte
grat
ed P
osts
econ
dary
Edu
catio
n D
ata
Sys
tem
(IP
EDS
) Fr
eshm
en C
ohor
t D
efi n
ition
:
1) A
stu
dent
att
endi
ng a
ny in
stitu
tion
of h
ighe
r le
arni
ng f
or t
he fi r
st t
ime
at t
he u
nder
grad
uate
leve
l, in
clud
es s
tude
nts
enro
lled
in t
he f
all t
erm
who
att
ende
d co
llege
for
the
fi r
st t
ime
in t
he p
rior
sum
mer
ter
m, a
lso
incl
udes
stu
dent
s w
ho e
nter
ed C
SU
with
adv
ance
d st
andi
ng (co
llege
cre
dits
ear
ned
befo
re g
radu
atio
n fr
om h
igh
scho
ol).
2) B
y th
e un
iver
sity
cen
sus
date
, the
stu
dent
has
regi
ster
ed f
or 1
2 o
r m
ore
cred
it ho
urs
in t
he f
all s
emes
ter.
3) T
he s
tude
nt is
see
king
a b
acca
laur
eate
deg
ree.
Tabl
e 6.
3a: A
vera
ge A
CT
Com
posi
te S
core
s by
Col
lege
for
IPED
S C
ohor
t St
uden
ts
U
nd
erg
rad
ua
te
Urb
an
Tota
l %
of
Coh
ort
Coh
ort
Bu
sin
ess
CLA
SS
E
du
ca
tion
E
ng
ineeri
ng
N
urs
ing
S
cie
nce
Stu
die
s
Aff
air
s
Un
ivers
ity
Coh
ort
w
ith
AC
T/S
AT
Fall
2012
To
tal S
tude
nts
175
435
66
188
116
386
105
8 1,4
79
1,53
1 97
%
Av
erag
e 21
.4
21.6
20
.8
23.9
22
.1
22.2
18
.6
23.8
21.8
Fall
2013
To
tal S
tude
nts
221
504
95
185
134
409
100
8 1,6
56
1,72
9 96
%
Av
erag
e 22
.0
21.6
20
.3
24.0
22
.1
22.1
18
.8
22.9
21.9
Fall
2014
To
tal S
tude
nts
215
425
51
196
120
352
130
12
1,5
01
1,56
2 96
%
Av
erag
e 21
.7
21.9
19
.6
23.9
21
.7
22.4
19
.7
19.3
21.9
Fall
2015
To
tal S
tude
nts
225
287
84
271
141
443
334
6 1,7
91
1,84
7 97
%
Av
erag
e 22
.0
22.0
20
.4
23.9
22
.2
22.3
20
.9
24.8
22.1
Fall
2016
To
tal S
tude
nts
246
321
81
295
145
440
312
13
1,8
53
1,89
1 98
%
Av
erag
e 21
.9
22.1
20
.2
24.1
22
.1
22.5
21
.0
24.1
22.2
Note
: The
ave
rage
AC
T C
ompo
site
sco
re r
epor
ted
is c
alcu
late
d us
ing
whi
chev
er is
the
hig
hest
of
each
stu
dent
’s A
CT,
IAC
T, o
r co
nver
ted
SAT
sco
res
(Ver
bal +
Mat
h sc
ores
onl
y co
nver
ted)
.
Due
to
chan
ges
in t
he S
AT t
est,
mul
tiple
met
hods
hav
e be
en u
sed
over
the
pas
t 5 y
ears
to
conv
ert
SAT
sco
res
to a
n eq
uiva
lent
AC
T sc
ore.

Section 6 - Selected Strategic Indicators
SEC
TIO
N
6
125
Table 6.3b: Fall IPEDS Cohort by Gender, 5 Year Trend
Fall 2012 Fall 2013 Fall 2014 Fall 2015 Fall 2016
Gender N % N % N % N % N %
Female 853 56% 971 56% 831 53% 996 54% 1029 54%Male 678 44% 758 44% 731 47% 851 46% 862 46%COHORT 1,531 100% 1,729 100% 1,562 100% 1,847 100% 1,891* 100%
*One student chose not to identify their gender
Table 6.3c: Fall IPEDS Cohort by Ethnicity, 5 Year Trend
Fall 2012 Fall 2013 Fall 2014 Fall 2015 Fall 2016
Ethnicity N % N % N % N % N %
White 973 64% 1,114 64% 1,018 65% 1,210 66% 1,249 66%African American 291 19% 301 17% 243 16% 265 14% 289 15%Hispanic 91 6% 106 6% 95 6% 118 6% 130 7%Asian 49 3% 48 3% 47 3% 59 3% 60 3%Native Hawaiian/Other Pacifi c Islander 2 0% 2 0% 2 0% 2 0% 1 0%Native American 5 0% 5 0% 2 0% 3 0% 2 0%Two or More Races 65 4% 70 4% 73 5% 83 4% 78 4%Minority Total 503 33% 532 31% 462 30% 530 29% 560 30%
Non-Resident Alien 33 2% 62 4% 61 4% 71 4% 47 2%Unknown 22 1% 21 1% 21 1% 36 2% 36 2%COHORT 1,531 100% 1,729 100% 1,562 100% 1,847 100% 1,892 100%
Table 6.3d: Fall IPEDS Cohort by Age Group, 5 Year Trend Fall 2012 Fall 2013 Fall 2014 Fall 2015 Fall 2016
Age N % N % N % N % N %
Under 18 90 6% 103 6% 77 5% 104 6% 61 3%18-19 1,372 90% 1,529 88% 1,414 91% 1,690 91% 1,771 94%20-21 21 1% 42 2% 33 2% 26 1% 36 2%22-24 16 1% 27 2% 21 1% 18 1% 14 1%25-29 19 1% 18 1% 10 1% 6 0% 5 0%30 and above 13 1% 10 1% 7 0% 3 0% 5 0%COHORT 1,531 100% 1,729 100% 1,562 100% 1,847 100% 1,892 100%
Table 6.3e: Fall IPEDS Cohort by Selected Major, 5 Year Trend Fall 2012 Fall 2013 Fall 2014 Fall 2015 Fall 2016
Academic Major Type N % N % N % N % N %
Major Selected 839 55% 981 57% 971 62% 1,076 58% 1,118 59%
“Pre” Major 474 31% 507 29% 312 20% 390 21% 445 24%
Major Undeclared 218 14% 241 14% 279 18% 381 21% 329 17%
COHORT 1,531 100% 1,729 100% 1,562 100% 1,847 100% 1,892 100%
Table 6.3f: Fall IPEDS Cohort by Notable Student Groups, 5 Year Trend Fall 2012 Fall 2013 Fall 2014 Fall 2015 Fall 2016
Student Groups N % N % N % N % N %
Living in 568 37% 586 34% 481 31% 544 29% 578 31% University Housing Honors 41 3% 44 3% 39 2% 38 2% 39 2%Ohio Resident 1,397 91% 1,569 91% 1,422 91% 1,670 90% 1,714 91%Pell Grant Recipient 797 52% 852 49% 713 46% 839 45% 809 43%Taking Developmental Crse 417 27% 463 27% 409 26% 420 23% 478 25%COHORT 1,531 1,729 1,562 1,847 1,892
Note: Groups are not exclusive; for instance, a single student might be an Ohio Resident, Living in University Housing and be in Honors.

Cleveland State University / 2017 Book of Trends126
Tabl
e 6.
4: A
vera
ge H
igh
Scho
ol G
PA b
y C
olle
ge fo
r IP
EDS
Coh
ort
Stud
ents
, 5 Y
ear T
rend
U
nd
erg
rad
ua
te
Urb
an
Tota
l %
of
Coh
ort
Coh
ort
Bu
sin
ess
CLA
SS
E
du
ca
tion
E
ng
ineeri
ng
N
urs
ing
S
cie
nce
Stu
die
s
Aff
air
s
Un
ivers
ity
Coh
ort
w
ith
HS
GPA
Fall
2012
To
tal S
tude
nts
181
439
67
201
116
389
106
9 1,5
08
1,53
1 98
%
Av
erag
e 3.
10
3.14
3.
22
3.45
3.
45
3.29
2.
65
3.37
3.2
1
Fall
2013
To
tal S
tude
nts
237
508
95
213
135
410
100
8 1,7
06
1,72
9 99
%
Av
erag
e 3.
14
3.20
3.
00
3.45
3.
50
3.34
2.
58
3.22
3.2
3
Fall
2014
To
tal S
tude
nts
227
427
54
222
121
354
135
12
1,5
52
1,56
2 99
%
Av
erag
e 3.
18
3.21
2.
97
3.39
3.
57
3.37
2.
80
2.98
3.2
5
Fall
2015
To
tal S
tude
nts
240
290
86
295
141
448
334
8 1,8
42
1,84
7 10
0%
Av
erag
e 3.
20
3.24
3.
13
3.40
3.
54
3.44
3.
06
3.46
3.2
9
Fall
2016
To
tal S
tude
nts
250
321
81
316
146
445
314
14
1,8
87
1,89
2 10
0%
Av
erag
e 3.
28
3.28
3.
15
3.40
3.
56
3.45
3.
02
3.61
3.3
2
Note
: Hig
h Sch
ool G
PAs
betw
een
‘gre
ater
tha
n 0’ an
d ‘le
ss o
r eq
ual t
o 5.0
’ w
ere
used
to
calc
ulat
e th
e av
erag
e. G
EDs
wer
e ex
clud
ed.

Section 6 - Selected Strategic Indicators
SEC
TIO
N
6
127
Fall Cumulative Average GPA
College 2012 2013 2014 2015 2016
Business 2.78 2.82 2.86 2.88 2.92
CLASS 2.88 2.90 2.90 2.93 2.96
Education 3.13 3.10 3.13 3.13 3.08
Engineering 2.88 2.89 2.95 2.91 2.92
Nursing 3.38 3.32 3.30 3.34 3.36
Science 3.00 3.03 3.05 3.05 3.09
Urban Affairs 3.06 3.06 3.06 3.05 3.07
Undergraduate Studies 2.79 2.86 2.77 2.71 2.66
Undergraduate Non-Degree 3.35 3.34 3.34 3.36 3.47
University Average 2.94 2.96 2.97 2.97 2.99
Source: Institutional Research
Table 6.5: Undergraduate Cumulative GPA by College: 5-Year Trend

Cleveland State University / 2017 Book of Trends128
Table 6.6a: Fall 2016 Top 15 Majors by Academic Level
Undergraduate: Graduate (excluding Law):
Description Total Description Total
Psychology-PSY 582 Business Administration-MBA 440
Biology-BIO 456 Electrical Engineering-ELG 247
General Business-BADM 438 Social Work-GSW 200
Mechanical Engineering-MCE 389 Master of Occupational Therapy-MOT 136
Health Sciences-HSCBS 374 Clinical Mental Health Cnsling-CAC 122
Accounting-ACT 350 Financial Accounting: Audit-ACCAUDIT 111
Criminology-CRIM 303 Doctor of Physical Therapy-DPT 107
Marketing-MKT 291 Adult Learning and Development-ALD 94
Finance-FIN 286 Health Science-Phy. A. Track-GHE-PA 89
Film, TV and Interactive Media-FILM/DGTAL 234 Computer and Information Scien-GCS 71
Nursing, BSN/RN-NUB 201 Information Systems-GIFS 70
Journalism & Promotional Comm-JRN/PROMOT 195 Educational Administration-EAD 67
Management & Labor Relations-MLR 194 Speech Pathology and Aud-GSP 67
Chemical Engineering-CHE 189 Mechanical Engineering-MCG 65
Communication-COM 184 Civil Engineering-CVG 63
Table 6.6b: Fall 2016 Top 15 Departments by Academic Level
Undergraduate: Graduate (excluding Law):
Description Total Description Total
Health Sciences 1,030 Business Administration 466
Communication 723 Health Sciences 458
Psychology 712 Teacher Education 413
Biology, Geology & Environmental Science 681 Electrical Engineering and Computer Science 372
Business Administration 546 CASAL 358
Criminology, Anthropology and Sociology 532 Social Work 200
Electrical Engineering and Computer Science 525 Urban Studies 157
Mechanical Engineering 472 Accounting 135
Urban Studies 440 Health and Human Performance 102
Accounting 391 Chemical & Biomedical Engineering 97
Nursing 360 Psychology 95
Teacher Education 343 Civil & Environmental Engineering 84
Finance 301 Doctoral 84
Marketing 300 Mechanical Engineering 81
Chemical & Biomedical Engineering 215 Biology, Geology & Environmental Science 73

Section 6 - Selected Strategic Indicators
SEC
TIO
N
6
129
Tota
l M
ino
rity
as a
% o
f
To
tal
Min
ori
ty a
s a
% o
f
M
ino
rity
M
ajo
r
Tota
l M
ajo
r
Min
ori
ty
Ma
jor
To
tal
Ma
jor
Ma
jor/
Pro
gra
m
En
roll
men
t E
nro
llm
en
t E
nro
llm
en
t M
ajo
r/P
rog
ram
E
nro
llm
en
t E
nro
llm
en
t E
nro
llm
en
t
Com
mun
icat
ion
Man
agem
ent-
COM
M M
GT
41
73
56%
A
dult
Lear
ning
and
Dev
elop
men
t-AL
D 51
94
54
%So
cial
Wor
k-SW
K 99
17
7 56
%
Hea
lth S
cien
ce-G
HE
19
38
50%
Span
ish-
SPN
15
28
54%
S
ocia
l Wor
k-GS
W
100
200
50%
Urba
n St
udie
s -
Publ
ic M
gmt-
UST
16
30
53%
La
bor R
elat
ions
and
Hum
an-G
LR
10
26
38%
Urba
n St
udie
s -
Regi
onal
Pln
g-US
TRPL
18
34
53
%
Cou
nsel
or E
duca
tion-
CNS
23
60
38%
NonP
rofi t
Adm
inis
trat
ion-
NAD
32
62
52%
C
&I-M
ild /
Mod
erat
e-C&
IMM
20
56
36
%So
ciol
ogy-
SOC
62
121
51%
N
ursi
ng-G
NR
17
48
35%
Heal
th S
cien
ces-
HSCB
S-PB
35
72
49
%
Clin
ical
Men
tal H
ealth
Cns
ling-
CAC
40
122
33%
Orga
niza
tiona
l Lea
ders
hip
Mgm
t-OR
L M
GMT
30
65
46%
C
&I-E
arly
Chi
ldho
od E
duc-
C&IE
CE
14
45
31%
Stud
io A
rt-A
RT S
TUDI
O 32
70
46
%
Pub
lic A
dmin
istr
atio
n-M
PA
16
56
29%
Heal
th S
cien
ces-
HSCB
S 15
9 37
4 43
%
Insp
ired
Lead
ers
Prin
cipa
l-INS
PLDR
-L
16
58
28%
Crim
inol
ogy-
CRIM
12
5 30
3 41
%
Edu
catio
nal A
dmin
istr
atio
n-EA
D 16
67
24
%Ch
emis
try-
CHM
PP
20
50
40%
G
radu
ate
Educ
atio
n Li
cens
ure-
EDUC
-LIC
10
42
24
%Or
gani
zatio
nal L
eade
rshi
p-OR
L 12
30
40
%
Hea
lth S
cien
ce-P
hy. A
. Tra
ck-G
HE-P
A 19
89
21
%Co
mm
unic
atio
n-CO
M
72
184
39%
Fi
nanc
ial A
ccou
ntin
g: A
udit-
ACCA
UDIT
23
11
1 21
%
No
tes:
Onl
y in
clud
es t
hose
maj
ors
with
mor
e th
an 2
5 t
otal
enr
ollm
ent.
M
ino
rity
: A
ll ra
ces
excl
udin
g W
hite
, Unk
now
n an
d N
on-R
esid
ent A
lien.
Tabl
e 6.
7: F
all 2
016
Top
15 D
egre
e Se
ekin
g Pr
ogra
ms
with
Hig
hest
Min
ority
Stu
dent
Enr
ollm
ent b
y A
cade
mic
Lev
el U
nd
erg
rad
ua
te:
Gra
du
ate
(excl
ud
ing
LA
W):
Tota
l M
ino
rity
as a
% o
f
M
ino
rity
M
ajo
r
Tota
l M
ajo
r
Ma
jor/
Pro
gra
m
En
roll
men
t E
nro
llm
en
t E
nro
llm
en
t
Pre-
Soci
al W
ork-
PSW
K 70
12
9 54
%Pr
e-Ed
uc &
Hum
an S
erv
(Edu
c)-P
EHSE
38
74
51
%Co
llege
Cre
dit P
lus-
PSEO
P 94
19
0 49
%Pr
e-M
edic
ine-
PREM
EDPB
36
73
49
%Pr
e-M
edic
ine-
PREM
ED
147
378
39%
Pre-
Vete
rinar
y M
edic
ine-
PREV
ET
17
45
38%
Pre-
Phar
mac
y-PR
EPHA
R 22
59
37
%Pr
e-He
alth
Scie
nce/
Phys
Thpy
Prep
-PRE
THP
23
62
37%
Pre-
Colle
ge o
f Eng
inee
ring-
PENG
US
12
34
35%
Pre-
Colle
ge o
f Eng
inee
ring-
PENG
87
25
0 35
%
No
tes:
Onl
y in
clud
es t
hose
maj
ors
with
mor
e th
an 2
5 t
otal
enr
ollm
ent.
Min
ori
ty: A
ll ra
ces
excl
udin
g W
hite
, Unk
now
n an
d N
on-R
esid
ent A
lien.
Top
10 U
nd
erg
rad
ua
te D
eg
ree-S
eek
ing
(P
re-M
ajo
rs/P
rog
ram
s)

Cleveland State University / 2017 Book of Trends130
Tota
l Fe
ma
le a
s a
% o
f
To
tal
Fem
ale
as a
% o
f
Fe
ma
le
Ma
jor
To
tal M
ajo
r
Fem
ale
M
ajo
r
Tota
l M
ajo
r
Ma
jor/
Pro
gra
m
En
rollm
en
t E
nro
llm
en
t E
nro
llm
en
t M
ajo
r/P
rog
ram
E
nro
llm
en
t E
nro
llm
en
t E
nro
llm
en
t
Early
Chi
ldho
od E
duca
tion-
ECE
138
147
94%
C
&I-L
itera
cy D
ev-R
eadi
ng-C
&ILI
TRDG
47
48
98
%Sp
eech
& H
earin
g-SP
H 86
96
90
%
Nur
sing
-GNR
45
48
94
%He
alth
Sci
ence
Pre
-Occ
Thr
py-H
STHO
98
11
0 89
%
Mas
ter o
f Occ
upat
iona
l The
rapy
-MOT
12
7 13
6 93
%Nu
rsin
g, B
SN/R
N-NU
B 17
8 20
1 89
%
Spe
ech
Path
olog
y an
d Au
d-GS
P 62
67
93
%M
ild/M
oder
ate
Educ
atio
nal N
eed-
SEDM
M
52
60
87%
C
&I-E
arly
Chi
ldho
od E
duc-
C&IE
CE
41
45
91%
NonP
rofi t
Adm
inis
trat
ion-
NAD
52
62
84%
A
dult
Lear
ning
and
Dev
elop
men
t-AL
D 80
94
85
%So
cial
Wor
k-SW
K 14
8 17
7 84
%
Cou
nsel
or E
duca
tion-
CNS
50
60
83%
Psyc
holo
gy-P
SY
467
582
80%
G
radu
ate
Educ
atio
n Li
cens
ure-
EDUC
-LIC
35
42
83
%Nu
rsin
g, B
SN-N
UR
39
49
80%
S
ocia
l Wor
k-GS
W
166
200
83%
Heal
th S
cien
ce P
re-P
hys
Asst
-HSP
HA
107
139
77%
La
bor R
elat
ions
and
Hum
an-G
LR
21
26
81%
Nurs
ing,
BSN
-NUB
APB
54
71
76%
C
linic
al M
enta
l Hea
lth C
nslin
g-CA
C 97
12
2 80
%An
thro
polo
gy-A
NT
44
58
76%
In
spire
d Le
ader
s Pr
inci
pal-I
NSPL
DR-L
45
58
78
%M
usic
The
rapy
-MUS
THP
Y 40
54
74
%
Hea
lth S
cien
ce-G
HE
29
38
76%
Heal
th S
cien
ces-
HSCB
S 27
7 37
4 74
%
MBA
-Hea
lth C
are-
MBH
31
41
76
%En
glis
h-Cr
eativ
e W
ritin
g Tr
ack-
ENGC
W
34
46
74%
P
h.D.
in U
rb E
du: C
ouns
el P
sy-U
ECP
20
27
74%
Note
s: O
nly
incl
udes
maj
ors
with
mor
e th
an 2
5 to
tal e
nrol
lmen
t
Min
ori
ty: A
ll ra
ces
excl
udin
g W
hite
, Unk
now
n an
d N
on-R
esid
ent A
lien
Un
derg
rad
ua
te:
Gra
du
ate
(excl
ud
ing
LA
W):
Tota
l Fe
ma
le a
s a
% o
f
Fe
ma
le
Ma
jor
To
tal M
ajo
r
Ma
jor/
Pro
gra
m
En
rollm
en
t E
nro
llm
en
t E
nro
llm
en
t
Pre-
Vete
rinar
y M
edic
ine-
PREV
ET
42
45
93%
Pre-
Heal
thSc
ienc
e/Oc
cThp
yPre
p-PR
ETHO
33
38
87
%Pr
epar
ator
y Nu
rsin
g-PS
NUR
200
233
86%
Pre-
Soci
al W
ork-
PSW
K 98
12
9 76
%Pr
e-Ed
ucat
ion-
PEDU
11
6 16
0 73
%Pr
e-M
edic
ine-
PREM
ED
236
378
62%
Pre-
Heal
thSc
ienc
e/Ph
ysTh
pyPr
ep-P
RETH
P 38
62
61
%Co
llege
Cre
dit P
lus-
PSEO
P 11
4 19
0 60
%Pr
e-Ph
arm
acy-
PREP
HAR
32
59
54%
Pre-
Educ
& H
uman
Ser
v (E
duc)
-PEH
SE
38
74
51%
Note
s: O
nly
incl
udes
maj
ors
with
mor
e th
an 2
5 to
tal e
nrol
lmen
t
Min
ori
ty: A
ll ra
ces
excl
udin
g W
hite
, Unk
now
n an
d N
on-R
esid
ent A
lien
Top
10 U
nd
erg
rad
ua
te D
eg
ree S
eek
ing
(P
re-M
ajo
rs/P
rog
ram
s)
Tabl
e 6.
8: F
all 2
016
Top
15 D
egre
e Se
ekin
g Pr
ogra
ms
wit
h H
ighe
st F
emal
e St
uden
t En
rollm
ent
by A
cade
mic
Lev
el

Section 6 - Selected Strategic Indicators
SEC
TIO
N
6
131
Perc
en
t C
ha
ng
e
Co
lleg
e
20
12
2
01
3
20
14
2
01
5
20
16
1
-Yea
r 5
-Yea
r
Secti
on
s
Avg
. Siz
e
Secti
on
s
Avg
. Siz
e
Secti
on
s
Avg
. Siz
e
Secti
on
s
Avg
. Siz
e
Secti
on
s
Avg
. Siz
e
Secti
on
s
Avg
. Siz
e
Secti
on
s
Avg
. Siz
e
Bu
sin
ess
Day
42
14
36
16
31
17
38
15
24
16
-37%
4%
-4
3%
10%
Eve
ning
92
19
88
19
81
18
82
16
54
18
-3
4%
11%
-4
1%
-7%
Oth
er
37
23
34
21
49
23
46
24
58
24
26%
2%
57
%
3% T
ota
l 171
19
158
19
161
19
166
18
136
20
-18%
12%
-2
0%
7%
CLA
SS Day
41
20
46
19
36
20
36
18
36
16
0%
-1
3%
-12%
-2
3% E
veni
ng
21
20
24
16
21
16
23
15
27
13
17%
-1
0%
29%
-3
2% O
ther
64
23
53
24
56
25
64
21
71
23
11
%
10%
11
%
-2%
Tota
l 126
22
123
21
113
21
123
19
134
19
9%
1%
6%
-1
2%
Ed
uca
tion
Day
25
15
20
14
18
13
17
15
24
11
41
%
-23%
-4
%
-27%
Eve
ning
47
14
39
15
39
11
46
13
36
12
-2
2%
-4%
-2
3%
-15%
Oth
er
83
18
90
16
80
17
80
15
84
15
5%
3%
1%
-15%
Tota
l 155
16
149
15
137
15
143
14
144
14
1%
-2
%
-7%
-1
7%
En
gin
eeri
ng
Day
5
23
5 24
6
24
6 24
14
22
13
3%
-11%
18
0%
-7%
Eve
ning
5
29
4 33
4
31
7 27
18
25
15
7%
-7%
26
0%
-13%
Oth
er
- -
- -
1 5
1 33
4
15
300%
-5
5%
--
-- T
ota
l 10
26
9
28
11
25
14
26
36
23
157%
-1
4%
260%
-1
3%
La
w
Day
5
25
6 8
5 16
6
14
5 7
-17%
-4
9%
0%
-72%
Eve
ning
7
15
9 14
8
10
9 13
4
13
-56%
-2
%
-43%
-1
9% O
ther
2
24
2 15
6
11
2 13
4
14
100%
4%
10
0%
-44%
Tota
l 14
20
17
12
19
12
17
13
13
11
-24%
-1
8%
-7
%
-47%
Nu
rsin
g
Day
3
64
3 65
3
65
4 52
3
70
-25%
34
%
0%
8% O
ther
4
13
6 12
6
11
5 12
8
12
60%
0%
10
0%
-5%
Tota
l 7
35
9
30
9
29
9
30
11
28
22%
-7
%
57%
-2
0%
Oth
er D
ay
25
15
42
12
41
12
36
12
0 0
-100
%
-100
%
-100
%
-100
% O
ther
1
21
1 39
1
29
1 25
1
20
0%
-20%
0%
-5
% T
ota
l 26
15
43
13
42
12
37
12
1
20
-97%
67%
-9
6%
32%
Tabl
e 6.
9: S
umm
er C
lass
Sec
tion
and
Ave
rage
Cla
ss S
ize
by T
ime
of D
ay a
nd C
olle
ge: 5
-Yea
r Tre
nd
(con
tinue
d on
nex
t pa
ge)

Cleveland State University / 2017 Book of Trends132
Tabl
e 6.
9: S
umm
er C
lass
Sec
tion
and
Ave
rage
Cla
ss S
ize
by T
ime
of D
ay a
nd C
olle
ge: 5
-Yea
r Tre
nd
P
erc
en
t C
ha
ng
e
Colleg
e
2012
2013
2014
2015
2016
1-Y
ea
r 5-Y
ea
r
Secti
on
s
Avg
. Siz
e
Secti
on
s
Avg
. Siz
e
Secti
on
s
Avg
. Siz
e
Secti
on
s
Avg
. Siz
e
Secti
on
s
Avg
. Siz
e
Secti
on
s
Avg
. Siz
e
Secti
on
s
Avg
. Siz
e
Scie
nce
Day
82
24
76
24
82
20
108
19
104
20
-4%
6%
27
%
-17%
Even
ing
15
17
13
17
17
15
10
11
10
15
0%
44%
-3
3%
-10%
Othe
r 42
22
58
20
56
19
55
20
48
19
-1
3%
-3%
14
%
-13%
Tota
l 139
22
147
22
155
19
173
18
162
19
-6%
4%
17%
-1
4%
Urb
an
Aff
air
s
Eve
ning
11
13
11
11
11
13
14
12
14
13
0%
7%
27
%
2% O
ther
23
25
22
27
21
25
20
25
22
20
10
%
-20%
-4
%
-20%
Tota
l 34
21
33
21
32
21
34
20
36
17
6%
-1
2%
6%
-1
8%
Un
derg
rad
ua
te S
tud
ies
Day
-
- -
- -
- -
- 8
14
--
--
--
-- T
ota
l -
- -
- -
- -
- 8
14
--
--
--
--
Un
ivers
ity T
ota
l
Day
22
8 20
23
4 19
22
2 18
25
1 17
21
8 18
-1
3%
6%
-4%
-1
0% E
veni
ng
198
17
188
17
181
16
191
15
163
16
-15%
7%
-1
8%
-6%
Oth
er
256
21
266
20
276
20
274
19
300
20
9%
5%
17%
-5
% T
ota
l 682
20
688
19
679
18
716
17
681
18
-5%
6%
0%
-1
0%
Note
s: Th
is t
able
onl
y re
fl ect
s le
ctur
e, s
emin
ar a
nd s
tudi
o co
urse
s w
ith 5
or
mor
e st
uden
ts e
nrol
led.
The
time
of d
ay d
esig
nate
d as
‘Oth
er’ in
clud
es w
eeke
nds
(Frida
y af
ter
4pm
, Sat
urda
y an
d Sun
day)
and
sec
tions
with
no
clas
s tim
e. C
ross
list
ed c
ours
es a
re c
ount
ed o
nce
only
.
Day
, Eve
ning
and
Wee
kend
s ar
e de
term
ined
by
mee
ting
time.
Som
e w
eb c
ours
es m
ay b
e in
clud
ed d
ue t
o av
aila
ble
mee
ting
time.
Da
y: M
onda
y –
Frida
y 7 a
m t
o 4 p
m.
Even
ing
: M
onda
y –
Thu
rsda
y 4 p
m t
o 12 a
m.
(con
tinue
d fr
om p
revi
ous
page
)

Section 6 - Selected Strategic Indicators
SEC
TIO
N
6
133
Perc
en
t C
ha
ng
e
Co
lleg
e
20
12
2
01
3
20
14
2
01
5
20
16
1
-Yea
r 5
-Yea
r
Secti
on
s
Avg
. Siz
e
Secti
on
s
Avg
. Siz
e
Secti
on
s
Avg
. Siz
e
Secti
on
s
Avg
. Siz
e
Secti
on
s
Avg
. Siz
e
Secti
on
s
Avg
. Siz
e
Secti
on
s
Avg
. Siz
e
Bu
sin
ess
Day
87
33
87
34
98
34
101
36
101
38
0%
5%
16%
16
% E
veni
ng
157
24
152
25
152
25
119
24
117
27
-2%
11
%
-25%
9%
Oth
er
59
25
58
28
58
29
66
28
68
30
3%
7%
15%
19
% T
ota
l 303
27
297
28
308
28
286
29
286
31
0%
7%
-6
%
17%
CLA
SS Day
35
4 30
38
6 29
39
5 32
39
9 30
40
4 30
1%
0%
14
%
3% E
veni
ng
141
25
129
25
153
22
146
24
141
23
-3%
-4
%
0%
-6%
Oth
er
53
25
51
25
54
24
61
24
58
26
-5%
8%
9%
4%
Tota
l 548
28
566
28
602
28
606
28
603
28
0%
0%
10%
1%
Ed
uca
tion
Day
44
23
41
24
50
21
87
18
71
18
-1
8%
-4%
61
%
-24%
Eve
ning
10
1 20
10
6 19
98
17
98
17
86
16
-1
2%
-3%
-1
5%
-18%
Oth
er
88
20
98
20
91
21
99
20
95
19
-4%
-7
%
8%
-6%
Tota
l 233
21
245
20
239
19
284
19
252
18
-11%
-5
%
8%
-1
4%
En
gin
eeri
ng
Day
43
29
45
32
70
31
85
35
83
35
-2
%
2%
93%
22
% E
veni
ng
64
21
69
23
59
29
82
31
86
32
5%
3%
34%
51
% O
ther
5
15
1 54
2
49
3 6
1 49
-6
7%
765%
-8
0%
218%
Tota
l 112
24
115
27
131
31
170
33
170
34
0%
4%
52%
41%
Hon
ors Day
8
17
8 21
10
14
7
18
9 15
29
%
-15%
13
%
-9%
Oth
er
4 13
2
18
4 15
5
13
3 16
-4
0%
21%
-2
5%
18%
Tota
l 12
15
10
20
14
15
12
16
12
15
0%
-3
%
0%
-2
%
La
w
Day
42
28
40
28
39
26
36
27
33
24
-8
%
-11%
-2
1%
-15%
Eve
ning
41
20
41
15
38
16
32
17
35
16
9%
-9
%
-15%
-2
0% O
ther
6
16
4 12
2
12
3 23
3
23
0%
1%
-50%
44
% T
ota
l 89
23
85
21
79
21
71
22
71
20
0%
-1
1%
-2
0%
-1
5%
Nu
rsin
g
Day
13
73
14
69
13
70
14
68
15
67
7%
-2
%
15%
-8
% E
veni
ng
0 0
0 0
0 0
1 22
1
14
0%
-36%
--
--
Oth
er
13
17
12
17
12
16
10
22
13
22
30%
-1
%
0%
28%
Tota
l 26
45
26
45
25
44
25
48
29
45
16%
-6
%
12%
0%
Tabl
e 6.
10:
Fall
Sect
ion
Enro
llmen
t by
Tim
e of
Day
and
Col
lege
: 5-Y
ear T
rend
(con
tinue
d on
nex
t pa
ge)

Cleveland State University / 2017 Book of Trends134
Tabl
e 6.
10:
Fall
Sect
ion
Enro
llmen
t by
Tim
e of
Day
and
Col
lege
: 5-Y
ear T
rend
P
erc
en
t C
ha
ng
e
Colleg
e
2012
2013
2014
2015
2016
1-Y
ea
r 5-Y
ea
r
Secti
on
s
Avg
. Siz
e
Secti
on
s
Avg
. Siz
e
Secti
on
s
Avg
. Siz
e
Secti
on
s
Avg
. Siz
e
Secti
on
s
Avg
. Siz
e
Secti
on
s
Avg
. Siz
e
Secti
on
s
Avg
. Siz
e
Oth
er
Day
49
18
45
16
48
14
3 13
4
9 33
%
-31%
-9
2%
-48%
Eve
ning
10
16
5
16
8 15
0
0 0
0 --
--
-1
00%
-1
00%
Oth
er
3 33
3
33
3 32
2
49
2 42
0%
-1
4%
-33%
25
% T
ota
l 62
18
53
17
59
15
5
27
6
20
20%
-2
7%
-9
0%
10%
Scie
nce
Day
22
2 44
23
4 44
25
2 43
26
6 44
25
6 44
-4
%
1%
15%
-1
% E
veni
ng
89
32
84
33
93
30
95
30
96
28
1%
-5%
8%
-1
0% O
ther
53
29
58
29
72
25
79
26
80
26
1%
-2
%
51%
-1
0% T
ota
l 364
39
376
40
417
37
440
37
432
37
-2%
-1
%
19%
-4
%
Un
derg
rad
Stu
die
s
Day
53
25
60
25
59
23
54
26
61
24
13
%
-8%
15
%
-7%
Eve
ning
2
23
5 19
5
15
5 22
5
18
0%
-19%
15
0%
-21%
Oth
er
2 20
2
13
1 10
0
0 0
0 --
--
-1
00%
-1
00%
Tota
l 57
25
67
24
65
22
59
25
66
23
12%
-9
%
16%
-7
%
Urb
an
Aff
air
s
Day
13
37
10
46
11
43
11
46
11
45
0%
-4
%
-15%
20
% E
veni
ng
52
18
48
19
50
18
49
20
47
20
-4%
-4
%
-10%
11
% O
ther
25
45
27
41
34
38
34
36
34
36
0%
1%
36
%
-19%
Tota
l 90
28
85
29
95
28
94
29
92
29
-2%
-1
%
2%
3%
Un
ivers
ity T
ota
l
Da
y 92
8 33
97
0 33
1,
045
33
1,06
3 34
1,
048
34
-1%
0%
13
%
3% E
veni
ng
657
24
639
24
656
23
627
24
614
24
-2%
0%
-7
%
0% O
ther
31
1 25
31
6 26
33
3 25
36
2 25
35
7 26
-1
%
4%
15%
4%
Tota
l 1,8
96
28
1,9
25
29
2,0
34
28
2,0
52
29
2,0
19
29
-2%
0%
6%
4%
Not
es: T
his
tabl
e on
ly r
efl e
cts
lect
ure,
sem
inar
and
stu
dio
cour
ses
with
5 o
r m
ore
stud
ents
enr
olle
d.
The
time
of d
ay d
esig
nate
d as
‘Oth
er’ in
clud
es w
eeke
nds
(Frida
y af
ter
4pm
, Sat
urda
y an
d Sun
day)
and
sec
tions
with
no
clas
s tim
e. C
ross
list
ed c
ours
es a
re c
ount
ed o
nce
only
.
Day
, Eve
ning
and
Wee
kend
cou
rses
are
det
erm
ined
by
mee
ting
time.
Som
e w
eb c
ours
es m
ay b
e in
clud
ed d
ue t
o av
aila
ble
mee
ting
time.
Da
y: M
onda
y –
Frida
y 7 a
m t
o 4 p
m.
Even
ing
: M
onda
y –
Thu
rsda
y 4 p
m t
o 12 a
m.
(con
tinue
d fr
om p
revi
ous
page
)

Section 6 - Selected Strategic Indicators
SEC
TIO
N
6
135
Perc
en
t C
ha
ng
e
Co
lleg
e
20
13
2
01
4
20
15
2
01
6
20
17
1
-Yea
r 5
-Yea
r
Secti
on
s
Avg
. Siz
e
Secti
on
s
Avg
. Siz
e
Secti
on
s
Avg
. Siz
e
Secti
on
s
Avg
. Siz
e
Secti
on
s
Avg
. Siz
e
Secti
on
s
Avg
. Siz
e
Secti
on
s
Avg
. Siz
e
Bu
sin
ess
Day
82
34
83
34
94
35
86
37
87
38
1%
3%
6%
13%
Eve
ning
15
2 25
14
3 25
14
6 24
12
5 24
10
7 28
-1
4%
16%
-3
0%
12%
Oth
er
51
25
51
29
56
30
71
28
65
36
-8%
28
%
27%
44
% T
ota
l 285
28
277
29
296
29
282
29
259
33
-8%
15%
-9
%
21%
CLA
SS Day
32
9 30
34
3 30
35
0 30
37
1 30
37
3 29
1%
-3
%
13%
-3
% E
veni
ng
135
24
129
23
148
24
146
24
131
23
-10%
-4
%
-3%
-3
% O
ther
61
25
60
24
59
26
59
26
63
28
7%
11
%
3%
14%
Tota
l 525
28
532
28
557
28
576
28
567
28
-2%
-2
%
8%
-1
%
Ed
uca
tion
Day
48
22
43
23
46
20
83
17
70
18
-1
6%
7%
46%
-1
6% E
veni
ng
107
19
98
18
91
19
89
17
76
17
-15%
-2
%
-29%
-1
2% O
ther
85
21
94
20
10
3 19
10
5 20
11
1 19
6%
-7
%
31%
-1
0% T
ota
l 240
20
235
20
240
19
277
18
257
18
-7%
-1
%
7%
-1
1%
En
gin
eeri
ng
Day
49
27
51
30
54
34
72
37
72
37
0%
-1
%
47%
34
% E
veni
ng
57
22
76
22
70
27
83
29
88
30
6%
3%
54%
37
% O
ther
2
32
0 0
1 31
0
0 6
9 --
--
20
0%
-71%
Tota
l 108
25
127
25
125
30
155
33
166
32
7%
-2
%
54%
31%
Hon
ors Day
8
15
6 20
4
22
6 16
5
17
-17%
6%
-3
8%
12%
Eve
ning
0
0 0
0 1
23
1 16
1
23
0%
0%
--
-- O
ther
3
15
3 19
6
13
4 17
3
20
-25%
21
%
0%
31%
Tota
l 11
15
9
19
11
17
11
16
9
19
-18%
15%
-1
8%
22%
La
w
Day
41
28
41
25
36
27
34
24
29
24
-1
5%
1%
-29%
-1
4% E
veni
ng
29
19
33
17
26
19
23
21
23
17
0%
-19%
-2
1%
-10%
Oth
er
4 27
3
19
3 17
7
21
9 15
29
%
-29%
12
5%
-43%
Tota
l 74
24
77
21
65
23
64
23
61
20
-5%
-1
1%
-1
8%
-1
8%
Tabl
e 6.
11:
Spri
ng S
ecti
on E
nrol
lmen
t by
Tim
e of
Day
and
Col
lege
: 5-Y
ear T
rend
(con
tinue
d on
nex
t pa
ge)

Cleveland State University / 2017 Book of Trends136
P
erc
en
t C
ha
ng
e
Colleg
e
2013
2014
2015
2016
2017
1-Y
ea
r 5-Y
ea
r
Secti
on
s
Avg
. Siz
e
Secti
on
s
Avg
. Siz
e
Secti
on
s
Avg
. Siz
e
Secti
on
s
Avg
. Siz
e
Secti
on
s
Avg
. Siz
e
Secti
on
s
Avg
. Siz
e
Secti
on
s
Avg
. Siz
e
Nu
rsin
g
Day
14
70
14
70
17
57
14
71
14
75
0%
5%
0%
6% O
ther
13
17
11
16
10
19
15
19
15
20
0%
7%
15
%
21%
Tota
l 27
44
25
46
27
43
29
44
29
47
0%
6%
7%
5%
Oth
er D
ay
45
17
49
14
49
15
3 14
2
10
-33%
-3
0%
-96%
-4
0% E
veni
ng
9 20
6
18
5 16
0
0 0
0 --
--
--
--
Oth
er
3 44
2
49
2 46
2
48
2 40
0%
-1
8%
-33%
-1
0% T
ota
l 57
19
57
15
56
16
5
28
4
25
-20%
-1
1%
-9
3%
33%
Scie
nce
Day
20
7 42
21
0 43
25
2 39
23
6 42
26
5 38
12
%
-8%
28
%
-9%
Eve
ning
88
31
91
32
84
30
93
30
86
30
-8
%
1%
-2%
-1
% O
ther
53
28
58
28
67
26
74
28
71
29
-4
%
6%
34%
4%
Tota
l 348
37
359
38
403
35
403
36
422
35
5%
-4
%
21%
-5
%
Un
derg
rad
Stu
die
s
Day
8
26
8 24
8
24
8 29
8
26
0%
-10%
0%
0%
Eve
ning
1
21
1 20
1
23
1 29
1
9 0%
-6
9%
0%
-57%
Tota
l 9
25
9
24
9
24
9
29
9
24
0%
-1
7%
0%
-5
%
Urb
an
Aff
air
s
Day
11
41
13
37
10
44
11
44
12
43
9%
-2
%
9%
5% E
veni
ng
46
18
50
17
55
18
52
18
50
18
-4%
0%
9%
-3
% O
ther
26
44
28
41
31
41
32
38
31
36
-3
%
-7%
19
%
-19%
Tota
l 83
29
91
27
96
28
95
28
93
27
-2%
-3
%
12%
-8
%
Un
ivers
ity T
ota
l
Day
84
2 33
86
1 33
92
0 32
92
4 33
93
7 33
1%
0%
11
%
0% E
veni
ng
624
23
627
23
627
24
613
24
563
25
-8%
4%
-1
0%
9% O
ther
30
1 26
31
0 26
33
8 26
36
9 26
37
6 27
2%
4%
25
%
4%
Tota
l 1,7
67
28
1,7
98
28
1,8
85
28
1,9
06
29
1,8
76
29
-2%
0%
6%
4%
Not
es: T
his
tabl
e on
ly r
efl e
cts
lect
ure,
sem
inar
and
stu
dio
cour
ses
with
5 o
r m
ore
stud
ents
enr
olle
d.
The
time
of d
ay d
esig
nate
d as
‘Oth
er’ in
clud
es w
eeke
nds
(Frida
y af
ter
4pm
, Sat
urda
y an
d Sun
day)
and
sec
tions
with
no
clas
s tim
e. C
ross
list
ed c
ours
es a
re c
ount
ed o
nce
only
.
Day
, Eve
ning
and
Wee
kend
cou
rses
are
det
erm
ined
by
mee
ting
time.
Som
e w
eb c
ours
es m
ay b
e in
clud
ed d
ue t
o av
aila
ble
mee
ting
time.
Da
y: M
onda
y –
Frida
y 7 a
m t
o 4 p
m.
Even
ing
: M
onda
y –
Thu
rsda
y 4 p
m t
o 12 a
m.
Tabl
e 6.
11:
Spri
ng S
ecti
on E
nrol
lmen
t by
Tim
e of
Day
and
Col
lege
: 5-Y
ear T
rend
(con
tinue
d fr
om p
revi
ous
page
)
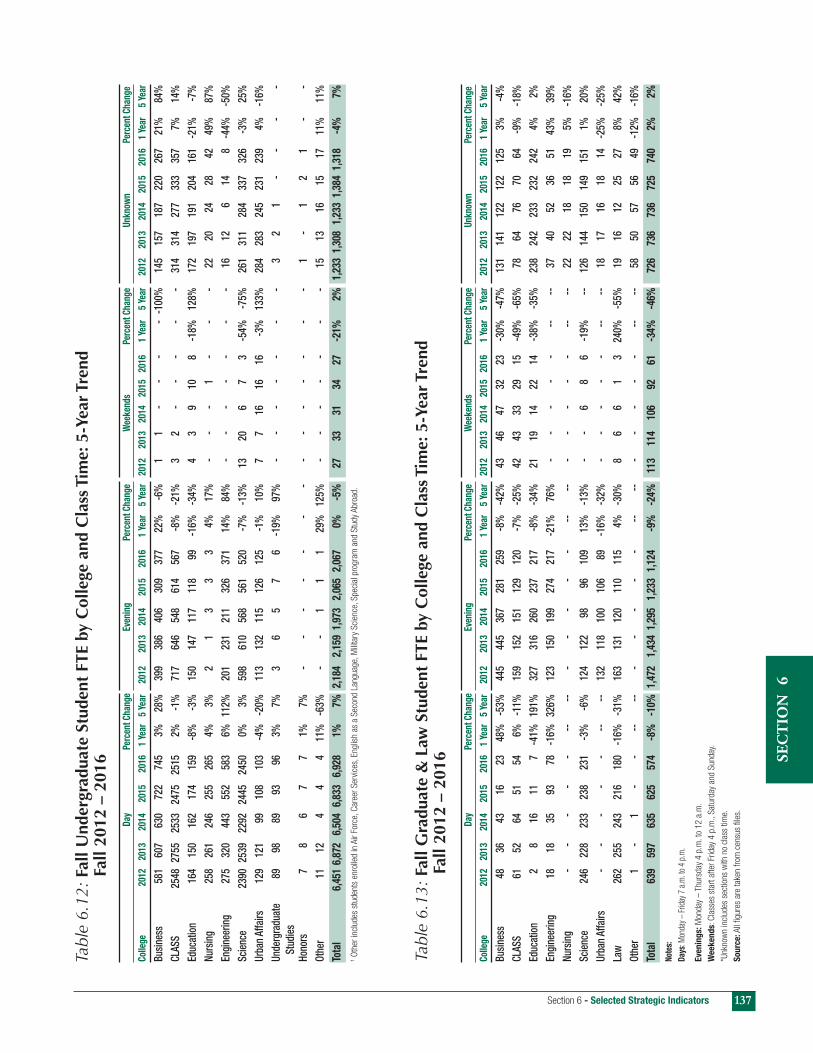
Section 6 - Selected Strategic Indicators
SEC
TIO
N
6
137
D
ay
Perc
ent
Cha
nge
Even
ing
Perc
ent
Cha
nge
Wee
kend
s Pe
rcen
t C
hang
e U
nkno
wn
Perc
ent
Cha
nge
Col
lege
20
12
2013
20
14
2015
20
16
1 Ye
ar
5 Ye
ar
2012
20
13
2014
20
15
2016
1
Year
5
Year
20
12
2013
20
14
2015
20
16
1 Ye
ar
5 Ye
ar
2012
20
13
2014
20
15
2016
1
Year
5
Year
Busin
ess
581
607
630
722
745
3%
28%
39
9 38
6 40
6 30
9 37
7 22
%
-6%
1
1 -
- -
- -1
00%
14
5 15
7 18
7 22
0 26
7 21
%
84%
CLAS
S 25
48 2
755
2533
24
75
2515
2%
-1
%
717
646
548
614
567
-8%
-2
1%
3 2
- -
- -
- 31
4 31
4 27
7 33
3 35
7 7%
14
%Ed
ucat
ion
164
150
162
174
159
-8%
-3
%
150
147
117
118
99
-16%
-3
4%
4 3
9 10
8
-18%
12
8%
172
197
191
204
161
-21%
-7
%Nu
rsin
g 25
8 26
1 24
6 25
5 26
5 4%
3%
2
1 3
3 3
4%
17%
-
- -
1 -
- -
22
20
24
28
42
49%
87
%En
gine
erin
g 27
5 32
0 44
3 55
2 58
3 6%
11
2%
201
231
211
326
371
14%
84
%
- -
- -
- -
- 16
12
6
14
8 -4
4%
-50%
Scie
nce
2390
253
9 22
92
2445
24
50
0%
3%
598
610
568
561
520
-7%
-1
3%
13
20
6 7
3 -5
4%
-75%
26
1 31
1 28
4 33
7 32
6 -3
%
25%
Urba
n Af
fairs
12
9 12
1 99
10
8 10
3 -4
%
-20%
11
3 13
2 11
5 12
6 12
5 -1
%
10%
7
7 16
16
16
-3
%
133%
28
4 28
3 24
5 23
1 23
9 4%
-1
6%Un
derg
radu
ate
89
98
89
93
96
3%
7%
3 6
5 7
6 -1
9%
97%
-
- -
- -
- -
3 2
1 -
- -
-
Stud
ies
Hono
rs
7 8
6 7
7 1%
7%
-
- -
- -
- -
- -
- -
- -
- 1
- 1
2 1
- -
Othe
r 11
12
4
4 4
11%
-6
3%
- -
1 1
1 29
%
125%
-
- -
- -
- -
15
13
16
15
17
11%
11
%To
tal
6,45
1 6,
872
6,50
4 6,
833
6,92
8 1%
7%
2,
184
2,15
9 1,
973
2,06
5 2,
067
0%
-5%
27
33
31
34
27
-2
1%
2%
1,23
3 1,
308
1,23
3 1,
384
1,31
8 -4
%
7%
1 O
ther
incl
udes
stu
dent
s en
rolle
d in
Air F
orce
, Car
eer
Ser
vice
s, E
nglis
h as
a S
econ
d La
ngua
ge, M
ilita
ry S
cien
ce, S
peci
al p
rogr
am a
nd S
tudy
Abr
oad.
Tabl
e 6.
12:
Fall
Und
ergr
adua
te S
tude
nt F
TE b
y C
olle
ge a
nd C
lass
Tim
e: 5
-Yea
r Tre
nd
Fall
2012
– 2
016
Tabl
e 6.
13:
Fall
Gra
duat
e &
Law
Stu
dent
FTE
by
Col
lege
and
Cla
ss T
ime:
5-Y
ear T
rend
Fa
ll 20
12 –
201
6
D
ay
Perc
ent
Cha
nge
Even
ing
Perc
ent
Cha
nge
Wee
kend
s Pe
rcen
t C
hang
e U
nkno
wn
Perc
ent
Cha
nge
Col
lege
20
12
2013
20
14
2015
20
16
1 Ye
ar
5 Ye
ar
2012
20
13
2014
20
15
2016
1
Year
5
Year
20
12
2013
20
14
2015
20
16
1 Ye
ar
5 Ye
ar
2012
20
13
2014
20
15
2016
1
Year
5
Year
Busin
ess
48
36
43
16
23
48%
-5
3%
445
445
367
281
259
-8%
-4
2%
43
46
47
32
23
-30%
-4
7%
131
141
122
122
125
3%
-4%
CLAS
S 61
52
64
51
54
6%
-1
1%
159
152
151
129
120
-7%
-2
5%
42
43
33
29
15
-49%
-6
5%
78
64
76
70
64
-9%
-1
8%Ed
ucat
ion
2 8
16
11
7 -4
1%
191%
32
7 31
6 26
0 23
7 21
7 -8
%
-34%
21
19
14
22
14
-3
8%
-35%
23
8 24
2 23
3 23
2 24
2 4%
2%
Engi
neer
ing
18
18
35
93
78
-16%
32
6%
123
150
199
274
217
-21%
76
%
- -
- -
- --
--
37
40
52
36
51
43
%
39%
Nurs
ing
- -
- -
- --
--
-
- -
- -
--
--
- -
- -
- --
--
22
22
18
18
19
5%
-1
6%Sc
ienc
e 24
6 22
8 23
3 23
8 23
1 -3
%
-6%
12
4 12
2 98
96
10
9 13
%
-13%
-
- 6
8 6
-19%
--
12
6 14
4 15
0 14
9 15
1 1%
20
%Ur
ban
Affa
irs
- -
- -
- --
--
13
2 11
8 10
0 10
6 89
-1
6%
-32%
-
- -
- -
--
--
18
17
16
18
14
-25%
-2
5%La
w
262
255
243
216
180
-16%
-3
1%
163
131
120
110
115
4%
-30%
8
6 6
1 3
240%
-5
5%
19
16
12
25
27
8%
42%
Othe
r 1
- 1
- -
--
--
- -
- -
- --
--
-
- -
- -
--
--
58
50
57
56
49
-12%
-1
6%To
tal
639
597
635
625
574
-8%
-1
0%
1,47
2 1,
434
1,29
5 1,
233
1,12
4 -9
%
-24%
11
3 11
4 10
6 92
61
-3
4%
-46%
72
6 73
6 73
6 72
5 74
0 2%
2%
Not
es:
Day
s: M
onda
y –
Frid
ay 7
a.m
. to
4 p.
m.
Even
ing
s:
Mon
day
– T
hurs
day
4 p
.m. t
o 1
2 a
.m.
Week
en
ds: C
lass
es s
tart
aft
er F
rida
y 4
p.m
., S
atur
day
and
Sun
day.
*Unk
now
n in
clud
es s
ectio
ns w
ith n
o cl
ass
time.
So
urc
e: A
ll fi g
ures
are
tak
en f
rom
cen
sus
fi les
.

Cleveland State University / 2017 Book of Trends138
Table 6.14a: Annual Web Historical Enrollment and SCH Trends WEB
Enrollment Percent Change SCH Percent Change
Term 2012-13 2013-14 2014-15 2015-16 2016-17 1-Year 5-Year 2012-13 2013-14 2014-15 2015-16 2016-17 1-Year 5-Year
Summer 3,203 3,085 3,195 3,186 3,465 9% 8% 16,575 16,023 17,195 15,193 17,026 12% 3%Fall 4,622 4,785 4,960 5,351 5,528 3% 20% 21,585 22,575 21,208 23,784 24,490 3% 13%Spring 4,592 4,502 5,000 5,527 5,684 3% 24% 21,359 21,042 21,885 24,319 25,922 7% 21%Total 12,417 12,372 13,155 14,064 14,677 4% 18% 59,519 59,640 60,288 63,296 67,438 7% 13%
* Web-based: Courses delivered primarily using the Internet. These courses are identifi ed by their class attribute (Online and/or Blended).
Note: In prior years, enrollment and SCH was based on those students who did not have a withdrawal date for a Web Based Course. This was inconsistent with the rest of the Book of Trends and has been
changed this year to maintain better consistency within the book.
Enrollment within each semester is unduplicated, but Total may be duplicated if a student was enrolled in multiple terms over the year.
Figure 6.14a: Annual Web Historical Enrollment and SCH Trends
Center for eLearningIn 2006 the Center for eLearning was established to lead the University’s eLearning initiative. The Center has the goals of increasing University
enrollments and enhancing academic quality through fully online degree and certifi cate programs available.
The Center’s major roles are to:
Provide leadership for the University’s eLearning initiative
Support and train faculty in designing and developing fully online, blended, and Web-enhanced courses
Work with academic units on eLearning program development and marketing
Lead in the use of emerging eLearning technologies
Ensure availability of information and services for online students
Since its establishment, the Center has worked energetically to create a solid support infrastructure for eLearning and to expand the number of
programs and courses offered in online or blended formats. As the charts below show, substantial growth in eLearning enrollments has occurred
as more online and blended courses are being offered. Enrollments in eLearning courses have continued to grow rapidly, new programs have
joined the group of programs already offered online, and support for both faculty and students is strong.
SpringFallSummer
2012-13 2013-14 2014-15 2015-16 2016-17
6000
5000
4000
3000
2000
1000
0
2012-13 2013-14 2014-15 2015-16 2016-17
0
5000
10000
15000
20000
25000
30000
SpringFallSummer

Section 6 - Selected Strategic Indicators
SEC
TIO
N
6
139
Table 6.14b: 5-Year Trends in Web-Based Instructional Delivery Student Credit Hours Generated
Undergraduate
Fall Percent Change
Web-Based** 2012 2013 2014 2015 2016 1-Year 5-Year
Business 2,001 2,294 2,634 3,225 3,927 22% 96%CLASS 3,619 3,460 2,901 3,621 4,019 11% 11%Education 1,504 2,023 2,027 2,174 1,496 -31% -1%Engineering 227 64 - 110 - - -Nursing 327 298 315 417 623 49% 91%Science 3,589 3,932 3,777 4,648 4,435 -5% 24%Urban Affairs 4,181 4,152 3,579 3,369 3,450 2% -17%Other (AF-CSC-MSC) 100 90 88 97 83 -14% -17%Total 15,548 16,313 15,321 17,661 18,033 2% 16%
Graduate
Fall Percent Change
Web-Based** 2012 2013 2014 2015 2016 1-Year 5-Year
Business 1,540 1,767 1,390 1,618 1,766 9% 15%CLASS 305 144 246 243 135 -44% -56%Education 2,927 3,079 2,886 3,047 3,047 0% 4%Engineering 84 152 388 - 196 - 133%Law - - - 154 193 25% -Nursing 331 320 267 266 279 5% -16%Science 674 622 606 651 741 14% 10%Urban Affairs 168 160 104 144 100 -31% -40%Other (AF-CSC-MSC) 8 18 - - - - -Total 6,037 6,262 5,887 6,123 5,887 -6% -2%
Totals
Fall Percent Change
Web-Based** 2012 2013 2014 2015 2016 1-Year 5-Year
Business 3,541 4,061 4,024 4,843 5,693 18% 61%CLASS 3,924 3,604 3,147 3,864 4,154 8% 6%Education 4,431 5,102 4,913 5,221 4,543 -13% 3%Engineering 311 216 388 110 196 78% -37%Law - - - 154 193 25% -Nursing 658 618 582 683 902 32% -Science 4,263 4,554 4,383 5,299 5,176 -2% 21%Urban Affairs 4,349 4,312 3,683 3,513 3,550 1% -18%Other (AF-CSC-MSC) 108 108 88 97 83 -14% -23%Total 21,585 22,575 21,208 23,784 24,490 3% 17%
** Web-based: Courses delivered primarily using the Internet. These courses are identifi ed by their class attribute (Online and/or Blended).
Note: In prior years these fi gures were calculated using end of term enrollment numbers, as opposed to census date numbers. Because these tables were the only tables in the entire book to use this methodology,
for consistency’s sake we have decided to recalculate these tables using census data.
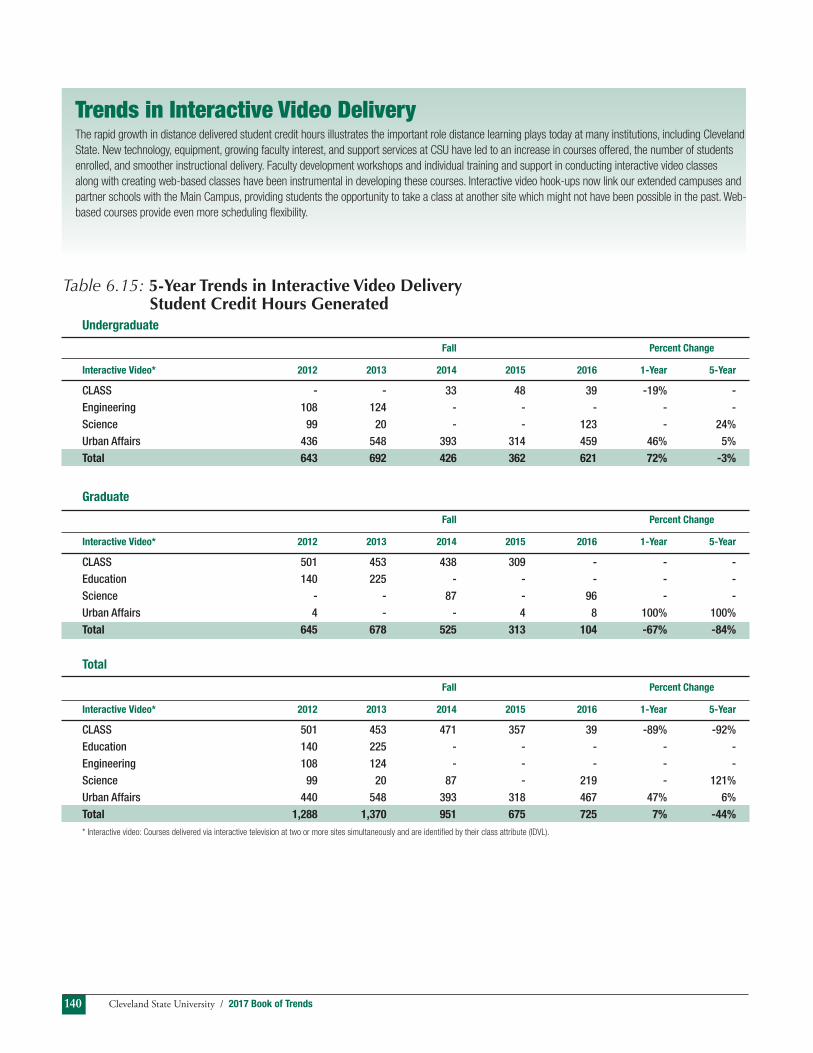
Cleveland State University / 2017 Book of Trends140
Trends in Interactive Video DeliveryThe rapid growth in distance delivered student credit hours illustrates the important role distance learning plays today at many institutions, including Cleveland
State. New technology, equipment, growing faculty interest, and support services at CSU have led to an increase in courses offered, the number of students
enrolled, and smoother instructional delivery. Faculty development workshops and individual training and support in conducting interactive video classes
along with creating web-based classes have been instrumental in developing these courses. Interactive video hook-ups now link our extended campuses and
partner schools with the Main Campus, providing students the opportunity to take a class at another site which might not have been possible in the past. Web-
based courses provide even more scheduling fl exibility.
Table 6.15: 5-Year Trends in Interactive Video Delivery Student Credit Hours Generated
Undergraduate
Fall Percent Change
Interactive Video* 2012 2013 2014 2015 2016 1-Year 5-Year
CLASS - - 33 48 39 -19% -Engineering 108 124 - - - - -Science 99 20 - - 123 - 24%Urban Affairs 436 548 393 314 459 46% 5%Total 643 692 426 362 621 72% -3%
Graduate
Fall Percent Change
Interactive Video* 2012 2013 2014 2015 2016 1-Year 5-Year
CLASS 501 453 438 309 - - -Education 140 225 - - - - -Science - - 87 - 96 - -Urban Affairs 4 - - 4 8 100% 100%Total 645 678 525 313 104 -67% -84%
Total
Fall Percent Change
Interactive Video* 2012 2013 2014 2015 2016 1-Year 5-Year
CLASS 501 453 471 357 39 -89% -92%Education 140 225 - - - - -Engineering 108 124 - - - - -Science 99 20 87 - 219 - 121%Urban Affairs 440 548 393 318 467 47% 6%Total 1,288 1,370 951 675 725 7% -44%
* Interactive video: Courses delivered via interactive television at two or more sites simultaneously and are identifi ed by their class attribute (IDVL).

Section 6 - Selected Strategic Indicators
SEC
TIO
N
6
141
Library FY 2016
Resources Total Titles Total Volumes/Items
Print Resources in Scholar
Monographs 520,897 632,443Serials and Journals 7,821 142,230Print Resources in Microform 10,671 22,724Total Print Resources 539,389 797,397
Media Resources in Scholar
Audio Resources 100,380 104,473Video Resources 35,452 37,460Other Media Resources 1,091 3,091Total Media Resources 136,923 145,024
Total Print plus Media 676,312 942,421
Electronic Resources in Scholar Electronic Books 174,629 174,629Electronic Serials and Journals 29,357 29,357Other Electronic Resources 1,640 1,640Total Electronic Resources 205,626 205,626
Locally Digitized Resources
Digital resources in Cleveland Memory Project 66,249 66,249Digital resources in EngagedScholarship@CSU 18,425 18,425Total Digitized Resources 84,674 84,674
GRAND TOTAL, MICHAEL SCHWARTZ LIBRARY COLLECTIONS 966,621 1,232,721
Table 6.16: Cleveland State University Michael Schwartz Library Collections, FY 2016

Cleveland State University / 2017 Book of Trends142
Table 6.17: Michael Schwartz Library Use Statistics
2016
Total Titles Total Vol./ Items
Print Resources in Scholar
Monographs 65,717 156,717Serials and Journals 4,099 105,475Print Resources in Microform 71,082 235,647Total Print Resources 140,898 497,839
Media Resources in Scholar
Audio Resources 149 248Video Resources 1,021 1,670Other Resources 1,285 1,300Total Media Resources 2,455 3,218
Total Physical Resources 145,808 504,275
Electronic Resources in Scholar
Electronic Books 31,075 31,075Electronic Serials and Journals 8,156 8,156Total Electronic Resources 39,231 39,231
Locally Degitized Resources
Law School digital resources in EngagedScholarship@CSU 7,128 7,128Other digital resources 12,851 12,851Total Digital Resources 19,979 59,210
GRAND TOTAL 205,018 602,716
Table 6.18: Cleveland State University Law Library Collections, FY 2016
DIGITAL RESOURCE USE TRENDS FY 16
Searches on Scholar catalog 653,563EngagedScholarship@CSU (downloads) 514,564Electronic resource searches 2,607,363Electronic resource downloads 248,572Electronic books used 145,357Electronic theses/dissertations used 218,696Page Views on Cleveland Memory 253,669Page Views on the Library website 982,868 OTHER TRENDS FY 16
Visitors to the Library 570,663Reference and technical questions answered 25,627Librarian led instructional sessions 380Items checked out 84,313Items borrowed from other OhioLINK libraries 14,330Items loaned to other OhioLINK libraries 7,251Items borrowed from libraries through ILL (beyond Ohio) 5,076Items loaned to libraries through ILL (beyond Ohio) 3,292Percent of materials budget spent on electronic resources 97%

Section 6 - Selected Strategic Indicators
SEC
TIO
N
6
143

Cleveland State University / 2017 Book of Trends144

SEC
TIO
N
7
Faculty & Staff
7Book of Trends

Cleveland State University / 2017 Book of Trends146

147Section 7 - Faculty & Staff
SEC
TIO
N
7
Table 7.1: Full-Time Employees by Standard Occupational Classifi cation (SOC) Fall 2016
Figure 7.1: Full-Time Employees by SOC Category Fall 2016
SOC Category Count % of Total
Management 277 17.3%Faculty 546 34.1%Archivists/Curators/Museum Technicians 18 1.1%Non-Postsecondary Teaching 85 5.3%Business/Financial Operations 86 5.4%Computer/Engineering/Science 137 8.6%Comm Service/Legal/Arts/Media 70 4.4%Health Practitioners & Technical Occupations 14 0.9%Service 111 6.9%Sales and Related 4 0.2%Offi ce/Administrative Support 224 14.0%Natural Resources/Construct/Mnt 21 1.3%Production/Transport/Material 9 0.6%Total Full-time Employees 1,602 100%
Source: All fi gures are taken from the IPEDS/EAP fi les as of November 1.
34.1%
1.1%
5.3%
5.4%
8.6%
4.4%
0.9%
6.9%
0.2%
14.0%
1.3%
0.6%
17.3%

Cleveland State University / 2017 Book of Trends148
Table 7.2: Full-Time Employees by Gender, Ethnicity, and (SOC) Category Fall 2012 - Fall 2016
2012 2013 2014 2015 2016
SOC Category/Ethnicity Male Female Male Female Male Female Male Female Male Female
Management Non Resident Alien - - - - - - - - - - White 86 91 86 100 87 109 87 118 93 124 Black/African American 7 27 7 26 9 23 9 23 10 27 Hispanic/Latino 4 1 6 2 7 3 6 3 6 2 Asian 10 2 8 3 7 3 8 3 8 3 American Indian/Alaskan Native - - 1 - 1 1 1 1 1 1 Other Pacifi c Islander/Native Hawaiian - - - - - - - - - - Two or More Races 1 - 1 1 1 1 - 2 - 2 Unknown - - - 1 - - - - - - Total 108 121 109 133 112 140 111 150 118 159
Faculty Non Resident Alien 9 3 13 4 11 5 16 6 12 9 White 220 160 206 161 213 170 209 172 211 189 Black/African American 15 20 17 21 17 20 14 18 12 19 Hispanic/Latino 9 3 9 3 9 4 8 5 8 7 Asian 56 23 54 20 54 19 53 19 53 21 American Indian/Alaskan Native - - - - - 1 - 1 - 1 Other Pacifi c Islander/Native Hawaiian 1 - - - - - - - - - Two or More Races - - - 1 - 1 - 2 - 4 Unknown - 1 - 2 - 1 - 1 - - Total 310 210 299 212 304 221 300 224 296 250
Archivists/Curators/Museum Technicians Non Resident Alien - - - - - - - - - - White 3 13 3 13 2 13 4 11 4 12 Black/African American - - - - - - - - - - Hispanic/Latino - - 1 - 1 - - - - - Asian - 1 - 1 - 1 - 2 - 2 American Indian/Alaskan Native - - - - - - - - - - Other Pacifi c Islander/Native Hawaiian - - - - - - - - - - Two or More Races - - - - - - - - - - Unknown - - - - - - - - - - Total 3 14 4 14 3 14 4 13 4 14
Non-Postsecondary Teaching Non Resident Alien - 1 - - - - - - - - White 16 45 15 46 18 48 16 42 17 42 Black/African American 1 9 1 10 3 11 3 11 3 11 Hispanic/Latino - 3 - 3 1 5 2 4 2 6 Asian - - - - - - - 1 - 2 American Indian/Alaskan Native - 1 - - - - - - - - Other Pacifi c Islander/Native Hawaiian - - - - - - - - - - Two or More Races - 2 - 2 - 3 - 2 - 2 Unknown - - - - - - - - - - Total 17 61 16 61 22 67 21 60 22 63

149Section 7 - Faculty & Staff
SEC
TIO
N
7
Table 7.2: Full-Time Employees by Gender, Ethnicity, and (SOC) Category Fall 2012 - Fall 2016
2012 2013 2014 2015 2016
SOC Category/Ethnicity Male Female Male Female Male Female Male Female Male Female
Business/Financial Operations Non Resident Alien 1 - 1 - 1 - 1 - - 1 White 23 42 23 45 16 45 18 45 20 42 Black/African American 3 13 7 14 4 18 4 18 2 19 Hispanic/Latino - 2 1 1 - - - 1 - 1 Asian - - - - - - - - - - American Indian/Alaskan Native - - - - - - - - - - Other Pacifi c Islander/Native Hawaiian - - - - - - - - - - Two or More Races - - - - - 1 - 1 - 1 Unknown - - - - - - - - - - Total 27 57 32 60 21 64 23 65 22 64
Computer/Engineering/Science Non Resident Alien 3 2 4 2 2 2 2 2 3 2 White 74 35 75 29 81 27 77 26 77 26 Black/African American 5 5 6 5 6 5 6 6 6 6 Hispanic/Latino - 2 1 2 1 2 1 3 - 2 Asian 9 2 9 2 9 2 10 3 10 4 American Indian/Alaskan Native - - - - - - - - - - Other Pacifi c Islander/Native Hawaiian - - - - - - - - - - Two or More Races - - - - - - 1 - 1 - Unknown - - - - - - - - - - Total 91 46 95 40 99 38 97 40 97 40
Comm Service/Legal/Arts/Media Non Resident Alien 1 - - 1 - 2 - 2 - 2 White 23 22 24 20 22 23 23 23 29 24 Black/African American 8 8 7 7 6 6 5 5 5 4 Hispanic/Latino 1 - 1 - 1 1 2 2 2 Asian - - - - 1 - 1 - 1 - American Indian/Alaskan Native - - - - - - - - - - Other Pacifi c Islander/Native Hawaiian - - - - - - - - - - Two or More Races - - - - 1 - 1 1 - 1 Unknown - - - - - - - - - - Total 33 30 32 28 31 31 31 33 37 33
Health Practitioners & Technical Occupations Non Resident Alien - - - - - - - - - - White 2 8 2 8 2 8 2 9 2 9 Black/African American - 1 - 2 1 2 1 2 1 1 Hispanic/Latino - - - - - - 1 - 1 Asian 1 1 1 - - - - - - - American Indian/Alaskan Native - - - - - - - - - - Other Pacifi c Islander/Native Hawaiian - - - - - - - - - - Two or More Races - - - - - - - - - - Unknown - - - - - - - - - - Total 3 10 3 10 3 10 3 12 3 11

Cleveland State University / 2017 Book of Trends150
Table 7.2: Full-Time Employees by Gender, Ethnicity, and (SOC) Category Fall 2012 - Fall 2016
2012 2013 2014 2015 2016
SOC Category/Ethnicity Male Female Male Female Male Female Male Female Male Female
Service Non Resident Alien - - - - - - - - - - White 27 4 24 4 27 4 26 4 28 6 Black/African American 39 25 38 24 39 30 35 32 36 33 Hispanic/Latino 4 1 4 1 5 1 6 2 6 2 Asian - - - - 1 - - - - - American Indian/Alaskan Native - - - - - - - - - - Other Pacifi c Islander/Native Hawaiian - - - - - - - - - - Two or More Races - - - - - - - - - - Unknown 2 - 2 - - - - - - - Total 72 30 68 29 72 35 67 38 70 41
Sales and Related Non Resident Alien - - - - - - - - - - White 2 - 1 1 3 1 3 - 3 - Black/African American 1 - 1 - - - - - 1 - Hispanic/Latino - - - - 1 - - - - - Asian - - - - - - - - - - American Indian/Alaskan Native - - - - - - - - - - Other Pacifi c Islander/Native Hawaiian - - - - - - - - - - Two or More Races - - - - - - - - - - Unknown - - - - - - - - - - Total 3 - 2 1 4 1 3 - 4 -
Offi ce/Administrative Support Non Resident Alien - - - - - - 1 - 1 - White 14 135 14 136 16 125 17 116 18 113 Black/African American 8 73 9 67 7 72 4 73 5 74 Hispanic/Latino 1 2 1 4 1 5 1 4 2 3 Asian 1 3 1 2 - 2 - 2 - 2 American Indian/Alaskan Native - - - 2 - 1 - 2 - 1 Other Pacifi c Islander/Native Hawaiian - - - - - - - - - - Two or More Races - 2 - 2 - 1 - 2 - 5 Unknown - - - - - - - - - - Total 24 215 25 213 24 206 23 199 26 198
Natural Resources/Construct/Mnt Non Resident Alien - - - - - - - - - - White 21 - 15 - 18 - 18 - 17 - Black/African American 6 - 6 - 4 - 4 - 3 - Hispanic/Latino 1 - 1 - 1 - 1 - 1 - Asian - - - - - - - - - - American Indian/Alaskan Native - - - - - - - - - - Other Pacifi c Islander/Native Hawaiian - - - - - - - - - - Two or More Races - - - - - - - - - - Unknown - - - - - - - - - - Total 28 - 22 - 23 - 23 - 21 -

151Section 7 - Faculty & Staff
SEC
TIO
N
7
Table 7.2: Full-Time Employees by Gender, Ethnicity, and (SOC) Category Fall 2012 - Fall 2016
Source: All fi gures are taken from the IPEDS/EAP fi les as of November 1.
Note: Non Resident Alien are put into the actual race categories.
Note: Please see that Asian/Pacifi c Islander was split into two categories. Also a new category of two or
more races was added per Federal Reporting Rule Changes.
2012 2013 2014 2015 2016
SOC Category/Ethnicity Male Female Male Female Male Female Male Female Male Female
Production/Transport/Material
Non Resident Alien - - - - - - - - - - White 8 - 6 1 7 1 6 1 6 - Black/African American 1 1 - - - - 1 1 1 1 Hispanic/Latino 1 - 1 - 1 - 1 - 1 - Asian - - - - 1 - 1 - - - American Indian/Alaskan Native - - - - - - - - - - Other Pacifi c Islander/Native Hawaiian - - - - - - - - - - Two or More Races - - - - - - - - - - Unknown - - - - - - - - - - Total 10 1 7 1 9 1 9 2 8 1
Total Full-Time Employees
Non Resident Alien 14 6 18 7 14 9 20 10 16 14
White 519 555 494 564 512 574 506 567 525 587
Black/African American 94 182 99 176 96 187 86 189 85 195
Hispanic/Latino 21 14 26 16 29 20 27 25 28 26
Asian 77 32 73 28 73 27 73 30 72 34
Native American/Alaskan Native - 1 1 2 1 3 1 4 1 3
Other Pacifi c Islander/Native Hawaiian 1 - - - - - - - - -
Two or More Races 1 4 1 6 2 7 2 10 1 15
Unknown 2 1 2 3 - 1 - 1 - -
Total 729 795 714 802 727 828 715 836 728 874

Cleveland State University / 2017 Book of Trends152
Table 7.3: Full-Time Employees: Women and Minorities as a Percentage of Total by SOC Category Fall 2012 - Fall 2016
2012 2013 2014 2015 2016
Management Women 53% 55% 56% 57% 57%Blacks/African American 15% 14% 13% 12% 13%Hispanic/Latino 2% 3% 4% 3% 3%Asian 5% 5% 4% 4% 4%Native American/Alaskan Native 0% 0% 1% 1% 1%Othr Pacifi c Islander/Native Hawaiian 0% 0% 0% 0% 0%Two or More Races 0% 1% 1% 1% 1%Minorities 23% 23% 22% 21% 22%
Faculty Women 40% 41% 42% 43% 46%Blacks/African American 7% 7% 7% 6% 6%Hispanic/Latino 2% 2% 2% 2% 3%Asian 15% 14% 14% 14% 14%Native American/Alaskan Native 0% 0% 0% 0% 0%Othr Pacifi c Islander/Native Hawaiian 0% 0% 0% 0% 0%Two or More Races 0% 0% 0% 0% 1%Minorities 24% 24% 24% 23% 23%
Archivists/Curators/Museum Technicians Women 82% 78% 82% 76% 78%Blacks/African American 0% 0% 0% 0% 0%Hispanic/Latino 0% 6% 6% 0% 0%Asian 6% 6% 6% 12% 11%Native American/Alaskan Native 0% 0% 0% 0% 0%Othr Pacifi c Islander/Native Hawaiian 0% 0% 0% 0% 0%Two or More Races 0% 0% 0% 0% 0%Minorities 6% 11% 12% 12% 11%
Non-Postsecondary Teaching Women 78% 79% 75% 74% 74%Blacks/African American 13% 14% 16% 17% 16%Hispanic/Latino 4% 4% 7% 7% 9%Asian 0% 0% 0% 1% 2%Native American/Alaskan Native 1% 0% 0% 0% 0%Othr Pacifi c Islander/Native Hawaiian 0% 0% 0% 0% 0%Two or More Races 3% 3% 3% 2% 2%Minorities 21% 21% 26% 28% 31%
2012 2013 2014 2015 2016
Business/Financial Operations
Women 68% 65% 75% 74% 74%Blacks/African American 19% 23% 26% 25% 24%Hispanic/Latino 2% 2% 0% 1% 1%Asian 0% 0% 0% 0% 0%Native American/Alaskan Native 0% 0% 0% 0% 0%Othr Pacifi c Islander/Native Hawaiian 0% 0% 0% 0% 0%Two or More Races 0% 0% 1% 1% 1%Minorities 21% 25% 27% 27% 27%
Computer/Engineering/Science
Women 34% 30% 28% 29% 29%Blacks/African American 7% 8% 8% 9% 9%Hispanic/Latino 1% 2% 2% 3% 1%Asian 8% 8% 8% 9% 10%Native American/Alaskan Native 0% 0% 0% 0% 0%Othr Pacifi c Islander/Native Hawaiian 0% 0% 0% 0% 0%Two or More Races 0% 0% 0% 1% 1%Minorities 17% 19% 18% 22% 21%
Comm Service/Legal/Arts/Media
Women 48% 47% 50% 52% 47%Blacks/African American 25% 23% 19% 16% 13%Hispanic/Latino 2% 2% 2% 5% 6%Asian 0% 0% 2% 2% 1%Native American/Alaskan Native 0% 0% 0% 0% 0%Othr Pacifi c Islander/Native Hawaiian 0% 0% 0% 0% 0%Two or More Races 0% 0% 2% 3% 1%Minorities 27% 25% 24% 25% 21%
Health Practitioners & Technical Occupations
Women 77% 77% 77% 80% 79%Blacks/African American 8% 15% 23% 20% 14%Hispanic/Latino 0% 0% 0% 7% 7%Asian 15% 8% 0% 0% 0%Native American/Alaskan Native 0% 0% 0% 0% 0%Othr Pacifi c Islander/Native Hawaiian 0% 0% 0% 0% 0%Two or More Races 0% 0% 0% 0% 0%Minorities 23% 23% 23% 27% 21%

153Section 7 - Faculty & Staff
SEC
TIO
N
7
Table 7.3: Full-Time Employees: Women and Minorities as a Percentage of Total by SOC Category Fall 2012 - Fall 2016
Source: All fi gures are taken from the IPEDS/EAP fi les as of November 1.
Note: Minorities include Black, Hispanic, Asian, Native American/Alaskan Native,
Other Pacifi c Islander/Native Hawaiian, and Two or More Races.
2012 2013 2014 2015 2016
Service
Women 29% 30% 33% 36% 37%Blacks/African American 63% 64% 64% 64% 62%Hispanic/Latino 5% 5% 6% 8% 7%Asian 0% 0% 1% 0% 0%Native American/Alaskan Native 0% 0% 0% 0% 0%Othr Pacifi c Islander/Native Hawaiian 0% 0% 0% 0% 0%Two or More Races 0% 0% 0% 0% 0%Minorities 68% 69% 71% 71% 69%
Sales and Related Women 0% 33% 20% 0% 0%Blacks/African American 33% 33% 0% 0% 25%Hispanic/Latino 0% 0% 20% 0% 0%Asian 0% 0% 0% 0% 0%Native American/Alaskan Native 0% 0% 0% 0% 0%Othr Pacifi c Islander/Native Hawaiian 0% 0% 0% 0% 0%Two or More Races 0% 0% 0% 0% 0%Minorities 33% 33% 20% 0% 25%
Offi ce/Administrative Support Women 90% 89% 90% 90% 88%Blacks/African American 34% 32% 34% 35% 35%Hispanic/Latino 1% 2% 3% 2% 2%Asian 2% 1% 1% 1% 1%Native American/Alaskan Native 0% 1% 0% 1% 0%Othr Pacifi c Islander/Native Hawaiian 0% 0% 0% 0% 0%Two or More Races 1% 1% 0% 1% 2%Minorities 38% 37% 39% 40% 41%
Natural Resources/Construct/Mnt Women 0% 0% 0% 0% 0%Blacks/African American 21% 27% 17% 17% 14%Hispanic/Latino 4% 5% 4% 4% 5%Asian 0% 0% 0% 0% 0%Native American/Alaskan Native 0% 0% 0% 0% 0%Othr Pacifi c Islander/Native Hawaiian 0% 0% 0% 0% 0%Two or More Races 0% 0% 0% 0% 0%Minorities 25% 32% 22% 22% 19%
2012 2013 2014 2015 2016
Production/Transport/Material
Women 9% 13% 10% 18% 11%Blacks/African American 18% 0% 0% 18% 22%Hispanic/Latino 9% 13% 10% 9% 11%Asian 0% 0% 10% 9% 0%Native American/Alaskan Native 0% 0% 0% 0% 0%Oth Pacifi c Islander/Native Hawaiian 0% 0% 0% 0% 0%Two or More Races 0% 0% 0% 0% 0%Minorities 27% 13% 20% 36% 33%
Total Full-Time Employees
Women 52% 53% 53% 54% 55%
Blacks/African American 18% 18% 18% 18% 17%
Hispanic/Latino 2% 3% 3% 3% 3%
Asian 7% 7% 6% 7% 7%
Native American/Alaskan Native 0% 0% 0% 0% 0%
Other Pac. Islander/Native Hawaiian 0% 0% 0% 0% 0%
Two or More Races 0% 0% 1% 1% 1%
Minorities 28% 28% 29% 29% 29%

Cleveland State University / 2017 Book of Trends154
Tabl
e 7.
4: T
otal
Em
ploy
ees
by S
OC
Cat
egor
y
Fall
2012
- F
all 2
016
E
mp
loyees
2012
2013
2014
20
15
2
01
6
Fu
ll
Pa
rt
Fu
ll
Pa
rt
Fu
ll
Pa
rt
Fu
ll
Pa
rt
Fu
ll
Pa
rt
SO
C C
ate
gory
Descri
pti
on
Tim
e
Tim
e
Tota
l
Tim
e
Tim
e
Tota
l Tim
e
Tim
e
Tota
l Tim
e
Tim
e
Tota
l Tim
e
Tim
e
Tota
l
Man
agem
ent
229
1
6
245
2
42
21
2
63
252
2
4
276
2
61
19
2
80
277
1
5
292
Fa
culty
5
20
521
1
,041
5
11
558
1
,069
5
25
608
1
,133
5
24
595
1
,119
5
46
632
1
,178
Ar
chiv
ists
/Cur
ator
s/M
useu
m T
echn
icia
ns
17
-
17
1
8
-
1
8
17
-
17
1
7
-
1
7
18
-
18
Non-
Post
seco
ndar
y Te
achi
ng
78
5
8
3
77
5
8
2
89
5
9
4
81
7
8
8
85
6
9
1 Bu
sine
ss/F
inan
cial
Ope
ratio
ns
84
6
9
0
92
7
9
9
85
6
9
1
88
6
9
4
86
2
4
110
Co
mpu
ter/
Engi
neer
ing/
Scie
nce
137
6
1
43
135
9
1
44
137
9
1
46
137
1
0
147
1
37
6
143
Co
mm
Ser
vice
/Leg
al/A
rts/
Med
ia
63
3
5
98
6
0
34
9
4
62
3
7
99
6
4
82
1
46
70
7
1
141
He
alth
Pra
ctiti
oner
s &
Tech
nica
l Oc
cupa
tions
1
3
1
14
1
3
1
14
1
3
1
14
1
5
-
1
5
14
-
14
Serv
ice
102
3
1
133
9
7
36
1
33
107
3
0
137
1
05
25
1
30
111
2
0
131
Sa
les
and
Rela
ted
3
2
5
3
1
4
5
- 5
3
-
3
4
-
4
Of
fi ce/
Adm
inis
trat
ive
Supp
ort
239
3
0
269
2
38
33
2
71
230
2
6
256
2
22
24
2
46
224
2
1
245
Na
tura
l Res
ourc
es/C
onst
ruct
/Mnt
2
8
-
2
8
22
-
22
2
3
-
2
3
23
-
23
2
1
-
2
1 Pr
oduc
tion/
Tran
spor
t/Mat
eria
l 1
1
1
12
8
-
8
10
-
10
1
1
-
1
1
9
-
9
To
tal
Fu
ll-t
ime E
mp
loyees
1,5
24
6
54
2
,17
8
1,5
16
7
05
2
,22
1
1,5
55
7
46
2
,30
1
1,5
51
7
68
2
,31
9
1,6
02
7
95
2
,39
7
So
urc
e: A
ll fi g
ure
s a
re t
aken fro
m t
he IP
ED
S/E
AP
fi le
s a
s o
f N
ovem
ber
1.
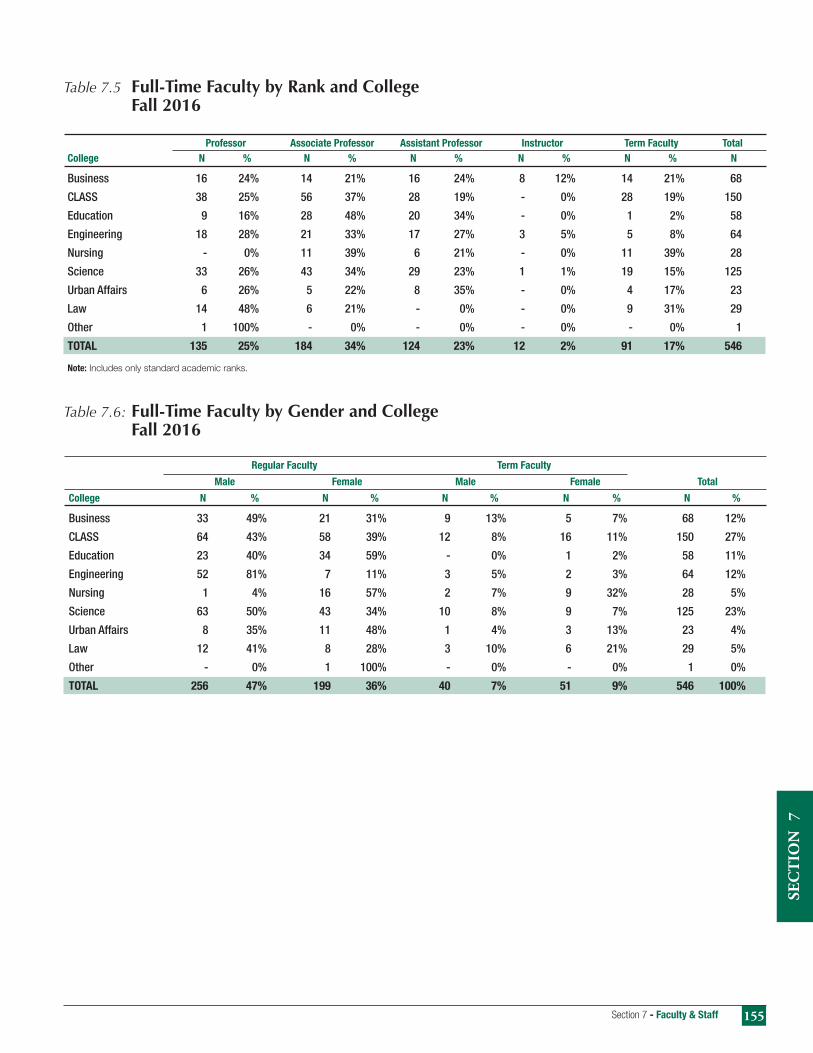
155Section 7 - Faculty & Staff
SEC
TIO
N
7
Regular Faculty Term Faculty
Male Female Male Female Total
College N % N % N % N % N %
Business 33 49% 21 31% 9 13% 5 7% 68 12%
CLASS 64 43% 58 39% 12 8% 16 11% 150 27%
Education 23 40% 34 59% - 0% 1 2% 58 11%
Engineering 52 81% 7 11% 3 5% 2 3% 64 12%
Nursing 1 4% 16 57% 2 7% 9 32% 28 5%
Science 63 50% 43 34% 10 8% 9 7% 125 23%
Urban Affairs 8 35% 11 48% 1 4% 3 13% 23 4%
Law 12 41% 8 28% 3 10% 6 21% 29 5%
Other - 0% 1 100% - 0% - 0% 1 0%
TOTAL 256 47% 199 36% 40 7% 51 9% 546 100%
Professor Associate Professor Assistant Professor Instructor Term Faculty Total
College N % N % N % N % N % N
Business 16 24% 14 21% 16 24% 8 12% 14 21% 68
CLASS 38 25% 56 37% 28 19% - 0% 28 19% 150
Education 9 16% 28 48% 20 34% - 0% 1 2% 58
Engineering 18 28% 21 33% 17 27% 3 5% 5 8% 64
Nursing - 0% 11 39% 6 21% - 0% 11 39% 28
Science 33 26% 43 34% 29 23% 1 1% 19 15% 125
Urban Affairs 6 26% 5 22% 8 35% - 0% 4 17% 23
Law 14 48% 6 21% - 0% - 0% 9 31% 29
Other 1 100% - 0% - 0% - 0% - 0% 1
TOTAL 135 25% 184 34% 124 23% 12 2% 91 17% 546
Note: Includes only standard academic ranks.
Table 7.5 Full-Time Faculty by Rank and College Fall 2016
Table 7.6: Full-Time Faculty by Gender and College Fall 2016

Cleveland State University / 2017 Book of Trends156
Table 7.7: Full-Time Faculty by Highest Degree Attained, Fall 2016
Table 7.6a: Full-Time Faculty by College, Gender and Rank, Fall 2016 Professor Associate Professor Assistant Professor Instructor Term Faculty Total
College Gender N % N % N % N % N % N
Business F 3 12% 5 19% 7 27% 6 23% 5 19% 26 M 13 31% 9 21% 9 21% 2 5% 9 21% 42 CLASS F 17 23% 21 28% 20 27% - 0% 16 22% 74 M 21 28% 35 46% 8 11% - 0% 12 16% 76 Education F 5 14% 16 46% 13 37% - 0% 1 3% 35 M 4 17% 12 52% 7 30% - 0% - 0% 23 Engineering F 2 22% 3 33% 2 22% - 0% 2 22% 9 M 16 29% 18 33% 15 27% 3 5% 3 5% 55 Nursing F - 0% 11 44% 5 20% - 0% 9 36% 25 M - 0% - 0% 1 20% - 0% 2 67% 3 Science F 7 13% 18 35% 17 33% 1 2% 9 17% 52 M 26 36% 25 34% 12 16% - 0% 10 14% 73 Urban Affairs F 3 21% 2 14% 6 43% - 0% 3 21% 14 M 3 33% 3 33% 2 22% - 0% 1 11% 9 Law F 7 50% 1 7% - 0% - 0% 6 43% 14 M 7 47% 5 33% - 0% - 0% 3 20% 15 Other F 1 100% - 0% - 0% - 0% - 0% 1 M - 0% - 0% - 0% - 0% - 0% - TOTAL 135 25% 184 34% 124 23% 12 2% 91 17% 546
Note: Includes only standard academic ranks.
Source: All fi gures are taken from the IPEDS/EAP fi les as of November 1.
Degree
College Bachelor’s Master’s Doctorate Professional Terminal Degree
Business 0% 26% 72% 1% 76%
CLASS 0% 25% 75% 0% 87%
Education 0% 10% 90% 0% 98%
Engineering 0% 9% 89% 0% 94%
Nursing 0% 71% 25% 0% 57%
Science 1% 12% 86% 1% 93%
Urban Affairs 0% 13% 83% 4% 91%
Law 0% 3% 3% 93% 100%Other 0% 0% 100% 0% 100%
TOTAL 0% 20% 74% 5% 88%
Source: All fi gures are taken from the IPEDS/EAP fi les as of November 1.

157Section 7 - Faculty & Staff
SEC
TIO
N
7
Tabl
e 7.
8: F
ull-
Tim
e Te
nure
d/Te
nure
-Tra
ck a
nd N
on-T
enur
e Tr
ack
Facu
lty
by C
olle
ge/D
epar
tmen
t:
5-Ye
ar T
rend
F
all
2012
2013
2014
2015
20
16
P
erc
en
t C
ha
ng
e
Te
nu
red
N
on
Ten
ure
d
Non
Ten
ure
d
Non
Ten
ure
d
Non
Ten
ure
d
No
n
&
Ten
ure
Te
nu
re
&
Ten
ure
Ten
ure
& T
en
ure
Te
nu
re
&
Ten
ure
Te
nu
re
&
Ten
ure
Te
nu
reC
olleg
e/D
ep
art
men
t T
rack
Tr
ack
To
tal
Tr
ack
Tr
ack
To
tal
Tra
ck
Tr
ack
To
tal
Tra
ck
Tr
ack
To
tal
Tr
ack
Tr
ack
To
tal
1 y
ea
r
5
yea
r
Bu
sin
ess
Acco
untin
g
11
6
1
7
10
5
1
5
10
5
1
5
10
4
1
4
11
3
1
4
0%
-18%
Com
pute
r & In
form
atio
n Sc
ienc
e 1
2
3
15
1
2
3
15
1
2
3
15
4
2
6
8
1
9
50
%
-40%
Fina
nce
2
5
7
3
3
6
2
4
6
2
4
6
4
4
8
33%
14
%M
anag
emen
t 1
0
3
13
1
0
2
12
1
1
2
13
1
0
4
14
1
1
4
15
7%
15
%M
arke
ting
8
4
1
2
9
5
14
8
6
1
4
8
7
15
8
6
1
4
-7%
17
%Op
erat
ion
and
Supp
ly C
hain
Man
agem
ent
6
2
8
5
2
7
6
2
8
6
2
8
6
2
8
0%
0%B
usi
nes
s To
tal
49
23
72
49
20
69
49
22
71
40
23
63
48
20
68
8%
-6
%
Lib
era
l A
rts &
Socia
l S
cie
nces
Art
11
-
1
1
11
-
1
1
11
-
1
1
10
-
10
1
1
1
12
20
%
9%Cr
imin
olog
y, An
thro
polo
gy, a
nd S
ocio
logy
1
5
5
20
1
5
6
21
1
4
6
20
1
2
7
19
1
3
7
20
5%
0%
Econ
omic
s
5
2
7
6
1
7
6
1
7
4
3
7
6
1
7
0%
0%En
glis
h
12
7
1
9
12
5
1
7
12
5
1
7
13
5
1
8
13
5
1
8
0%
-5%
Hist
ory
1
5
-
15
1
3
-
13
1
2
1
13
1
1
2
13
1
3
1
14
8%
-7
%M
usic
9
4
1
3
9
3
12
9
2
1
1
9
3
12
9
4
1
3
8%
0%Ph
iloso
phy
& Co
mpa
rativ
e Re
ligio
n 9
-
9
7
1
8
7
1
8
5
3
8
5
2
7
-1
3%
-22%
Polit
ical
Sci
ence
7
2
9
6
2
8
7
1
8
6
2
8
7
1
8
0%
-1
1%Sc
hool
of C
omm
unic
atio
n 1
7
3
20
1
5
5
20
1
6
4
20
1
6
4
20
1
7
4
21
5%
5%
Soci
al W
ork
8
3
11
8
3
1
1
9
3
12
8
2
1
0
9
3
12
20
%
9%Th
eatre
and
Dan
ce
4
-
4
4
-
4
4
-
4
4
-
4
5
1
6
50%
50
%W
orld
Lan
guag
es, L
itera
ture
& C
ultu
re
10
2
1
2
10
2
1
2
9
2
11
9
3
1
2
9
3
12
0%
0%
Liber
al A
rts
& S
oci
al S
cien
ces
Tota
l 1
22
28
150
116
28
144
116
26
142
107
34
141
117
33
150
6%
0%
(continued
on n
ext
page)

Cleveland State University / 2017 Book of Trends158
Tabl
e 7.
8: F
ull-
Tim
e Te
nure
d/Te
nure
-Tra
ck a
nd N
on-T
enur
e Tr
ack
Facu
lty
by C
olle
ge/D
epar
tmen
t:
5-Ye
ar T
rend
(c
ontinued
fro
m p
revio
us p
age)
Fall
2012
2013
2014
2015
20
16
P
erc
en
t C
ha
ng
e
Te
nu
red
N
on
Ten
ure
d
Non
Ten
ure
d
Non
Ten
ure
d
Non
Ten
ure
d
No
n
&
Ten
ure
Te
nu
re
&
Ten
ure
Ten
ure
& T
en
ure
Te
nu
re
&
Ten
ure
Te
nu
re
&
Ten
ure
Te
nu
reC
olleg
e/D
ep
art
men
t T
rack
Tr
ack
To
tal
Tr
ack
Tr
ack
To
tal
Tra
ck
Tr
ack
To
tal
Tra
ck
Tr
ack
To
tal
Tr
ack
Tr
ack
To
tal
1 y
ea
r
5
yea
r
Ed
uca
tion
an
d H
um
an
Serv
ices
CCAS
AL
14
-
1
4
14
-
1
4
13
1
1
4
12
1
1
3
12
2
1
4
8%
0%Cu
rricu
lum
& F
ound
atio
ns
11
1
1
2
11
2
1
3
11
2
1
3
11
3
1
4
10
1
1
1
-21%
-8
%He
alth
And
Phy
sica
l Edu
catio
n 7
1
8
7
1
8
7
2
9
7
2
9
7
3
1
0
11%
25
%Te
ache
rs E
duca
tion
24
-
2
4
21
1
2
2
21
1
2
2
18
4
2
2
21
2
2
3
5%
-4%
Educa
tion a
nd H
um
an S
ervi
ces
Tota
l 5
6
2
58
53
4
57
52
6
58
48
10
58
50
8
58
0%
0%
En
gin
eeri
ng
Ch
emic
al E
ngin
eerin
g 1
0
-
10
1
0
1
11
1
1
1
12
1
0
1
11
1
1
1
12
9%
20
%Ci
vil &
Env
ironm
enta
l Eng
inee
ring
9
-
9
9
1
10
9
1
1
0
9
1
10
8
2
1
0
0%
11%
Elec
trica
l Eng
inee
ring
and
Com
pute
r 1
5
-
15
1
5
-
15
1
5
-
15
2
1
5
26
1
8
6
24
-8
%
60%
Scie
nce
Engi
neer
ing
Tech
nolo
gy
4
1
5
3
2
5
3
2
5
3
2
5
3
3
6
20%
20
%M
echa
nica
l Eng
inee
ring
7
1
8
9
1
10
1
1
1
12
1
0
2
12
1
0
2
12
0%
50
%Engin
eeri
ng T
ota
l 4
5
2
47
46
5
51
49
5
54
53
11
64
50
14
64
0%
36%
Law
2
5
10
35
23
11
34
22
10
32
20
10
30
20
9
29
-3%
-1
7%
Nurs
ing
14
7
21
15
9
24
18
7
25
16
11
27
18
10
28
4%
33%
Scie
nce
Biol
ogy,
Geol
ogy
& En
viro
nmen
tal S
cien
ce
21
-
21
1
9
1
20
2
0
1
21
1
9
1
20
2
0
1
21
5%
0%
Chem
istry
1
4
-
14
1
3
-
13
1
5
2
17
1
5
2
17
1
5
2
17
0%
21
%He
alth
Sci
ence
s 2
3
3
26
2
2
4
26
2
4
4
28
2
5
4
29
2
8
3
31
7%
19
%M
athe
mat
ics
2
0
7
27
2
0
8
28
1
8
8
26
1
9
8
27
2
0
8
28
4%
4%
Phys
ics
8
1
9
8
1
9
9
2
1
1
8
2
10
8
2
1
0
0%
11%
Psyc
holo
gy
16
1
1
7
12
3
1
5
13
3
1
6
14
3
1
7
15
3
1
8
6%
6%S
cien
ce T
ota
l 1
02
12
114
94
17
111
99
20
119
100
20
120
106
19
125
4%
10%
Urb
an A
ffair
s 1
8
5
23
16
5
21
18
6
24
16
5
21
18
5
23
10%
0%
Oth
er
-
-
-
-
-
-
-
-
-
-
-
-
1
-
1
--
--
Univ
ersi
ty T
ota
l 4
31
89
520
412
99
511
423
102
525
400
124
524
428
118
546
4%
5%

159Section 7 - Faculty & Staff
SEC
TIO
N
7
Table 7.9: Percentage of Undergraduate Student Credit Hours (SCH) Generated by Full-Time Faculty Fall 2016
SCH Generated SCH Generated SCH Generated Total SCH % of SCH
by Full-time by Part-time by Other Generated Generated by
Department Description Faculty Faculty Instructors Full-time Faculty
College of Business
Accounting Accounting 2,739 564 0 3,303 83% Business Law 0 534 0 534 0%Finance Finance 1,650 402 0 2,052 80%Health Care Administration Health Care Administration 0 138 0 138 0%Information Systems Information Science 1,479 982 0 2,461 60%Management Management 2,709 294 0 3,003 90%Marketing General Administration 411 501 0 912 45% Marketing 2,079 441 0 2,520 83%Operations & Supply Chain Operations & Supply Chain 2,046 660 0 2,706 76%Management ManagementOther Business Business 834 2,151 0 2,985 28% International Business 225 0 0 225 100%
Total Total 14,172 6,667 0 20,839 68%
College of Liberal Arts and Social Sciences
Art Art 1,413 648 0 2,061 69%Communication Communication 3,880 3,160 0 7,040 55%Criminology, Anthropology Anthropology 1,476 876 0 2,352 63%and Sociology Linguistics 120 0 0 120 100% Sociology 5,508 678 0 6,186 89%Economics Economics 1,608 636 0 2,244 72%English Developmental English 0 398 0 398 0% English 2,850 5,090 54 7,994 36%History History 3,798 1,083 0 4,881 78%Interdisciplinary Black Studies 15 438 0 453 3% Women’s Studies 0 423 0 423 0%Music Applied Music 16 401 10 427 4% Music 872 2,205 0 3,077 28%Philosophy and Comparative Philosophy 966 1,986 0 2,952 33%Religion Religious Studies 499 921 0 1,420 35%Political Science/IR Political Science 1,318 390 0 1,708 77%Social Work Social Work 1,427 1,674 0 3,101 46%Theatre and Dance Dance 158 223 0 381 41% Theatre & Dance 898 207 0 1,105 81%World Languages, Literature Arabic 436 21 0 457 95%and Culture Chinese 0 60 0 60 0% French 158 152 0 310 51% German 0 156 0 156 0% Hungarian 0 16 0 16 0% Italian 196 0 0 196 100% Japanese 0 156 0 156 0% Latin 0 100 0 100 0% Slovenian 0 96 0 96 0% Spanish 1,000 364 0 1,364 73% World Languages, Literature and Culture 83 252 0 335 25%Total Total 28,695 22,810 64 51,569 56%
(continued on next page)

Cleveland State University / 2017 Book of Trends160
SCH Generated SCH Generated SCH Generated Total SCH % of SCH
by Full-time by Part-time by Other Generated Generated by
Department Description Faculty Faculty Instructors Full-time Faculty
College of Education & Human Services CASAL Education Specialist 60 0 0 60 100%Curriculum and Foundations Curriculum & Foundations-Special Topics 0 33 0 33 0% Curriculum & Instruction 170 85 0 255 67%Health and Human Performance Health & Physical Education 777 215 0 992 78% Health Education 243 750 0 993 24% HPER-Core Curriculum 78 296 0 374 21% Physical Education-Service 0 141 0 141 0%Teacher Education Early Childhood Education 591 246 0 837 71% Education U Teach 134 0 0 134 100% Education-SIP 362 94 0 456 79% Education-Special Offerings 0 0 52 52 0% Middle Childhood Education 141 90 0 231 61% Special Education 231 231 0 462 50% Specialized Instructional/ 462 192 0 654 71% Teacher Education Specialized Study & Field Experiences 110 0 626 736 15%Total Total 3,359 2,373 678 6,410 52%
College of Engineering Chemical & Biomedical Chemical Engineering 1,163 0 0 1,163 100%Engineering Engineering Science 666 396 0 1,062 63%Civil & Environmental Engineering Civil Engineering 958 18 0 976 98% Engineering Science 618 0 0 618 100%Dean’s Offi ce Engineering Science 358 0 0 358 100%Electrical Engineering and Computer and Information Science 1,629 141 0 1,770 92%Computer Science Electrical & Computer Engineering 1,586 340 0 1,926 82% Engineering Science 528 252 0 780 68%Engineering Technology Electronic Engineering Technology 356 0 21 377 94% Engineering Science 168 0 0 168 100% General Engineering Technology 265 39 0 304 87% Math Technology 96 0 0 96 100% Mechanical Engineering Technology 485 0 0 485 100%Mechanical Engineering Engineering Science 934 666 0 1,600 58% Mechanical Engineering 1,577 1,048 117 2,742 58%Total Total 11,387 2,900 138 14,425 79%
Honors
Honors Honors 56 56 16 128 44%Total Total 56 56 16 128 44%
Table 7.9: Percentage of Undergraduate Student Credit Hours (SCH) Generated by Full-Time Faculty Fall 2016(continued from previous page)
(continued on next page)

161Section 7 - Faculty & Staff
SEC
TIO
N
7
(continued from previous page)
SCH Generated SCH Generated SCH Generated Total SCH % of SCH
by Full-time by Part-time by Other Generated Generated by
Department Description Faculty Faculty Instructors Full-time Faculty
School of Nursing Nursing Nursing RN 3,966 673 0 4,639 85%Total Total 3,966 673 0 4,639 85%
College of Sciences Biology, Geology & Biology 5,536 2,954 0 8,490 65%Environmental Science Environmental Sciences 816 333 0 1,149 71% Geological Sciences 196 357 0 553 35%Chemistry Chemistry 4,808 2,003 0 6,811 71%Health Sciences Pre-Health Science 2,778 1,301 0 4,079 68% Speech & Hearing 576 1,261 0 1,837 31%Mathematics Mathematics 5,697 6,295 467 12,459 46%Other Science Developmental Math 474 1,065 0 1,539 31% Science 222 24 0 246 90%Physics Physics 1,959 2,190 0 4,149 47%Psychology Psychology 4,562 3,477 126 8,165 56%Total Total 27,624 21,260 593 49,477 56%
College of Urban Affairs Total
Urban Studies Urban Studies 4,173 3,070 0 7,243 58%Total Total 4,173 3,070 0 7,243 58%
Undergraduate Studies
Undergraduate Studies ASC 509 585 283 1,377 37% Business Freshman Orientation 49 97 0 146 34%Total Total 558 682 283 1,523 37%
Other
Other Air Force 0 0 32 32 0% Career Services 27 0 83 110 25% Military Science 0 0 24 24 0% Natl Student Exchange 58 0 0 58 100% Reciprocal Student Exchange 30 0 0 30 100% Study Abroad 72 0 0 72 100%Total Total 187 0 139 326 57%
Total Total 94,177 60,491 1,911 156,579 60%
This report includes only the SCH generated by instructors who have a valid I.D. available in the CSU employee database system.
Table 7.9: Percentage of Undergraduate Student Credit Hours (SCH) Generated by Full-Time Faculty Fall 2016
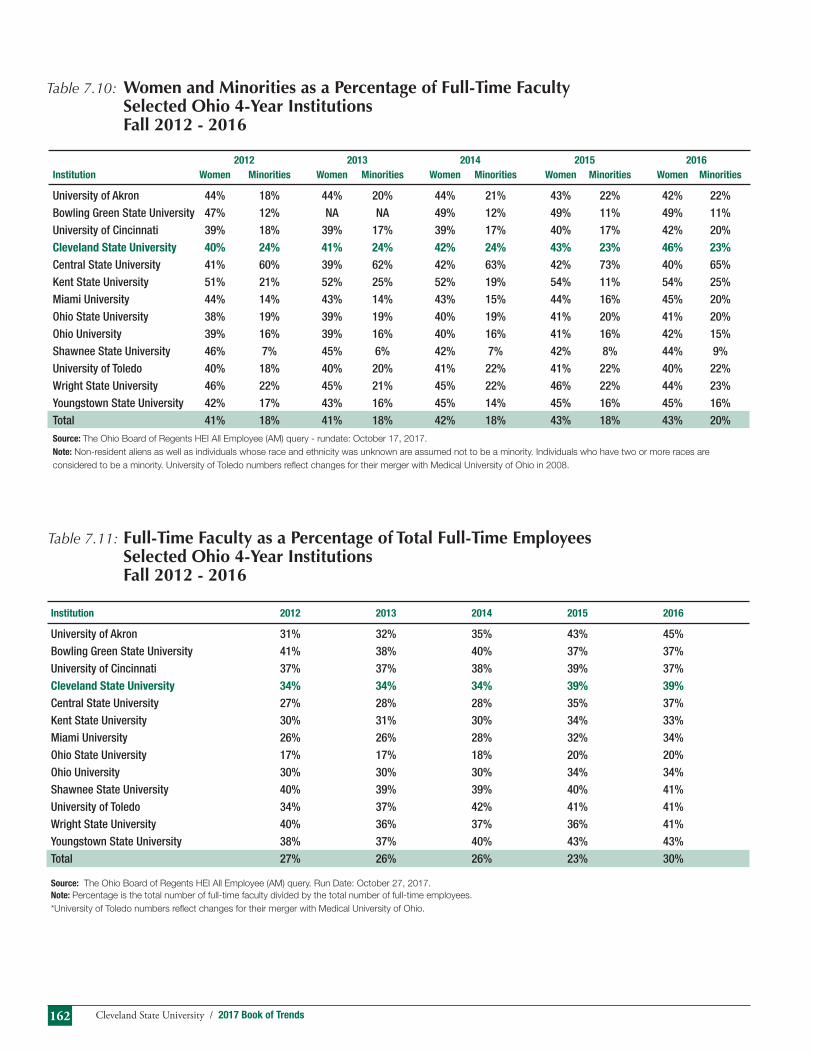
Cleveland State University / 2017 Book of Trends162
2012 2013 2014 2015 2016
Institution Women Minorities Women Minorities Women Minorities Women Minorities Women Minorities
University of Akron 44% 18% 44% 20% 44% 21% 43% 22% 42% 22%Bowling Green State University 47% 12% NA NA 49% 12% 49% 11% 49% 11%University of Cincinnati 39% 18% 39% 17% 39% 17% 40% 17% 42% 20%Cleveland State University 40% 24% 41% 24% 42% 24% 43% 23% 46% 23%
Central State University 41% 60% 39% 62% 42% 63% 42% 73% 40% 65%Kent State University 51% 21% 52% 25% 52% 19% 54% 11% 54% 25%Miami University 44% 14% 43% 14% 43% 15% 44% 16% 45% 20%Ohio State University 38% 19% 39% 19% 40% 19% 41% 20% 41% 20%Ohio University 39% 16% 39% 16% 40% 16% 41% 16% 42% 15%Shawnee State University 46% 7% 45% 6% 42% 7% 42% 8% 44% 9%University of Toledo 40% 18% 40% 20% 41% 22% 41% 22% 40% 22%Wright State University 46% 22% 45% 21% 45% 22% 46% 22% 44% 23%Youngstown State University 42% 17% 43% 16% 45% 14% 45% 16% 45% 16%Total 41% 18% 41% 18% 42% 18% 43% 18% 43% 20%Source: The Ohio Board of Regents HEI All Employee (AM) query - rundate: October 17, 2017.
Note: Non-resident aliens as well as individuals whose race and ethnicity was unknown are assumed not to be a minority. Individuals who have two or more races are
considered to be a minority. University of Toledo numbers refl ect changes for their merger with Medical University of Ohio in 2008.
Table 7.10: Women and Minorities as a Percentage of Full-Time Faculty Selected Ohio 4-Year Institutions Fall 2012 - 2016
Table 7.11: Full-Time Faculty as a Percentage of Total Full-Time Employees Selected Ohio 4-Year Institutions Fall 2012 - 2016
Institution 2012 2013 2014 2015 2016
University of Akron 31% 32% 35% 43% 45%Bowling Green State University 41% 38% 40% 37% 37%University of Cincinnati 37% 37% 38% 39% 37%Cleveland State University 34% 34% 34% 39% 39%
Central State University 27% 28% 28% 35% 37%Kent State University 30% 31% 30% 34% 33%Miami University 26% 26% 28% 32% 34%Ohio State University 17% 17% 18% 20% 20%Ohio University 30% 30% 30% 34% 34%Shawnee State University 40% 39% 39% 40% 41%University of Toledo 34% 37% 42% 41% 41%Wright State University 40% 36% 37% 36% 41%Youngstown State University 38% 37% 40% 43% 43%Total 27% 26% 26% 23% 30%
Source: The Ohio Board of Regents HEI All Employee (AM) query. Run Date: October 27, 2017.
Note: Percentage is the total number of full-time faculty divided by the total number of full-time employees.
*University of Toledo numbers refl ect changes for their merger with Medical University of Ohio.

163Section 7 - Faculty & Staff
SEC
TIO
N
7
Table 7.12: Rate of Annual Student FTE to Number of Full-Time Faculty Selected Ohio 4-Year Institutions Fiscal Years 2012 - 2016
Table 7.13: Student FTE to Full-Time Staff Ratio Selected Ohio 4-Year Institutions Main Campuses Only Fall 2012 - 2016
Percent Change
Institution 2012 2013 2014 2015 2016 1 Year 5 Year
University of Akron 28.3 27.9 25.4 25.9 25.7 -0.8% -9.4%Bowling Green State University 18.8 20.4 20.2 21.5 21.4 -0.5% 13.7%University of Cincinnati 13.8 13.6 14.2 14.2 13.2 -7.4% -5.0%Cleveland State University 26.6 27.5 27.3 25.8 25.5 -1.4% -4.1%
Central State University 22.1 19.9 22.0 17.8 16.0 -10.1% -27.5%Kent State University 27.5 26.5 26.3 26.9 27.2 0.9% -1.0%Miami University 20.1 20.4 19.5 18.9 18.3 -2.9% -8.8%Ohio State University 15.1 13.2 13.5 13.7 13.4 -1.8% -11.3%Ohio University 27.5 25.6 25.5 25.5 24.6 -3.5% -10.4%Shawnee State University 28.0 27.8 30.0 27.5 24.9 -9.5% -11.0%University of Toledo 18.6‡ 17.0 17.3 17.6 16.6 -5.8% -11.1%Wright State University 16.3‡ 16.4 15.8 16.2 16.7 2.6% 2.0%Youngstown State University 28.2 27.3 25.8 25.8 26.3 1.9% -6.7%Total 17.8 17.1 18.4 18.7 18.0 -3.6% 1.5%
Source: The Ohio Board of Regents HEI All Employee (AM) and Course Enrollment queries: run date: November 6, 2017.
Note: Ratio equals the annualized student FTE for the fi scal year divided by the number of full-time faculty. University of Toledo numbers refl ect changes for their merger with
Medical University of Ohio.
‡ Indicates that unfi nalized data has been included in this result.
Percent Change
Institution 2012 2013 2014 2015 2016 1 Year 5 Year
UUniversity of Akron 12.1 11.9 12.5 13.7 13.9 2.0% 15.6%Bowling Green State University 12.2 11.9 12.5 12.4 12.3 -1.1% 0.7%University of Cincinnati 7.6 8.0 8.2 8.0 6.9 -13.3% -8.4%Cleveland State University 12.8 13.1 12.1 12.7 12.2 -3.5% -4.3%
Central State University 6.6 7.1 7.3 8.1 7.7 -4.9% 17.8%Kent State University 11.4 11.0 10.8 11.0 10.6 -3.4% -6.7%Miami University 7.0 7.2 7.3 7.6 8.5 11.4% 20.4%Ohio State University 2.7 2.8 2.8 2.7 2.7 -2.4% -2.2%Ohio University 10.7 10.5 10.1 9.6 9.6 0.1% -10.1%Shawnee State University 17.7 16.8 16.8 15.7 15.6 -1.1% -12.1%University of Toledo 8.4 8.9 8.4 8.5 8.5 -0.1% 0.5%Wright State University 9.2 8.6 8.4 8.2 8.3 0.3% -10.5%Youngstown State University 16.1 15.4 15.4 15.4 16.1 4.7% 0.1%Total 6.4 6.4 6.3 6.3 6.1 -3.0% -4.9%
Source: The Ohio Board of Regents HEI All Employees (AM) and Course Enrollment (CN) queries - run date: October 24, 2017.
* University of Toledo numbers refl ect changes for their merger with Medical University of Ohio
Note: † Indicates institutions which had not fi nalized enrollment data by query date. Ratio equals the student FTE for the term divided by the number of full-time non-faculty
employees employed on November 1 of each year.

Cleveland State University / 2017 Book of Trends164

SEC
TIO
N
8
Selected Administrative Centers, Departments
& Offi ces
8Book of Trends

Cleveland State University / 2017 Book of Trends166

167Section 8 - Selected Administrative Centers, Departments & Offi ces
SEC
TIO
N
8
Application, Admission, and YieldTable 8.1: University Totals Application Trends Unduplicated for Degree-Seeking Students, Fall 2012 - 2016
TABLE 8.1a: NEW FIRST YEAR UNDERGRADUATE APPLICATION TREND FOR DEGREE-SEEKING STUDENTS
First Year Percent Change
2012 2013 2014 2015 2016 1 year 5 year
Total Applied 5,819 6,768 6,407 10,679 12,059 13% 107% Admitted 3,721 4,255 4,272 6,858 7,419 8% 99% Enrolled 1,562 1,727 1,601 1,903 1,941 2% 24% Yield 42% 41% 38% 28% 26%
TABLE 8.1b: NEW TRANSFER UNDERGRADUATE APPLICATION TREND FOR DEGREE-SEEKING STUDENTS
Transfer Percent Change
2012 2013 2014 2015 2016 1 year 5 year
Total Applied 3,769 4,076 3,904 3,753 3,525 -6% -6% Admitted 2,288 2,488 2,300 2,221 2,122 -4% -7% Enrolled 1,539 1,466 1,406 1,366 1,260 -8% -18% Yield 67% 59% 61% 62% 59%
TABLE 8.1c: NEW LAW APPLICATION TREND FOR DEGREE-SEEKING STUDENTS
Law Percent Change
2012 2013 2014 2015 2016 1 year 5 year
Total Applied 1,114 783 560 685 512 -25% -54% Admitted 471 384 303 289 276 -4% -41% Enrolled 124 124 135 95 96 1% -23% Yield 26% 32% 45% 33% 35%
TABLE 8.1d: NEW GRADUATE APPLICATION TRENDS FOR DEGREE-SEEKING STUDENTS
Graduate Percent Change
2012 2013 2014 2015 2016 1 year 5 year
Total Applied 4,108 4,448 5,196 4,928 5,430 10% 32% Admitted 2,206 2,087 2,141 2,259 2,152 -5% -2% Enrolled 1,079 976 1,206 1,149 976 -15% -10% Yield 49% 47% 56% 51% 45%
Source: Institutional Research
Notes: Yield is calculated as the percent of those enrolled from the total admitted.

Cleveland State University / 2017 Book of Trends168
Offi ce of Advancement
CSU FoundationAlumni, friends, faculty, staff, corporations and foundations support Cleveland State University each year with philanthropic gifts to the CSU Foundation.
These gifts provide additional resources that are necessary for sustaining a high quality educational and engaged learning experience for CSU
students and the University. The CSU Foundation manages an endowment, a collection of hundreds of individually named funds that are invested for
growth. Each year, endowment earnings are distributed, providing private support, as determined by donors, for student scholarships, faculty research,
academic programs, athletics and more. Through prudent stewardship of donors’ gifts, the CSU Foundation is able to ensure stability for programs and
provide scholarships for students.
Table 8.2: CSU Foundation: 5-Year Endowment Growth by College/Division Endowment (Program Giving & Scholarship) Percent Change
College/Division 2012 2013 2014 2015 2016 1 Year 5 Year
Business 6,941,913 8,109,456 9,653,444 9,985,151 9,751,200 -2% 40%CLASS 2,105,108 2,442,725 2,792,437 3,370,761 3,238,449 -4% 54%Education 5,979,224 6,354,353 7,162,761 7,011,223 6,754,110 -4% 13%Engineering 6,861,201 8,039,244 10,073,832 11,405,876 10,681,966 -6% 56%Nursing 205,357 251,899 286,744 284,161 260,448 -8% 27%Science 760,011 1,030,055 1,335,640 1,346,805 1,321,929 -2% 74%Urban Affairs 5,091,246 5,722,322 6,949,941 6,996,103 6,578,450 -6% 29%Law 9,048,175 10,263,188 11,752,707 11,521,387 11,272,838 -2% 25%Athletics 1,733,176 1,853,272 2,265,390 2,291,168 2,311,366 1% 33%General University 9,567,987 10,502,010 12,424,350 13,713,387 13,327,716 -3% 39%Library 801,651 876,692 983,914 1,001,073 953,282 -5% 19%Offi ce of the President 400,706 457,870 519,771 533,383 446,661 -16% 11%Total Endowment $49,495,755 $55,903,086 $66,200,931 $69,460,478 $66,898,415 -4% 35%
Program Giving1 Percent Change
College/Division 2012 2013 2014 2015 2016 1 Year 5 Year
Business 684,415 865,238 976,134 1,014,624 945,278 -7% 38%CLASS 521,181 591,844 654,909 776,568 707,491 -9% 36%Education 5,147,654 5,401,062 6,065,016 5,920,922 5,688,922 -4% 11%Engineering 1,880,219 2,179,047 2,810,636 3,039,016 2,791,861 -8% 48%Science 261,279 278,656 321,837 293,377 282,027 -4% 8%Urban Affairs 3,459,679 3,887,379 4,524,652 4,534,045 4,202,757 -7% 21%Law 2,388,876 2,721,361 3,157,240 3,044,233 2,825,574 -7% 18%Athletics 39,064 43,295 48,180 47,236 47,236 0% 21%General University 1,442,663 1,652,205 1,940,912 2,215,581 2,194,458 -1% 52%Library 801,651 876,692 983,914 1,001,073 953,282 -5% 19%Offi ce of the President 400,706 457,870 519,771 533,383 446,661 -16% 11% Total Program $17,027,387 $18,954,649 $22,003,201 $22,420,057 $21,085,547 -6% 24%
(continued on next page)

169Section 8 - Selected Administrative Centers, Departments & Offi ces
SEC
TIO
N
8
Offi ce of Advancement
Philanthropic Highlights: 2016-2017
• The University concluded its fi rst-ever campaign, ENGAGE: The Campaign for Cleveland State University two years ahead of schedule and above goal, raising more than $114 million to support student success and the many initiatives in place to help CSU students stay in school and graduate.
• Secured $17 million in attainment (gifts and pledges) and $14.9 million in cash (gifts and pledge payments).
• Secured more than $5.6 million for scholarships; the number of endowments increased from 345 to 360.
• Radiance, CSU Realizing the Promise set a record, raising $1.3 million for Radiance scholarships, which are awarded primarily to students in good academic standing who are at risk for
dropping out of school because of fi nances and need a few “last dollars” to graduate.
• Secured 72 major gift commitments ($25,000 and up) and an additional 65 gifts from $10,000 to $24,999. Transformational gifts included $1.9 million from the Jack, Joseph and Morton Mandel Foundation to create the Jack, Joseph, and Morton Mandel Continuing Scholars Program, $1 million from Frank and Barbara Sullivan to establish the Pratt Center, and $1 million from The David and Inez Meyers Foundation to support The David and Inez Meyers Honors Scholars.
• Raised $126,500 from 1,260 donors in 24 hours as part of CSU’s fourth-annual Giving Day, more than doubling the prior year’s results.
Table 8.2: CSU Foundation: 5-Year Endowment Growth by College/Division
Scholarship Percent Change
College/Division 2012 2013 2014 2015 2016 1 Year 5 Year
Business 6,257,499 7,244,218 8,677,310 8,970,527 8,805,922 -2% 41%CLASS 1,583,927 1,850,881 2,137,529 2,594,193 2,530,958 -2% 60%Education 831,570 953,291 1,097,744 1,090,301 1,065,188 -2% 28%Engineering 4,980,982 5,860,197 7,263,196 8,366,860 7,890,105 -6% 58%Nursing 205,357 251,899 286,744 284,161 260,448 -8% 27%Science 498,732 751,399 1,013,803 1,053,428 1,039,902 -1% 109%Urban Affairs 1,631,567 1,834,943 2,425,288 2,462,059 2,375,693 -4% 46%Law 6,659,299 7,541,827 8,595,467 8,477,155 8,447,264 0% 27%Athletics 1,694,112 1,809,977 2,217,210 2,243,931 2,264,130 1% 34%General University 8,125,324 8,849,805 10,483,438 11,497,806 11,133,258 -3% 37%Total Scholarships $32,468,369 $36,948,437 $44,197,729 $47,040,421 $45,812,868 -3% 41%TOTAL ENDOWMENTS $49,495,756 $55,903,086 $66,200,930 $69,460,478 $66,898,415 -4% 35%
1Program giving includes gifts for academic programs, support for colleges, faculty and staff development, technological upgrades, and facilities and equipment.
Some totals for 2012 have been adjusted for this year’s edition of the Book of Trends, and may differ slightly from those reported last year.
Source: CSU Controller’s Offi ce and University Advancement.
Note: In last year’s table, totals for 2016 were incorrectly listed in the 2015 column. Correct totals for both the 2015 and 2016 years are provided in this year’s updated table.
(continued from previous page)
Table 8.3: CSU Foundation: Endowed Scholarship, Donors & Giving
Percent Change
Endowed: FY 2013 FY 2014 FY 2015 FY 2016 FY 2017 1 Year 5 Year
CChairs 6 6 6 7 8 14% 33%Scholarships 281 303 317 337 357 6% 27% Alumni Donors 3,621 4,298 4,591 4,357 4,629 6% 28%Total Donors 5,877 6,322 6,748 6,367 7,135 12% 21%Alumni Giving $1,513,849 $7,422,352 $6,663,921 $2,051,690 $2,355,513 15% 56%Total Giving $6,162,823 $14,179,161 $17,731,954 $11,801,520 $14,959,403 27% 143%Source: CSU Offi ce of Advancement

Cleveland State University / 2017 Book of Trends170
AthleticsTable 8.4: Athletic Sports at Cleveland State University by Enrollment
MEN’S SPORTS 2012-2013 2013-2014 2014-2015 2015-16 2016-17
Enrollment % Enrollment % Enrollment % Enrollment % Enrollment %
Baseball 5 5% 0 0% 0 0% 0 0% 0 0%Basketball 12 13% 13 15% 13 15% 13 14% 13 12%Fencing 0 0% 0 0% 0 0% 0 0% 0 0%Lacrosse 21 17%Golf 9 10% 8 9% 8 9% 9 10% 9 8%Soccer 20 21% 18 21% 19 22% 19 21% 20 18%Swimming & Diving 19 20% 19 22% 18 20% 22 24% 21 19%Tennis 8 9% 8 9% 8 9% 7 8% 7 6%Wrestling 21 22% 19 22% 22 25% 22 24% 20 18%Total Men 94 100% 85 100% 88 100% 92 100% 111 100%
Cumulative GPA, Males 2.96 2.99 2.94 3.02 3.00
WOMEN’S SPORTS 2012-2013 2013-2014 2014-2015 2015-16 2016-17
Enrollment % Enrollment % Enrollment % Enrollment % Enrollment %
Basketball 13 11% 12 11% 14 13% 13 11% 12 10%Cross Country / Track & Field 9 8% 12 11% 14 13% 10 8% 11 9%Fencing 0 0% 2 2% 2 2% 2 2% 4 3%Golf 8 7% 7 6% 6 6% 7 6% 7 6%Soccer 22 19% 22 19% 21 19% 24 20% 27 22%Softball 21 18% 16 14% 16 15% 20 17% 17 14%Swimming & Diving 22 19% 22 19% 16 15% 24 20% 24 20%Tennis 8 7% 9 8% 7 6% 8 7% 8 7%Volleyball 12 10% 12 11% 12 11% 12 10% 12 10%Total Women 115 100% 114 100% 108 100% 120 100% 122 100%
Cumulative GPA, Females 3.31 3.35 3.33 3.32 3.32
Total All Athletes 209 199 196 212 233
Cumulative GPA, All Athletes 3.16 3.16 3.17 3.20 3.16
Note: Enrollment refl ects students who received athletic fi nancial aid. GPA refl ects fall term.
Source: CSU Athletics Department
2016-17 Athletic Department Highlights:• The volleyball team won its second straight Horizon League Championship
and advanced to the NCAA Championship for the fourth time in program history.
• Volleyball senior Grace Kauth was named the Horizon League Player of the Year and was one of 30 fi nalists for the Senior CLASS Award.
• Junior cross country runner Karen Barrientos placed fi fth at the Horizon League Championship, becoming the fi rst runner in program history to earn fi rst team All-League honors.
• Senior men’s soccer standout Sergio Manesio was named the Horizon League Defensive Player of the Year for the second straight season. He was also one of 10 fi nalists for the Senior CLASS Award.
• Ali Kazemaini resigned as the head coach of the men’s soccer program at the end of the season and longtime assistant Kirk Harwat was named the 10th head coach in program history.
• Sonia Curvelo resigned as the head coach of the women’s soccer program at the end of the season and Dallas Boyer, who was an assistant coach for 11 seasons, was named the third head coach in program history.
• Junior Nick Corba was an at-large selection for the NCAA Wrestling Championships and posted a 2-2 record at 184 pounds.
• Senior Philipp Sikatzki was named the Horizon League Men’s Swimming Athlete of the Year for the second straight season. He also qualifi ed for the NCAA Swimming & Diving Championships for the season consecutive year.
• Men’s basketball head coach Gary Waters retired at the end of the season, ending an 11-year run as head coach. Dennis Felton, a veteran with more than 30 years of experience, was named the 15th head coach in program history.
• The fencing squad qualifi ed 10 individuals to the NCAA Regional Championship. CSU also learned that it will host the 2019 National Collegiate Fencing Championships.
• The women’s golf team won its fi rst-ever Horizon League Championship as sophomore Rayna Oosterhuis fi nished as the runner-up. CSU went on to compete at the NCAA Columbus Regional.
• The men’s golf squad won its fourth straight Horizon League Championship and eighth in the last 12 seasons as sophomore Anton Krecic claimed medalist honors. The Vikings were selected to compete in the NCAA West Lafayette Regional.
• The women’s tennis team won its second straight Horizon League regular season title.
• The men’s tennis team became the fi rst team seeded sixth to advance to the Horizon League Championship match. Senior Colton Buffi ngton earned the Herb Foster Sportsmanship Award for his positive attitude on and off the court.
• The men’s lacrosse team made its debut as a varsity sport at CSU, hosting Michigan for the fi rst game in program history on Feb. 4. The Vikings earned their fi rst victory over a Division I team with a 13-6 triumph over Detroit Mercy in the season fi nale at Krenzler Field.
• A total of 173 student-athletes, representing all 18 sports, were honored at the 27th Annual John Konstantinois Athletic Academic Luncheon for having a cumulative GPA of 3.0 or better.
• The cross country, women’s soccer, wrestling and men’s and women’s swimming and diving teams were all honored by their respective coaches associations for having success in the classroom.
• CSU had 69 student-athletes named to the Horizon League Fall Honor Roll, while 71 earned the honor in the spring.
Table 8.5: Athletic Sports at Cleveland State University 4, 5, and 6 Year Graduation Rate
New Undergraduate First-time,
Fall
Degree-Seeking, 2006 2007 2008 2009 2010
First Year Athletes Enrollment % Enrollment % Enrollment % Enrollment % Enrollment %
Total Athletes 50 62 54 54 66
Athletes graduated in 4 years 19 38% 17 27% 14 26% 15 28% 41 62%Athletes graduated in 5 years 11 22% 14 23% 18 33% 19 35% 10 15%Athletes graduated in 6 years 0 0% 1 2% 3 6% 0 0% 0%Total Athletes Graduated ≤ 6 Years 30 60% 32 52% 35 65% 34 63% 51 77%

171Section 8 - Selected Administrative Centers, Departments & Offi ces
SEC
TIO
N
8
Tabl
e 8.
6: S
tate
men
t of
Rev
enue
s, E
xpen
ditu
res
and
Oth
er C
hang
es
Fisc
al Y
ears
201
2 –
2016
2012
2013
2014
20
15
2
01
6
Perc
en
t C
ha
ng
e
$
Am
ou
nt
%
$
Am
ou
nt
%
$
Am
ou
nt
%
$
Am
ou
nt
%
$
Am
ou
nt
%
1
yea
r 5
yea
r
OP
ER
ATIN
G R
EV
EN
UE
S
Stud
ent T
uitio
n an
d Fe
es, N
et
148,
869,
484
75
%
153,
869,
978
74
%
159,
789,
368
74
%
155,
373,
567
78
%
152,
650,
587
73
%
-2%
3%
Fede
ral G
rant
s &
Cont
ract
s 10
,584
,556
5%
9,
527,
734
5%
8,
770,
261
4%
7,
533,
873
4%
7,
138,
884
3%
-5
%
-33%
Stat
e Gr
ants
& C
ontr
acts
8,
973,
341
5%
8,
519,
937
4%
11
,577
,824
5%
2,
721,
558
1%
4,
088,
356
2%
50
%
-54%
Loca
l Gra
nts
& Co
ntra
cts
263,
589
0%
68
9,02
2
0%
822,
171
0%
44
2,62
2
0%
458,
752
0%
4%
74
%Pr
ivat
e Gi
fts, G
rant
s &
Cont
ract
s 2,
695,
376
1%
2,
714,
471
1%
4,
250,
446
2%
3,
194,
953
2%
4,
208,
384
2%
32
%
56%
Sale
s &
Serv
ices
4,
524,
083
2%
9,
703,
993
5%
7,
069,
797
3%
6,
267,
613
3%
7,
303,
747
3%
17
%
61%
Auxi
liary
Ent
erpr
ises
22
,458
,921
11
%
22,2
40,5
18
11%
23
,450
,596
11
%
22,7
80,0
60
11%
25
,804
,102
12
%
13%
15
%Ot
her S
ourc
es
377,
838
0%
25
8,88
9
0%
1,17
1,45
5
1%
1,00
6,63
3
1%
7,89
6,06
7
4%
684%
19
90%
TO
TAL O
PE
RA
TIN
G R
EV
EN
UE
S
19
8,7
47
,18
8
10
0%
2
07
,52
4,5
42
1
00
%
21
6,9
01
,91
8
10
0%
1
99
,32
0,8
79
1
00
%
20
9,5
48
,87
9
10
0%
5
%
5%
OP
ER
ATIN
G E
XP
EN
SE
S
Inst
ruct
ion
91,9
32,5
44
33%
96
,849
,118
33
%
99,0
14,2
44
33%
10
0,95
9,71
4 35
%
105,
091,
851
33
%
4%
14%
Rese
arch
14
,961
,949
5%
13
,159
,579
4%
16
,635
,509
6%
7,
707,
904
3%
9,00
0,72
4
3%
17%
-4
0%Pu
blic
Ser
vice
5,
997,
307
2%
7,
470,
471
3%
8,
193,
344
3%
6,
110,
528
2%
6,03
5,63
6
2%
-1%
1%
Acad
emic
Sup
port
23
,017
,435
8%
23
,844
,470
8%
25
,135
,935
8%
26
,229
,750
9%
28
,713
,179
9%
9%
25
%St
uden
t Ser
vice
s 17
,787
,324
6%
19
,921
,498
7%
19
,692
,624
7%
19
,174
,987
7%
19
,961
,340
6%
4%
12
%In
stitu
tiona
l Sup
port
27
,057
,901
10
%
32,6
19,8
75
11%
30
,924
,222
10
%
28,8
89,5
82
10%
34
,132
,336
11
%
18%
26
%Op
erat
ion
& M
aint
enan
ce o
f Pla
nt
27,9
75,1
81
10%
28
,223
,485
10
%
28,7
00,3
94
10%
27
,868
,495
10
%
33,6
80,3
70
11%
21
%
20%
Scho
lars
hips
and
Fel
low
ship
s 18
,018
,604
6%
15
,887
,129
5%
14
,381
,902
5%
15
,941
,248
5%
15
,560
,569
5%
-2
%
-14%
Auxi
liary
Ent
erpr
ises
29
,152
,533
10
%
31,5
94,1
98
11%
32
,448
,832
11
%
32,8
84,0
41
11%
36
,723
,496
12
%
12%
26
%De
prec
iatio
n an
d Am
ortiz
atio
n 24
,203
,824
9%
26
,550
,715
9%
26
,657
,857
9%
26
,666
,434
9%
28
,832
,469
9%
8%
19
%
TO
TAL O
PE
RA
TIN
G E
XP
EN
SE
S
28
0,1
04
,60
2
10
0%
2
96
,12
0,5
38
1
00
%
30
1,7
84
,86
3
10
0%
2
92
,43
2,6
83
1
00
%
31
7,7
31
,97
0
10
0%
9
%
13
%
NO
NO
PE
RA
TIN
G I
TE
MS
Stat
e Ap
prop
riatio
ns
64,4
34,7
47
69%
65
,061
,745
65
%
68,0
79,5
20
62%
71
,018
,135
68
%
74,5
16,4
10
75%
5%
16
%Fe
dera
l App
ropr
iatio
ns
- -
- -
- -
- -
- -
-
- Fe
dera
l Gra
nts
and
Cont
ract
s 23
,453
,217
25
%
22,1
86,0
01
22%
22
,422
,637
20
%
21,6
79,4
94
21%
21
,675
,238
22
%
0%
-8%
Stat
e Gr
ants
and
Con
trac
ts
2,64
6,33
7 3%
3,
533,
938
4%
1,41
3,31
2 1%
3,
937,
636
4%
5,02
0,41
1
5%
27%
90
%Gi
fts
7,19
6,63
2 8%
7,
306,
397
7%
13,8
41,0
28
13%
15
,071
,455
14
%
9,01
7,21
1
9%
-40%
25
%In
vest
men
t Inc
ome
1,04
8,74
3 1%
9,
395,
509
9%
11,8
50,7
09
11%
54
5,51
9 1%
(2
,963
,770
) -3
%
-643
%
-383
%In
tere
st o
n De
bt
-9,0
34,4
00
-10%
-7
,861
,712
-8
%
-7,9
71,4
49
-7%
-7
,909
,704
-8
%
(9,0
96,7
01)
-9%
15
%
1%St
ate
Capi
tal A
ppro
pria
tions
3,
179,
823
3%
335,
459
0%
237,
013
0%
59,6
21
0%
580,
544
1%
87
4%
-82%
Capi
tal G
ifts
- -
- -
- -
- -
- -
-
- Ot
her N
onop
erat
ing
Item
s -
- -
- -
- -
- -
- -
-
TO
TAL N
ON
OP
ER
AT
ING
ITE
MS
92
,92
5,0
99
1
00
%
99
,95
7,3
37
1
00
%
10
9,8
72
,77
0
10
0%
1
04
,40
2,1
56
1
00
%
98
,74
9,3
43
1
00
%
-5%
6
%
(Con
tinue
d on
nex
t pa
ge)
Fina
nce

Cleveland State University / 2017 Book of Trends172
Tabl
e 8.
6:
Stat
emen
t of
Rev
enue
s, E
xpen
ditu
res
and
Oth
er C
hang
es
Fisc
al Y
ears
201
2 –
2016
2012
2013
2014
20
15
2
01
6
Perc
en
t C
ha
ng
e
$
Am
ou
nt
%
$
Am
ou
nt
%
$
Am
ou
nt
%
$
Am
ou
nt
%
$
Am
ou
nt
%
1
-yea
r 5
-yea
r
NE
T A
SS
ETS
AT E
ND
OF Y
EA
R
Incr
ease
in N
et A
sset
s 11
,567
,685
3%
11
,361
,341
3%
24
,989
,825
6%
11
,290
,352
5%
-9
,433
,748
-4
%
-184
%
-182
%Ne
t Ass
ets
at B
egin
ning
of Y
ear
- -
358,
304,
898
- 36
7,67
7,98
3 -
392,
667,
808
- 22
3,43
5,76
7 -
- -
Rest
atem
ent
FY13
*, FY
15**
-
- -1
,988
,256
-
- -
-180
,522
,393
-
- -
- -
Net A
sset
s at
Beg
inni
ng o
f Yea
r 34
6,73
7,21
3
97%
35
6,31
6,64
2
97%
36
7,67
7,98
3
94%
21
2,14
5,41
5
95%
22
3,43
5,76
7
104%
5%
-3
6%N
ET A
SS
ETS
AT E
ND
OF Y
EA
R
358,3
04,8
98
100%
367,6
77,9
83
100%
392,6
67,8
08
100%
223,4
35,7
67
100%
214,0
02,0
19
100%
-4
%
-40%
So
urc
e:
CS
U C
ontr
olle
r’s
Offi c
e
* C
hang
e in
Acc
ount
ing
Princ
ipal
: Ef
fect
ive
with
the
fi s
cal y
ear
ende
d 6
/30
/13
the
Uni
vers
ity a
dopt
ed G
ASB
65 r
esul
ting
in a
red
uctio
n of
Beg
inni
ng N
et A
sset
s of
$1,9
88,2
56.
** C
hang
e in
Acc
ount
ing
Princ
ipal
: Ef
fect
ive
with
the
fi s
cal y
ear
ende
d 6
/30
/15 t
he U
nive
rsity
ado
pted
GA
SB
68 r
esul
ting
in a
red
uctio
n of
Beg
inni
ng N
et A
sset
s of
$180,5
22,3
93.
(Con
tinue
d fr
om p
revi
ous
page
)
Figu
re 8
.6a:
Tot
al R
even
ues
- FY
201
1 -
2015
Figu
re 8
.6b:
Ope
rati
ng E
xpen
ses
- FY
201
1 -
2015
Fina
nce 20
1220
1220
1320
1320
1420
1420
1520
1520
1620
16

173Section 8 - Selected Administrative Centers, Departments & Offi ces
SEC
TIO
N
8
FinanceTable 8.7: Public Service Expenditures as a Percentage of Total Expenditures Selected Ohio 4-Year Institutions - Main Campuses Only Fiscal Years 2011 - 2015
Institution 2012 2013 2014 2015 2016
University of Akron 3.1% 2.8% 2.0% 1.5% 1.5%
Bowling Green State University 1.4% 1.2% 1.3% 1.2% 1.1%
University of Cincinnati 5.8% 5.9% 6.3% 5.9% 6.0%
Cleveland State University 2.2% 2.6% 2.8% 2.1% 1.9%
Central State University 4.4% 4.0% 3.5% 3.9% 4.1%
Kent State University 2.7% 2.4% 2.4% 2.1% 2.2%
Miami University 0.2% 0.4% 0.5% 0.6% 0.7%
Ohio State University 2.4% 2.3% 2.8% 3.0% 3.6%
Ohio University 4.4% 4.2% 4.1% 3.9% 4.0%
Shawnee State University 2.9% 3.1% 3.5% 3.2% 3.3%
University of Toledo 0.7% 0.8% 0.9% 1.0% 1.1%
Wright State University 3.7% 3.8% 4.1% 4.2% 4.8%
Youngstown State University 2.6% 2.3% 2.2% 2.3% 2.7%
Totals 2.7% 2.6% 2.9% 2.9% 3.2%
Source: The Ohio Board of Regents HEI Current Fund Expenditures (CF) queries. Run Date: November 15, 2017.
Note: Percentage equals the expenditures for public service for the fi scal year divided by the total expenditures.
Table 8.8: Benefi t Expenditures as a Percentage of Total Funding Unit Expenditures Selected Ohio 4-Year Institutions - Main Campuses Only Fiscal Years 2012 - 2016
Institution 2012 2013 2014 2015 2016
University of Akron 15.9% 27.2% 28.9% 29.7% 30.5%Bowling Green State University 14.4% 16.9% 14.7% 14.2% 13.9%University of Cincinnati 16.2% 17.0% 17.1% 16.6% 15.9%Cleveland State University 15.1% 14.6% 15.1% 15.0% 15.2%
Central State University 25.6% 26.9% 26.5% 25.8% 26.5%Kent State University 12.5% 12.5% 12.5% 12.6% 13.1%Miami University 17.8% 18.6% 17.2% 19.4% 20.4%Ohio State University 26.6% 29.1% 29.1% 29.2% 30.5%Ohio University 23.5% 23.7% 13.0% 17.9% 18.9%Shawnee State University 25.5% 26.6% 25.8% 26.2% 23.6%University of Toledo 17.5% 17.5% 17.4% 17.7% 17.4%Wright State University 12.0% 13.4% 16.0% 15.1% 14.7%Youngstown State University 23.0% 20.9% 17.2% 18.2% 22.8%Totals 20.5% 22.3% 21.4% 22.1% 22.6%
Source: The Ohio Board of Regents HEI Funding Unit Expenditures (FX) queries. Rundate: November 16, 2017.
Note: Percentage equals the expenditures for benefi ts during the fi scal year divided by total funding unit expenditures.

Cleveland State University / 2017 Book of Trends174
Table 8.9: Scholarship & Fellowship Expenditures as a Percentage of Total Expenditures Selected Ohio 4-Year Institutions - Main Campuses Only Fiscal Years 2012 - 2016
Institution 2012 2013 2014 2015 2016
University of Akron 14.7% 14.6% 14.1% 14.4% 13.8%Bowling Green State University 20.0% 18.6% 18.6% 18.6% 18.6%University of Cincinnati 13.4% 13.3% 13.2% 13.5% 13.3%Cleveland State University 12.6% 12.5% 11.9% 13.2% 13.2%
Central State University 22.5% 20.6% 20.9% 20.9% 20.1%Kent State University 17.2% 16.0% 16.1% 16.2% 16.0%Miami University 15.8% 16.6% 16.9% 17.3% 17.7%Ohio State University 5.8% 5.9% 5.9% 5.8% 5.8%Ohio University 12.4% 12.1% 11.9% 11.0% 11.6%Shawnee State University 26.4% 25.3% 25.7% 24.8% 24.9%University of Toledo 11.9% 11.3% 11.4% 11.2% 11.4%Wright State University 14.2% 14.3% 14.9% 15.4% 15.9%Youngstown State University 20.7% 19.7% 18.9% 18.8% 18.3%Totals 10.8% 10.5% 10.4% 10.3% 10.3%Source: The Ohio Board of Regents HEI Current Fund Expenditures (CF) queries. Run Date: August 23, 2016.
Note: Percentage equals the expenditures for scholarships and fellowships divided by total expenditures.
Finance
Cleveland State University’s Financial Aid ProgramsFinancial aid is money that is provided to help bridge the gap between students’ own resources and the amount of money needed to pay the cost
of attending college. More than two thirds of Cleveland State’s students receive some form of fi nancial assistance. The University participates
in or administers all of the major federal and state grant and loan programs. In addition, Cleveland State provides University grants and scholarships.
Table 8.10: Financial Aid Awards to Undergraduate Students by Full-Time/Part-Time Status, Average Aid Package and Academic Year
Academic Year Percent Change
2012-13 2013-14 2014-15 2015-16 2016-17 1 year 5 year
Full-time Students with Financial Aid:
Enrollment 6,434 6,892 6,428 6,547 6,527 0% 1%Average Aid Package $8,821 $8,707 $8,935 $8,839 8,777 -1% 0%Part-time Students with Financial Aid:
Enrollment 1,631 1,259 1,471 1,417 1,469 4% -10%Average Aid Package $5,896 $6,566 $6,660 $6,544 $6,515 0% 10%
Source: Common Data Set, H2-row D and row J
Financial aid reported refl ects awards to undergraduates enrolled in the fall term of the academic year. Although the university awards a substantial amount of fi nancial aid to additional students, this data
refl ects a particular point in time by using standard fi gures as defi ned by IPEDS (http://nces.ed.gov/ipeds/) and the Common Data Set (www.commondataset.org).
Financial Aid Offi ce

175Section 8 - Selected Administrative Centers, Departments & Offi ces
SEC
TIO
N
8
Table 8.11: Financial Aid Awards Fall Cohort, Full-Time, First-Time, Degree-Seeking Undergraduate Students
Percent Change
2012-2013 2013-2014 2014-2015 2015-2016 2016-2017 1 year 5 year
Federal Grants:
Enrollment 690 818 861 727 852 17% 23% Average Aid Package $4,359 $4,539 $4,604 $4,629 $4,635 0% 6%State Grants:
Enrollment 506 611 645 530 638 20% 26% Average Aid Package $823 $935 $1,087 $1,125 $1,501 33% 82%Scholarships/Institutional Grants:
Enrollment 618 684 706 622 828 33% 34% Average Aid Package $5,155 $5,442 $5,325 $5,258 $5,987 14% 16%Federal Student Loans:
Enrollment 919 1,063 1,189 1,021 1,134 11% 23% Average Aid Package $5,772 $5,644 $5,814 $6,074 $5,570 -8% -3% Prior Year Cohort N=1,328 N=1,531 N=1,729 N=1,562 N=1,847
Source: IPEDS Financial Aid Survey (http://nces.ed.gov/ipeds/)
Financial aid reported refl ects awards to undergraduates enrolled in the fall term of the academic year. Although the university awards a substantial amount of fi nancial aid to additional students, this data refl ects
a particular point in time by using standard fi gures as defi ned by IPEDS (http://nces.ed.gov/ipeds/) and the Common Data Set (www.commondataset.org).
Table 8.12: Financial Aid Awards to Fall Term Undergraduate Students
Percent Change
2012-2013 2013-2014 2014-2015 2015-2016 2016-2017 1 year 5 year
Federal Grants $22,854,234 $23,390,675 $22,928,474 $22,387,513 $22,109,508 -1% -3%
State Grants $3,940,423 $4,372,629 $4,559,067 $5,543,166 $5,757,454 4% 46%
Institutional Grants/Scholarships $7,334,909 $7,334,092 $6,941,713 $10,172,591 $11,404,315 12% 55%
Athletic Grants $2,610,354 $2,602,035 $2,626,103 $2,724,128 $2,898,081 6% 11%
Federal Student Loans and $66,171,387 $65,071,270 $62,856,104 $59,932,183 $60,034,634 0% -9%Federal Work Study (FWS)
Total $102,911,307 $102,770,701 $99,911,461 $100,759,581 $102,203,992 1% -1%
Source: Common Data Set, H1 (based on estimated award year 2016-2017)
Financial Aid Offi ce

Cleveland State University / 2017 Book of Trends176
Table 8.13: Graduate Student Financial Aid Awards by Full-Time/Part-Time Status and Average Aid Package
Percent Change
2011-12 2012-13 2013-14 2014-15 2015-16 1 year 5 year
Full-time students with Financial Aid:
Enrollment 593 545 544 526 512 -2.7% -13.7% Average Aid Package $20,106 $21,336 $21,549 $21,875 $21,247 -2.9% 5.7%Part-time students with Financial Aid:
Enrollment 2033 2004 1833 1756 1565 -10.9% -23.0% Average Aid Package $15,089 $15,880 $15,757 $16,119 $15,974 -0.9% 5.9%
Source: CSU Financial Aid Offi ce
Table 8.14: Graduate Student Financial Aid Awards by Types of Financial Aid Fall 2012 - 2016
Percent Change
Types of Financial Aid 2011-12 2012-13 2013-14 2014-15 2015-16 1 year 5 year
SState Fellowship $92,439 $55,072 $73,798 $83,618 $72,877 -12.8% -21.2%Scholarships/Institutional Grants $4,300,000 $5,074,831 $4,079,315 $4,100,650 $4,229,327 3.1% -1.6%Non-Institutional Assistance $315,577 $308,971 $502,041 $646,576 $253,498 -60.8% -19.7%Federal Student Loans and $37,801,004 $37,943,017 $35,900,446 $34,920,044 $31,194,239 -10.7% -17.5%Federal Work Study (FWS) Source: CSU Financial Aid Offi ce
Table 8.15: Law Student Financial Aid Awards Full-Time/Part-Time Status and Average Aid Package
Percent Change
2011-12 2012-13 2013-14 2014-15 2015-16 1 year 5 year
Full-time students with Financial Aid:
Enrollment 391 345 297 284 250 -12.0% -36.1% Average Aid Package $31,387 $31,547 $32,790 $34,124 $32,997 -3.3% 5.1%Part-time students with Financial Aid:
Enrollment 133 122 92 101 115 13.9% -13.5% Average Aid Package $23,378 $24,353 $27,551 $28,117 $30,086 7.0% 28.7%Source: CSU Financial Aid Offi ce
See notes at the end of Financial Aid Section
Table 8.16: Law Student Financial Aid Awards by Types of Financial Aid Fall 2012 - 2016
Percent Change
Types of Financial Aid 2011-12 2012-13 2013-14 2014-15 2015-16 1 year 5 year
SState Fellowship $0 $0 $0 $0 $0 - -Scholarships/Institutional Grants $1,959,025 $2,096,603 $2,543,201 3,516,730 3,290,929 -6.4% 68.0%Non-Institutional Assistance $66,819 $26,340 $66,858 $47,281 $20,607 -56.4% -69.2%Federal Student Loans and $13,217,639 $11,295,287 $9,886,606 $8,967,146 $8,397,695 -6.4% -36.5%Federal Work Study (FWS)
Source: CSU Financial Aid Offi ce
See notes at the end of Financial Aid Section
Financial Aid Offi ce

177Section 8 - Selected Administrative Centers, Departments & Offi ces
SEC
TIO
N
8
Table 8.17: Undergraduate Cost of Attendance (COA)
Academic Year
2011-12 2012-13 2013-14 2014-15 2015-16 2016-17
Tuition/Fees $9,002 $9,316 $9,498 $9,688 $9,848 $9,786Books and Supplies $800 $800 $800 $800 $800 $800Room/Board $11,842 $11,662 $11,858 $12,100 $12,464 $12,000Personal/Miscellaneous $2,500 $1,700 $1,700 $1,700 $1,700 $1,700Transportation $1,800 $1,460 $1,460 $1,726 $1,740 $1,770Loan Fees $0 $0 $0 $72 $72 $78Total $25,944 $24,938 $25,316 $26,086 $26,624 $26,134
Source: CSU Financial Aid Offi ce
Table 8.18: Annualized Full-Time Undergraduate Tuition & Fees for Selected Main Campuses of Ohio 4-Year Institutions 2016
University Main Campuses In-State Out-Of-State
Bowling Green State University $10,726 $18,262
Cleveland State University $9,768 $13,819
Kent State University $10,012 $18,376
Miami University $14,233 $32,556
Ohio State University $10,037 $28,229
Ohio University $10,602 $21,208
University of Akron $10,270 $18,802
University of Cincinnati $11,000 $26,334
University of Toledo $9,380 $18,718
Wright State University $8,730 $17,350
Youngstown State University $8,317 $8,558
Source: Data from Ohio Board of Regents Fall 2016 Survey of Student Charges for Academic Year 2016-2017
Financial Aid Offi ce

Cleveland State University / 2017 Book of Trends178
Financial Aid Offi ceTable 8.19: Award of Financial Aid at Ohio’s Public Title lV Postsecondary Institutions Percent of First-Time, Full-Time, Degree-Seeking Students Receiving Aid Average Award Amounts, Academic Year 2013 - 2014
Any Grant Federal Grants State Grants Institutions Grants Federal and
Other Loans
Institution Any Aid % % Avg. Grant $ % Avg. Grant $ % Avg. Grant $ % Avg. Grant $ % Avg. Grant $
Bowling Green State University 96% 84% $6,890 36% $4,359 23% $1,337 71% $5,467 70% $7,307
Central State University 96% 92% $6,770 81% $5,471 31% $233 42% $4,113 88% $8,268
Cleveland State University 89% 71% $6,486 47% $4,629 34% $1,125 40% $5,258 66% $7,008
Kent State University 93% 83% $7,132 35% $4,474 22% $1,296 78% $5,385 68% $7,753
Miami University 76% 66% $9,805 13% $4,852 6% $1,028 64% $9,057 41% $7,401
Ohio State University 86% 79% $9,228 17% $4,389 10% $1,401 79% $8,143 42% $7,436
Ohio University 92% 83% $5,483 27% $4,329 17% $1,176 80% $3,975 66% $7,760
Shawnee State University 93% 81% $4,974 55% $4,183 41% $1,090 41% $3,117 72% $5,930
University of Akron 94% 81% $6,388 40% $4,327 31% $1,037 61% $5,210 67% $7,249
University of Cincinnati 83% 61% $6,876 21% $4,458 14% $1,321 54% $5,596 53% $7,200
University of Toledo 96% 96% $8,301 39% $4,833 23% $1,179 89% $6,483 62% $6,614
Wright State University 92% 79% $6,365 43% $4,601 34% $1,272 66% $3,985 65% $6,804
Youngstown State University 96% 75% $7,254 48% $4,722 38% $1,209 59% $4,530 64% $5,885
University Main Campuses 91% 79% $7,073 39% $4,587 25% $1,131 63% $5,409 63% $7,124
Source: https://nces.ed.gov/ipeds/datacenter/Data.aspx
Data retrieved August 9, 2016.
NotesThe undergraduate fi nancial aid reported refl ects awards to undergraduate students enrolled in the fall semester of the academic year. The university
awards fi nancial aid on a continuous basis throughout the academic year. However, this data refl ects a specifi c point and time as defi ned by IPEDS
http://nces.ed.gov/ipeds/datacenter and the Common Data Set (www.commondataset.org), generally accepted as the 15th day of fall semester.
For fi nancial aid calculations; full-time undergraduate, graduate and law students are those enrolled for 12 or more credit hours. Part-time
undergraduate students are enrolled for 11 or fewer credit hours. Part-time graduate and law student enrollment ranges from 6 to 11 credit hours.
The “Cost of Attendance” tables refl ect the estimated average cost of attendance for a full-time, in-state student attending CSU for two (2) semesters
during the academic year, and includes estimated tuition and fee charges, books, allowances for room and board, transportation and personal/
miscellaneous.
Types of Financial AidFederal Grants: Pell Grant, Supplemental Opportunity Educational Grant (SEOG). TEACH Grant.
State Grants for Undergraduates: Ohio College Opportunity Grant (OCOG) and Other State tuition grant programs.
State Aid for Graduate/Law Students: Graduate and Professional Fellowship.
Scholarship/Institutional Grants for Undergraduates: Refer to http://www.csuohio.edu/enrollmentservices/fi nancialaid/scholarships.
Scholarship/Institutional Grants for Graduate/Law Students: Includes Graduate Assistantships, Tuition Waiver and Scholarships.
Non-Institutional Aid: Assistance awarded from external agencies.
Federal Student Loans: Stafford subsidized/unsubsidized and Federal Perkins loans.
FWS: A federally-funded student employment program established to assist students through part-time, on-campus positions or off-campus
community service positions.
Financial Aid Offi ce

179Section 8 - Selected Administrative Centers, Departments & Offi ces
SEC
TIO
N
8
Center for International Services & Programs
International ServicesThe Center for International Services & Programs (CISP) seeks to build a globally oriented, metropolitan university community where students, faculty
and staff gain and share international knowledge and experience. Established in 1996 as a separate university entity and now a part of the Offi ce of
the Provost, the Center provides CSU international students and visitors with a wide array of support services to help them achieve a positive learning
experience while in the United States and Ohio. A second focus of the Center is supporting and facilitating education abroad opportunities for CSU
students. This is accomplished by supporting Faculty-led (short term) courses and programs, assisting students in identifying education abroad options,
administering scholarships and other related education abroad initiatives. A third area of focus is to facilitate, develop, and support international academic
initiatives within each department and college, including faculty Fulbright Program participation. A full description of Center services and programs can
be found at: http://www.csuohio.edu/offi ces/international
Table 8.20: CSU Fulbright Scholar Awards 1973-2016
Center for International Services & Programs
Year Scholar Countries/Regions Visited
1973-1989 14 1990-1991 1 Portugal1992-1993 2 Hungary, Czechoslovakia1993-1994 3 India, Ethiopia, China1994-1995 2 Salvador, Ethiopia1995-1996 1 China1997-1998 4 Kenya, Nigeria, Japan, Lithuania1998-1999 5 Kenya, Nigeria, Russia, Germany, Norway1999-2000 4 Kyrgyzstan, India, Germany2000-2001 3 Sri Lanka, Germany, Brazil2001-2002 1 Israel2002-2003 6 Botswana, Zambia, Uganda, India, Nepal, Russia2003-2004 4 Croatia, Guatemala, South Africa2004-2005 2 Bulgaria, United Arab Emirates2005-2006 6 Morocco, South Africa, Zambia, Latvia, Taiwan2006-2007 1 Kyrgyzstan2007-2008 2 Nepal, Sri Lanka2008-2009 4 Argentina, Chile, Nepal, Slovakia2009-2010 2 Australia, Nigeria2010-2011 7 Costa Rica, Finland, India, Kenya, Taiwan, Turkey2011-2012 2 Columbia, Turkey2012-2013 6 Azerbaijan, South Africa, Montenegro, India, Taiwan, Turkey2013-2014 1 Israel2014-2015 3 Switzerland, India, Jordan2015-2016 1 United Kingdom 2016-2017 1 TurkeyTotal 88
Source: Center for International Services & Programs
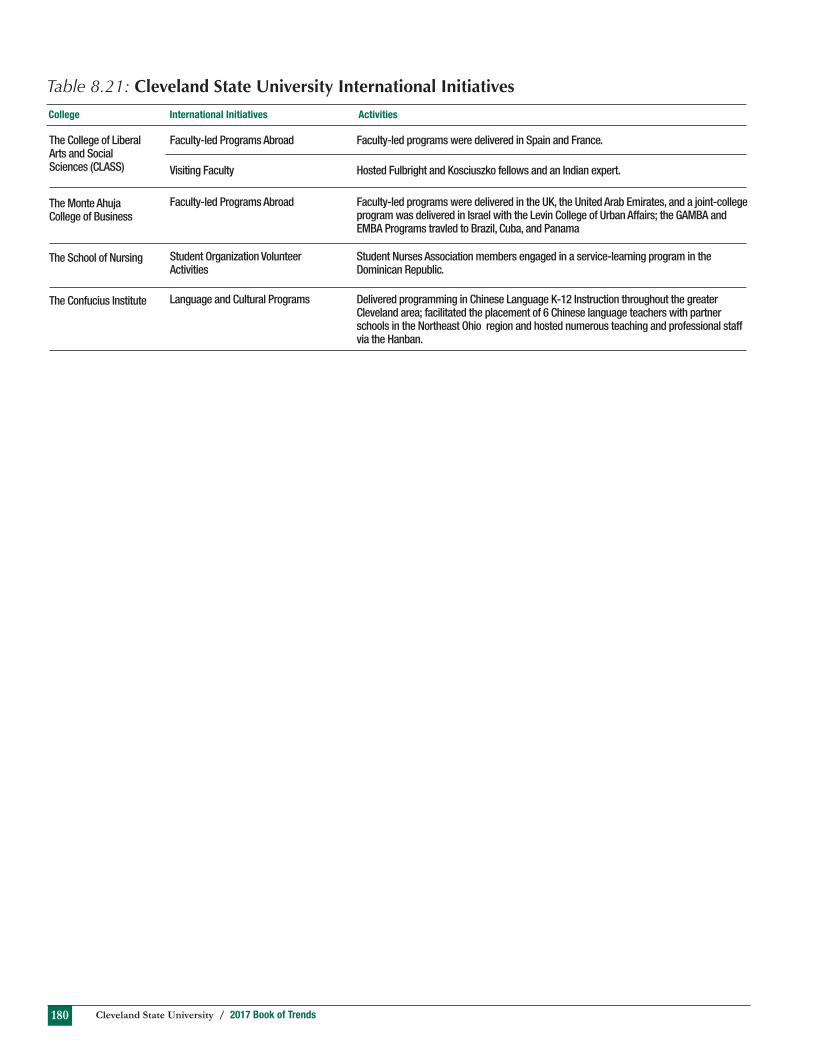
Cleveland State University / 2017 Book of Trends180
College International Initiatives Activities
Table 8.21: Cleveland State University International Initiatives
The College of Liberal Arts and Social Sciences (CLASS)
Faculty-led Programs Abroad Faculty-led programs were delivered in Spain and France.
The Monte Ahuja College of Business
Faculty-led Programs Abroad Faculty-led programs were delivered in the UK, the United Arab Emirates, and a joint-college program was delivered in Israel with the Levin College of Urban Affairs; the GAMBA and EMBA Programs travled to Brazil, Cuba, and Panama
Visiting Faculty Hosted Fulbright and Kosciuszko fellows and an Indian expert.
The School of Nursing Student Organization Volunteer Activities
Student Nurses Association members engaged in a service-learning program in the Dominican Republic.
The Confucius Institute Language and Cultural Programs Delivered programming in Chinese Language K-12 Instruction throughout the greater Cleveland area; facilitated the placement of 6 Chinese language teachers with partner schools in the Northeast Ohio region and hosted numerous teaching and professional staff via the Hanban.

181Section 8 - Selected Administrative Centers, Departments & Offi ces
SEC
TIO
N
8
Table 8.22: Study Abroad Student Headcount by Academic Year (Summer, Fall & Spring) and Program Type
Percent Change
Program Type 2012-13 2013-14 2014-15 2015-16 2016-17 1 year 5 year
Faculty Led 168 171 111 60 79 32% -53%Exchange 3 5 4 4 4 0% 33%Internship 4 1 4 3 1 -67% -75%Independent 18 21 24 37 31 -16% 72%Total 193 198 143 104 115 11% -40%
Table 8.23: Study Abroad Student Headcount by Academic Year (Summer, Fall & Spring) and College
Percent Change
College 2012-13 2013-14 2014-15 2015-16 2016-17 1 year 5 year
Business 122 133 93 54 61 13% -50%CLASS 51 43 36 29 34 17% -33%Science 17 16 11 12 8 -33% -53%Education 4 3 1 2 - -100% -100%Engineering 2 4 3 6 6 0% 200%Urban 2 - 2 4 10 150% 400%Law - 1 - - - - -TOTAL 198 200 146 107 119 11% -40% Note: Includes duplicate counts for students who were double majors across two different colleges.
Table 8.24: Study Abroad Student Headcount by Academic Year (Summer, Fall & Spring) and Course Level
Percent Change
Course Level 2012-13 2013-14 2014-15 2015-16 2016-17 1 year 5 year
Undergraduate 114 99 75 68 88 29% -23%Graduate 79 98 67 36 27 -25% -66%Law 0 1 0 - - - -TOTAL 193 198 142 104 115 11% -40%Source: Center for International Services & Programs
Center for International Services & Programs
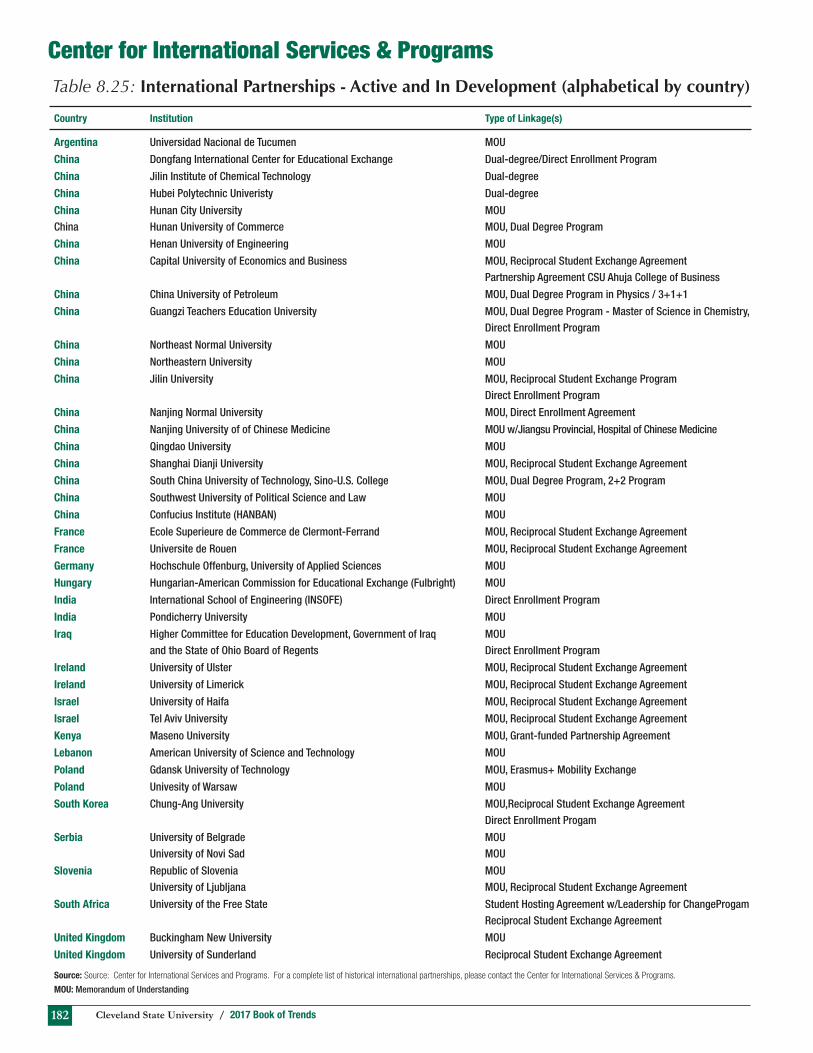
Cleveland State University / 2017 Book of Trends182
Country Institution Type of Linkage(s)
Argentina Universidad Nacional de Tucumen MOU
China Dongfang International Center for Educational Exchange Dual-degree/Direct Enrollment Program
China Jilin Institute of Chemical Technology Dual-degree
China Hubei Polytechnic Univeristy Dual-degree
China Hunan City University MOU China Hunan University of Commerce MOU, Dual Degree Program
China Henan University of Engineering MOU
China Capital University of Economics and Business MOU, Reciprocal Student Exchange Agreement Partnership Agreement CSU Ahuja College of Business
China China University of Petroleum MOU, Dual Degree Program in Physics / 3+1+1
China Guangzi Teachers Education University MOU, Dual Degree Program - Master of Science in Chemistry, Direct Enrollment Program
China Northeast Normal University MOU
China Northeastern University MOU
China Jilin University MOU, Reciprocal Student Exchange Program Direct Enrollment Program
China Nanjing Normal University MOU, Direct Enrollment Agreement
China Nanjing University of of Chinese Medicine MOU w/Jiangsu Provincial, Hospital of Chinese Medicine
China Qingdao University MOU
China Shanghai Dianji University MOU, Reciprocal Student Exchange Agreement
China South China University of Technology, Sino-U.S. College MOU, Dual Degree Program, 2+2 Program
China Southwest University of Political Science and Law MOU
China Confucius Institute (HANBAN) MOU
France Ecole Superieure de Commerce de Clermont-Ferrand MOU, Reciprocal Student Exchange Agreement
France Universite de Rouen MOU, Reciprocal Student Exchange Agreement
Germany Hochschule Offenburg, University of Applied Sciences MOU
Hungary Hungarian-American Commission for Educational Exchange (Fulbright) MOU
India International School of Engineering (INSOFE) Direct Enrollment Program
India Pondicherry University MOU
Iraq Higher Committee for Education Development, Government of Iraq MOU and the State of Ohio Board of Regents Direct Enrollment Program
Ireland University of Ulster MOU, Reciprocal Student Exchange Agreement
Ireland University of Limerick MOU, Reciprocal Student Exchange Agreement
Israel University of Haifa MOU, Reciprocal Student Exchange Agreement
Israel Tel Aviv University MOU, Reciprocal Student Exchange Agreement
Kenya Maseno University MOU, Grant-funded Partnership Agreement
Lebanon American University of Science and Technology MOU
Poland Gdansk University of Technology MOU, Erasmus+ Mobility Exchange
Poland Univesity of Warsaw MOU
South Korea Chung-Ang University MOU,Reciprocal Student Exchange Agreement Direct Enrollment Progam
Serbia University of Belgrade MOU University of Novi Sad MOU
Slovenia Republic of Slovenia MOU University of Ljubljana MOU, Reciprocal Student Exchange Agreement
South Africa University of the Free State Student Hosting Agreement w/Leadership for ChangeProgam Reciprocal Student Exchange Agreement
United Kingdom Buckingham New University MOU
United Kingdom University of Sunderland Reciprocal Student Exchange Agreement
Source: Source: Center for International Services and Programs. For a complete list of historical international partnerships, please contact the Center for International Services & Programs.
MOU: Memorandum of Understanding
Table 8.25: International Partnerships - Active and In Development (alphabetical by country)
Center for International Services & Programs

183Section 8 - Selected Administrative Centers, Departments & Offi ces
SEC
TIO
N
8
Offi ce of the University Architect
Notes Building Code Building Year Acquired Total Gross Square Feet
AA Advance Manufacturing Annex 1993 8,213 AC Parker Hannifi n Administration Center 2007 37,610[3], [5], [8] AG Art Gallery 2012 17,519 BU Business College 1998 126,245[5] CE Cole Center *CMSD Campus International School 1990 56,653 CG Central Garage 1979 269,594[5] CM Magnet Building (Magnet, Ceramics & Scuplture) 1994 82,470 CS Campus Safety 2004 25,056[3], [5], [7] EC Euclid Commons Complex Buildings 1-4 2010 225,811 EG East Garage 2006 124,300[2], [4], [6] FH Fenn Hall 1964 195,779 FL Field Locker Building 1985 2,194 FS Field Service Building 1985 1,305 FT Fenn Tower 1964 188,746 HS Health Sciences 1998 23,654[2] IM Center for Innovations in Medical Professions 2015 103,295 JH Julka Hall 2010 104,747 KF Krensler Field Dome (up only Oct. to Mar. - inactive on capture date) 96,077[5] LA Langston Court 2012 NA[2] LB Law Building 1977 118,438[2] LL Law Library 1997 111,870[3], [5], [8] MB Middough Building 2011 303,845 MC Main Classroom Building 1970 386,489[2] MM Mather Mansion 1967 43,938[4] MU Music & Communication Building 1988 151,533 PA Plant Annex Building 1985 8,579 PE Physical Education 1973 201,860[3], [7] PG Prospect Garage 2010 97,489 PH Parker Hannifi n Hall 1984 27,252 PS Plant Services 1970 134,590 RC Recreation Center 2006 135,167 RT Rhodes Tower 1971 493,968[1], [5] RW Rhodes West * CMSD STEMM High School ---[2] SC Student Center 2010 160,677[3], [7] SG South Garage 2010 208,000[4] SI Science Building 1969 171,242[2] SR Science and Research Center 1978 142,479[11] ST Stephanie Tubbs Jones Transit Center 2010 NA TD Tennis Dome 2016 42,430[3], [5], [9] UN Union Building 2011 84,688 UR Urban College 2000 87,792 WA Wallingford 2008 8,916 WG University West Garage 1996 199,599[5], [2] WO Wolstein Center 1989 289,000[3], [5] WST West Center Campus Extension 2003 9,607 Grand Total 5,308,716
Table 8.26 Cleveland State University Fall 2016 Building Inventory
Notes:
[1] RW - Rhodes West designation is used for way fi nding.
This space is included in Rhodes Tower totals.
[2] Construction/Renovation/ Vacancy - FY 17
[3] Leased spaces
[4] Some Vacancy- Planned Demolition FY 18
[5] Includes Some Non-Institutional Uses
[6] Building Name Change
[7] Owned by Euclid Avenue Housing Development Corporation
[8] Owned by Playhouse Square Development Corporation
[9] Owned by Liberty Development Corporation
[10] Owned by Trinity Diocese
[11] Owned by RTA Regional Transit Authority
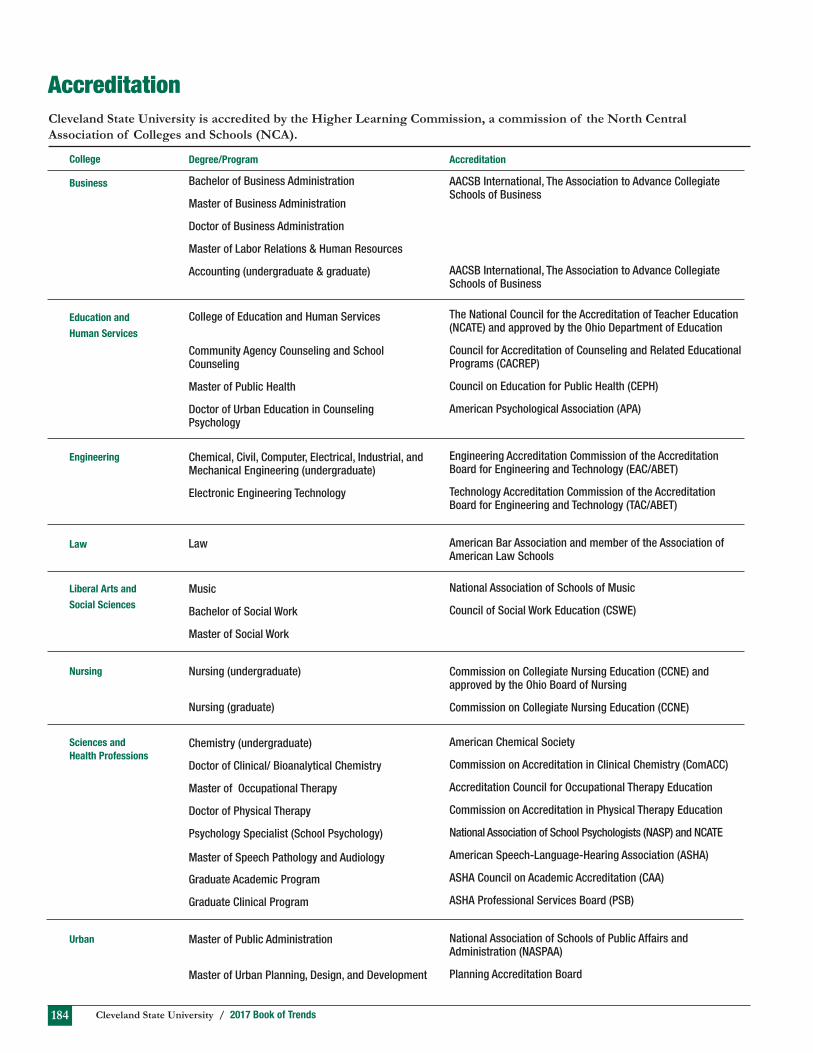
Cleveland State University / 2017 Book of Trends184
AccreditationCleveland State University is accredited by the Higher Learning Commission, a commission of the North Central Association of Colleges and Schools (NCA).
College
Business
Education and
Human Services
Engineering
Law
Liberal Arts and
Social Sciences
Nursing
Sciences and
Health Professions
Urban
Bachelor of Business Administration
Master of Business Administration
Doctor of Business Administration
Master of Labor Relations & Human Resources
Accounting (undergraduate & graduate)
College of Education and Human Services
Community Agency Counseling and School Counseling
Master of Public Health
Doctor of Urban Education in Counseling Psychology
Chemical, Civil, Computer, Electrical, Industrial, and Mechanical Engineering (undergraduate)
Electronic Engineering Technology
Law
Music
Bachelor of Social Work
Master of Social Work
Nursing (undergraduate)
Nursing (graduate)
Chemistry (undergraduate)
Doctor of Clinical/ Bioanalytical Chemistry
Master of Occupational Therapy
Doctor of Physical Therapy
Psychology Specialist (School Psychology)
Master of Speech Pathology and Audiology
Graduate Academic Program
Graduate Clinical Program
Master of Public Administration
Master of Urban Planning, Design, and Development
AACSB International, The Association to Advance Collegiate Schools of Business
AACSB International, The Association to Advance Collegiate Schools of Business
The National Council for the Accreditation of Teacher Education (NCATE) and approved by the Ohio Department of Education
Council for Accreditation of Counseling and Related Educational Programs (CACREP)
Council on Education for Public Health (CEPH)
American Psychological Association (APA)
Engineering Accreditation Commission of the Accreditation Board for Engineering and Technology (EAC/ABET)
Technology Accreditation Commission of the Accreditation Board for Engineering and Technology (TAC/ABET)
American Bar Association and member of the Association of American Law Schools
National Association of Schools of Music
Council of Social Work Education (CSWE)
Commission on Collegiate Nursing Education (CCNE) and approved by the Ohio Board of Nursing
Commission on Collegiate Nursing Education (CCNE)
American Chemical Society
Commission on Accreditation in Clinical Chemistry (ComACC)
Accreditation Council for Occupational Therapy Education
Commission on Accreditation in Physical Therapy Education
National Association of School Psychologists (NASP) and NCATE
American Speech-Language-Hearing Association (ASHA)
ASHA Council on Academic Accreditation (CAA)
ASHA Professional Services Board (PSB)
National Association of Schools of Public Affairs and Administration (NASPAA)
Planning Accreditation Board
Degree/Program Accreditation

185Section 8 - Selected Administrative Centers, Departments & Offi ces
SEC
TIO
N
8
List of College Acronyms and Abbreviations
Monte Ahuja College of Business Administration: College of Business, Business, Bus
College of Education and Human Services: COEHS, College of Education, Education, Edu
Washkewicz College of Engineering: College of Engineering, Engineering, Egr
College of Graduate Studies: Graduate Studies
Cleveland-Marshall College of Law: Law
College of Liberal Arts and Social Sciences: CLASS
School of Nursing: Nursing
College of Sciences and Health Professions: COSHP, Science
Maxine Goodman Levin College of Urban Affairs: College of Urban Aff airs, Urban Aff airs, Urban
Other Acronyms and Abbreviations
CIP: Classifi cation of Instructional Program
EEO6: Equal Employment Opportunity
FTE: Full-Time Equivalent (Student Credit Hour/15)
GPA: Grade Point Average
IPEDS: Integrated Postsecondary Education Data System
N/A: Not applicable or Not available
OBOR: Ohio Board of Regents
SCH: Student Credit Hour
Cleveland State University / 2017 Book of Trends186
Book of Trends 2017http://www.csuohio.edu/offi ces/iraa/OnlineBookOfTrends.html
The Book of Trends (BOT) 2017 represents the continuing commitment of the Offi ce of Institutional Research and Analysis (IRA) to present updated information about Cleveland State University (CSU). A variety of tables and charts provide trend information over a fi ve-year period as well as some key attributes and characteristics of the University for the most recently completed academic year.
The purpose of this publication is to provide readers with frequently requested statistical information used in planning, reporting, and assessment. In order to serve the campus community more effectively, we welcome suggestions and comments.
1. The student information presented in the Book of Trends 2017 is based on the Semester Census fi les used for Ohio Board of Regents (OBOR) reports unless specifi cally noted from a different data source.
2. The various Deans’ offi ces provided IRA with a set of grant/highlight information used to produce Table 4.13. IRA limited these selections in order to meet space requirements. This table is not intended to be a comprehensive listing, but merely to refl ect some of the interesting activities of our faculty, staff and students.
3. Each year we attempt to provide comparative data to other colleges and universities in Ohio. These comparisons are typically centered on information available from the Ohio Board of Regents’ Higher Education Information System (HEI) https://www.ohiohigheredjobs.org/hei. At the time of publication a few of the tables normally presented here were not available due to some schools updating prior years’ data, or changes to the HEI system. Please be aware that the HEI tables presented in this year’s book represent various states of completion:a. The data may be complete for the reporting year and can be used accordingly.b. The data may be complete for most institutions, but a few may be unfi nalized, in which case only fi nalized ones are reported or
in some cases unfi nalized numbers are included but footnoted as such.c. In some cases many schools had unfi nalized the type of data being reviewed and in those cases we have simply reproduced the
prior year’s data with appropriate titles and footnotes.Note: Based on feedback received from the campus community, we have removed some selected tables from the Book of Trends. If you require data from any of these missing tables, please contact our offi ce and we can provide you with the requisite information.
Please direct questions and/or suggestions to 216-687-4700. The entire Book of Trends series is available online on the IRA website (http://www.csuohio.edu/offi ces/iraa/bot/bookoftrends.html).
We encourage you to reference the web version of the Book of Trends because we can easily make changes/updates if necessary. By the same token, if a URL is provided in the book such as the ones linked to Research Centers & Institutes, the Ohio Board of Regents, etc., we encourage you to refer to the linked site for the most up-to-date information.
We would like to take this opportunity to thank all members of the campus community for their support and contributions to this publication.
Offi ce of Institutional Research and Analysis

Notes

Notes


Affi rmative Action StatementCleveland State University is committed to the principle of
equal opportunity in employment and education. No person
at the university will be denied opportunity for employment
or education or be subject to discrimination in any project,
program, or activity because of race, color, religion, national
origin, sex, age, genetic information, sexual orientation,
disability, disabled veteran, Vietnam-era veteran or other
protected veteran status.