BOSNIA AND CROATIA MACEDONIA MONTENEGRO SERBIA … · 2019-09-25 · CROATIA MACEDONIA MONTENEGRO...
44
BOSNIA AND HERZEGOVINA C ROATIA MA C EDONIA MONTENE GRO S ERBI A S LOVENIA SEEA is an international organization with the aim to: promote economic research in Southeastern Europe; foster networking and regional cooperation among the member institutes; develop joint research SURJUDPV RUJDQL]H MRLQW VFLHQWLĆF conferences, round tables and meetings on a national level. REAL GDP GROWTH PROJECTIONS FOR SEE-6, EU-9* AND EU-28 CONTENT 2 BOSNIA AND HERZEGOVINA Strong economic growth despite stagnation in the EU accession process 8 CROATIA Positive economic trends continued in 2017 and expected to prevail in 2018 14 MACEDONIA On the road to economic recovery 20 MONTENEGRO Became the 29 th Member State of the NATO 26 SERBIA Competitive position improved as a result of a more favorable macroeconomic and business environment 32 SLOVENIA Continuing the economic growth, waiting for sustainability 38 ANALYSIS The national competitiveness and labor market HIĆFLHQF\ LQ 6(( countries Economic Outlook SEE-6 Vol. 4 No. 1 March 2018 e-ISSN 1849-8884 ISSN 1849-8817 Source: European Economic Forecast, European Commission, Winter 2018 and authors for SEE-6. Note: * EU-9 include Bulgaria, Czech Republic, Estonia, Hungary, Latvia, Lithuania, Poland, Romania and Slovakia. Macedonia Montenegro Slovenia Bosnia and Herzegovina Croatia Serbia EU-9 EU-28 % change, yoy 2018 2017 4.5 4.0 3.5 3.0 2.5 2.0 1.5 1.0 0.5 0
Transcript of BOSNIA AND CROATIA MACEDONIA MONTENEGRO SERBIA … · 2019-09-25 · CROATIA MACEDONIA MONTENEGRO...

B O S N I A A N D H E R Z E G O V I N A
C R O AT I A M A C E D O N I A M O N T E N E G R O S E R B I A S LO V E N I A
SEEA is an international
organization with the aim to:
promote economic research in
Southeastern Europe; foster
networking and regional
cooperation among the member
institutes; develop joint research
conferences, round tables and
meetings on a national level.
REAL GDP GROWTH PROJECTIONS FOR SEE-6, EU-9* AND EU-28
C O N T E N T
2BOSNIA AND HERZEGOVINA
Strong economic growth despite stagnation in the EUaccession process
8
CROATIA
Positive economic trends continued in2017 and expectedto prevail in 2018
14 MACEDONIA
On the roadto economicrecovery
20 MONTENEGRO
Became the 29th
Member Stateof the NATO
26 SERBIA
Competitive positionimproved as a result of a more favorable macroeconomic and business environment
32
SLOVENIA
Continuing the economic growth,waiting forsustainability
38 ANALYSIS
The national competitiveness and labor market
countries
Economic OutlookSEE-6
Vol. 4 No. 1 March 2018 e-ISSN 1849-8884 ISSN 1849-8817
Source: European Economic Forecast, European Commission, Winter 2018 and authors for SEE-6.
Note: * EU-9 include Bulgaria, Czech Republic, Estonia, Hungary, Latvia, Lithuania, Poland, Romania and Slovakia.
Macedonia Montenegro SloveniaBosnia andHerzegovina
Croatia Serbia EU-9EU-28
% change, yoy
2018
20174.5
4.0
3.5
3.0
2.5
2.0
1.5
1.0
0.5
0

2
Strong economicgrowth despite stagnation in the EUaccession process
Recent economic developments
At the end of 2016, BiH received a European Commission Questionnaire,
and thus the process of preparing an opinion on Bosnia and Herzegovina’s EU
membership application (which was submitted to the Council of the European
2017, representatives of the authorities in BiH did not answer questions from
the Questionnaire. In this way, the deadline set by the European Commission
Questionnaire is a basic condition for applying for candidate status in the
European Union, so delay in answering questions from the questionnaire
means slowing down of the EU accession process.
BiH could also face the slowdown in socio-economic reforms, as the parliament
did not adopt the amendments to the law on excise tax and the new law on
authorities’ program, supported by the IMF under the Extended Fund Facility
(EFF) signed on September 7, 2016, when the IMF’s Executive Board approved
B O S N I A A N D H E R Z E G O V I N A
C R O AT I A M A C E D O N I A M O N T E N E G R O S E R B I A S LO V E N I A
BOSNIA ANDHERZEGOVINA
Slowing down of the EU accession process

3
a three-year extended arrangement under the EFF with BiH for an amount
of about €563.3 million to support the country’s economic reform agenda.
The end of 2016 and the beginning of 2017 were marked by strong economic
improvement compared to the average for 2011-2015 when growth rate was
only 1.5%. A similar trend of growth, with a rate of 3.0%, is continued in the
and exports, while at the same time the investments had a negative trend. In
exports increased by as much as 9.4%. At the same time, investments fell by
9.4%. Positive economic trends in the surrounding countries are the main
causes of a high growth in exports and hence of economic growth.
Downward trend of unemployment rates in 2016 and early 2017 is characteristic
for all EU and SEE countries. Decline of the unemployment rate was recorded
in BiH in 2016, by 2.3 percentage points compared to 2015. Unfortunately, the
Agency for Statistics of Bosnia and Herzegovina does not provide quarterly
trends in 2017. However, according to data for 2016, BiH had the highest
2017, employment increased by 2.5%. This growth is largely due to growth
of employment in three sectors: manufacturing (4.5%), provision of food and
catering (5.2%), and arts, entertainment and recreation (7.4%).
of 2017, revenues grew at a rate of 6.7%, while expenditures increased by
Strong economic growth dri en nal
consumption and exports
Employment growth and a slight decline in
unemployment
Budget surplus and
unchanged government public debt

4
just 0.8% compared to the same period in 2016. Revenue growth is largely
the result of an increase in revenues from direct and indirect taxes. Indirect
taxes increased by 3.2% compared to the same period in 2016, within which
the highest growth rates were in customs duties (12.2%) and excises (8.6%),
while direct taxes increased by as much as 9.4%. In the same period, public
government debt remained virtually unchanged and amounted to about 6
increase in external debt by 1.8%, while the internal debt was reduced by 0.9%.
in energy prices on the world market, primarily prices of oil and natural gas.
As a consequence, there was a rise in prices in the transport sector (7.5%). In
addition, an increase in the prices of alcoholic beverages and tobacco was also
in lending activity. Total loans increased by 4.8% compared to the same period
in 2016. Corporate loans grew at a slightly higher rate (6% yoy) than loans
for households (5.3% yoy). At the same time, loans to the government had a
negative growth rate (-0.6% yoy).
favorable external environment and increase in domestic demand are the
of 2017 exports increased by 15.3% and imports by 11.2% compared to the
same period in 2016. The increase in exports was contributed by the growth
of the manufacturing industry, which is mainly export oriented. However, due
compared to the same period in 2016. At the same time, the current account
half of 2016, when these investments amounted to about 111 million euros.
ow in ation and a signi cant increase in
credit activity
High growth of foreign trade and increase in
foreign direct investment
B O S N I A A N D H E R Z E G O V I N A
C R O AT I A M A C E D O N I A M O N T E N E G R O S E R B I A S LO V E N I A

5
Table BH1 Main economic indicators
2015 2016 2017
Q4 Q1 Q2 Q3
ECONOMIC ACTIVITY
Real GDP (% change, yoy) 2.8 3.5 3.2 2.9 2.9
Real private consumption (% change, yoy) 1.9 2.8 1.5 1.5 2.0
Real government consumption (% change, yoy) 1.0 1.4 1.9 1.8 1.3
Industrial output (% change, yoy) 2.6 5.7 2.3 2.1 5.8
Unemployment rate (registered, %, pa) 27.7 25.4 - - -
Nominal GDP (EUR million) 14,361 3,782 3,527 4,047 4,465
GDP per capita (EUR) 3,752 990 923 1,057 1,168
PRICES, WAGES, AND EXCHANGE RATES
1.1 2.4 1.3 3.1 2.6
Consumer prices (% change, yoy, pa) -1.0 -0.4 1.1 1.2 1.1
Producer prices (% change, yoy, pa) 0.6 -0.8 2.8 2.4 2.4
Average gross wage (% change, yoy, pa) 1.0 1.7 1.5 1.9 1.5
Exchange rate, BAM/EUR (pa) 1.96 1.96 1.96 1.96 1.96
Exchange rate, BAM/USD (pa) 1.76 1.81 1.83 1.78 1.66
FOREIGN TRADE AND CAPITAL FLOWS
Exports of goods (EUR million) 5,070 1,411 1,316 1,548 1,744
Exports of goods (EUR, % change, yoy) 3.2 13.2 16.9 13.8 17.1
Imports of goods (EUR million) 7.823 2.128 1.933 2.267 2.383
Imports of goods (EUR, % change, yoy) -2.3 7.9 12.3 10.2 13.0
Current account balance (EUR million) -828 -210 -165 -242 -129
Current account balance (% of GDP) -5.7 -5.5 -4.6 -5.9 -2.9
Gross foreign direct investment (EUR million) 221 69 145 42 83
Foreign exchange reserves (EUR million, eop) 4,413 4,887 4,739 4,854 5,230
Foreign debt (EUR million, eop) 8,238 7,911 - - -
GOVERNMENT FINANCE*
Revenue (national currency)** 10,744 11,084 2,646 5,567 8,729
Expense (national currency)** 10,364 10,382 2,376 4,921 7,544
Net = Gross operating balance (BAM million)** 380 702 270 646 1,185
239 364 30 100 131
Net lending/borrowing (national currency)** -399 354 240 546 1,053
Domestic government debt (EUR million, eop) 1,664 958 992 960 838
Foreign government debt (EUR million, eop) 4,438 5,257 5,214 5,100 5,084
Total government debt (% of GDP) 30.9 34.9 - - -
MONETARY INDICATORS
Narrow money, M1 (% change, yoy, eop) 11.2 13.6 13.9 14.8 13.9
Broad money, M2 (% change, yoy, eop) 8.0 8.3 9.3 10.2 9.8
Total domestic credit (% change, yoy, eop) 2.4 1.9 3.8 5.8 6.4
DMBs credit to households (% change, yoy, eop) 4.8 3.7 4.6 6.0 6.7
DMBs credit to enterprises (% change, yoy, eop) -0.2 3.8 5.2 6.8 7.8
DMBs credit rate for enterprises, short-term, (%, pa) 6.3 6.0 5.6 5.4 5.3
DMBs credit rate for households, short-term (%, pa) 7.4 8.1 7.0 7.4 5.9
Notes: * Data refer to consolidated general government. ** On the cash principle, cumulative from the beginning of the year.
Conventional abbreviations: pa – period average; eop – end of period; yoy – year on year; EUR – euro, USD – U.S. dollar; BAM – Bosnia-Herzegovina convertiblemark; DMB – deposit money bank.
Sources: Agency for Statistics of Bosnia and Herzegovina, Bosnia and Herzegovina Directorate for Economic Planning, Bosnia and Herzegovina Indirect TaxationAuthority, Central Bank of Bosnia and Herzegovina.

6
Policy assumptions and projections summary
The external environment over the previous years was the main structural
determinant of economic trends in BiH. In line with this, the assumptions for
2018 are based on projections of favorable economic opportunities in the
allow the continued implementation of the arrangement with the IMF. In the
second half of 2017, a high level of business activity is expected to continue
in BiH, which according to projections at the end of the year should result in
real GDP growth of 3.4%. The key generators of this economic growth should
be real exports growth of 9.1% and growth in domestic demand of 2.3%.
Expected export growth with a better business environment and generally
higher optimism related to the implementation of the arrangement with the
IMF could lead to a slight growth in private investment at a real rate of 6.9%
in 2018. The above mentioned accompanied by the strong growth of public
bearers of the projected economic growth of 3.4% in 2018 and 3.8% in 2019.
Positive developments in EU countries that are the main BiH trading partner
with additional contribution from countries in the region, where economic
growth is also expected to continue, should result in a continuing trend of
growth in foreign trade in BiH. In the period from 2018 to 2019, annual
real growth rates of total exports of 7.1% and 5.5%, respectively, can be
expected. On the other hand, the growth in domestic demand accompanied
by an increase in number of employees and their earnings, and a higher level
of total investment in infrastructure and energy would lead to an increase
B O S N I A A N D H E R Z E G O V I N A
C R O AT I A M A C E D O N I A M O N T E N E G R O S E R B I A S LO V E N I A
Table BH2 Summary of projections
2017 2018 2019
Real GDP (% change) 3.4 3.4 3.8
Real private consumption (% change) 1.6 2.1 2.0
Real investment (% change) 5.8 6.9 10.3
Exports of goods and services (constant prices, % change) 9.1 7.1 4.3
Imports of goods and services (constant prices, % change) 4.7 4.8 4.3
Current account balance (% of GDP) 4.6 4.3 4.3
Consumer prices (% change, pa) 1.1 1.2 1.4
Exchange rate, national currency/EUR (pa) 1.9 1.9 1.9
Unemployment rate (registered, %, pa) 20.5 - -
- - -
Broad money, M4 (% change, eop) - - -
Total domestic credit (% change, eop) 6.0 6.0 6.8
Note: Cut-off date for information used in the compilation of projections was December 20, 2017.
Conventional abbreviations: pa – period average, eop – end of period, EUR – euro.
Sources: BiH Directorate for Economic Planning, World Bank, IMF and author’s projections.
Strengthening economic growth in 2018 and 2019,
mainly due to higher exports and private sector investments

7
in imports. However, import rates are expected to be slightly lower than
export rates, so that the real growth rate of total imports would range
from 4.8% in 2018 to 4.3% in 2019. In 2018 and 2019, BiH is expected to
and food prices on the world market.

8
Positive economictrends continued in2017 and are expectedto prevail in 2018
Recent economic developments
In 2017, economic developments in Croatia were dominated by two
phenomena: solid economic activity underpinned by the favorable global
economic environment and the crisis in Agrokor, the biggest Croatian private
company. Political situation was more stable than in 2016, but still not without
glitches. The HDZ-MOST Government that came into power in October
2016 underwent a reconstruction in April 2017 when the central-right
HDZ replaced its thus-far coalition partner MOST with a central-left HNS
members of MOST, changed the positions of some previous ministers, and
got the Parliament’s support to appoint two ministers and a Deputy Prime
as the Speaker of the Parliament, and MOST became an opposition party.
out of 151 seats. The Government crisis coincided with the crisis in Agrokor.
B O S N I A A N D H E R Z E G O V I N A
C R O AT I A M A C E D O N I A M O N T E N E G R O S E R B I A S LO V E N I A
C R O A T I A
Solid economic activity in spite of political
instability and Agrokor’s corporate crisis

9
well informed about) Agrokor’s crisis, since he was holding a top management
position in Agrokor prior to becoming the Minister of Finance.
In early spring 2017, Agrokor, a corporation whose annual revenues equal 15
percent of Croatia’s GDP, became insolvent. In order to prevent immediate
activation of the bankruptcy procedure provoking thereby huge supplier’s
losses, the Government prepared and passed the new law on “systematically
important companies”. The main intention of the Law was to give the troubled
company some time to restructure before starting a regular bankruptcy
procedure. Agrokor has activated the Law in April, and since then it has been
managed by the extraordinary administration whose main obligation is to
restructure the company and negotiate the partial write-off of obligations
toward its suppliers. The Government claims that there will be no bail-out
of Agrokor at taxpayers’ expenses, but negative effects of the Agrokor crisis
on the economy are inevitable.
The year 2017 will be the third consecutive year with growth rates close
to 3 percent. In the last quarter of 2016, growth has accelerated, and in
to 3.3 percent in the third quarter. Growth was driven by the rising private
and 3.7 percent in second and third quarters. Retail trade has recorded even
percent in the second and third quarters. Investments grew as well, albeit less
vigorously than private consumption. The overall contribution of net exports
exports of services in the third quarter. This can be attributed to yet another
Strong growth of private consumption and
investment; yet another successful tourist season

10
successful tourist season. Until the end of November 2017, the number of
tourist arrivals was 12.8 percent higher than in same period last year, and
the number of overnight stays went up by 8 percent.
Data on the industrial output indicate that growth is more reliant on the
of 2017 the industrial production was 2.3 percent higher than in the same
period last year, and the output in manufacturing was 3.1 percent higher.
Although there is still room for growth in tourism, especially in the continental
part of the country, there are more and more voices warning that Croatia
should not base its economic activity solely on tourism.
According to the Pension Insurance Institute, at the end of November 2017
the number of employed individuals was 29 thousand higher than in the same
period last year. The number of job-seekers declined, however, much more in
the same period. In November 2017, there were 48.6 thousand less jobless
individuals than in the same month last year. As a consequence, the average
down from 15.0 percent in the same period last year. The Online Vacancy
Index (OVI), a monthly index of online job advertisements developed by the
Institute of Economics, Zagreb, indicates a strong recovery of labor demand
in 2017, with a rise in the number of job advertisements by 33.0 percent
when compared with 2016. The demand for workers with a university degree
workers, such as sales assistants, cooks, waiters, and drivers. A part of this
the requirements of the market.
consolidated central Government that stood at 3.3 percent of GDP in 2015
went down to only 0.9 percent. Public debt ratio decreased to 82.9 percent
at the end of 2016, i.e. 2.5 percentage points less than at the end of 2015.
As a consequence, the Council of the European Union closed the Excessive
which is in line with the “Strategy for the Adoption of the Euro in Croatia”
presented in October 2017, in which the Government and the Croatian
National Bank expressed their readiness to meet all the convergence criteria
necessary to adopt the euro.
surplus of more than 4.1 billion kuna, up from 1.3 billion kuna in the same
period last year. In spite of the lower tax burden, total revenues went up by 2
of 2016. There was some increase in expenditures as well, but it totaled only
0.4 billion kuna in the January–September period. In general, the tax reform
implemented at the beginning of 2017 proved to be a step in the right direction,
contributing to the rise in employment, increasing consumer optimism, and
improving the business climate. However, the Government failed to complete
the tax reform according to the plan. Part of the tax reform package was
Rise in employment
and strong decrease in unemployment
The Government remains
committed to scal consolidation
B O S N I A A N D H E R Z E G O V I N A
M A C E D O N I A M O N T E N E G R O S E R B I A S LO V E N I A

11
the introduction of property tax, which was supposed to replace the three
existing recurrent taxes on immovable property levies—communal charge,
tax on holiday houses, and monument annuity. Property tax should have been
implemented at the beginning of 2018, but after a loud public disapproval
lost the opportunity to create the instrument which would allow it to shift
the tax burden from income to capital in the future.
In September 2018, the Parliament adopted the Budget for 2018. It is based
on the expectation of a 2.9 percent growth in real GDP, and foresees an
increase in revenues by 6.1 percent and an increase in expenditures by 3.9
percent. On the level of consolidated general Government, 2018 is expected
push the Government balance in surplus, and the public debt ratio below 70
percent by 2020. Such ambition seems realistic, considering that a Budget
outturn resulted in balance close to surplus already by the end of 2017.
After three consecutive years of decreasing consumer prices, the price
movements reversed in 2017. Overall, in 2017, the consumer prices grew on
average by 1.1 percent in comparison with the previous year. Rise in prices
was mainly fueled by the prices of food, which rose by 2.9 percent on average,
while the contribution of housing, water, electricity, gas, and other fuels was
negative (2.7 percentage points).
Policy assumptions and projections summary
Macroeconomic forecasts for Croatia are prepared by the Institute of
Economics, Zagreb and were previously published in the publication CroatianEconomic Outlook in March 2018. The Institute maintains optimistic projections kwith growth rates of 2.7 in 2018 and 2.6 percent in 2019. However, the
Institute has recently revised the projections for 2018 downwards, since the
high-frequency data for the last quarter of 2017 indicated that the growth
is losing momentum. The underperformance of the economy at the end of
2017 resulted from a modest investment activity, a decrease in industrial
production, and a restrained increase in exports. Gradual deceleration is
projected for 2019 as well.
Private consumption was one of the main drivers of GDP growth in 2017,
which can be attributed to a rise in disposable income after changes in personal
income tax, strong consumer optimism, and an increase in pensions and wages
of the public sector employees. Solid growth in private consumption is foreseen
bring the necessary structural reforms, we remain quite skeptical about it.
Investment activity was weak in 2017, which was not only a consequence
of disrupted business activities in companies related to Agrokor, but also a
result of an overall hesitancy to invest in an unfavorable investment climate.
EU-funded infrastructural investment that might compensate for the slump
Decreasing trend in price movements reversed in
2017
Growth expected to decelerate, but still close to 3 percent in 2018 and
2019

12
B O S N I A A N D H E R Z E G O V I N A
C R O AT I A M A C E D O N I A M O N T E N E G R O S E R B I A S LO V E N I A
Table HR1 Main economic indicators
2015 2016 2017
Q1 Q2 Q3
ECONOMIC ACTIVITY
Real GDP (% change, yoy) 2.3 3.5 2.6 3.0 3.3
Real private consumption (% change, yoy) 1.1 3.7 3.5 3.7 3.7
Real government consumption (% change, yoy) -0.9 2.2 1.5 1.7 2.3
Real investment (% change, yoy) 3.8 5.0 5.4 3.3 3.4
Industrial output (% change, yoy) 2.7 7.1 2.3 1.2 2.9
Unemployment rate (registered, %, pa) 17.4 14.3 15.0 11.9 10.8
Nominal GDP (EUR million) 44,546 11,634 10,676 12,231 13,755
GDP per capita (EUR) 10,596 - - - -
PRICES, WAGES, AND EXCHANGE RATES
0.0 0.0 0.0 1.1 1.9
Consumer prices (% change, yoy, pa) -0,5 -0.2 1.1 1.1 1.0
Producer prices (% change, yoy, pa) -3.8 -1.8 2.1 1.8 1.9
Average gross wage (% change, yoy, pa)* 1.3 1.7 2.9 3.8 4.4
Exchange rate, HRK/EUR (pa) 7.61 7.52 7.47 7.43 7.42
Exchange rate, HRK/USD (pa) 6.86 6.96 7.02 6.76 6.32
FOREIGN TRADE AND CAPITAL FLOWS
Exports of goods (EUR million) 11,528 3,425 3,274 3,460 3,415
Exports of goods (EUR, % change, yoy) 11.2 14.1 25.4 8.8 12.9
Imports of goods (EUR million) 18,483 5,151 5,226 5,651 5,595
Imports of goods (EUR, % change, yoy) 7.9 11.5 17.0 10.4 12.4
Current account balance (EUR million) 2,019 -682 -1,529 154 3,868
Current account balance (% of GDP) 4.5 -5.9 -14.3 1.3 28.1
Gross foreign direct investment (EUR million) 189 321 470 206 610
Foreign exchange reserves (EUR million, eop) 13,707 13,514 16,072 14,028 14,954
Foreign debt (EUR million, eop) 45,384 41,668 43,865 40,240 39,382
GOVERNMENT FINANCE**
Revenue (HRK million)*** 150,089 40,083 35,755 42,266 42,577
Expense (HRK million)*** 150,559 40,893 36,862 38,387 36,947
Net = Gross operating balance (HRK million)*** -470 -810 -1,107 3,880 5,630
7,849 3,268 1,091 1,618 1,572
Net lending/borrowing (HRK million)*** -8,320 -4,077 -2,198 2,262 4,058
Domestic government debt (EUR million, eop) 23,281 2,894 25,054 24,443 24,869
Foreign government debt (EUR million, eop) 16,037 14,354 15,297 13,873 14,026
Total government debt (eop, % of GDP) 85.4 - - - -
MONETARY INDICATORS
Narrow money, M1 (% change, yoy, eop) 11.4 18.1 21.1 18.1 20.1
Broad money, M4 (% change, yoy, eop) 5.2 4.7 3.8 2.9 3.3
Total domestic credit (% change, yoy, eop) -2.0 -6.0 -3.4 -3.2 -1.9
DMBs credit to households (% change, yoy, eop) -1.5 -5.5 -0.9 -0.8 0.4
DMBs credit to enterprises (% change, yoy, eop) -5.2 -2.5 -4.1 -2.0 0.3
Money market interest rate (%, pa) 0.8 0.6 0.4 0.5 0.4
DMBs credit rate for enterprises, short-term, (%, pa)**** 8.9 7.9 7.8 7.7 7.4
DMBs credit rate for households, short-term (%, pa)**** 5.4 4.5 4.6 4.5 4.4
Notes: * Break in time series; data for 2016 and 2017 are gathered by processing data submitted in the reports on income, income taxes, and social security contributions;** data refer to consolidated general Government; *** on the cash principle; **** the weighted average interest rate on new loan agreements, revised data.
Conventional abbreviations: pa – period average, eop – end of period, yoy – year on year, HRK – Croatian kuna, EUR – euro, USD – U.S. dollar, DMB – deposit money bank.
Sources: Croatian Bureau of Statistics, Croatian National Bank, and Ministry of Finance.

13
in private investment activity materialized to a less-than-expected extent,
revealing different structural weaknesses and a lack of capacity in the public
sector. Still, since the Government recently cut some of the red tape and
resume at rates of 3.9 percent in 2018, and 4.3 percent in 2019.
Next two years are expected to be the years of lively international activity.
Exports are supposed to grow by 5.6 and 5.3 percent, respectively, thanks
to good tourist seasons and a favorable economic situation with our main
trading partners. Due to the rise in private consumption, the imports might
grow at even higher rates, i.e., 7.4 percent in 2018 and 7.5 percent in 2019.
Current account balance is expected to decrease in comparison with previous
years, and reach 1.4 percent in 2018 and 0.6 percent in 2019.
The Institute assumes that the Government will stick to its plan to balance
the Budget in 2017 and enter the surplus in 2018. Although it forecasts the
outturn might even be better. A surplus is projected for both 2018 and 2019,
reaching 0.2 and 0.5 percent, respectively.
As for the labor market, a further decline in the number of unemployed and
a moderate rise in the number of the employed are expected. The registered
unemployment rate is projected to go down to 10.5 percent in 2018 and 9.7
percent in 2018. Although the credit activity will remain weak in 2018, credit
growth might eventually resume in 2019, with a growth rate of 0.3 percent.
As for the exchange rate, it is expected to remain stable in years to come,
just as the prices. A slight acceleration of price dynamics is foreseen, owing
to increase in energy prices, strong domestic demand, and higher wages.
percent in 2019.
Table HR2 Summary of projections
2017 2018 2019
Real GDP (% change) 2.8 2.7 2.6
Real private consumption (% change) 3.6 3.1 2.7
Real government consumption (% change) 2.0 2.2 0.9
Real investment (% change) 3.4 3.9 4.3
Exports of goods and services (constant prices, % change) - 5.6 5.3
Imports of goods and services (constant prices, % change) - 7.4 7.5
Current account balance (% of GDP) - 1.4 0.6
Consumer prices (% change, pa) 1.2 1.6 1.8
Exchange rate, national currency/EUR (pa) 7.46 7.42 7.40
Unemployment rate (registered, %, pa) 12.4 10.5 9.7
- 0.2 0.5
Total domestic credit (% change, eop) -4.7 -0.3 0.9
Note: Cut-off date for information used in the compilation of projections for 2018 and 2019 was March 5, 2018.
Conventional abbreviations: o – outturn, p – projection, pa – period average, eop – end of period, EUR – euro.
Source: The Institute of Economics, Zagreb.

14
On the roadto economicrecovery
Recent economic developments
Since mid–2017 Macedonia has a new Government, which was formed long
six months after the parliamentary elections. Although a political turmoil has
thus been calmed, political scene is still far from being stable.
Rise in GDP that was mostly fueled by Government borrowing and driven by
construction in both public and private sectors, stopped in the last quarter of
2017. The process of the parliamentary elections that was held in December
2016 froze the government expenditures. As the result of the long process
of establishing the new Government, public expenditures even in the second
quarter of the 2017 decreased by around 20%. Government investments
as a main driver of economic growth trend were stopped.
The fall of the real investment was ended in the second quarter of 2017 and
it is expected to continue with positive trend and to be the driving force of the
growth. The private consumption is expected to rise at the same period, but
The NEET rate shows that great part of the younger population (20-34)
in the Republic of Macedonia are neither employed nor receive education
B O S N I A A N D H E R Z E G O V I N A
C R O AT I A M A C E D O N I A M O N T E N E G R O S E R B I A S LO V E N I A
MACEDONIA
The political crisis is stagnating, but the political
climate is not improving
Changing the catalysts for economic growth

15
and training. Despite its decline (from 50.1% in 2006 to 37.7% in 2016), it
unemployed, while 16.1% are inactive.
Despite the manifested positive changes on the labor market in the country,
the unemployment and inactivity of the younger population (20-34) in the last
decade remains high. The number of the unemployed decreased from over
148 thousand to almost 108 thousand persons. This change was accompanied
with an increase of the share of the unemployed with high level of education
(from 9.2% in 2006 to 20.3% in 2016). Also, the participation of the long term
unemployed, particularly of those unemployed for more than 4 years, remains
dominant (52.3% in 2016). As for the inactivity, it decreased for about 4%,
but in 2016 there were about 142.7 thousand inactive persons aged 20-34
(out of them almost 70% are women). So, Macedonia is today faced with a
relatively great scope of unemployed and inactive young population.
As for the unfavorable position of the young labor force, the problem of
unemployment and inactivity of the highly educated population proved to
Increased number of the highly educated population in the last decade
resulted in a huge increase of those who are outside the economic activity
With the formation of the new government, policies should now focus on
and give EU accession prospects a new push. In July the new government
Unfavorable position of the younger labor force
Ensuring scal sustainability remains a
priority

16
adopted a supplementary budget that adjusted revenues and expenditures
target in nominal terms.
Fiscal expansion in recent years has been accompanied by higher pensions
and subsidies. Consolidation should start without delay to create policy
sustainability and help meet large investment needs in infrastructure and
human capital.
budgeted revenue collection (about 87% of total years planed revenues
expenditure is also projected to be below the budgeted amount (for the same
period, 85.5% of years planned expenditures are realized). The under-execution
of goods and services and capital spending (74.1% and 58.4% respectively, of
years planned expenditures are realized for 11 months), which is expected to
to rise to 47% of GDP in 2017.
Decreased rate on CB bills to 3.25% in February 2017, provided strong
signals for lessening the monetary policy, which during the previous period
had triple adjustment such as 4% in May 2016, 3.75% in December 2016
reserves in mid-2016 due to the political crises, their level was stabilized at
the optimal balance during the year of 2017 reaching 2,534.4 and 2,399.9
Banking sector was stable with capital adequacy of 15.4% and 15.8% for the
and 1.4% and ROE of 13.8% and 12.7%. NPLs to gross loans demonstrated
further decrease such as 6.1 and 6.5% respectively, validating increased bank
assets quality and enhanced risk assessment and management in the banks.
Credit growth registered minor increase in terms of credit to enterprises,
whilst credits to households indicated increase of 6.5% and 9.2%, respectively.
Data demonstrate that bank deposits continue to grow clearly signifying the
increased level of trust and decreased pressure of the political crises.
The trend of decreasing consumer and production price was held to a stop
quarters of 2017, we can see the rise in consumer and production prices
for 0.5 and 1.2% percentage points respectively. The rise in the consumer
price of transportation is the most relevant for the overall rise of prices. In
by the rise of electricity and fuel prices for the industry and households.
The expansion of the political crisis also had an effect on increasing the
Ef cient monetary policy and banking sector mainly
focused on household sector
Increases in prices
B O S N I A A N D H E R Z E G O V I N A
C R O AT I A M A C E D O N I A M O N T E N E G R O S E R B I A S LO V E N I A

17
consumer prices due to the high level of uncertainty of the effects and the
account registered the lowest level in 2014, and in the upcoming period it is
kept at a moderate level without indicating major imbalances in the external
sector. The biggest contribution to this is the improvement of the exchange
of goods as a result of the growing export of new industrial capacities, i.e. the
more intensive growth of exports than imports. An exception to this is the
import growth, driven primarily by the raw material imports (of some of the
foreign capacities) and energy imports, led to the expansion of the negative
foreign trade balance.
account, part of the needs for external funding were covered by foreign
exchange reserves, which declined on an annual basis, but remain adequate.
Gross external debt has seen a continuous increase, which is due either to
public debt or private sector debt, depending on the analyzed period.
Stable state in foreign trade and capital ows

18
B O S N I A A N D H E R Z E G O V I N A
C R O AT I A M A C E D O N I A M O N T E N E G R O S E R B I A S LO V E N I A
Table MK1 Main economic indicators
2015 2016 2017
Q1 Q2 Q3
ECONOMIC ACTIVITY
Real GDP (% change, yoy) 3.9 2.4 0 -1.8 0.2
Real private consumption (% change, yoy) 3.7 5.1 2.7 4.1 2.9
Real government consumption (% change, yoy) 2.1 3.4 0.7 2.0 -3.6
Real investment (% change, yoy) 3.6 -10.4 0.6 -19.9 -9.4
Industrial output (% change, yoy) 4.9 -1.7 -1.6 3.8 -2.4
Unemployment rate (registered, %, pa) 26.1 23.1 22.9 22.6 22.1
Nominal GDP (EUR million) 9,061 2,607 2,373 2,488 2,594
GDP per capita (EUR) 4,392 - - - -
PRICES, WAGES, AND EXCHANGE RATES
1.9 - - - -
Consumer prices (% change, yoy, pa) -0.3 -0.1 0.5 1.2 1.6
Producer prices (% change, yoy, pa) -4.1 -0.5 0.1 0 0.5
Average gross wage (% change, yoy, pa) 3.0 2.2 1.8 1.0 1.3
Exchange rate, MKD/EUR (pa) 61.61 61.49 61.48 61.69 61.58
Exchange rate, MKD/USD (pa) 55.5 55.1 58.33 57.71 52.48
FOREIGN TRADE AND CAPITAL FLOWS
Exports of goods (EUR million) 3,046.9 934.4 922.6 1,034.7 1,018.1
Exports of goods (EUR, % change, yoy) 9.4 12.9 19.6 22.4 10.7
Imports of goods (EUR million) 4,869.8 1,416.4 1,385.2 1,453.1 1,430.1
Imports of goods (EUR, % change, yoy) 5.1 3.9 17.8 7.4 7.2
Current account balance (EUR million) -177.1 -115.5 -140.1 -95.5 174.9
Current account balance (% of GDP) -2.0 -4.8 -5.9 -3.8 6.8
Gross foreign direct investment (EUR million) 262.3 83.4 219.2 54.1 -1.7
Foreign exchange reserves (EUR million, eop) 2,261.8 2,613.4 2,534.4 2,399.9 2,271.4
Foreign debt (EUR million, eop) 6,290.5 7,216.6 7,791.4 7,781.3 7,710.2
GOVERNMENT FINANCE*
Revenue (million Denars)** 161,207 43,543 42,735 43,634 44,604
Expense (million Denars)** 180,632 50,507 46,301 48,373 47,349
Net = Gross operating balance (million Denars)** -19,425 -6,964 -3,566 -4,739 -2,745
-16,402 -5,821 -4,935 -3,390 -2,101
Net lending/borrowing (million Denars)** -3,023 -1,143 1,369 -1,349 -644
Domestic government debt (EUR million, eop) ,1356.6 1,404.9 1,441.8 1,434.6 1499.1
Foreign government debt (EUR million, eop) 2,096.7 2,446.6 2,446.9 2,450.8 2376.7
Total government debt (% of GDP) 38.1 39.1 37.8 38 37.8
MONETARY INDICATORS
Narrow money, M1 (% change, yoy, eop) 18.4 9.9 5.5 14.9 13.2
Broad money, M4 (% change, yoy, eop) 6.8 6.1 4.2 7.8 6.4
Total domestic credit (% change, yoy, eop) 9.5 0.9 0 4.4 4.3
DMBs credit to households (% change, yoy, eop) 13.2 6.9 6.5 9.2 10.0
DMBs credit to enterprises (% change, yoy, eop) 7.3 2.1 1.3 1.2 0.5
Money market interest rate (%, pa) 1.0 1.0 1.0 1.0 1.0
DMBs credit rate for enterprises, short-term, (%, pa) 6.8 5.7 5.5 5.4 5.3
DMBs credit rate for households, short-term (%, pa) 4.9 4.3 4.5 4.6 4.6
Notes: * Data refer to consolidated general government, unless stated otherwise. ** On the cash principle, cumulative from the beginning of the year.
Conventional abbreviations: pa – period average, eop – end of period, yoy – year on year, EUR – euro, USD – U.S. dollar, MKD – Macedonian denar, DMB – deposit money bank.
Sources:

19
Policy assumptions and projections summary
The stabilization of the GDP growth is expected and the positive economic
growth is predicted in 2018 (2.7%) and in 2019 (3.2%). In the coming period,
the prices are expected to grow and stabilize. Over the medium-term, the
peaking above 15% of GDP in 2020–21. The medium-term deterioration of
program: subsidies for proposed wage increases, the roll-out of additional
employment and business incentives, and an increase in public sector wage
bill from the pass-through of economy-wide minimum wage increase, as well
as clearance of some unpaid claims.
In 2018 the positive trends are expected in terms of sustaining price stability
and deposit and credit growths, particularly credits fostering company
development and further economic development. However, these expectations
domestic environment. The NBRM plans future harmonization with the
Basel principles, aiming to secure implementation of the Basel III principles
in the following three years.
Considering the new economic policies, in the next two years, further reduction
of the unemployment rate and inactivity can be expected. All projections
unemployment and inactivity of the youth population cannot be expected.
With the gradual resolution of the domestic political crisis, the maintenance
of a robust external position and an adequate level of foreign exchange
reserves is expected in the future.
Table MK2 Summary of projections
2018 2019
Real GDP (% change) 1.7 2.7 3.2
Exports of goods and services (constant prices, % change) 8.8 8.8 8.4
Imports of goods and services (constant prices, % change) 5.5 6.8 7.0
Current account balance (% of GDP) -2.5 -2.4 -2.3
Consumer prices (% change, pa) 1.2 2.0 2.4
Exchange rate, national currency/EUR (pa) 61.6 61.6 61.6
Unemployment rate (registered, %, pa) 22.2 21.4 21.0
-2.9 -3.0 -3.0
Broad money, M4* (% change, eop)
Total domestic credit (% change, eop) 5.6 6.7
Note: Cut-off date for information used in the compilation of projections was December 20, 2016.
Conventional abbreviations: pa – period average, eop – end of period, EUR – euro.
Sources: Ministry of Finance of the Republic of Macedonia, National Bank of the Republic of Macedonia, and the European Economic Forecast, Autumn 2016, EuropeanCommission Directorate - General for Economic and Financial Affairs, Institutional Paper 038, November 2016.
Positive economic growth in 2018

20
Became the 29th
Member Stateof the NATO
Recent economic developments
few years. The most important variables that are expected to determine the
started investment projects in tourism, energy sector (construction of small
hydropower plants and wind farms) and the public sector (construction of
highway), as well as the dynamics of realization of announced new investment
projects in 2017.
The construction of highway in Montenegro, as a capital and one-time
investment, will affect the growth of economic activity, while on the other hand
On 28 November 2016, the Parliament elected a new government headed
(DPS), which won a relative majority of 36 out of 81 seats at the parliamentary
elections on 16 October 2016.
In 2017, Montenegro remains the frontrunner in the process of European
integration, among the Western Balkans countries. Important update is that
B O S N I A A N D H E R Z E G O V I N A
C R O AT I A M A C E D O N I A M O N T E N E G R O S E R B I A S LO V E N I A
MONTENEGRO
The capital in ow was the main driver of the
economy
Elected a new government

21
Montenegro closed its third chapter in the negotiation process – Chapter
30- External relations, in June 2017. Montenegro now has 30 chapters
opened (out of 33 chapters) and 3 chapters temporarily closed. On the path
of European integration, focus will remain on strengthening rule of law and
further strengthening of democratic capacities of the state and society as
a whole.
The biggest achievement of Montenegro in the foreign policy area in 2017 is
that it became 29th Member State of the North Atlantic Treaty Organization
(NATO). Becoming a NATO member, Montenegro ensured the security of
the country, but also created the preconditions for accelerated economic
growth and development.
in current prices in 2016 amounted to 3.954 million euros, with real growth
rate of 2.9%, compared to the same period of the previous year. Highest
contribution to growth comes from investments and household consumption,
whereby high import dependency of investments has reduced their expected
effects which has also affected the GDP growth rate.
half of the year amounted to 4.2%,while according to the estimates of the
Central Bank of Montenegro (CBM), similar growth is expected (about 4%)
for the whole year.
The number of employees in 2016 was on average 177,908 and was higher
by 1.3% compared to the previous year. The number of employees in June
2017 was 6% higher than in December of the previous year. The largest
increase in the number of employees was recorded in the administrative
Highest contribution to growth comes
from investments and household consumption
Increased number of
employees

22
sector and auxiliary service activities, and the largest decline was in the real
estate business sector.
The total number of unemployed persons in June 2017 was 46,781, which
is 5.5%1 less compared to December 2016. According to the data of the
Employment Agency of Montenegro, the unemployment rate in June 2017
amounted to 20.16% and it is higher by 2.93 p.p. than the rate recorded in
June 2016.
and public debt for the period 2017-2021, which was adopted together
and expenditure side, has a total value of €126.9 mil. or 3.2% of GDP. In
was elaborated within the framework of the Fiscal Strategy for the period
€117.0 mil. or 2.8% of GDP.
According to the Ministry of Finance, at the end of June 2017, the government
debt (gross) amounted to 2,483.1 million euros or 62.7% of GDP. Out of the
above amount, EUR 474.1 million or 12% of GDP was on the domestic debt,
while external debt amounted to EUR 2,008.9 million or 50.8% of GDP.
The banking market in 2016 is characterized by a high level of liquidity with
the growth of liquid assets of 8.1% on annual level. Total loans of banks
registered modest growth in 2016. Nevertheless, considering new loans, it
The amount of non-performing loans (NPLs) at the end of 2016 amounted to
EUR 248.6 million (10.3% of total loans) and were 17.1% lower than at the end
of 2015. The trend of improving the quality of the loan portfolio continued,
so that the NPLs at the end of June 2017 amounted to EUR 228.1 million
and accounted for 8.8% of total loans.
In order to increase banks’ liquidity and stimulate lending, the Council of the
Central Bank of Montenegro (CBM),on 6 March 2017, cut the mandatory
reserve requirement ratios by 2 percentage points (from 9.5% to 7.5% and
from 8.5% to 6.5% for deposits with maturity up to or more than one year,
respectively). The long-term tendency of reducing active and passive interest
rates was continued in 2016.
1 The decline in the number of unemployed persons is largely the result of the EmploymentAgency of Montenegro’s decision that university students, who are included in the programof vocational training, are deleted from the records of the institution during the duration ofthe program (15th January- 15th October every year).
New packages of scal consolidation measures
High level of solvency and liquidity in the banking
sector
B O S N I A A N D H E R Z E G O V I N A
C R O AT I A M A C E D O N I A M O N T E N E G R O S E R B I A S LO V E N I A

23
low or negative.
Consumer prices recorded an increase of 0.5% in June 2017 compared to
was higher by 1.1 percentage points, compared to December of the previous
index of consumer prices was 2.4%.
million or 5.1% less compared to the same period in 2016.
million, an increase of 7% compared to the previous year, while the imports
of goods increased by 8.4% and amounted to EUR 1 billion.
371.6 million, which is by 40% less compared to 2015. FDI registered a
January - June 2017 amounted to 220 million euros, an increase of 41.7%
compared to the same period of the previous year.
In ation was low and stable
Reduction in the current account de cit

24
B O S N I A A N D H E R Z E G O V I N A
C R O AT I A M A C E D O N I A M O N T E N E G R O S E R B I A S LO V E N I A
Table MN1 Main economic indicators
2015 2016 2017
Q4 Q1 Q2 Q3
ECONOMIC ACTIVITY
Real GDP (% change, yoy) 3.4 3.4 3.2 5.1 4.7
Real private consumption (% change, yoy) 2.2 1.0 1.1 -0.2 -2.7
Real government consumption (% change, yoy) 1.9 0.7 0.3 1.0 -0.4
Industrial output (% change, yoy) 7.9 0.6 -6.6 0.9 3.6
Unemployment rate (LFS, %) 17.6 17.5 17.4 15.1 14.8
Nominal GDP (EUR million) 3,625 946 747 946 1,392
GDP per capita (EUR)* 5,826 1,520 1,201 1,521 2,236
PRICES, WAGES, AND EXCHANGE RATES
1.4 -0.19 0.9 2.17 -2.36
Consumer prices (% change, annual change: end month/end month-12) 1.4 0.4 0.5 -0.13 0.23
Producer prices (% change, annual change: end month/end month-12) 0.0 0.03 0.3 -0.2 -0.1
Average gross wage (% change, yoy, average of monthly data)** 0.3 4.0 3.8 1.8 1.10
FOREIGN TRADE AND CAPITAL FLOWS
Exports of goods (EUR million)*** 325.0 105.5 81.2 82.3 111.9
Exports of goods (EUR, % change, yoy) -9.0 5.3 36.3 -11.6 28.7
Imports of goods (EUR million)*** 1,789.0 493.1 443.3 591.9 597.1
Imports of goods (EUR, % change, yoy) 3.2 10.9 20.9 1.4 6.8
Current account balance (EUR million) -483 -290 -322 -313 250
Current account balance (% of GDP) -13.3 3.9 11.9 -16.8 -18.1
Gross foreign direct investment (EUR million) 757.0 135.2 128.3 145.8 135.6
Foreign exchange reserves (EUR million, eop)*** 674 792 780 723 740
GOVERNMENT FINANCE****
Revenue (EUR million) 1,327.0 403.2 297.7 384.2 434.0
Expense (EUR million)***** 1,380.0 504.5 368.2 419.0 431.6
Net operating balance (EUR million)****** -53.0 -101.3 -70.5 -34.8 2.4
Capital expenses (EUR million) 238.0 39.5 9.0 32.1 60.0
Net lending/borrowing (EUR million) ******* -276.0 -140.8 -79.5 -66.9 -57.6
Domestic government debt (EUR million, eop), national methodology 320.0 400.2 431.3 474.1 431.3
Foreign government debt (EUR million, eop), national methodology 1,956.0 2,002.7 2,001.6 2,008.9 2,058.9
Total government debt (% of GDP), national methodology 62.8 63.7 59.1* 59.3 61.9
MONETARY INDICATORS
Total domestic credit (% change, yoy, eop) 0.8 -1.0 3.1 9.6 7.6
DMBs credit to households (% change, yoy, eop) 3.1 19.7 29.1 -7.5 -8.2
DMBs credit to enterprises (% change, yoy, eop) 2.7 6.5 -4.5 0.7 -16.3
DMBs credit rate for enterprises, short-term, (%, pa) 8.0 6.0 5.9 5.8 5.6
DMBs credit rate for households, short-term (%, pa) 9.6 9.2 8.7 9.1 8.7
Notes: *Population data (denominator) used are Monstat estimates.
** Quarterly gross wage data are year to date.
***Data are in thousands for 4th quarter of 2016, and 1st and 2nd quarter of 2017.
****Quarterly budget data are year to date. Debt data exclude local governments.
*****Data refer to current expenses only, and exclude capital expenses.
******Calculated as a difference between revenues and current expenses.
*******Calculated as a difference between net operating balance and capital expenses
.
Conventional abbreviations: pa – period average, eop – end of period, yoy – year on year, EUR – euro, DMB – deposit money bank.
Sources:

25
Projections summary
In the period 2017–2019, the priority of the economic policy is the
the budget surplus and setting a downward trend of the public debt from
2019, while strengthening the economic activity and competitiveness of the
of the Government of Montenegro presented in the “Montenegrin Fiscal
Strategy 2017–2020”.
Table MN2 Summary of projections
2018 2019
Real GDP (% change) 2.7 3.2 2.3
Real private consumption (% change, yoy) -0.9 -0.3 1.1
Real government consumption (% change, yoy) -1.7 -1.5 -0.6
Nominal GDP, EUR million 3,957.2 4,192.4 4,372.2
Exports of goods and services (constant prices, % change) 2.5 1.8 2.0
Imports of goods and services (constant prices, % change) 2.7 1.6 -1.2
Current account balance (% of GDP) -19.1 -18.6 -16.8
Consumer prices (% change, pa) 2.3 3.1 2.1
2.1 2.7 1.9
Unemployment rate (LFS, %) 17.8 17.0 16.6
Conventional abbreviations: pa – period average, eop – end of period, EUR – euro.
Source: Ministry of Finance of the Government of Montenegro.
Strengthening of scal stability

26
Competitive positionimproved as a resultof a more favorablemacroeconomic andbusiness environment
Recent economic developments
The strategic goal of the Serbian’s Government is to become part of the
European Union (EU). In this regard, Serbia opened Chapter 30 (Economic
relations with foreign countries) in negotiations with the EU. Consequently,
The Republic of Serbia has committed to break up all free trade agreements
that it had concluded with Kazakhstan, Turkey, Belarus and the Russian
Federation. The trade volume between Serbia and the Russian Federation is
the largest, compared with the remaining three countries. For example, trade
Serbian’s export. Therefore, abolition of a free trade agreement with Russia
can indeed be a huge problem. Chapter 30 is of great importance for the
Serbian economy, because Serbia would become part of a single customs
union and the common EU market.
B O S N I A A N D H E R Z E G O V I N A
C R O AT I A M A C E D O N I A M O N T E N E G R O S E R B I A S LO V E N I A
S E R B I A
Serbia opened Chapter 30-Economic relations with foreign countries

27
of Serbia, Serbian GDP recorded annual growth rate amounting to 2.8%
in 2016. Given the fact that economic activity has been performed under
in 2016 could be considered as success of the economic policy. Although
GDP continued to follow stable growth tendencies throughout 2017, initial
agricultural production.
In the third quarter of 2017, GDP recorded a growth of 2.1% when compared
to the same period in 2016, while annual growth for 2017 has been estimated
to 1.9%. When considering expenditure approach of measuring GDP, the main
positive impact on recorded growth came from the private consumption rising
by 2.0%, 1.6% and 1.7%, respectively (by quarters). Gross investments and
state consumption both recorded respectable rise in the third quarter 2017
amounting to 6.2% and 1.0%, respectively. Private consumption should be
the most important GDP component to fuel growth in 2018 as well, given
the slight rise of the wages in the public sector.
If production structure is analysed, both industrial production and sector of
services have had positive impact on the economic activity in 2017. Highest
growth rates were recorded in trade, tourism and transport. After negative
industry could be noticed with annual growth of 2.8%. Agriculture had an
extremely negative impact on the economic activity in 2017 since total
0.8 p.p. lower GDP.
Economic activity continues to follow a
stable growth path

28
Labour market performance has been mildly improving during 2017. Activity
unemployed and the rise of the employed as depicted by the Labour Force
Survey (LFS) data. After the decline in the employment rate by 1.3 p.p. and
2017 compared with the fourth quarter of 2016, both the employment and
unemployment rates show further improvements during the second and third
quarters of 2017. This development in the labour market is not surprising
third quarter of 2017, the LFS-based employment rate was 48.2% up from
showing an improvement of 1.7 p.p.
The registered number of employees has been growing on average by more
than two and a half p.p. per quarter in 2017, while the number of registered
jobseekers went down by 8.8% on average in 2017 compared with the previous
year. Our forecast shows that the registered unemployment rate will continue
to follow a decreasing trend. It will stand at less than one quarter in 2018
approaching the lower boundary of forecast in the fourth quarter of the year.
The real gross and net wages will continue to increase in 2018. This rise will
be based on at least three reasons —and the increase in the compulsory minimum wage. The higher minimum wage
and the administrative correction of the public sector wages as of January
2018 will raise wages of all employees.
undertook several restrictive measures, including cut in pensions and public
sector wages, and also restriction to new employments in public sector.
share of public debt in GDP considerably dropped in 2017 (almost 8 p.p. in
low interest rates and continuous primary surplus.
Yet, restrictive measures in 2017 on the expenditure side have been moderately
the unanticipated surplus on the revenue side. The Government made an
agreement with the IMF to nominally increase wages in public sector (up to
10%) and pensions (5%) in 2018.
Following the NPL Resolution Strategy of the Government, the National Bank
adopted the Decision on the Accounting Write-off of Bank Balance Sheet
Assets in August 2017. This resulted in accelerated decline of NPL at the end
of the third quarter in 2017, reaching record high amount of written-off NPL
(around RSD 54 billion) and the lowest share of NPL in total loans (around
Labour market recovery continues
Restrictive scal policy is coming to the end
NPL write-off in progress
B O S N I A A N D H E R Z E G O V I N A
C R O AT I A M A C E D O N I A M O N T E N E G R O S LO V E N I A

29
12%) since global crisis outbreak. The high amounts of NPL write-offs to both
explain moderate nominal increase in recorded credit activity, being arguably
of a temporary nature. Increase in total domestic loans in September 2017
was almost 10%. The upward trend in credit activity was especially visible
when only new corporate loans are considered – amount of new loans in the
third quarter of 2017 was 25% higher than in Q2. Dinarisation of loans was
achieved to a lesser extent: tangible increase in share of RSD households’
loans (compared to the end of 2016) was partially offset by decline in share
of RSD corporate loans.
The interest rates on corporate and households’ loans have remained stable
policy of monetary easing in second half of 2017, by cutting policy rate two
times by 0.25 p.p.
pressures that are present for a long period of time as well as improving
macroeconomic indicators, the Executive Board of the National Bank of Serbia
alcohol and cigarettes, which decreased in September to 1.5%, at the same
level as at the end of 2016. The average rate of the dinar appreciation against
US dollar, dinar appreciation amounted to 4.4%, mainly to the considerable
appreciation of the euro to the dollar. The appreciation of the dinar was
greater interest of foreign investors in government securities and growth
in FX-indexed bank assets. In the following period the exchange rate of the
dinar will depreciate. The intensity of depreciation will largely depend on the
implemented monetary policy of major central banks worldwide but also of
the movement of key domestic macroeconomic indicators.
deteriorated in relation to 2016. This was attributable to the worsening of the
of reinvested earnings related to FDIs. These tendencies were partly offset
transfers received by the general government.
As regards the commodity trade, both exports and imports recorded high
growth rates, but increase in imports was more substantial in absolute
terms. The composition of commodity trade did not change substantially
compared to the previous year: most important export products include
cars, electrical appliances, metals and agricultural products, whereas imports
are dominated by machinery and fuels. The growth in exports was mainly
In ation is stable and moves within the target
band
Both exports and imports recorded high growth
rates
30
B O S N I A A N D H E R Z E G O V I N A
C R O AT I A M A C E D O N I A M O N T E N E G R O S E R B I A S LO V E N I A
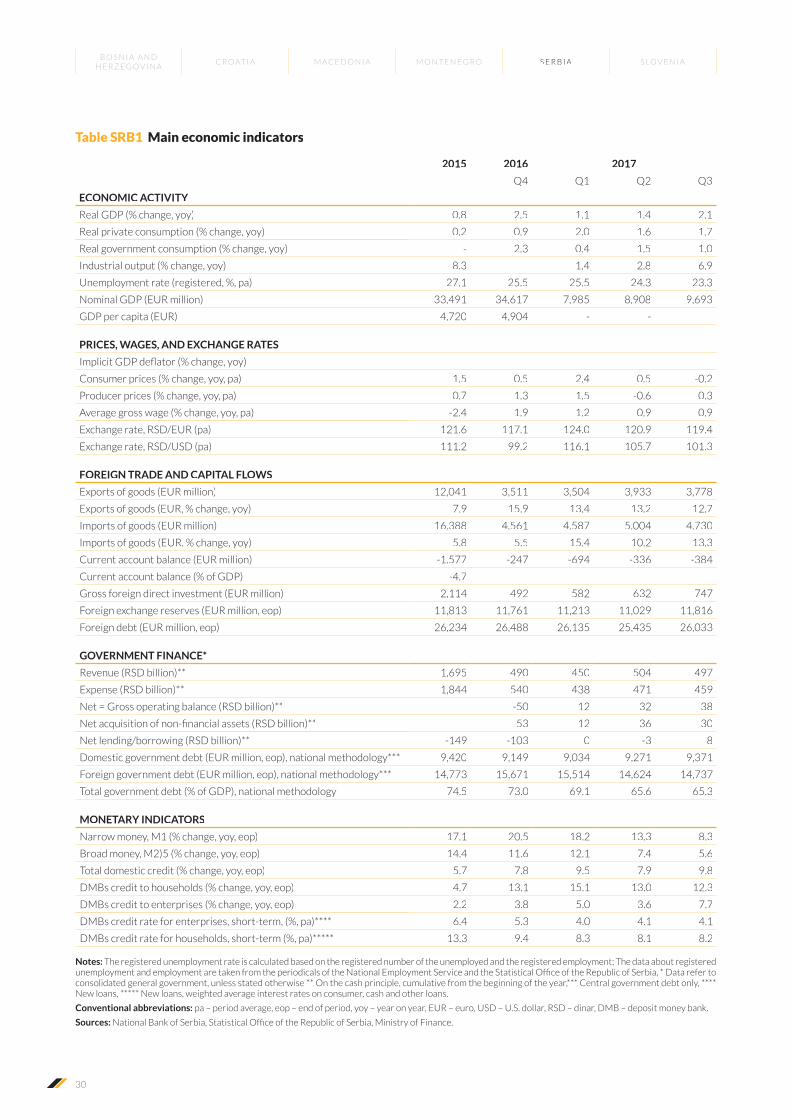
Table SRB1 Main economic indicators
2015 2016 2017
Q4 Q1 Q2 Q3
ECONOMIC ACTIVITY
Real GDP (% change, yoy) 0.8 2.5 1.1 1.4 2.1
Real private consumption (% change, yoy) 0.2 0.9 2.0 1.6 1.7
Real government consumption (% change, yoy) - 2.3 0.4 1.5 1.0
Industrial output (% change, yoy) 8.3 1,4 2,8 6,9
Unemployment rate (registered, %, pa) 27.1 25.5 25.5 24.3 23.3
Nominal GDP (EUR million) 33,491 34,617 7,985 8,908 9,693
GDP per capita (EUR) 4,720 4,904 - - -
PRICES, WAGES, AND EXCHANGE RATES
Consumer prices (% change, yoy, pa) 1.5 0.5 2.4 0.5 -0.2
Producer prices (% change, yoy, pa) 0.7 1.3 1.5 -0.6 0.3
Average gross wage (% change, yoy, pa) -2.4 1.9 1.2 0.9 0.9
Exchange rate, RSD/EUR (pa) 121.6 117.1 124.0 120.9 119.4
Exchange rate, RSD/USD (pa) 111.2 99.2 116.1 105.7 101.3
FOREIGN TRADE AND CAPITAL FLOWS
Exports of goods (EUR million) 12,041 3,511 3,504 3,933 3,778
Exports of goods (EUR, % change, yoy) 7.9 15.9 13.4 13.2 12.7
Imports of goods (EUR million) 16.388 4.561 4.587 5.004 4.730
Imports of goods (EUR. % change, yoy) 5.8 5.5 15.4 10.2 13.3
Current account balance (EUR million) -1.577 -247 -694 -336 -384
Current account balance (% of GDP) -4.7 - - - -
Gross foreign direct investment (EUR million) 2,114 492 582 632 747
Foreign exchange reserves (EUR million, eop) 11,813 11,761 11,213 11,029 11,816
Foreign debt (EUR million, eop) 26,234 26,488 26,135 25,435 26,033
GOVERNMENT FINANCE*
Revenue (RSD billion)** 1,695 490 450 504 497
Expense (RSD billion)** 1,844 540 438 471 459
Net = Gross operating balance (RSD billion)** - -50 12 32 38
- 53 12 36 30
Net lending/borrowing (RSD billion)** -149 -103 0 -3 8
Domestic government debt (EUR million, eop), national methodology*** 9,420 9,149 9,034 9,271 9,371
Foreign government debt (EUR million, eop), national methodology*** 14,773 15,671 15,514 14,624 14,737
Total government debt (% of GDP), national methodology 74.5 73.0 69.1 65.6 65.3
MONETARY INDICATORS
Narrow money, M1 (% change, yoy, eop) 17.1 20.5 18.2 13.3 8.3
Broad money, M2)5 (% change, yoy, eop) 14.4 11.6 12.1 7.4 5.6
Total domestic credit (% change, yoy, eop) 5.7 7.8 9.5 7.9 9.8
DMBs credit to households (% change, yoy, eop) 4.7 13.1 15.1 13.0 12.3
DMBs credit to enterprises (% change, yoy, eop) 2.2 3.8 5.0 3.6 7.7
DMBs credit rate for enterprises, short-term, (%, pa)**** 6.4 5.3 4.0 4.1 4.1
DMBs credit rate for households, short-term (%, pa)***** 13.3 9.4 8.3 8.1 8.2
Notes: The registered unemployment rate is calculated based on the registered number of the unemployed and the registered employment; The data about registered
consolidated general government, unless stated otherwise ** On the cash principle, cumulative from the beginning of the year,*** Central government debt only, **** New loans, ***** New loans, weighted average interest rates on consumer, cash and other loans.
Conventional abbreviations: pa – period average, eop – end of period, yoy – year on year, EUR – euro, USD – U.S. dollar, RSD – dinar, DMB – deposit money bank.
Sources:

31
driven by electrical appliances, metals and tires, while cars (due to reduced
production), cereals (due to unfavourable weather conditions) and tobacco
products had a negative contribution. As regards growth in imports, it was
mainly attributable to petroleum, metals and electrical machinery, whereas
decline in imports of transport vehicles negatively affected total commodity
imports growth.
Policy assumptions and projections summary
Real GDP will most likely continue to grow at slightly higher pace than in
2016, probably exceeding 3% in 2018, while general government balance
will continue to decrease. External sector variables will remain on the stable
path, but high rate of export growth is expected to slow down. Due to policy of
monetary easing and low interest rates it is reasonable to expect continuation
probably moderately accelerate. However, it will need some time of steady
growth and more sound structural reforms for the registered unemployment
to substantially decrease.
Table SRB2 Summary of projections
2018 2019
Real GDP (% change) 1.9 3.3 3.5
Exports of goods and services (constant prices, % change) 9.7 7.3 6.5
Imports of goods and services (constant prices, % change) 10.7 8.5 7.0
Current account balance (% of GDP) -4.6 -4.2 -4.1
Consumer prices (% change, pa) 3.0 2.9 2.8
Exchange rate, national currency/EUR (pa) 118.5 122.3 123.9
Unemployment rate (registered, %, pa) 24.0 23.2 21.9
0.8 0.5 0.5
Broad money, M4* (% change, eop) - - -
Total domestic credit (% change, eop) 4.0 8.0 8.0
Notes: Cut-off date for information used in the compilation of projections was May13, 2016, * Data on M3, the broadest category of money for which statistic is compiled by the NBS.
Conventional abbreviations: pa – period average, eop – end of period, EUR – euro.
Sources: Authors’ projections, Fiscal strategy of the Republic of Serbia for 2018 with projections for 2019 and 2020, the IMF WEO.

32
Continuing theeconomic growth,waiting forsustainability
Recent economic developments
to organize their own care, the Long-Term Care Act was submitted to public
consultation by July 2017. Also, the amended Health Services Act is being
discussed in Parliament and includes new criteria for granting concessions
for public healthcare services to improve transparency and accessibility. The
2017 Health Care and Health Insurance Act focuses health-sector reforms on
(also by broadening the contribution base).
The proposals followed more than a decade of discussions on structural
reforms, in particular in the areas like labor market, pensions, healthcare,
long-term care, education, science and culture. Nevertheless, the proposals
were followed with a lot of critiques. Based on the recommendations of
international organizations (pointing, e.g., to problems of demographic
change, particularly noticeable for Slovenia), it would be expected that the
B O S N I A A N D H E R Z E G O V I N A
C R O AT I A M A C E D O N I A M O N T E N E G R O S E R B I A S LO V E N I A
S L O V E N I A
Slovenia – “growth with few structural
developments”

33
reforms, improving the structural position of Slovenia and helping it to grow
in a sustainable and long-term way.
quarter of the year, gross domestic product increased by 5.1%, 4.6% and
4.5% on a year-on-year basis respectively. Real GDP growth is forecast to
reach 4% in 2018 and 3.3% in 2019, and should be driven mainly by domestic
demand. Domestic demand and private consumption continued to expand.
Spurred by strong exports, the rise in industrial output was strong. Risks to
the growth outlook are, on the upside, primarily domestic in nature, while
downside risks are mainly external and relate to the future development
of energy and raw material prices, resulting from the macroeconomic and
higher private investment due to continuing deleveraging of the Slovenian
for loans, and the creditworthiness of borrowers is improving.
Labor market conditions continued to improve in 2017, in particular in the
second quarter of the year. Employment growth remained high in most
sectors as increasing exports, consumption and investment boosted labor
demand in Slovenia. Employment is expected to continue to grow by 1-2% in
the following years, but decelerate as labor shortages will likely increase in
the tightening labor market. The unemployment rate is expected to decline to
5.2% in 2019. As the forecasted unemployment rate approaches its natural
rate, wage pressures are set to rise. The level of employment will be on the
rise in practically all sectors, but will be increasingly affected by demographic
Stable and solid economic growth continues
Labor market conditions improve further

34
changes. Unemployment will drop further to below 90,000 persons for the
year as a whole.
conditions, the retention of the remaining measures that contain expenditure
growth, and low expenditure on investment. Public investment increased after
a plunge of nearly 30% in 2016. Both the compensation of public employees
and pensions continued rising. In 2018, the general government balance is
expected to be close to zero as tax revenues and social contributions should
Further improvement of the general government balance is expected in the
coming years mainly due to cyclical factors. Both the general government
revenue as well as expenditure were raised throughout this period, with
revenue surpassing the expenditure in the second quarter of 2017.
Banks’ lending activity showed signs of improvement. Credits to households
growth on year-to-year basis in the third quarter of 2017. Also, credits to
enterprises continued to shrink, but on a lower rate than in 2016. Probably,
this is a sign of improvement in macroeconomic environment, as well as
activities for the deleveraging of private companies. The enterprises started
further years, the volume of bank loans is expected to expand further, but
and foreign demand boosts particularly the growth of service prices. Price
rises in energy and non-energy goods will in future remain moderate in the
eased mainly as a result of smaller energy price declines and stronger food
Also, the euro is expected to continue to appreciate against the currencies
of some of Slovenia’s main trading partners in 2018 and 2019, but the price
competitiveness of Slovenia’s economy remains relatively favorable.
After a strong increase in 2016, both goods exports and imports remained
will strengthen in 2018 and 2019 thanks to the higher growth in foreign
demand and the improving competitiveness of exporters. Over the entire
period, we expect a continuation of export growth across all main groups of
manufactured goods. The growth of imports will remain high in 2017–2019
amid further strong growth of exports and domestic consumption. The current
The government de cit reduces, public
investment rises
First signs of improvement in lending
activity
De ation beaten, price changes stay moderate
Strong goods exports and imports enhanced
B O S N I A A N D H E R Z E G O V I N A
C R O AT I A M A C E D O N I A M O N T E N E G R O S E R B I A

35
account surplus widened further in 2017 and will remain high also in 2018
private sector deleveraging and the still low level of domestic consumption,
particularly investment.
amounted to EUR 707 million. Its Foreign Portfolio Investment fell by EUR
138.3 million in September 2017. Among concrete investments, in Maribor,
TAM (a motor vehicle producer) and Maribor Airport are announced to be
taken over by Chinese investors. Among the announced investments in
2016, in 2017 Austrian automotive giant Magna Steyr, indeed, started with
Policy assumptions and summary of projections
The projected values of the main macroeconomic aggregates for Slovenia
are those presented in the Autumn Forecast 2017 of the national Institute
for Macroeconomic Analysis and Development (IMAD). The projected value
Forecast of the European Commission.
The macroeconomic projections for Slovenia forecast continuing the broad-
based economic growth, hovering between 3 and 4% in the growth of the
gross domestic product in 2018-2019. The strong growth of exports will
competitive position of the tradable sector. The rising demand will contribute
to a further increase in investment in machinery and equipment, while
favorable borrowing conditions and rising disposable income will boost
housing investment. Other construction investment will also continue to
increase, including the planned absorption of EU funds. Favorable labor
market conditions will remain the main factor of growth in disposable income
FDI in ow slowly increasing in 2017
Broad-based economic growth will continue

36
B O S N I A A N D H E R Z E G O V I N A
C R O AT I A M A C E D O N I A M O N T E N E G R O S E R B I A S LO V E N I A
Table SI1 Main economic indicators
2015 2016 2017
Q1 Q2 Q3
ECONOMIC ACTIVITY
Real GDP (% change, yoy) 2.3 3.5 5.1 4.6 4.5
Real private consumption (%change, yoy) 2.1 6.5 3.8 2.8 2.7
Real government consumption (% change, yoy) 2.7 1.1 0.9 1.3 1.8
Real investment (% change, yoy) 0.2 3.8 14 7.5 1.9
-1.6 0.7 13 8.7 6.1
Industrial output (% change, yoy) 5.6 6.6 7.3 5.0 6.9
Unemployment rate (registered, %, pa) 12.3 10.6 11.1 9.4 8.9
Nominal GDP (EUR million) 38,837 10,396 9,909 11,018 11,107
GDP per capita (EUR) 18,823 5,032 4,797 5,336 5,760
PRICES AND WAGES
1.0 1.0 1.1 2.2 2.3
Consumer prices (% change, yoy, pa) -0.5 0.6 1.8 1.4 1.2
Producer prices (% change, yoy, pa) -0.2 -0.1 1.7 2.3 2.3
Average gross wage (% change, yoy, pa) 0.7 1.9 1.5 2.3 2.8
FOREIGN TRADE AND CAPITAL FLOWS
Exports of goods (EUR million) 24,039 6,407 6,876 7,157 7,041
Exports of goods (EUR, % change, yoy) 5.3 4.5 10.1 8.2 12.6
Imports of goods (EUR million) 22,563 6,180 6,508 6,691 6,510
Imports of goods (EUR, % change, yoy) 5.1 6.7 11.3 8.3 10.7
Current account balance (EUR million) 1,698 343 583 785 872
Current account balance (% of GDP) 4.4 3.3 5.9 7.1 7.8
Gross foreign direct investment (EUR million) 1,465 41 364 86 257
Foreign exchange reserves (EUR million, eop) 787 705 754 751 766
Foreign debt (EUR million, eop) 46,627 44,805 44,852 44,543 43,503
GOVERNMENT FINANCE*
Revenue (EUR million)** 17,419 4,544 4,314 4,778 4,643
Expense (EUR million)** 18,541 4,749 4,461 4,747 4,662
Net = Gross operating balance (EUR million)**
Net lending/borrowing (EUR million)** -1,122 -205 -147 31,1 -18,8
Domestic government debt (EUR million, eop) 17,256 20,500 22,535 24,259 24,951
Foreign government debt (EUR million, eop) 10,023 6,629 6,169 5,348 5,129
Total government debt (percent of GDP) 82.6 - - - -
MONETARY INDICATORS
Total domestic credit (% change, yoy, eop) -12.6 -1.4 -1.4 1.7 5.6
DMBs credit to households (% change, yoy, eop) -1.7 3.4 3.4 5.4 7.0
DMBs credit to enterprises (% change, yoy, eop) -21.1 -7.0 -7.0 -2.0 8.1
3 months EURIBOR (%, pa) 0.21 -0.26 -0.31 -0.33 -0.33
6 months EURIBOR (%, pa) 0.31 -0.17 -0.21 -0.24 -0.27
DMBs credit rate for enterprises, short-term, (%, pa) 4.3 2.4 2.4 2.3 2.5
DMBs credit rate for households, short-term (%, pa) 4.3 3.1 3.2 3.2 3.3
Notes: * Data refer to consolidated general government, ** ESA 2010.
Conventional abbreviations: pa – period average; eop – end of period; yoy – year on year; EUR – euro; DMB – deposit money bank.
Sources:calculations by IER.
37
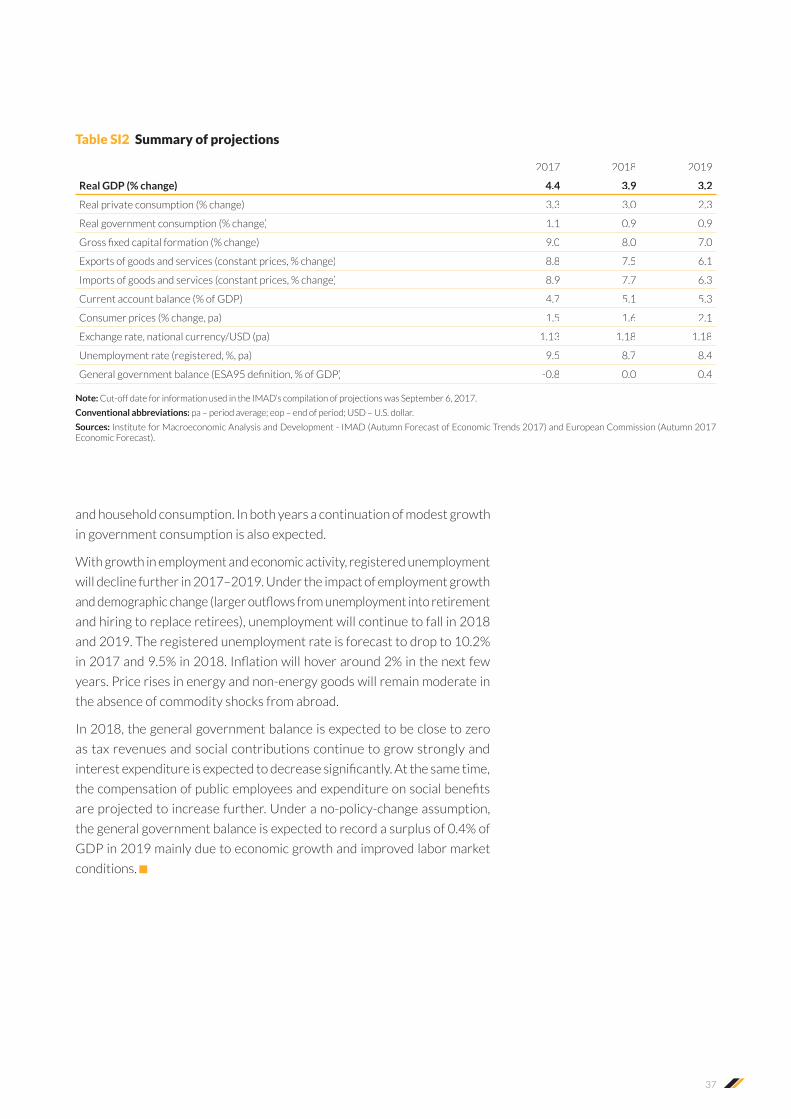
and household consumption. In both years a continuation of modest growth
in government consumption is also expected.
With growth in employment and economic activity, registered unemployment
will decline further in 2017–2019. Under the impact of employment growth
and hiring to replace retirees), unemployment will continue to fall in 2018
and 2019. The registered unemployment rate is forecast to drop to 10.2%
years. Price rises in energy and non-energy goods will remain moderate in
the absence of commodity shocks from abroad.
In 2018, the general government balance is expected to be close to zero
as tax revenues and social contributions continue to grow strongly and
are projected to increase further. Under a no-policy-change assumption,
the general government balance is expected to record a surplus of 0.4% of
GDP in 2019 mainly due to economic growth and improved labor market
conditions.
Table SI2 Summary of projections
2017 2018 2019
Real GDP (% change) 4.4 3.9 3.2
Real private consumption (% change) 3.3 3.0 2.3
Real government consumption (% change) 1.1 0.9 0.9
9.0 8.0 7.0
Exports of goods and services (constant prices, % change) 8.8 7.5 6.1
Imports of goods and services (constant prices, % change) 8.9 7.7 6.3
Current account balance (% of GDP) 4.7 5.1 5.3
Consumer prices (% change, pa) 1.5 1.6 2.1
Exchange rate, national currency/USD (pa) 1.13 1.18 1.18
Unemployment rate (registered, %, pa) 9.5 8.7 8.4
-0.8 0.0 0.4
Note: Cut-off date for information used in the IMAD’s compilation of projections was September 6, 2017.
Conventional abbreviations: pa – period average; eop – end of period; USD – U.S. dollar.
Sources: Institute for Macroeconomic Analysis and Development - IMAD (Autumn Forecast of Economic Trends 2017) and European Commission (Autumn 2017 Economic Forecast).

38
The nationalcompetitiveness andlabor market ef ciency in SEE-6 countries Launched in 1979, the World Economic Forum’s Global Competitiveness
Index (GCI) measures the factors that drive long-term growth and prosperity.
the set of institutions, policies, and factors that determine the level of productivity of an economy, which in turn is the main yydeterminant of long-term growth and prosperity. It helps policymakers
identify challenges to be addressed and strengths to build on when designing
the economic growth strategies for their countries.
The World Economic Forum bases its competitiveness analysis on a
comprehensive framework measuring microeconomic and macroeconomic
foundations of national competitiveness, grouped into 12 pillars: institutions,
infrastructure, macroeconomic environment, health and primary education,
sophistication, and innovation. These pillars are in turn organized into three
sophistication factors. The three subindexes are given different weights in
the calculation of the overall Index, depending on each economy’s stage of
development.
A N A L Y S I S
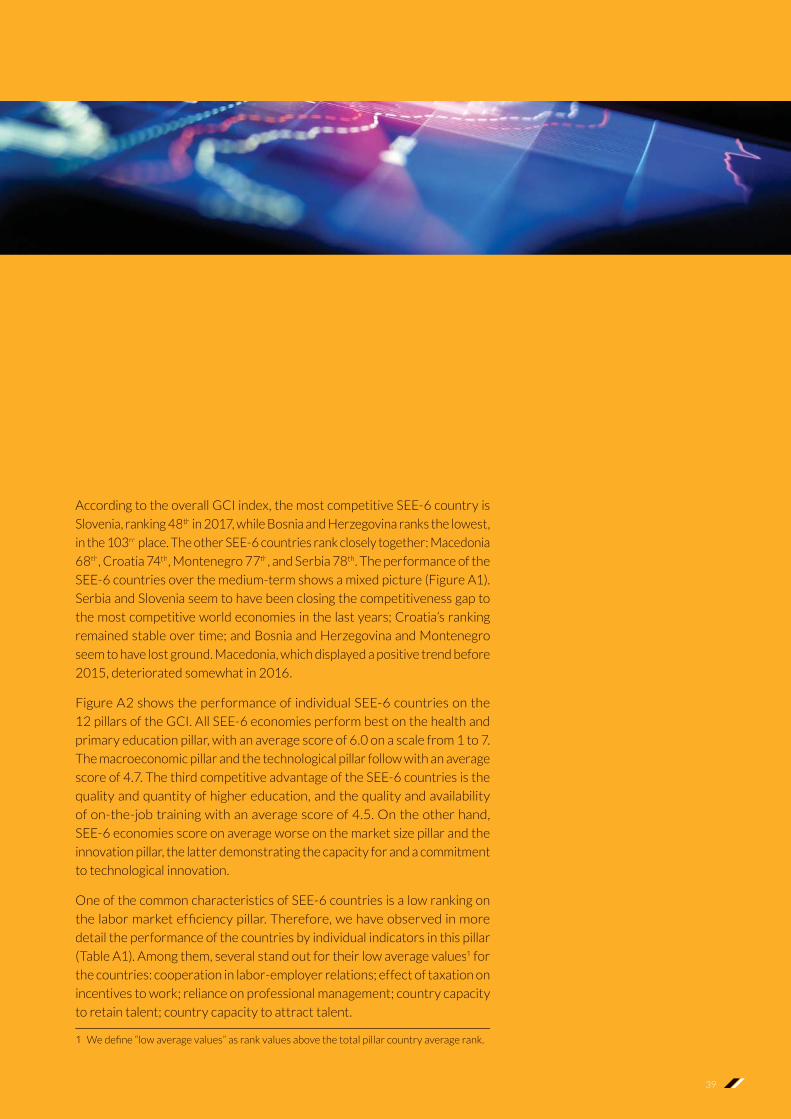
39
According to the overall GCI index, the most competitive SEE-6 country is
Slovenia, ranking 48th in 2017, while Bosnia and Herzegovina ranks the lowest,
in the 103rd place. The other SEE-6 countries rank closely together: Macedonia
68th, Croatia 74th, Montenegro 77th, and Serbia 78th. The performance of the
SEE-6 countries over the medium-term shows a mixed picture (Figure A1).
Serbia and Slovenia seem to have been closing the competitiveness gap to
the most competitive world economies in the last years; Croatia’s ranking
remained stable over time; and Bosnia and Herzegovina and Montenegro
seem to have lost ground. Macedonia, which displayed a positive trend before
2015, deteriorated somewhat in 2016.
Figure A2 shows the performance of individual SEE-6 countries on the
12 pillars of the GCI. All SEE-6 economies perform best on the health and
primary education pillar, with an average score of 6.0 on a scale from 1 to 7.
The macroeconomic pillar and the technological pillar follow with an average
score of 4.7. The third competitive advantage of the SEE-6 countries is the
quality and quantity of higher education, and the quality and availability
of on-the-job training with an average score of 4.5. On the other hand,
SEE-6 economies score on average worse on the market size pillar and the
innovation pillar, the latter demonstrating the capacity for and a commitment
to technological innovation.
One of the common characteristics of SEE-6 countries is a low ranking on
detail the performance of the countries by individual indicators in this pillar
(Table A1). Among them, several stand out for their low average values1 for
the countries: cooperation in labor-employer relations; effect of taxation on
incentives to work; reliance on professional management; country capacity
to retain talent; country capacity to attract talent.

40
A N A LY S I S
Retaining and attracting talent are the most problematic elements of theth or lower
in the value of this indicator. It seems that the incentives to work in all SEE-6
into their improvement. Problems in the cooperation in labor-employer
relations are much less pronounced in Slovenia and Macedonia, while they are
very problematic in Croatia. On the other hand, Macedonia and Montenegro
have a much lower negative effect of taxation on incentives to work while
the opposite holds for Croatia, Serbia and, in particular, Slovenia.
Figure A1 The GCI rankings of SEE-6 countries in the period 2012–2013 to 2017–2018
Source: WEF; The Global Competitiveness Report 2017–2018 and earlier editions.
Notes: Bosnia and Herzegovina not included in 2014–15; Macedonia not included in 2017–18.
Figure A2 The performance of SEE-6 countries on the 12 pillars of the GCI – scores, 2017–2018
Source: WEF; The Global Competitiveness Report 2017–2018 (www.weforum.org/reports/the-global-competitiveness-report-2017-2018).
Note: Note: Macedonia 2016–17.
WEF Global Competitiveness Index overall rank–
1
21
41
61
81
101
121
141
161
2012–13 2013 14– 2014 15– 2015 16– 2016 17– 2017 18–
Macedonia
Slovenia
Croatia
Montenegro
Serbia
Bosnia and Herzegovina
No. of GCI countries
Institutions
Infrastructure
Macroeconomic environment
Health and primary education
Higher education and training
Goods market efficiency
Labor market efficiency
Financial market development
TechnologicalTT readiness
Market size
Business sophistication
Innovation
1.01.0
2.002.0
3.0.003.03 033.0
4.0.04.0
5.0.0
6.0.0
7.0.0
Macedonia
Slovenia
Croatia
Montenegro
Serbia
Bosnia and Herzegovina

41
Bo
snia
an
d
Her
zego
vin
aC
roat
iaM
aced
on
ia, F
YR
Mo
nte
neg
roSe
rbia
Slov
enia
Tota
l - a
vera
ges
Ran
kV
alu
eR
ank
Val
ue
Ran
kV
alu
eR
ank
Val
ue
Ran
kV
alu
eR
ank
Val
ue
Ave
rage
ra
nk
Med
ian
ra
nk
Ran
kst
d.d
ev.
7th
pill
ar: L
abo
r m
arke
tef
cien
cy1
23
3.5
10
73
.89
54
.07
44
.29
24
.08
24
.19
5.5
09
3.5
01
7.5
8
7.0
1 C
oo
pera
tio
n in
lab
or-
empl
oyer
rel
atio
ns1
17
3.8
13
53
.48
14
.31
00
4.0
10
54
.06
24
.41
00
.00
10
2.5
02
5.8
6
7.0
2 F
lexi
bili
ty o
f wag
ed
eter
min
atio
n2
65
.56
64
.91
18
4.1
55
5.1
40
5.3
10
74
.46
8.6
76
0.5
03
6.7
1
prac
tice
s1
05
3.3
13
12
.63
94
.27
33
.78
03
.61
32
2.4
93
.33
92
.50
36
.31
7.0
4 R
edu
nd
ancy
co
sts
26
9.2
63
15
.14
71
3.0
41
11
.21
87
.73
91
0.7
39
.00
40
.00
15
.84
7.0
5 E
ffec
t o
f tax
atio
n o
nin
cen
tive
s to
wo
rk1
23
3.0
13
32
.65
14
.16
74
.01
25
2.9
13
52
.31
05
.67
12
4.0
03
6.7
8
7.0
6 P
ay a
nd
pro
du
ctiv
ity
12
73
.01
01
3.5
48
4.3
76
3.8
68
3.9
77
3.8
82
.83
76
.50
27
.55
7.0
7 R
elia
nce
on
pr
ofe
ssio
nal
man
agem
ent
13
13
.01
01
3.7
11
03
.69
93
.71
28
3.3
69
4.2
10
6.3
31
05
.50
22
.66
7.0
8 C
ou
ntr
y ca
paci
ty t
o
reta
in t
alen
t1
35
1.8
13
12
.11
15
2.7
10
03
.01
34
1.8
93
3.1
11
8.0
01
23
.00
18
.29
7.0
9 C
ou
ntr
y ca
paci
ty t
o
attr
act
tale
nt
13
61
.61
35
1.8
12
82
.21
07
2.6
13
22
.01
14
2.5
12
5.3
31
30
.00
12
.03
7.1
0 F
emal
e pa
rtic
ipat
ion
in t
he
lab
or
forc
e1
10
0.6
35
00
.87
99
0.6
77
60
.79
79
0.7
72
70
.97
3.5
07
7.5
03
0.7
7
Sou
rce:
WE
F, T
he
Glo
bal
Co
mpe
titi
ven
ess
Rep
ort
20
17
-20
18
(ww
w.w
efo
rum
.org
/rep
ort
s/th
e-gl
ob
al-c
om
peti
tive
nes
s-re
port
-20
17
-20
18
), O
wn
cal
cula
tio
ns.
No
te: M
aced
on
ia 2
01
6-1
7. I
n y
ello
w: p
rob
lem
atic
ind
icat
ors
.
Tab
le A
1 T
he
per
form
ance
of S
EE-6
co
un
trie
s o
n t
he
lab
or
mar
ket
efci
ency
pil
lar

42
A N A LY S I S
Bosnia and Herzegovina scores best on health and primary education (56th),
macroeconomic environment (64th), and technological readiness (69th). While
in terms of macroeconomic environment it scores extremely high (15th) on
the Government Budget balance. As for the technological readiness, it scores
below the 100th place in FDI and technology transfer. Bosnia and Herzegovina
scores worst in terms of institutions (126th th),rd), and innovation (123rd). In terms of labor market
th)
and redundancy costs (26th th place
in all other indicators in this pillar. Bosnia and Herzegovina is an example of a
developing country—it aims high in readiness for innovation and some basic
characteristics of macroeconomic and social environment while scoring low
Croatia
all indicators. It achieves its best positions in infrastructure (48th), health and
primary education (44th), and technological readiness (43rd). Its worst positions
(below the 100th place) are in institutions (102nd
(107th), and innovation (106th). In terms of individual indicators, it scores
extremely high in, e.g. quality of roads (19th) and some health indicators like
HIV prevalence (1st), business impact of HIV/AIDS (5th), and business impact
of tuberculosis (11th
scores high in female participation in the labor force (50th). On the other
hand, it scores extremely low on cooperation in labor-employer relations
and attracting and retaining talent. Croatia’s main obstacle to growth seems
to be the poor quality of institutions.
Macedonia, FYR achieves a better position on the total GCI score than
Croatia. Its best positions lie in macroeconomic environment (44th), goods th th), and innovation
(51st —Macedonia
achieves the best position of all countries regarding the number of procedures
to start a business, 2nd in time to start a business and 3rd in total tax rate.
On the other hand, its drawbacks lie in health and primary education (92nd),th), and market size (110th). In terms of health and
primary education, its worst indicator is surely primary education enrolment
rate (127th
th), reliance
on professional management (110th), and in attracting (128th) and retaining
(115th) talent. In total, Macedonia seems to be a country with high aspirations,
very competitively oriented, but lagging in some basic characteristics like
market size and labor, including education.
Montenegro and Serbia stand almost the same in the levels of total GCI score
and are slightly below the half of the total distribution. Montenegro scores
the best in the levels of health and primary education (62nd), higher education

43
and training (61st th) and
technological readiness (48th). Among the individual indicators, HIV prevalence
(joint 1st with Croatia, Serbia, and Slovenia), mobile/cellular telephone
subscriptions (7th), and legal rights index (1st) stand out. But distribution of
scores for individual indicators is extremely uneven in Montenegro which
means that the country enjoys a rather uneven scope of development.
Among the drawbacks, macroeconomic environment (116th), market size
(128th), and business sophistication (101st) stand out. In Montenegro, labor
Serbia enjoys a similar position as Montenegro in terms of total position in the
GCI score. In terms of individual pillars, health and primary education (52nd) and
higher education and training (59th) stand out in particular. Macroeconomic
environment and technological readiness (both 72nd) are slightly higher
than most of other pillars for Serbia. In terms of individual indicators, again,
HIV prevalence is extremely low (1st), while the country scores very highst) and redundancy labor costs (18th). Among the country
drawbacks, institutions (104th th), and bothth) stand out.
Just like in Montenegro, development seems quite uneven in Serbia—while
having extremely low redundancy labor costs, several other labor market
professional management (128th), and country’s capacity to attract (132nd)
and retain (134th) talent.
Slovenia enjoys the best overall position (48th
development, where it scores 106th, it scores below the 100th rank in all other
aspects. Its strongest points are in health and primary education (14th) and
higher education and training (24th), with technological readiness (35th), and
innovation (35th) being very high as compared to other SEE-6 countries. Its
high position in health and primary education is due to low HIV prevalence
(joint 1st), infant mortality (7th) and indicators related to tuberculosis, while
its high position in higher education and training is due to high values in the
indicators of quality of math and science education (11th), tertiary education
enrolment rate (14th), and secondary education enrolment rate (19th). Its mainnd
(106th) and market size (82nd
nd), and the effect of taxation
on incentives to work (135th). The labor market in Slovenia is rigid, and some
other indicators like foreign ownership and effect of taxation on incentives
to invest score are also low. Slovenia is a well-developed country, but scoring
improve if it wants to provide a more competitive environment in the future.

Vol. 4 / No. 1 / March 2018 / e-ISSN 1849-8884 / ISSN 1849-8817
PUBLISHER INFORMATIONThis publication has been prepared by:
Editor: Duško Bodroža,
Institute of Economic Sciences, Belgrade
Bosnia and Herzegovina: Mirza Huskić,
The Institute of Economics Sarajevo
Croatia: Sandra Švaljek,
The Institute of Economics, Zagreb
Macedonia: Tatjana Petkovska-Mirchevska
(team leader), Iskra Stancheva-Gigov
(coordinator), Biljana Angelova, Verica
Janeska, Snezana Kostadinoska-Miloseska,
Klimentina Poposka, Elizabeta Dzambaska,
Aleksandra Lozanoska and Vladimir
Petkovski, The Institute of Economics –
Skopje, University “SS. Cyril and Methodius”
Montenegro: Milica Muhadinović, Vladimir
Đurišić, Milica Vukčević, The University
of Montenegro, Faculty of Economics in
Montenegro
Serbia: Jelena Minović (coordinator),
Aleksandar Zdravković, Kosovka
Ognjenović, Duško Bodroža, Aleksandra
Branković, Mihajlo Đukić, Institute of
Economic Sciences, Belgrade
Slovenia: Andrej Srakar, Sonja Uršič,
Institute for Economic Research, Ljubljana
Analysis: Andrej Srakar, Sonja Uršič,
Institute for Economic Research, Ljubljana
Publishers:
Institute of Economic Sciences,
Belgrade
Zmaj Jovina 12, 11000 Belgrade, Serbia
The Institute of Economics, Zagreb
Trg J. F. Kennedyja 7, 10000 Zagreb,
Croatia
The Institute of Economics Sarajevo
Branilaca Sarajeva 47, 71000 Sarajevo,
Bosnia and Herzegovina
The Institute of Economics – Skopje,
University “SS. Cyril and Methodius”
Prolet 1, 1000 Skopje, Macedonia
The University of Montenegro,
Faculty of Economics Podgorica
Jovana Tomaševića 37, 81000 Podgorica,
Montenegro
Institute for Economic Research,
Ljubljana
Kardeljeva ploščad 17, 1000 Ljubljana,
Slovenia
For the publishers:
Jovan Zubović
Maruška Vizek
Muamer Halilbašić
Zoran Janevski
Nikola Milović
Boris Majcen
E-mail: [email protected]
Technical editor: Vladimir Sukser
Print: Donat graf d.o.o, Grocka, Serbia
SEE-6 Economic Outlook is published twice
a year (Spring and Autumn edition).
Copyright © 2018 Institute of Economic Sciences,Belgrade /// The Institute of Economics, Zagreb //The Institute of Economics Sarajevo /// The Institute of Economics Skopje, University “SS. Cyril and Methodius” /// The University of Montenegro, Faculty of EconomicsPodgorica /// Institute for Economic Research, Ljubljana