BOROUGH OF KENILWORTH MASTER PLAN · 2 Borough of Kenilworth 2011 Master Plan PLANNING BOARD...
78
BOROUGH OF KENILWORTH MASTER PLAN February 2011
Transcript of BOROUGH OF KENILWORTH MASTER PLAN · 2 Borough of Kenilworth 2011 Master Plan PLANNING BOARD...
BOROUGH OF KENILWORTH
MASTER PLAN
February 2011
2
Borough of Kenilworth 2011 Master Plan
PLANNING BOARD Anthony Lepore, Chair
Richard Picerno, Vice Chair
Madonna Bogus, Secretary
Kathi Fiamingo, Mayor
Sal Candarella, Councilman
Rudy Cammarota, Mayor’s Designee
Nicholas Pantina, Class IV
Anthony Pugliese, Class IV
Marty Sica, Class IV
Antonio Cuppari, Alternate
Arthur Manee, Alternate
Timothy Murphy, Alternate
MASTER PLAN SUBCOMMITTEE Anthony Lepore, Chair
John Beninati
Sal Candarella
Regina Hrynkiewicz
Fred Pugliese
MAYOR Kathi Fiamingo
BOROUGH COUNCIL Brian Joho, President
Sal Candarella
Scott Klinder
Kevin Leary
Fred Pugliese
Toncia Sosnosky
Draft 19 KEN MP names 022511
3
Borough of Kenilworth 2011 Master Plan
STAFF
Hedy Lipke, Borough Clerk
Kathleen Moschitta, Deputy Clerk
Ellen Johns – Planning Administrator
Harvey Fruchter, Esq. – Borough Attorney
Richard O’Connor, P.E. – Borough Engineer
Kevin O’Brien, P.P. – Borough Planner
Michael Tripodi, Esq. – Board Attorney
Janet Murphy – Board Recording Secretary
The Master Plan Subcommittee and the Planning Board acknowledge
with thanks and gratitude the municipal agencies, officials, employees
and volunteers who gave willingly of their time and expertise.
Prepared by:
Kevin O’Brien, NJ P.P. License 5348
Shamrock Enterprises, Ltd.
Rahway, NJ 07065 732/388-4765
Richard O’Connor, NJ P.E. License 33029, NJ P.P. License 4254
Edward Bogan NJ P.E. License 22260, NJ P.P. License 1662
Grotto Engineering Associates
Cranford, NJ, 07016 908/272-8901
The original of this document was signed and sealed in accordance with N.J.A.C.
13:41-1.3(b) and is on file with the Borough of Kenilworth Planning Board.
4
Borough of Kenilworth 2011 Master Plan
RESOLUTION OF THE PLANNING BOARD OF THE BOROUGH OF KENILWORTH, UNION COUNTY, NEW JERSEY, ADOPTING THE “BOROUGH OF KENILWORTH MASTER PLAN” DATED ________ 2011
WHEREAS, N.J.S.A. 40:55D-28 authorizes a municipal planning board to prepare and, after public hearing, adopt or amend a master plan or components thereof; and WHEREAS, the Planning Board of the Borough of Kenilworth, Union County, State of New Jersey (the ―Planning Board‖), adopted the Borough’s current Master Plan in 1996, which was subsequently readopted and reexamined by the Planning Board; and WHEREAS, during 2009, the Planning Board determined that the Master Plan required a comprehensive review and revision in its entirety; and WHEREAS, the Planning Board prepared a new Master Plan entitled, ―Borough of Kenilworth Master Plan‖ dated 2011 with the assistance of Borough Planner Kevin O’Brien and Borough Engineer Richard O’Connor which has been the subject of discussion at six (6) public meetings of the Planning Board; and WHEREAS, a subcommittee was appointed to assist with the preparation of the Master Plan, which included having six (6) meetings and performing numerous specific tasks to prepare the Master Plan; and WHEREAS, the Master Plan includes a Land Use Element pursuant to N.J.S.A. 40:55D-28b (3) and a Housing Element pursuant to N.J.S.A. 40:55D-28b (3); and WHEREAS, the Planning Board had a public meeting on December 2, 2010 to allow the public input on the proposed Master Plan; and WHEREAS, upon notice duly provided pursuant to N.J.S.A. 40:55D-13, the Board scheduled public hearings on December 16, 2010 and February 24, 2011 for the proposed Master Plan; and WHEREAS, the Planning Board heard evidence from Borough Planner Kevin O’Brien and Borough Engineer Richard O’Connor in connection with the proposed Master Plan at the December 16, 2010 and February 24, 2011 public hearings; and
WHEREAS, the Planning Board provided the general public an opportunity to comment on the proposed Master Plan at the December 16, 2010 and February 24, 2011 public hearings; and
WHEREAS, at the conclusion of the public hearing, a motion to adopt the Master Plan was made, seconded and voted upon by the members of the Planning Board. NOW THEREFORE BE IT RESOLVED, that the Planning Board of the Borough of Kenilworth hereby adopts the document entitled, “―Borough of Kenilworth Master

5
Borough of Kenilworth 2011 Master Plan
Plan‖ dated 2011 as the Borough’s Master Plan in the form presented at the February 24, 2011 public hearing; and, BE IT FURTHER RESOLVED, that the Planning Board Secretary is directed to publish notice of this action in the manners prescribed by law, and that copies of this resolution and the adopted report be forwarded to the Union County Planning Board and the municipal clerks of the municipalities adjacent to the Borough of Kenilworth as provided by law. ________________________________ Anthony Lepore Chairman of Planning Board I, Madonna Bogus, Secretary of the Planning Board of the Borough of Kenilworth, in the County of Union, State of New Jersey, do hereby certify that this is a true copy of the resolution adopting the Master Plan, Borough of Kenilworth dated 2011 on 2011. _______________________________ Madonna Bogus Secretary of Planning Board

6
Borough of Kenilworth 2011 Master Plan
TABLE OF CONTENTS
Land Use Element of the Master Plan 7
I. Introduction to the Land Use Element 8
II. Overview of Kenilworth 9
III. Demographic Analysis 11
IV. The Master Plan 18
V. Goals and Objectives 22
VI. Existing Land Use and Zoning 26
VII. Proposed Land Use Zones 35
VIII. Proposed Zoning Strategies 41
Housing Element of the Master Plan 46
I. Introduction to the Housing Element 47
II. Organization of This Element 48
III. Housing Objectives 48
IV. Municipal Land Use Law Required Components 49
V. Conclusion 63
Statement of Plan Relationships 64
I. Introduction 65
II. Analysis of Surrounding Communities 65
III. Union County Plan 66
IV. Solid Waste Management Plan 67
V. The State Development and Redevelopment Plan 68
Appendix 1 Demographic Profile 69
Appendix 2 Maps 75
7
Borough of Kenilworth 2011 Master Plan
LAND USE ELEMENT OF THE MASTER PLAN
8
Borough of Kenilworth 2011 Master Plan
I. INTRODUCTION TO THE LAND USE ELEMENT
The people of Kenilworth love their community. One can see this love at the Annual
Street Fair on the Boulevard, at Little League or soccer games, at Brearley football
games, at gatherings at the historic Nitschke House, the Veterans Center and many
other community events.
This love for community is evident in the pride visible in the community in residential
areas and storefronts along the Boulevard. It is also evident in the participation of
citizens in community activities, such as the Fire Department, the Rescue Squad,
Borough Boards, government bodies and numerous community organizations.
Kenilworth is a town where young adults live in the same neighborhoods as their
parents and grandparents. It’s a community where everyone knows someone from
your family. It is that love for community and pride in Kenilworth that led the Borough
to write this Master Plan for our community.
The days of large manufacturers producing heavy industrial equipment in factories
that provided high paying steady employment within walking distance of cohesive
family oriented neighborhoods are in the past. The Kenilworth that existed during
World War II and the following golden years is no more.
Today Kenilworth is dealing with the economic reality of major global changes
including a declining industrial base and loss of good paying blue collar occupations.
As a result the industrial areas of the community are in decline while the residential
areas are thriving.
This Master Plan has been written to propose changes to our community that reflect
the world that we live in. It is our hope that our pride in Kenilworth will continue as
we make changes to improve our community and to pass along the Kenilworth that
we love to future generations.

9
Borough of Kenilworth 2011 Master Plan
II. OVERVIEW OF KENILWORTH
The Borough of Kenilworth is 2.08 square miles in area and is located in the center
of Union County, bordering Union Township, the Borough of Roselle Park, Cranford
Township and Springfield Township.
In 2000 there were 7,675 people and 2,117 families in Kenilworth. There were 2,926
housing units and 2,854 households in the Borough of which 28.6% had children
under the age of 18 living with them, 58.4% were married couples living together,
11.9% had a female householder with no husband present, and 25.8% were non-
families. 21.4% of all households were made up of individuals and 11.0% had
someone living alone who was 65 years of age or older. The average household size
was 2.69 persons and the average family size was 3.15 persons.
The Borough’s population included 20.8% under the age of 18, 6.9% from 18 to 24,
30.8% from 25 to 44, 23.3% from 45 to 64, and 18.2% who were 65 years of age or
older. The median age was 40 years.
The median income for a household in the Borough was $59,929, and the median
income for a family was $66,500. The per capita income for the Borough was
$24,343. About 1.9% of families and 2.0% of the population were below the poverty
line, including 2.2% of those under age 18 and 3.2% of those aged 65 or over.
The 2006 US Census estimated that there were 7,741 people in the Borough, an
increase of 66 people over the 2000 Census.
Kenilworth is a mature suburb in the New York City Metropolitan area. It is
accessible via the Garden State Parkway and US Route 22. Kenilworth Boulevard
(Union County Route 509) provides a major east west route between Elizabeth and
Westfield/Springfield.
A. History of Kenilworth
Kenilworth’s roots can be traced to a pre-Revolutionary farming community which
was acquired in the late 1800s by a group of real estate developers who initially
called the town New Orange. The area was renamed Kenilworth, after England’s
Kenilworth Castle and Sir Walter Scott’s novel, Kenilworth, and in 1907 was
incorporated as the Borough of Kenilworth.
Kenilworth was once home to such institutions as Upsala College and Kensington
Riding Academy. Kenilworth has attracted a number of famous visitors over the
years, including inventor Thomas A. Edison and renowned aviator Gen. James
Doolittle, who crashed his experimental plane in Kenilworth in 1929 while attempting
an emergency landing in foggy conditions. Doolittle credited the accident with
reinforcing his commitment to developing blind-landing instrumentation for all-
weather flying, one of his most significant aeronautical achievements.
10
Borough of Kenilworth 2011 Master Plan
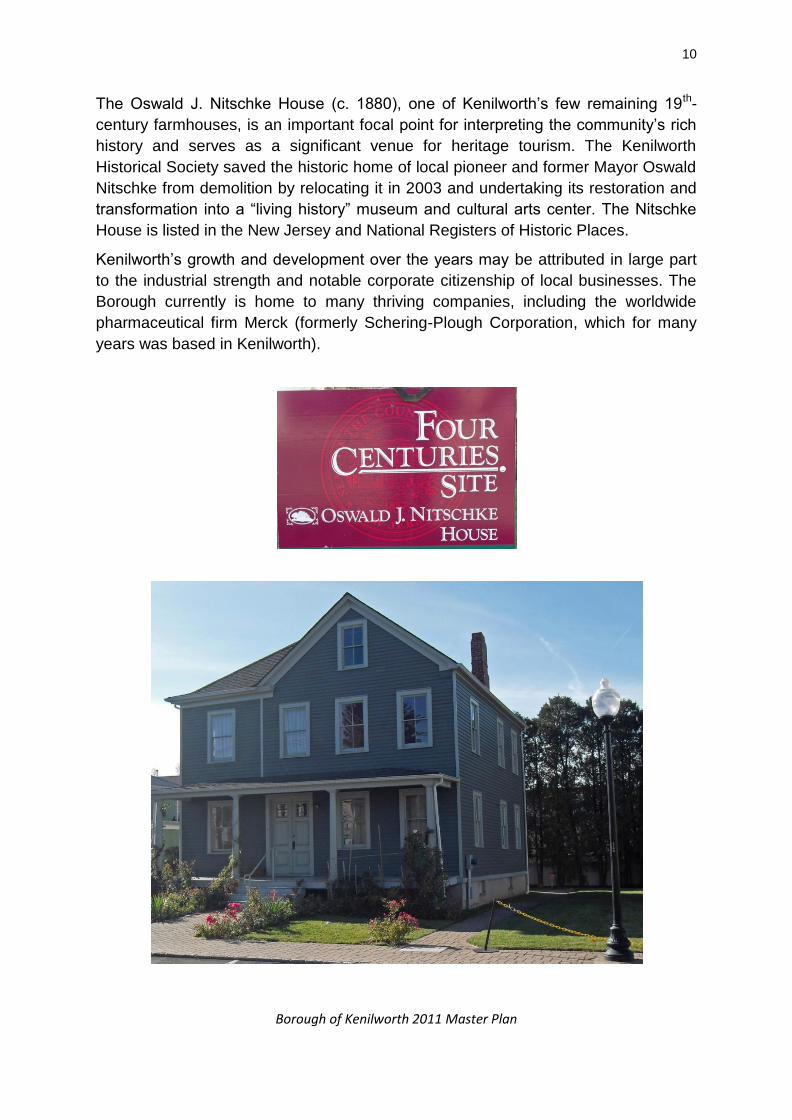
The Oswald J. Nitschke House (c. 1880), one of Kenilworth’s few remaining 19th-
century farmhouses, is an important focal point for interpreting the community’s rich
history and serves as a significant venue for heritage tourism. The Kenilworth
Historical Society saved the historic home of local pioneer and former Mayor Oswald
Nitschke from demolition by relocating it in 2003 and undertaking its restoration and
transformation into a ―living history‖ museum and cultural arts center. The Nitschke
House is listed in the New Jersey and National Registers of Historic Places.
Kenilworth’s growth and development over the years may be attributed in large part
to the industrial strength and notable corporate citizenship of local businesses. The
Borough currently is home to many thriving companies, including the worldwide
pharmaceutical firm Merck (formerly Schering-Plough Corporation, which for many
years was based in Kenilworth).
11
Borough of Kenilworth 2011 Master Plan
III. DEMOGRAPHIC ANALYSIS
This section of the Master Plan discusses the demographic conditions of Kenilworth by
analyzing the results of the 2000 US Census of Housing and Population for variety of
social and economic factors. The analysis provides an overview of demographic and
economic conditions in existence in 2000. While the information is dated, it is helpful
in considering the current status of the Borough’s economic health.
All of the data below is based upon the Demographic Profile of Kenilworth in
Appendix 1, which is based on the 2000 US Census and the 2003 Kenilworth Smart
Growth Plan. While the 2010 Census data is expected to be substantially similar to
the enclosed information, it is the intention of the Planning Board to update this
Master Plan with Census generated data when it is available later in 2011.
A. Population
Kenilworth is a fully developed suburban community. Between 1980 and 1990 the
population of Kenilworth dropped from 8,221 to 7,574. However in the period
between 1990 and 2000, Kenilworth's population increased by 101 persons to 7,675
(See Table 1). During the last twenty years, the age distribution of Kenilworth has
shifted significantly. While the population under nine years old has remained
between 800 and 900, the population between 10 and 19 has declined from 1364 to
837 and the population between 20 and 34 declined from 1841 to 1489. On the
other hand, the population between 35 and 54 has increased from 1905 to 2350.
The population over 55 years old has remained relatively constant. The overall result
is that Kenilworth is evolving into an older, more mature community.
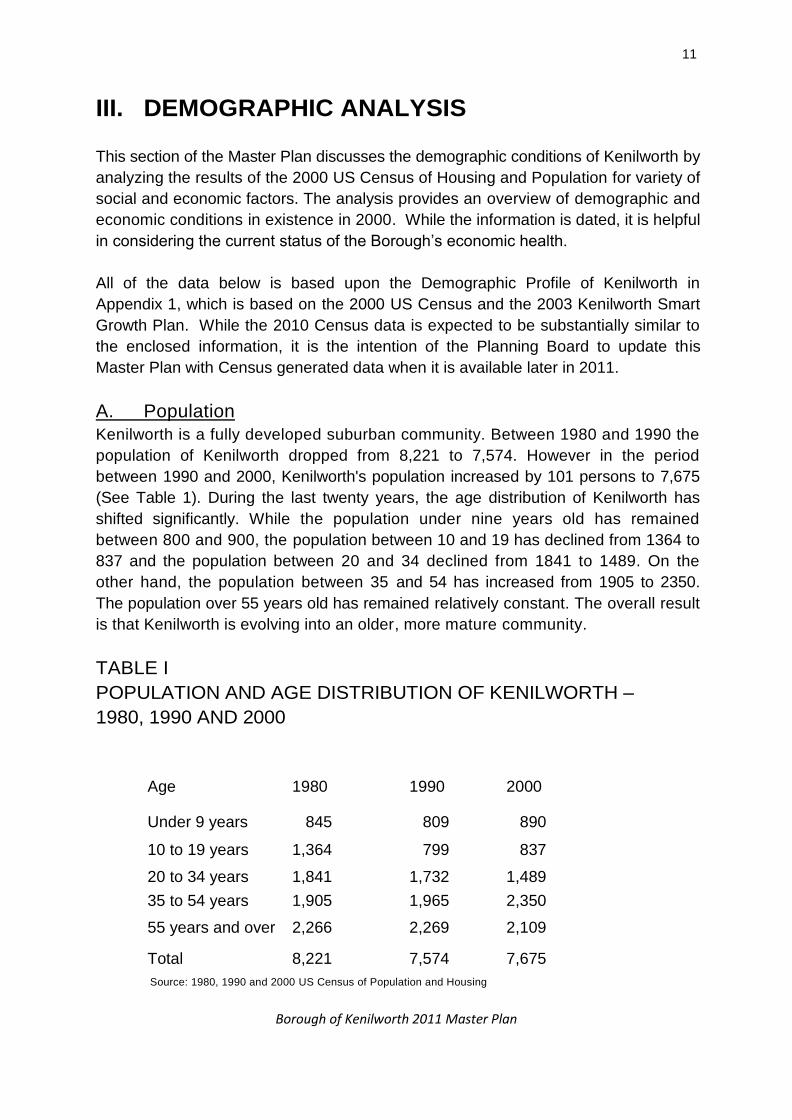
TABLE I
POPULATION AND AGE DISTRIBUTION OF KENILWORTH –
1980, 1990 AND 2000
Age 1980 1990 2000
Under 9 years 845 809 890
10 to 19 years 1,364 799 837
20 to 34 years 1,841 1,732 1,489
35 to 54 years 1,905 1,965 2,350
55 years and over 2,266 2,269 2,109
Total 8,221 7,574 7,675
Source: 1980, 1990 and 2000 US Census of Population and Housing
12
Borough of Kenilworth 2011 Master Plan
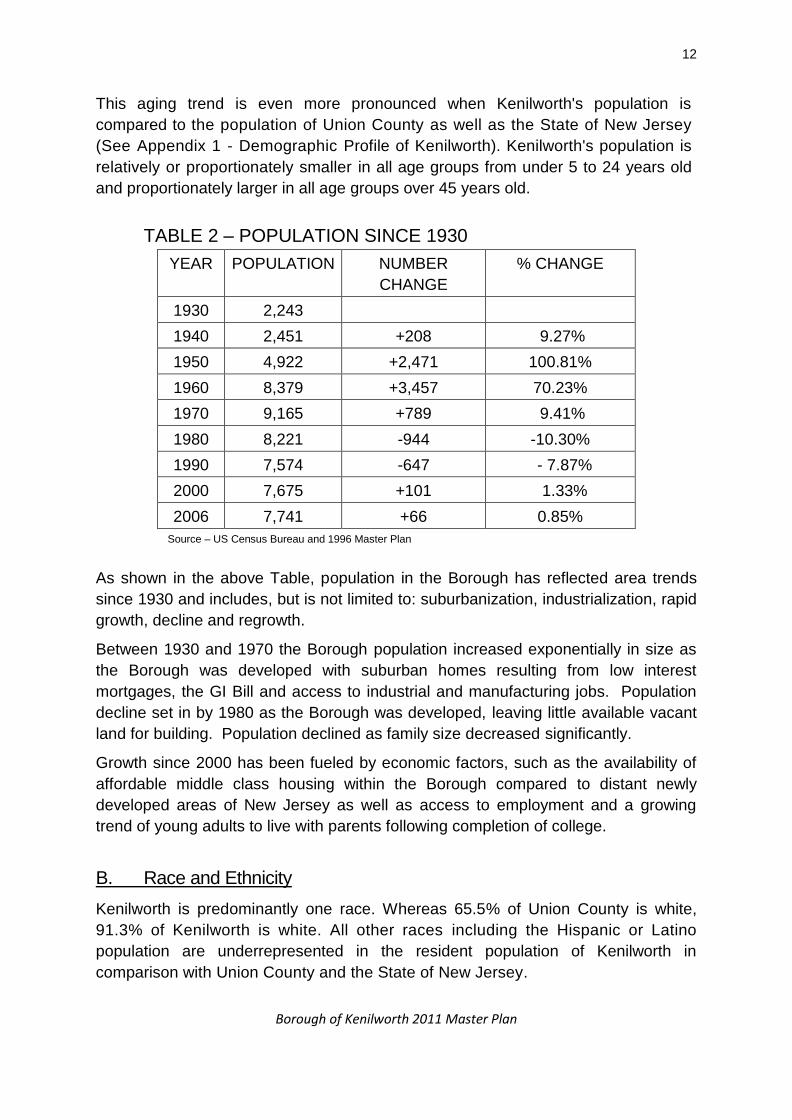
This aging trend is even more pronounced when Kenilworth's population is
compared to the population of Union County as well as the State of New Jersey
(See Appendix 1 - Demographic Profile of Kenilworth). Kenilworth's population is
relatively or proportionately smaller in all age groups from under 5 to 24 years old
and proportionately larger in all age groups over 45 years old.
TABLE 2 – POPULATION SINCE 1930
YEAR POPULATION NUMBER
CHANGE
% CHANGE
1930 2,243
1940 2,451 +208 9.27%
1950 4,922 +2,471 100.81%
1960 8,379 +3,457 70.23%
1970 9,165 +789 9.41%
1980 8,221 -944 -10.30%
1990 7,574 -647 - 7.87%
2000 7,675 +101 1.33%
2006 7,741 +66 0.85%
Source – US Census Bureau and 1996 Master Plan
As shown in the above Table, population in the Borough has reflected area trends
since 1930 and includes, but is not limited to: suburbanization, industrialization, rapid
growth, decline and regrowth.
Between 1930 and 1970 the Borough population increased exponentially in size as
the Borough was developed with suburban homes resulting from low interest
mortgages, the GI Bill and access to industrial and manufacturing jobs. Population
decline set in by 1980 as the Borough was developed, leaving little available vacant
land for building. Population declined as family size decreased significantly.
Growth since 2000 has been fueled by economic factors, such as the availability of
affordable middle class housing within the Borough compared to distant newly
developed areas of New Jersey as well as access to employment and a growing
trend of young adults to live with parents following completion of college.
B. Race and Ethnicity
Kenilworth is predominantly one race. Whereas 65.5% of Union County is white,
91.3% of Kenilworth is white. All other races including the Hispanic or Latino
population are underrepresented in the resident population of Kenilworth in
comparison with Union County and the State of New Jersey.

13
Borough of Kenilworth 2011 Master Plan
C. Household Types
A higher percentage of Kenilworth households are in married couple households
(58.4%) than is the case for the county or the state (52.6% and 53.5% respectively).
The percentage of female headed households is lower in Kenilworth (11.9%) than
the County (14.2%) or the State (12.8%). In addition, the percentage of non-
family households in Kenilworth (25.8%) is lower than the County (28.4%) or State
(29.7%) (See the Demographic Profile of Kenilworth).
However, the number of non-family households has greatly increased over the last
twenty years from 421 in 1980 to 737 in 2000. Kenilworth remains primarily a
traditional married couple community, but gradually Kenilworth is changing as has
the rest of the state toward non-traditional household types. In Kenilworth, the most
apparent non-traditional household type is that of seniors living alone (11.1%).
TABLE 3
CHANGE IN HOUSEHOLD TYPE IN KENILWORTH
1980, 1990 AND 2000
Households 1980 1990 2000
Family 2,330 2,216 2,117
Non-Family 421 584 737
Total 2,751 2,800 2,854
Source: 1980, 1990 and 2000 US Census of Population and Housing
D. Housing Occupancy and Tenure
Kenilworth has a housing stock of approximately 3,000 units. Of these, only 2.5%
are vacant, with a vacancy rate two-thirds lower than the State's. In addition,
78.1% of Kenilworth's housing stock is owner occupied. This percentage is
significantly higher than Union County (61.5%) and the State of New Jersey
(65.6%). Interestingly, the average household size of owner occupied units in
Kenilworth (2.73) is small than either the County (2.92) or the State (2.81). This
lower household size may reflect the growing number of married couples that are
often referred to as empty nesters since there are no children in the household.
E. School Enrollment and Educational Attainment
School enrollments in Kenilworth approximate those of the County and State with
three notable exceptions. First, nursery school or pre-school population is higher
than the County or State (9.2% of students versus 8.3% and 8.2% respectively).
14
Borough of Kenilworth 2011 Master Plan
Second, the kindergarten population is much lower than the County and State
(3.2% of students versus 5.7% and 5.5% respectively). Lastly, given that Kenilworth
is not a college town it is somewhat unexpected that a high percentage of students
are attending college or graduate school (22.8%) versus slightly lower figures for the
County and State (20.7% and 21.2% respectively). This data suggests that new
households with young children are forming or moving to Kenilworth as the older
residents leave and reflects the growth in the number of 0 to 9 year old children
between 1990 and 2000. The result is a large nursery school and preschool
population. The small kindergarten population may be an anomaly or may be the
tail end the last generation's child rearing years. The large number of college
students may be young adults living in their parent's home while attending school
(See Demographic Profile of Kenilworth).
The levels of educational attainment by Kenilworth residents are somewhat lower
than that of the County or the State. Only 15.5% of Kenilworth adults have college,
graduate or professional degrees, versus the County and State (28.5% and 29.8%
respectively). The majority of Kenilworth adults have completed high school and/or
attended some college (59.2%). The high percentage of residents who are attending
college suggests that a number of these students are the first generation to attend
college and that the next generation of Kenilworth residents will be better educated -
assuming the current students continue to reside in Kenilworth.
F. Marital Status
The marital status of Kenilworth residents is similar to that of the County and
State. However, Kenilworth has a slightly lower percentage of persons who had
never married (26.2% versus 29.2% and 28.1% respectively) and a slightly higher
percentage of persons who are now married and not separated (55.3% versus
53.4% and 54.6 % respectively). The major differences are that there are relatively
fewer persons who are separated in Kenilworth than the County or the State (0.8%
versus 2.6% and 2.4% respectively), the percentage of Kenilworth residents who are
widowed is higher than that of the County or the State (10.3% versus 7.7% and 7.4%
respectively), and the percentage of Kenilworth adults who are divorced is higher
than that of the County or the State (7.4% versus 7.1% and 4.5% respectively).
G. Residence in 1995
The residents of Kenilworth are much less likely to have moved in the last five
years than residents of the County or the State as a whole. A very high 70.1% of
Kenilworth's residents lived in the same house in 2000 as they had lived in 1995.
The comparable figure for the County was 60.8% and for the State it was 59.8%.

15
Borough of Kenilworth 2011 Master Plan
H. Language Spoken at Home
The percentage of persons in Kenilworth who speak English only in the home is
72.9% which falls between Union County which has a lower number of 68.4%
and the State of New Jersey which has a higher number of 74.5%. Of the persons
who speak a different language at home, Kenilworth significantly varies from the
County and the State. Most non-English speakers are Spanish speakers in both
Union County and the State of New Jersey. However, in Kenilworth unspecified
other Indo-European languages are more frequently spoken in the home (18.2%
of persons versus 6.9% of persons). Given that the 2000 Census reports that
32.9% of Kenilworth residents have Italian ancestry, 17.8% have German ancestry
and 13.7% have Polish ancestry, it would appear most likely that one or more of
these three groups include a large number of primarily non-English speakers.
I. Employment and Occupation
The labor force participation rate is the percentage of persons over 16 years old
and who are either employed or looking for work at that time. The Kenilworth labor
participation rate is 64.4% and is within one percentage point of the county and
state labor participation rates. In 2000, unemployment in Kenilworth was 2.9% —
a rate lower than the County (3.5%) and the State (3.7%).
The occupational distribution of Kenilworth residents differs significantly from Union
County and the State. The largest group of Kenilworth workers are involved in sales
and office occupations (31.3 %), whereas with the County and the State the largest
group was management, professional and related (35.4% and 38% respectively).
The next largest group in Kenilworth was management, professional and related
(30.5%), followed by service occupations (16.2%), production, transportation and
material moving (11.2%) and construction, extraction and maintenance (10.6%). A
larger percentage of Kenilworth workers are employed in sales and office, and
service and construction occupations than either Countywide or Statewide
workers.
J. Commuting to Work
The average travel time to work for Kenilworth based workers is 24.6 minutes —
four to six minutes less than either Union County or State residents. Kenilworth
workers are more likely to drive alone to work (85.5%) than their County and State
counterparts (71.0% and 73.0% respectively), and were less likely to carpool, use
public transportation, walk or work at home than County and State workers.

16
Borough of Kenilworth 2011 Master Plan
K. Industry and Class of Worker
The Kenilworth workforce is broadly distributed across most industries. The
industries with the heaviest concentration of jobs are educational, health and social
services (16.8% of the workers) and manufacturing (16.1%). No other industry
employs ten percent or more of Kenilworth workers. Industries that employ a
larger share at the County and the State level are educational, health, and social
services (16.8% versus 18.4% and 19.8% respectively), Retail trade (8.4% versus
10.2% and 11.3%), and professional, scientific, management and administrative
(9.7% versus 11.4% and 11.5%).
In Kenilworth, as with Union County and the State of New Jersey, over 80% of all
workers are private wage and salary workers. Between 12% and 14% of workers in
Kenilworth, Union County and the State of New Jersey work as government
employees and between 4.5% and 5.5% of Kenilworth, Union County and State of
New Jersey workers are self-employed.
L. Income and Poverty
Kenilworth per capita income in 2000 was $24,343, which was lower than Union
County ($26,992) and the State ($27,006). On the other hand the income figure
most commonly used by planners and economists is the median household or family
income. The median household income for Kenilworth was $59,929 in 2000 and
was higher than either the County ($55,339) or the State ($55,146). The median
family income in Kenilworth was $66,500 in 2000 and was higher than either the
county ($65,234) or the state ($65,370).
The distribution of income for Kenilworth resembles the county and state except
that there are a smaller percentage of Kenilworth households and families that
make less than $14,999 or more than $150,000. This suggests that Kenilworth is
very homogeneous with respect to income class. This finding is further
emphasized by the fact that a very low rate of poverty exists in Kenilworth.
Whereas 6.3 % of families in the County and the State live in poverty, only 1.9 % of
Kenilworth families live in poverty. With individuals, the spread between Kenilworth
and the County and State is even greater (2.0% versus 7.6% for both the County
and the State).
M. Summary
Kenilworth is a solid, middle class and homogeneous community with a strong
work ethic. The community's wage earners appear to be a little older, often in
their most productive earning years, and concentrated in manufacturing, retail,
transportation and services. Kenilworth residents are more stable with fewer
relocations than most communities and more likely to be in married families. The
17
Borough of Kenilworth 2011 Master Plan
strength of the community is demonstrated by its very low rate of poverty for families
and individuals.
The 2010 US Census figures are expected to be substantially similar to the
enclosed information. The Great Recession of 2008 has caused significant
economic displacement and a reduction in manufacturing and other labor intensive
economic activities. While these activities are not expected to return, the Borough
has seen an increase in the adaptive reuse of former industrial sites, as well as an
increase in employment at several sites.
Kenilworth is expected to remain a strong, thriving community in the foreseeable
future as the Borough, and its people, adapt to a new economic reality.
18
Borough of Kenilworth 2011 Master Plan
IV. THE MASTER PLAN
The Borough of Kenilworth Master Plan was last adopted in 1996. A Reexamination
of the Master Plan was conducted in 2001. Given the changes to the local and
national economy, the Mayor, Council and Land Use Board of the Borough
embarked upon the Master Plan process. This document will serve as a general
guide to the physical, economic and social development of the Borough over the next
six years and will promote and protect the public health, safety, morals and general
welfare of the Borough.
A. MASTER PLAN PREPARATION
This Master Plan seeks to update planning information in the Borough with regard to
demographics, land use, housing and the Plan's relationship to other applicable plans,
and includes a Land Use Plan Element, Housing Plan Element, and a comparison of
this Master Plan to those of adjacent municipalities, the County and the State
Development and Redevelopment Plan (SDRP). The current Borough of Kenilworth
Master Plan was adopted in 1996 and was reexamined in 2001. This document serves
as an update of the required portions of the municipal Master Plan.
This Master Plan was prepared in accordance with the provisions of the New Jersey
Municipal Land Use Law (N.J.S.A. 40:55D-28). The document is designed to guide
the development and redevelopment of lands within the Borough in a manner which
will promote and protect the public health, safety, morals and general welfare of
present and future residents of the Borough.
A comprehensive analysis of local and regional trends as well as an analysis of the
physical character of the community was guided by the Master Plan’s public
outreach process. The Mayor and Council believe that public involvement is critical
to successful planning. As such, the Master Plan provided the community with an
opportunity to voice comments on a wide range of issues. The identification of key
planning issues facing the Borough was the first step of the Master Planning
process. These key issues laid the foundation for the planning basis that established
the goals and objectives.
The Master Plan Subcommittee met throughout 2009 and early 2010 and worked
tirelessly on the Master Plan process. Additional meetings were held with the
Borough Mayor and Council as well as the Planning Board. In addition, public input
was solicited at four public hearings where a number of concerned citizens made
contributions.

19
Borough of Kenilworth 2011 Master Plan
B. THE MASTER PLAN PROCESS
The Master Plan provides a comprehensive guide for the future development and
preservation of key areas of a community. The key element in defining the difference
between a Master Plan and other planning studies is the Master Plan's comprehensive
approach to planning issues. The Master Plan considers many factors having an impact
on community life.
1. Requirements for Planning
The New Jersey Municipal Land Use Law Section 40:55D-28 (c.291, NJ 1975)
establishes the legal criteria for a Master Plan, and each community must be certain that
its plans comply with the legal requirements of the law. The following is a summary of
these requirements.
2. Preparation and Adoption
The responsibility for the preparation and adoption of the Master Plan rests with the
local Planning Board. A plan may be adopted (or amended) only by the Planning Board
and only after a public hearing. The Plan must be reviewed at least once every six
years.
3. Content
The Master Plan must include a statement of objectives upon which the Plan is based.
It must include a land use plan indicating: natural conditions, extent and intensity of land
to be used for varying types of future development, the location of existing or proposed
airports and airport hazard areas and a statement of recommended population density
and development intensity. A specific policy statement indicating the relationship of Plan
proposals to the plans of neighboring communities, the County and other appropriate
jurisdictions must also be included. A housing plan element to the Master Plan is also
required under section N.J.S.A. 40:55D-62 if the Borough’s zoning is to be held valid.
A Master Plan may also include the following elements: circulation plan, utility service
plan, recreation plan, conservation plan, economic plan, historic preservation plan and
recycling plan. The Municipal Land Use Law does not limit the number of plan
elements in a Master Plan, and a community is free to develop additional subplan
elements to meet its particular needs.
4. Enforcement and Implementation
After adoption by the Planning Board, the Master Plan gives the community the legal basis
for control over future development. The major means of implementation are as follows:

20
Borough of Kenilworth 2011 Master Plan
All of the provisions of a zoning ordinance, or any amendment or revision thereto
shall either be substantially consistent with the Land Use Element of the Master
Plan or designed to effectuate such plan element (N.J.S.A. 40:55D-62).
The location and design of new streets created through the process of land
subdivision or site plan approval may be required to conform to the provisions of
the circulation plan element of the Master Plan (N.J.S.A. 40:55D-38b(2)).
Where the Master Plan provides for the reservation of designated streets, public
drainage ways and flood control basins, or public areas, the Planning Board may require
that such facilities be shown and reserved in subdivisions and site plans in locations and
sizes suitable for their intended use. The reservation powers are effective for a period of
one year after approval of a final plan. The municipality must compensate the owner
for such action (N.J.S.A. 40:55D-44).
Whenever the governing body or other public agency proposes to spend public funds,
incidental to the location, character or extent of a capital project, such proposal must be
referred to the Planning Board for review and recommendation. No action shall be taken
without such recommendation or until 45 days have elapsed (N.J.S.A. 40:55D-31).
C. KEY ISSUES FACING THE BOROUGH
The Master Plan Subcommittee and the Planning Board suggested a number of issues that currently concern the members based upon their knowledge of the Borough and its inhabitants. These key issues include:
1. Increase senior housing opportunities.
2. Address the illegal conversion of single family residential units to two
family and multifamily units.
3. Improve the vitality of commercial areas.
4. Improve the look of storefronts along the Boulevard.
5. Promote use of renewable energy sources such as solar power.
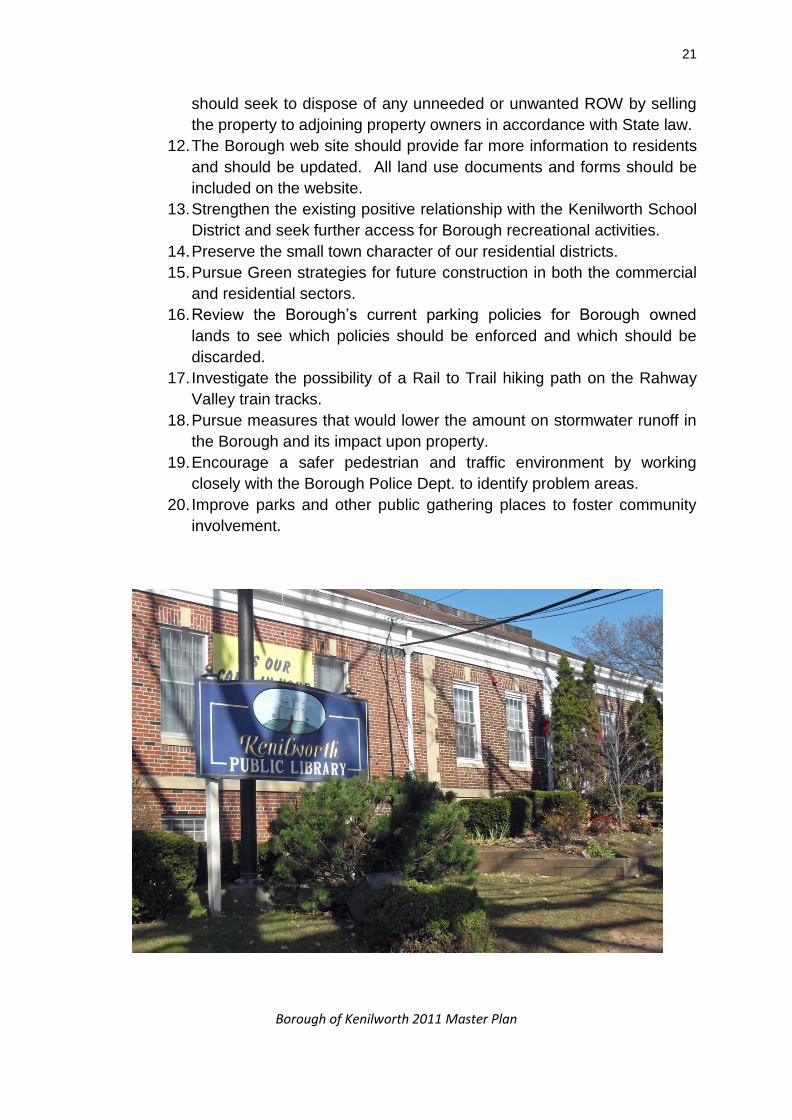
6. Increase the public awareness of community facilities such as the
Borough Library and the Nitschke house.
7. Address zoning standards that allow infill housing that is incompatible
with existing neighborhoods.
8. Specifically address the proper zoning designation for the Merck
(formerly Schering) campus.
9. Address the existing reality of nonconforming apartments above the
ground floor along the Boulevard between 20th and 24th Streets.
10. Address the economic vitality of struggling commercial areas by
increasing the range of allowed uses to include services and retail.
11. The Borough should investigate the illegal usage of Borough Rights of
Way (ROW) by adjoining property owners. If practicable, the Borough
21
Borough of Kenilworth 2011 Master Plan
should seek to dispose of any unneeded or unwanted ROW by selling
the property to adjoining property owners in accordance with State law.
12. The Borough web site should provide far more information to residents
and should be updated. All land use documents and forms should be
included on the website.
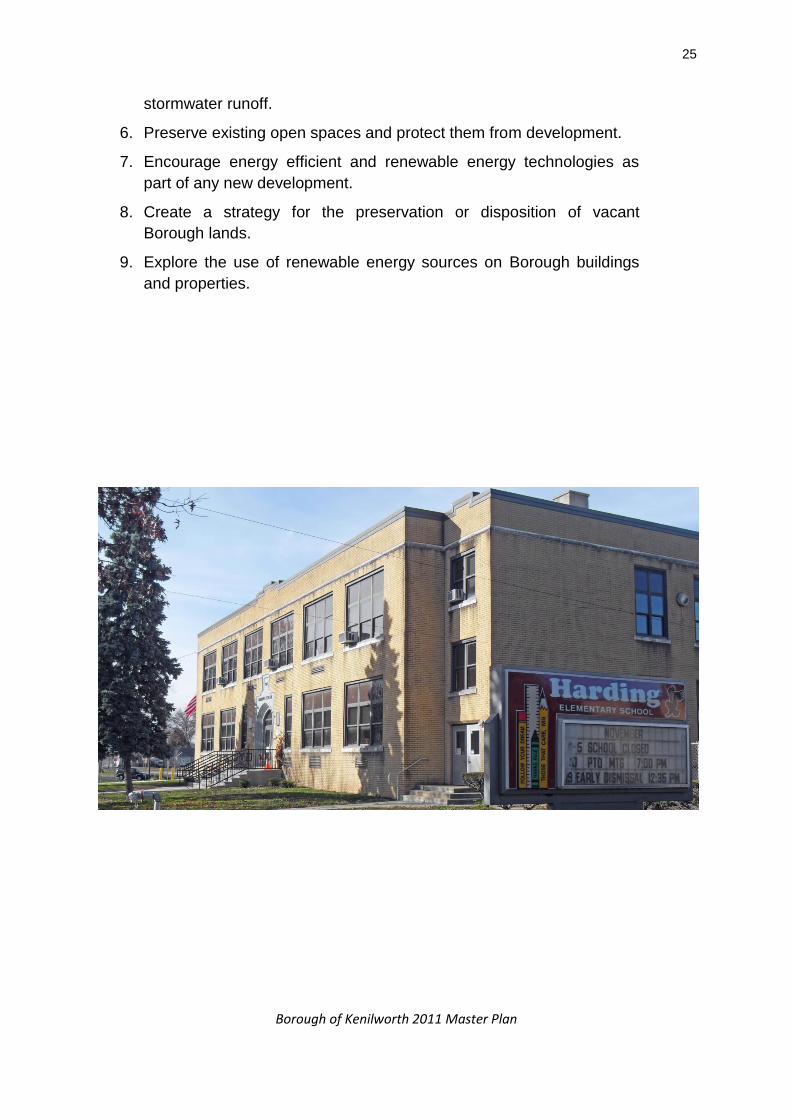
13. Strengthen the existing positive relationship with the Kenilworth School
District and seek further access for Borough recreational activities.
14. Preserve the small town character of our residential districts.
15. Pursue Green strategies for future construction in both the commercial
and residential sectors.
16. Review the Borough’s current parking policies for Borough owned
lands to see which policies should be enforced and which should be
discarded.
17. Investigate the possibility of a Rail to Trail hiking path on the Rahway
Valley train tracks.
18. Pursue measures that would lower the amount on stormwater runoff in
the Borough and its impact upon property.
19. Encourage a safer pedestrian and traffic environment by working
closely with the Borough Police Dept. to identify problem areas.
20. Improve parks and other public gathering places to foster community
involvement.
22
Borough of Kenilworth 2011 Master Plan
V. GOALS AND OBJECTIVES
The Municipal Land Use Law requires that all Master Plans contain a statement of
principles, assumptions, policies and standards upon which the future development
of the municipality are based. The Principles, Goals, Objectives and Development
Policy of the Borough Master Plan satisfy this requirement and provide the
foundation for the other components of the Master Plan.
A. RESIDENTIAL
1. Protect residential neighborhoods from nonresidential encroachments.
2. Preserve single family neighborhoods from any two family or multifamily
encroachment.
3. Permit sufficient residential opportunities, in locations with access to services,
to help the Borough’s senior residents age in place.
4. Allow opportunities for subsidized senior housing.
5. Ensure that new residential development is consistent with and compatible to
existing neighborhood character.
6. Encourage the preservation and maintenance of all residential properties.
7. Control the illegal conversion of single family homes into two family or
multifamily buildings through code enforcement.
B. INDUSTRIAL
1. Expand the allowed uses in the Industrial Zone to permit more economic
activity and generate employment opportunities.
2. Provide adequate infrastructure to meet the needs of industry.
3. Encourage the redevelopment of Brownfields sites.
4. Promote the growth of industrial uses by taking advantage of area
transportation infrastructure.
5. Promote Borough pride by upgrading the appearance of industrial areas.
6. Protect air and water quality and the quality of life in the Borough by enforcing
performance standards.
C. COMMERCIAL
1. Retain existing commercial establishments by fostering a positive regulatory
climate.
2. Strengthen the appearance of commercial districts by adopting design and
landscaping ordinances.

23
Borough of Kenilworth 2011 Master Plan
3. Encourage the development of the Borough’s economic base by expanded
the number of permitted uses to generate employment growth, increase
property values and promote the improvement of underutilized properties.
D. THE BOULEVARD – DOWNTOWN
1. Promote the economic vitality of the Downtown by adopting design and
landscaping ordinances.
2. Require that all visible facades of any building be aesthetically pleasing and
meet property maintenance standards.
3. Provide street furniture and streetscape elements to emphasize the
Boulevard-Downtown as a safe and convenient place to work and shop.
4. Adjust parking requirements along the Boulevard between 16th and 24th
Streets to encourage new economic activity.
5. Investigate the possibility of overnight parking for Boulevard residents in
municipal lots.
E. INFRASTRUCTURE
1. Continue to improve the Borough's infrastructure to better serve present
and future residents and the business community.
2. Maintain and improve the existing sanitary & storm sewer system.
3. Encourage sensitivity to the existing watershed by being a better
neighbor to our creeks and streams through cleanup efforts and
discouraging homeowner encroachments.
4. Encourage the New Jersey Turnpike Authority (NJTA) to improve
Interchange 138 of the Garden State Parkway by enhancing
stormwater drainage and improving visibility and geometry.
5. Support the County of Union in their efforts to place the East Coast
Bikeway within County Park property instead of along the Boulevard.
F. COMMUNITY
1. Maintain & improve Kenilworth’s character & identity by promoting
pride in the appearance of residential neighborhoods & commercial
areas.
2. Improve the aesthetic quality of the Borough's gateways through
the use of innovative design for development projects & welcoming
signage.
3. Provide adequate public facilities for the Borough’s citizens, including

24
Borough of Kenilworth 2011 Master Plan
schools, parks, library, open space, fire and police protection and solid
waste disposal.
4. Encourage the sharing of School District and Borough lands to provide
adequate recreation opportunities for all. Investigate the possibility of
establishing a joint recreation committee to oversee a joint recreation
facility established by the Borough and School District.
5. Preserve open space and protect natural, cultural and historic
resources.
6. Improve the development approval process by placing all zoning,
subdivision and land use procedures under one comprehensive land
development ordinance.
7. Continue to seek ways to expand shared services with adjoining
municipalities and the County of Union.
8. Review the current street closing apparatus for dead ends to insure
that they are safe and adequately marked.
9. Improve Public Safety by working closely with the Police and Fire
Departments and the Rescue Squad and promoting public support of
them.
10. Strive to enhance the quality of life for all of the Borough’s residents.
11. Encourage the establishment of a new dedicated building to house the
Community and Recreation Center.
12. Encourage the establishment of a new dedicated building to house
Public Safety Building to enhance public safety.
13. Investigate the complete renovation of Borough Hall once a Public
Safety Building is dedicated.
G. GREEN DEVELOPMENT
1. Institute tree planting programs and preserve existing trees and
landscaping to improve air quality and to preserve community
character.
2. Encourage sustainable development practices.
3. Promote Best Management Practices to improve local stormwater
drainage.
4. Continue the Borough’s membership in Sustainable New Jersey and
use their resources and programs to encourage sustainable
development.
5. Institute lot coverage regulations to minimize the amount of
25
Borough of Kenilworth 2011 Master Plan
stormwater runoff.
6. Preserve existing open spaces and protect them from development.
7. Encourage energy efficient and renewable energy technologies as
part of any new development.
8. Create a strategy for the preservation or disposition of vacant
Borough lands.
9. Explore the use of renewable energy sources on Borough buildings
and properties.

26
Borough of Kenilworth 2011 Master Plan
VI. EXISTING LAND USE AND ZONING
A. INTRODUCTION
The Land Use Element examines current development trends and sets a vision for
future development throughout the Borough. This Plan establishes a development
pattern for the Borough that considers characteristics such as existing land use
patterns, environmental characteristics, compatibility with the planning efforts of
adjacent municipalities and current and future land use demands.
This Land Use Element serves as a guide to achieve the goals and objectives
established by the Borough’s Master Plan efforts.
B. EXISTING LAND USE
The land use Table below shows how land in Kenilworth is currently utilized as
compared to previous calculations from 1996 and 1974.
TABLE 4 – LAND USE AREAS
USE TYPE 2010 acres
2010 % 1996 acres
1996 % 1974 acres
1974 %
Residential 365 27% 361 27% 398 30%
Commercial 83 6% 59 4% 50 4%
Industrial 294 22% 307 23% 219 16%
Public 71 5% 78 6% 64 5%
Transport Utilities
25 2% 25 2% 15 1%
Open Space 312 23% 302 22% 269 20%
Streets 185 14% 185 14% 185 14%
Total developed 1335 99% 1317 98% 1200 89%
Vacant 9 1% 27 2% 144 10%
Total Area 1344 100% 1344 100% 1344 100%
As shown in the table above, 27% of the Borough is dedicated to residential uses
while 28% is dedicated to commercial and industrial uses. Vacant land equals 1%,
reflecting a long term decline.
27
Borough of Kenilworth 2011 Master Plan
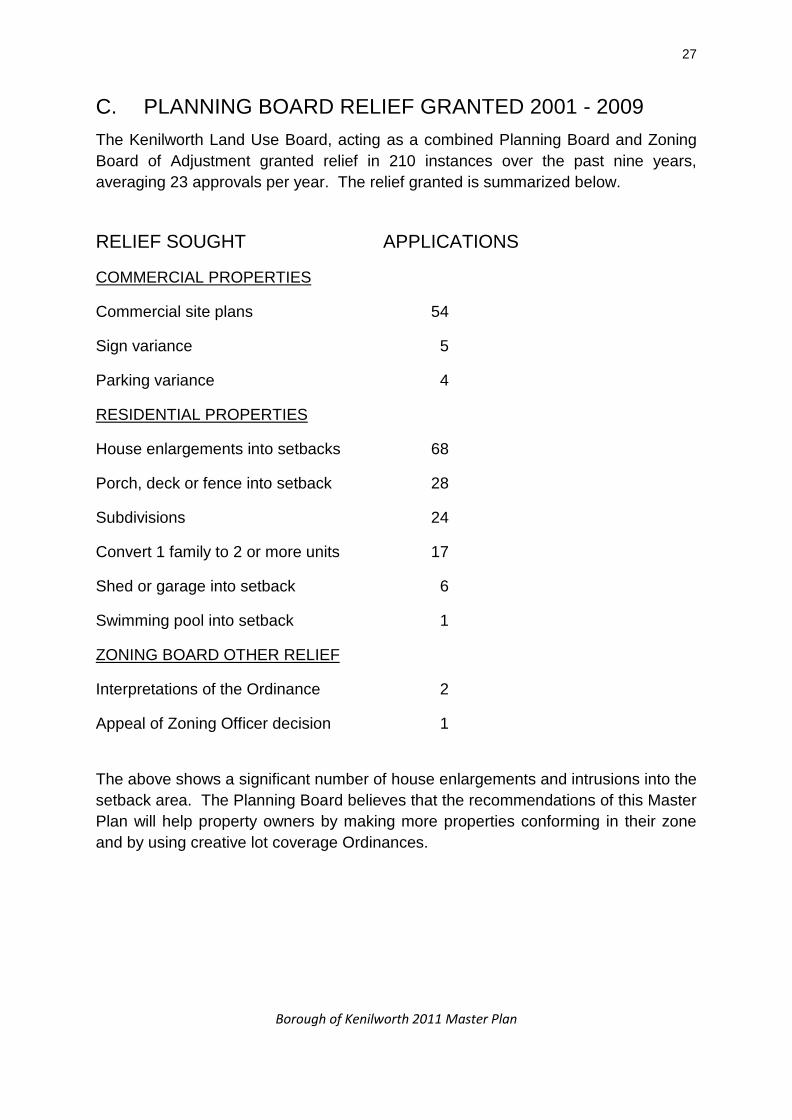
C. PLANNING BOARD RELIEF GRANTED 2001 - 2009
The Kenilworth Land Use Board, acting as a combined Planning Board and Zoning
Board of Adjustment granted relief in 210 instances over the past nine years,
averaging 23 approvals per year. The relief granted is summarized below.
RELIEF SOUGHT APPLICATIONS
COMMERCIAL PROPERTIES
Commercial site plans 54
Sign variance 5
Parking variance 4
RESIDENTIAL PROPERTIES
House enlargements into setbacks 68
Porch, deck or fence into setback 28
Subdivisions 24
Convert 1 family to 2 or more units 17
Shed or garage into setback 6
Swimming pool into setback 1
ZONING BOARD OTHER RELIEF
Interpretations of the Ordinance 2
Appeal of Zoning Officer decision 1
The above shows a significant number of house enlargements and intrusions into the
setback area. The Planning Board believes that the recommendations of this Master
Plan will help property owners by making more properties conforming in their zone
and by using creative lot coverage Ordinances.
28
Borough of Kenilworth 2011 Master Plan
D. EXISTING ZONING DISTRICTS
The Borough currently has nine Zoning Districts. These are listed below:
1. Residential 1 – R1
2. Residential 2 – R2
3. Residential 3 – R3
4. Boulevard Gateway - BGD
5. Local Commercial - LC
6. Special Commercial - SC
7. Commercial Industrial - CI
8. Industrial - I
9. Public Facility - PF
The above can be classified into four basic categories – residential, commercial,
industrial and public. These categories are described below.
1. Residential Zones
The Borough has four Residential Zone Districts – the R-1, R-2, R-3 and the
Boulevard Gateway (BGD) District.
The R-1 District is considered a low density zone allowing single family homes on a
minimum of 6,000 Square Foot (SF) lots. The R-1 Residential Zone is confined to
one area in the northern part of the Borough between Sheridan and Lafayette
Avenues centered on North 19th Street.
The R-2 District is also considered low density with single family homes permitted on
5,000 SF lots. The R-2 is the primary residential zone in the Borough with most of
the residentially zoned land within its boundaries throughout the community.
The R-3 District allows single family homes and two family homes on 5,000 SF lots.
The R-3 has a much smaller area and has five widely scattered areas zoned as
such.
The Boulevard Gateway District is a low density zone allowing single family homes
on a minimum of 7,500 SF lots and requiring 75 feet of frontage along the Boulevard.
The BGD is currently along the north side of the Boulevard between the Cranford
border and North 8th Street.
2. Commercial Zones
The Borough has three commercial zones: the LC – Local Commercial; the SC –
Special Commercial; and the CI – Commercial Industrial.
The LC Local Commercial District zone allows offices and retail sales in four zoned
areas including: the Boulevard from 18th Street to Market Street; the intersection of
29
Borough of Kenilworth 2011 Master Plan
North 14th Street and Monroe; and the intersections of Michigan Avenue and Fairfield
Avenue and Michigan Avenue and Faitoute Avenue.
The Special Commercial district allows offices, retail, supermarkets, banks, funeral
parlors, private schools, hotels and car washes. There is one area zoned S-C
centered on the Boulevard between Market Street and South 31st Street.
The Commercial Industrial District allows offices, sales and retail, financial
institutions, personal services and restaurants in six zoned areas. These are:
Michigan and Lexington Avenues; South 31st Street and the Boulevard; Galloping Hill
Road east of the Parkway; the Boulevard and North 26th Street; Route 22 and North
Michigan Avenue; and, Monroe Avenue between North 8th and North 13th Streets.
3. Industrial Zone
The I – Industrial Zone allows offices, recreation, warehouses, research laboratories
and manufacturing and industrial facilities in five areas of the Borough. These are:
the Merck (formerly Schering) property east of the Parkway; Market Street and
Passaic Avenue; the east side of Michigan Avenue near Jefferson and Federal
Avenues; Lafayette Avenue west of North 15th Street; and the area north of
Washington Avenue and west of North 14th Street.
4. Public Zone
The PF - Public Facility District allows public parks and recreational facilities,
cemeteries, as well as public and parochial schools. There are six PF zoned areas
in the Borough: the two cemeteries along Galloping Hill Road and the Boulevard; all
of the lands of the County Park System including Galloping Hill Park and Black Brook
Park; the Brearley School/Harding School property; and the Borough’s Di Mario
Park.

30
Borough of Kenilworth 2011 Master Plan
E. ENVIRONMENTAL CHARACTERISTICS
The presence of environmental constraints must be considered when developing a
Land Use Plan for a community. The location and types of environmental constraints
help guide the type, intensity and location of development due to local, County and
State requirements.
Due to its location, the Borough of Kenilworth contains a number of environmental
features, including topography, glacial influences, subsurface geology, soils, steep
slopes, wetlands, drainage and floodplains.
Union County and the Borough of Kenilworth lie entirely within the Piedmont Plains
sub-province of northern New Jersey. This sub-province of New Jersey is an area of
lowland with smooth, rounded hills separated by wide valleys sloping gently down to the
Coastal Plain. The source for the following information is the 1996 Master Plan.
1. Topography
The topography of the Borough of Kenilworth can best be described as
predominantly flat to gently sloping with some areas of rolling rounded hills.
Elevations within the Borough vary predominantly from approximately elevation 60 to
elevation 120. A maximum elevation of approximately 160 is located near the water
tower west of Michigan Avenue and north of Via Vitale.
2. Glacial Influences
In New Jersey, three ice advances affected the surface composition. The last ice age,
called the Wisconsin stage occurred about 10,000 years ago. Between ice advances,
warmer periods occurred during which the glaciers retreated leaving behind deposits of
various materials.
A 1967 Union County report of Physical Characteristics stated: "In Union County, the
termination and retreat of the Wisconsin ice advance can be readily seen in the low,
irregular hills of unsorted boulders, gravel, sand and fines, termed 'terminal moraine' or
'glacial marginal moraine'..."
3. Subsurface Geology
The geologic structure underlying the Borough - known as the Brunswick Formation -
formed during the Triassic period approximately 225 million years ago. It consists of
interblended deposits of soft red shale and sandstone laid down during a 10 million
year long period.
31
Borough of Kenilworth 2011 Master Plan
This formation reaches thicknesses ranging up to 8,000 feet below the ground surface.
Glacial deposits of gravel, sand and silt range to depths of several hundred feet over the
Brunswick Formation. Throughout large areas of Kenilworth, a medium to coarse
reddish brown sand overlays the Brunswick Formation of reddish brown shale. This
sand layer is found at a depth of 5 feet to 8 feet below grade.
4. Soils
Six different generic soil types can be found within the Borough of Kenilworth. These
are described below:
Recent alluvium - These soils are stratified deposits of silt and clay and are generally
found near stream beds. Due to their heavy texture these soils offer very poor drainage.
Kame - These are soils deposited by glacial melt waters and streams forming narrow
ridges. They are composed of assorted and homogeneous layers of variously sized sand
and gravels. Drainage characteristics are good.
Ground moraine - This class consists of soils deposited by a glacier. Soil textures range
from clays to boulders with silts predominating. Ground moraine deposits appear as
flat to gently rolling on the surface. Poor surface and internal drainage characteristics are
due to flat surfaces and heavy soil textures.
Marginal moraine - These soils were deposited at the front of the glacier. Soil textures
range from clays to boulders with sand and silt predominating. Internal drainage
characteristics are moderately good. Surface drainage conditions are fair to good.
Stratified drift - These soils consist of stratified deposits of silts and sandy silts deposited
over debris left by a receding glacier. These soils usually exhibit good internal surface
drainage.
Marsh - These are areas consisting of a layer of decomposed roots and organic material
over a highly compressible layer of silt and clay deposits. High ground water
conditions prevail during most of the year and drainage is poor.
32
Borough of Kenilworth 2011 Master Plan
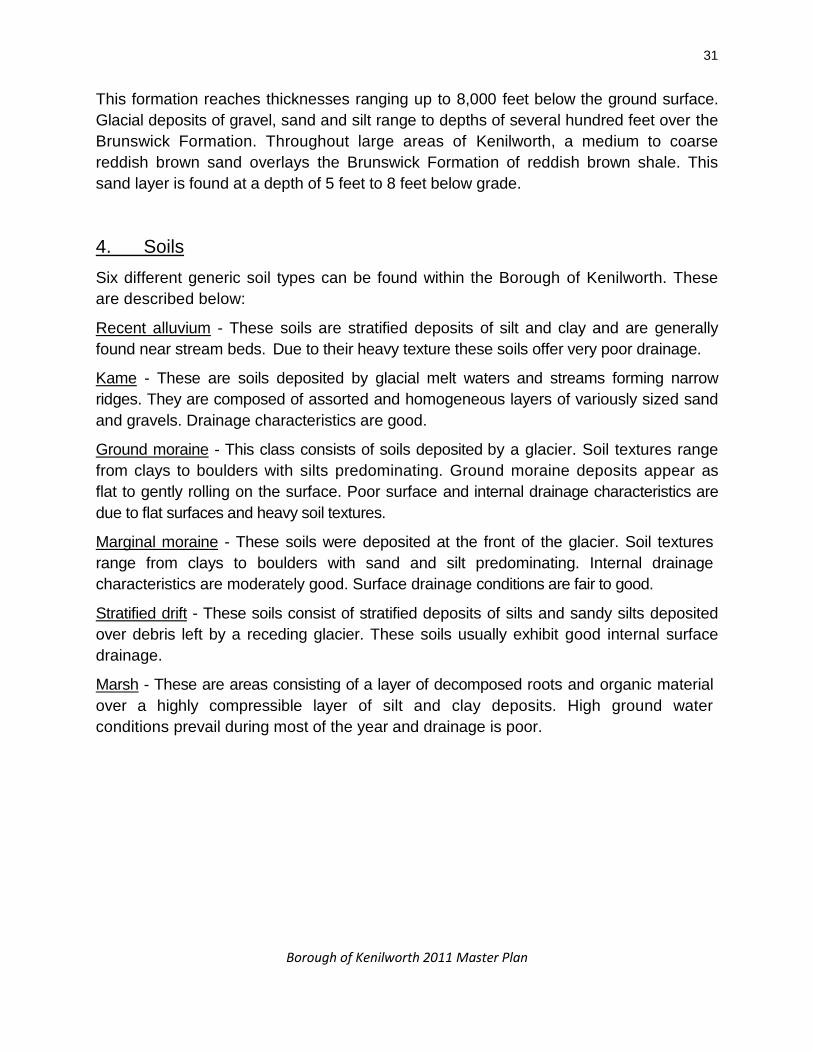
The following table shows the amount of each of the above soils in the Borough.
TABLE 5 - SOILS
SOIL TYPE ACRES %AGE
Recent Alluvial 99 7.4
Kame 55 4.1
Ground Moraine 414 30.8
Marginal Moraine 569 42.3
Stratified Drift 83 6.2
Marsh 115 8.5
Water 9 .7
TOTAL 1,344 100
As can be seen from the Table above the vast majority of soils within the Borough -
approximately 73.1% - consist of glacial ground moraine or marginal moraine.
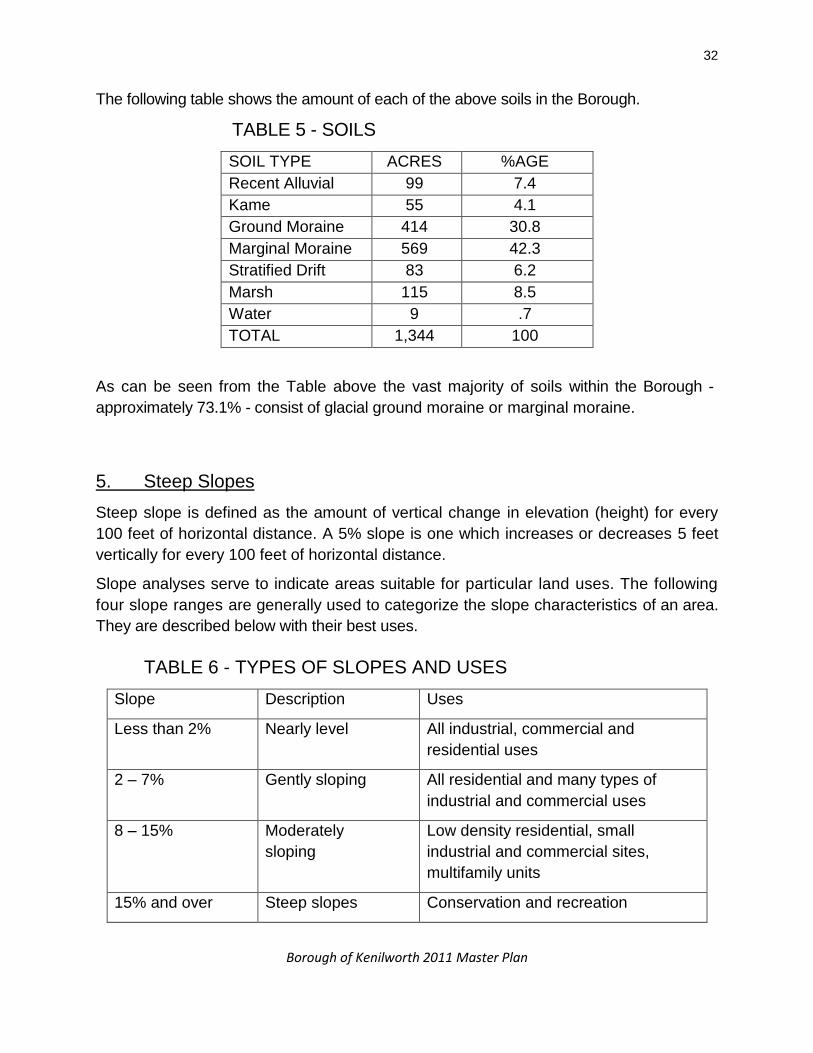
5. Steep Slopes
Steep slope is defined as the amount of vertical change in elevation (height) for every
100 feet of horizontal distance. A 5% slope is one which increases or decreases 5 feet
vertically for every 100 feet of horizontal distance.
Slope analyses serve to indicate areas suitable for particular land uses. The following
four slope ranges are generally used to categorize the slope characteristics of an area.
They are described below with their best uses.
TABLE 6 - TYPES OF SLOPES AND USES
Slope Description Uses
Less than 2% Nearly level All industrial, commercial and
residential uses
2 – 7% Gently sloping All residential and many types of
industrial and commercial uses
8 – 15% Moderately
sloping
Low density residential, small
industrial and commercial sites,
multifamily units
15% and over Steep slopes Conservation and recreation

33
Borough of Kenilworth 2011 Master Plan
TABLE 7 - BOROUGH SLOPE AREAS
Slope % Under 2% 2 – 7% 8 – 15% 15% and over
Acreage 936.9 358.4 36.8 11.9
% of land 69.8% 26.7% 2.7% .8%
6. Wetlands
Wetlands not only support aquatic life but serve to recharge underground aquifers.
Strict State regulations regarding wetlands make development of these areas
impossible or difficult. Due to the highly developed nature of Kenilworth, the extent of
naturally occurring wetlands within the Borough is minimal. Wetlands extend along the
Rahway River in close proximity to the banks. Some former wetland areas may have
been filled many years ago before such activity was regulated. Wetlands also exist in
the Northeast tip of the Borough on the Galloping Hill Golf Course along the banks of
the West Branch of the Elizabeth River. Open water wetlands exist in Black Brook Park
and along various brooks located in the Borough.
7. Drainage
Stormwater drainage patterns are governed by both natural and man-made features.
Natural features which may affect drainage patterns in Kenilworth are the existing
topography, rivers, brooks, ponds and subsurface soil conditions. Man-made features
which may affect drainage patterns are underground piping systems and man-made
ditches. Large highways may also affect drainage patterns by intercepting or blocking
flow, thereby affecting drainage patterns on a large scale.
The Borough of Kenilworth has an extensive underground stormwater drainage system, in
conjunction with surface inlets, to intercept and convey stormwater. Stormwater sewers
are not combined with sanitary sewers.
The Borough of Kenilworth drains into three natural drainage areas by surface or
subsurface conveyance. They are:
a) Rahway River Basin – Most of the Borough’s lands drain to the Rahway River.
Generally, all lands west of Michigan Avenue from Route 22 to the Garden State
Parkway drain to the Rahway River. Most lands west of the Garden State Parkway
from approximately Newark Avenue to the southern town boundary also drain to
the Rahway River.

34
Borough of Kenilworth 2011 Master Plan
b) Elizabeth River Basin - this is the second largest drainage area within the Borough.
Galloping Hill Park and Golf Course and lands east and west of the Garden State
Parkway south to approximately Newark Avenue drain to the West Branch of the
Elizabeth River.
c) Morses Creek Basin - the remaining portion of the Borough east of the Garden
State Parkway between Newark Avenue and Colfax Avenue drains to Morses
Creek drainage basin.
8. Floodplain
Flood hazard considerations are important to a community concerned with economic
viability and the safety of its residents. Unregulated development in areas subject to
flooding will generally create unsafe conditions for residents and result in property
damage. Unregulated filling and encroaching of a flood prone area will reduce the
capacity of the flood area to convey waters and will increase the size of the area subject
to flooding, the depth of flooding and possibly the duration of flooding. The economic
viability and desirability of the area is decreased by poor flood plain management.
The "Flood Boundary and Floodway Map - Community Panel No. 340-466-0001" which
is a part of the Flood Insurance Study delineates engineering type parameters such as
flood way, 100 year flood boundary and 500 year flood boundary.
The map shows the following flood hazard areas:
a. Near the westerly corporate limits along the drainage ditch which follows
Lenape Park Dike and along tributaries Stream 10-30 and Branch 10-30-1.
This also includes the area along the Black Brook to Shallcross Pond.
b. Near the northeast corporate limits with the golf course along the West
Branch of the Elizabeth River. Only the 100 year flood boundary is shown.
c. Between Quinton Avenue and Bloomingdale Avenue west of the Parkway to
the Borough’s boundary along Branch 10- 24.
d. Between Galloping Hill Road and Colfax Avenue east of the Parkway to the
corporate limits. Various areas delineated along West Brook and Branch 10-
24.
The current ―Flood Insurance Rate Map‖ delineates the above mentioned areas.

35
Borough of Kenilworth 2011 Master Plan
VII. PROPOSED LAND USE ZONES
A. PROPOSED ZONING DISTRICTS
This Master Plan recommends that 12 Zoning Districts and two Overlay Zones be
established. The proposed names are a more accurate description of the residential
size and commercial activities of each particular zone.
1. R-6 Low Density Single Family Residential Zone District
2. R-5 Medium Density Single Family Residential Zone District
3. R-5A High Density One and Two Family Residential Zone District
4. BD Boulevard Downtown Zone District
5. AC Area Commercial Zone District
6. C Commercial Zone District
7. OR Office Research Zone District
8. I Industrial Zone District
9. G Government Zone District
10. P Park Zone District
11. CE Cemetery Zone District
12. CS Community Serving Zone District
13. SLO Senior Living Overlay Zone District
14. GO Gateway Overlay Zone District
The proposed Zone Districts are described below.
B. RESIDENTIAL
1. R-6 Low Density Single Family Residential Zone District
The current R-1 Residential Low Density District should be renamed the R-6 Low
Density Residential District to reflect the minimum lot size of 6,000 SF. This zone
should continue to allow single family homes and public park land. Density should
continue at 7.26 residential units per acre.
The existing R-1 zone should continue within the current boundaries of the proposed R-
6 zone. In addition, properties along the North side of the Boulevard between 10th and
12th Streets as well as between Dorset Drive and North 7th Street should be included in
the R-6 Zone.

36
Borough of Kenilworth 2011 Master Plan
2. R-5 Medium Density Single Family Residential Zone District
The current R-2 Residential Low Density District should be renamed the R-5 Residential
Medium Density district to reflect the 5,000 SF minimum lot size in this zone. The zone
should allow only single family homes and public park land. Density should continue at
8.71 residential units per acre.
The existing R-2 zone should continue within the existing boundaries of the zone.
3. R-5A High Density One and Two Family Residential Zone District
The current R-3 Medium Density Residential District should be renamed the R-5A High
Density District to reflect the 5,000 SF minimum lot size and the higher density of this
Zone. The zone should only allow one and two family homes and public park land.
Density should be a maximum of 17.42 dwelling units per acre.
The currently zoned R-2 area in the vicinity of Washington Avenue, Cross Street and
North 18th Street should be zoned R-5A. This reflects the existing land uses in the
neighborhood and makes those properties conforming.
C. COMMERCIAL AREAS
1. BD - Boulevard Downtown Zone District.
This new district should extend along the first row of properties facing the Boulevard
from 18th Street to Market Street. Allowed uses should include: sales and retail; offices;
personal services; medical, dental and veterinary offices; banks and financial
institutions; restaurants and bars; funeral homes; and private schools. .
The Board recognizes that mixed use developments that include a residential
component can create vibrant environments that bring compatible land uses and public
amenities together. This kind of development creates a pedestrian friendly environment
which promotes public safety. This variety of uses enables people to live, work, play
and shop in one place.
While residential uses have not been allowed on the Boulevard in quite some time,
there is a pocket of preexisting nonconforming second floor apartments between 20th
Street and 24th Street. Over twenty apartments exist in this area of the Boulevard.
Rather than continue the nonconforming status of those properties, the Board believes it
to be in the public interest to recognize the existing land use pattern and to bring as
many properties as possible into conformity with the Land Use Ordinance. The Board
37
Borough of Kenilworth 2011 Master Plan
recommends that this area, and only this area, have a residential overlay zone with a
minimum of two bedrooms per apartment.
The Borough would like to foster a 1950’s Doo Wop style look to the Boulevard -
Downtown area. A design and pattern book should be prepared to show the preferred
style to guide local merchants in this optional endeavor. The design book will show
styles of storefronts, street furniture, signage and other physical elements. The
Borough will seek grant funding for the design book. The 1950’s Doo Wop style is
evident in such diverse places as Miami Beach, Los Angeles and Wildwood, NJ.
The Borough will encourage the placement of street furniture by property owners by
allowing such furniture to be included in the landscaping requirement for the B-D
District. A four foot wide sidewalk access shall be maintained around all street furniture.
Parking standards in the BD District should be temporarily relaxed to encourage the
revival of the Downtown area and to encourage business relocation to the Downtown.
A relaxation of parking standards will allow more businesses to operate without having
to apply for parking variances in addition to any other relief required. The six year
Reexamination of the Master Plan, due in 2017, should look at this issue closely to see
if any changes should be made based on development after this Master Plan is
adopted.
The Board recommends that all properties in the BD District between 16th and 24th
Streets, inclusive, shall provide one half of the required parking according to the
Ordinance. All other areas in the BD District shall provide the full amount of required
parking due to the lack of street and area parking.
The Board further recommends the Planning Board and Borough Council revisit this
issue during the next reexamination of the Master Plan or earlier should conditions
warrant. This temporary adjustment is meant to be just that – a temporary measure to
provoke and assist development along the Boulevard.
2. AC - Area Commercial Zone District
The proposed AC District will encompass the current SC District centered on the
Boulevard between Market Street and South 31st Street. It will also encompass the
lands in the C/I and I districts between the Garden State Parkway and the Rahway
Valley Rail Line.
The Area Commercial District will allow: sales and retail; offices; personal services;
medical, dental and veterinary offices; banks and financial institutions; restaurants and
bars; funeral homes; private schools; supermarkets, hotels/motels; indoor health,
racquet and sport facilities; car washes; automobile gasoline stations and automobile
service stations.
38
Borough of Kenilworth 2011 Master Plan
3. C – Commercial Zone District
The proposed C District will take the place of the current C/I Commercial Industrial
District and the LC – Local Commercial District and will be located in the following
areas: the current LC zone at Michigan Avenue and Fairfield Avenue, the current C/I
zone at Michigan Avenue between Fairfield Avenue and Lexington Avenue; the current
C/I zone on Galloping Hill Road east of the Garden State parkway; the current L C zone
at Michigan Avenue between Faitoute and Fairfield Avenues; the current C/I zone on
the north side of the Boulevard east of North 26th Street; part of the current LC zone
between the Boulevard and Newark Avenue; part of the current C/I zone north of
Monroe Avenue between North 8 and North 13th Streets; the current LC zone centered
on North 14th Street and Monroe Avenue; the current C/I zone on Route 22, and the part
of the current I zone for properties facing Michigan Avenue between Route 22 and
Black Brook Park.
The Commercial District will allow: sales and retail; offices; personal services; medical,
dental and veterinary offices; banks and financial institutions; restaurants and bars;
funeral homes; public utilities; and, private schools.
The Commercial District shall allow multifamily apartment buildings as a conditional use.
Density shall be no more than 26 units per acre. Parking may be allowed in the
required front yard if plantings and buffering are provided.
4. OR - Office Research Zone District
The proposed Office Research District will take the place of the current I Industrial
District on lands owned by the Merck (Schering) campus east of the Garden State
Parkway.
The OR District will allow: offices, warehouses, scientific or research laboratories;
manufacturing; industrial facilities and public utilities.
Permitted Accessory Uses shall include: parking structures, cafeterias, helipads and
day care centers primarily for use by employees.
5. I - Industrial Zone District
The proposed I Industrial District will include the remainder of the areas that are
currently zoned Industrial plus the C/I zoned areas south of Monroe.
The I Industrial District will allow: offices; indoor recreational uses; warehouses;
scientific or research laboratories; manufacturing; industrial facilities; public utilities;
personal services; medical, dental and veterinary offices; bans and financial institutions;

39
Borough of Kenilworth 2011 Master Plan
restaurants and bars; private schools; indoor health, racquet and sports facilities; and
sales and retail.
The Borough should actively encourage the use of Industrial District properties as
warehousing for Newark International Airport operations.
Permitted Conditional Uses shall include wireless telecommunications facilities and
outdoor vehicle storage/parking.
D. NONCOMMERCIAL AREAS
1. G - Government Zone District
The proposed G - Government District will include all of the Government buildings and
properties in the Borough, except for parks, which are in a different category. Examples
of Government zoned parcels include; the Borough Hall complex; Public Schools;
Public Works; Rescue Squad, Library; Fire Dept and Post Office.
The Borough should actively encourage and support the lighting of athletic fields on
school property. The Borough should also encourage the placement of artificial turf on
the heavily used school athletic fields.
The G - Government District will allow: public buildings or facilities used exclusively for
public purposes by any branch of government.
2. P - Park Zone District
The proposed P - Park District shall allow all public parks within the confines of the
Borough, such as: Lenape Park; Black Brook Park; Galloping Hill Park; and Di Mario
Park.
The P - Park District will allow active or passive recreation and utilities.
3. CE - Cemetery Zone District
The CE - Cemetery District shall include all of the lands which are currently zoned PF
and used as cemeteries.
The CE - Cemetery District shall only allow the internment of the dead.

40
Borough of Kenilworth 2011 Master Plan
4. CS - Community Serving Zone District
The proposed CS - Community Serving District shall include those lands currently
occupied by uses that serve the community while owned by nongovernmental
organizations, such as; churches; parochial schools; veteran’s organizations and other
community groups.
The CS - Community Serving District shall only allow facilities used for recreational,
social, educational and cultural purposes.
5. SLO - Senior Living Overlay Zone District
The current Industrial area between North 10th Street and North 12th Street between
Washington and Monroe Avenues should be an overlay Senior Citizens Housing Zone.
This would allow any age restricted (55+) housing as an overlay zone. A minimum of
ten percent of the senior housing should meet affordable housing guidelines. All forms
of senior living are encouraged. Density shall be no more than 36 units per acre and
parking shall be provided in accordance with the Land Use ordinance. Recreational
facilities shall be included as part of any senior complex and will include outdoor and
indoor recreational areas.
6. GO - Gateway Overlay Zone District
The nonresidential zoned Gateway areas at the entrance to the Borough should be
placed in an overlay Gateway Zone that will add enhanced landscaping requirements.
The Gateway area shall include: North Michigan Avenue from Route 22 to Black Brook
Park; Springfield Road from Route 22 to Black Brook Park; and, Kenilworth Boulevard
starting at the Garden State Parkway and extending approximately 1,000 feet west to
Market Street.
41
Borough of Kenilworth 2011 Master Plan
VIII. PROPOSED ZONING STRATEGIES
A. RESIDENTIAL ZONES
1. Floor Area Ratio
There is an increasing number of out of scale single-family residential homes
throughout the Borough. There are a number of reasons for the creation of out of
character residential single-family development, not the least of which is the Boroughs’
desirability as a place to live. Existing bulk standards and definitions have played a role
in allowing the development of out of scale single-family housing.
Floor Area Ratio (FAR) is the sum of all the floors of a structure compared to the total
area of the site. Use of a Floor Area Ratio calculation would be one of the tools that
would limit the amount of volume of a proposed house.
To start the discussion on FAR, the Borough should consider a sliding scale between .5
and .66 FAR depending upon the size of the property, and which would allow for the
construction of homes deemed desirable without overwhelming the existing character of
the neighborhood.
The Borough should consider implementation of a floor area ratio standard for
residential uses.
2. Building and Lot Coverage
Another tool useful in controlling how to scale single-family residential development is a
building coverage and lot coverage standard. A building coverage standard would limit
the amount of land buildings could occupy on a particular site. A lot coverage standard
would limit the amount of impervious coverage on a particular site and would regulate
the percentage of a lot that may be covered by material that prevents the absorption of
storm water into the ground. Any pervious surface cover should be calculated at the
appropriate ratio.
Impervious cover, building cover and lot cover should all be clearly defined in the
Ordinance.
The Borough should consider an impervious cover limit of between 50% and 60%,
depending upon the size of the lot. The Borough should also consider a building
coverage limit of 40% to 50%.

42
Borough of Kenilworth 2011 Master Plan
Building and lot coverage standards can reduce flash flooding by providing additional
surface area for ground water absorption. The Borough should consider
implementation of a building and lot coverage standard for residential uses.
3. Building Setbacks
New buildings on corner lots should have two front yard setbacks with appropriate front
yard setback distances to each street.
New building side yard setbacks in the R-6 Zone should have at least 20% combined
side yard setbacks and R-5 and R-5A Zones should have a minimum 15% combined
sideyard setback.
Front porches may be allowed to violate the front yard setback provided that: they are
open; they shall not extend any further than six feet into the required setback; they shall
only front a living area of the home; and they shall also not encroach more than one
third of the way into the required front yard setback, excluding steps.
4. Front Yard Setback
Residential front yard setback shall not be encroached upon except by an open porch
and a driveway which shall take up no more than 25% of the lot frontage.
5. Residential Cantilevers
Continue the current practice of allowing a two foot second floor cantilever in the front
yard of a residential structure.
6. Multigenerational Family Accommodations
The current Multigenerational Family Accommodations definition shall be replaced with
one for senior suites which shall permit seniors aged 62 and older to live in accessory
apartments in a single family residential unit.
7. Certificate of Occupancy for Residences
A Certificate of Occupancy inspection shall be conducted when residential property
changes ownership to ensure compliance with applicable construction and zoning
codes.
43
Borough of Kenilworth 2011 Master Plan
8. New Two Family Homes
All new two family homes shall require larger lot sizes of 7,500 SF with a density of no
greater than 17.2 units per acre.
B. COMMERCIAL ZONES
1. Signage
Signage is considered one of the most important amenities desired by the business
community, yet is extremely difficult to regulate. The numerous elements of a sign:
size; illumination; lettering; color; and orientation all present difficulties while demand for
signage increases steadily.
The Borough recognizes that signage is particularly important to the success of a
business as well as crucial to the beauty and enjoyment of the Downtown and other
commercial areas.
The Board should consider a new Sign Ordinance that considers: number of signs
permitted; area of signs; height of signs; setback from right of way; and illumination and
type of sign. This reconsideration of the Sign Ordinance is very important given that the
Borough’s signage standards have not been reviewed for at least 15 years.
2. Landscaping/Buffer
Add requirements for landscaping and buffer between residential and nonresidential
uses and add requirements for additional landscaping by commercial applications.
3. Outdoor Restaurant Seating
Allow outdoor restaurant seating as an allowed accessory use to a permitted restaurant
provided that such eating establishment provides a minimum five foot clearance
walkway on any established sidewalk for the protection of pedestrians.
C. APPLICABLE TO ALL ZONES
1. Green Technologies
Allow solar panels and wind energy projects throughout the Borough with appropriate
safeguards for impacts to residential properties.

44
Borough of Kenilworth 2011 Master Plan
2. Definitions
Expand the definitions section of the Land Use Ordinance to fully explain terms to guide
the Board and staff in interpreting applications for development.
3. Street Widening
Should any street within the jurisdiction of the Borough need to be widened, then any
and all utility poles shall be moved by the appropriate utility companies to accommodate
that widening.
4. Storm Water Management
Require the use of rain gardens, dry wells and other measures to reduce the amount of
storm water runoff entering the streets and storm sewers from properties that exceed
building cover and impervious cover limits and encourage stormwater management
measures for any project that adds 400 SF or more of impervious cover.
A Certificate of Occupancy inspection at the time of ownership changes shall insure that
sump pumps are not tied in the sanitary sewer system.
Redefine impervious cover to meet NJ State Department of Environmental (NJ DEP)
protection standards that define gravel surfaces, pools and decks as impervious cover.
Use NJ DEP stormwater standards for major and minor development. Create Borough
standards for small developments that do not require NJ DEP regulation. Small
development shall also include limitations on the amount of fill allowed before triggering
an approval.
5. Parking Standards
Update all parking requirements with contemporary standards.
6. Zoning Ordinance
A new Zoning Ordinance shall be prepared which better protects the Borough from
unwanted and illegal development and gives homeowners a clear understanding of
what they can and cannot do with their property.
Major and minor site plans shall be clearly defined in the Ordinance. Minor site plans
shall continue to require Land Use Board approval with no public notice necessary.
Administrative Site Plan waivers for minor changes to commercial sites may be granted
45
Borough of Kenilworth 2011 Master Plan
under very limited circumstances by a newly created Administrative Site Plan Waiver
Subcommittee of the Planning Board.
Fines shall be raised for Land Use Ordinance violations as well as Property
Maintenance violations. The Property Maintenance Code shall be updated with
nonresidential area standards.
7. Recycling
Encourage recycling in public places by providing appropriate containers.
46
Borough of Kenilworth 2011 Master Plan
HOUSING ELEMENT OF THE MASTER PLAN

47
Borough of Kenilworth 2011 Master Plan
I. INTRODUCTION TO THE HOUSING ELEMENT
With the passage of the Fair Housing Act in 1985 (P.L. 1985, C.222), the Municipal
Land Use Law (MLUL) was amended to require a Housing Element as a mandatory
element of the municipal Master Plan. A variety of components must be incorporated
into every Housing Element, summarized as follows:
• An inventory of the municipality's housing stock by age, condition, value and
occupancy characteristics;
• A projection of future housing construction for the next six years;
• An analysis of the municipality's demographic characteristics including
household size, income level and age;
• An analysis of existing and future probable employment characteristics of the
municipality;
• A determination of the municipality's present and prospective fair share of low
and moderate income housing and its capacity to accommodate low and
moderate income housing; and
• A consideration of the lands that are most appropriate for the construction of
low and moderate income housing, including structures which may be
rehabilitated and lands of developers, if any, who have expressed a
commitment to provide low and moderate income housing.
These components will be addressed in the course of this Master Plan, as explained
below.
48
Borough of Kenilworth 2011 Master Plan
II. ORGANIZATION OF THIS ELEMENT
The intention of this Element of the Master Plan is to address the statutory requirements of the Municipal Land Use Law as noted above.
The initial part of this Element, titled Section 3, will list the Housing Objectives of the Borough. The following section (Section 4) will address the MLUL components cited above. An overview of the Borough’s affordable housing status will follow in Section 5.
III. HOUSING OBJECTIVES
Each Element of the Master Plan contains a section concerning the goals and objectives of that specific element. The goals and objectives of this Housing Element and Growth Share Plan are as follows:
a. Although there is limited available land capacity where higher density
inclusionary housing could be encouraged in the Borough, appropriate
residential development should be inclusionary and provide for its
share of affordable housing as directed by NJ state statute.
b. The Borough shall allow senior suites in private residences and shall
maintain the appropriate records to document these types of
residences.
c. The Borough shall research opportunities for the rehabilitation of
homes which are in need of repair and which are occupied by low and
moderate income households.
d. The Borough shall encourage the establishment of an additional Group
Home for the Developmentally Disabled. This provides vital assistance
to a sector of the population in need and fulfills current state affordable
housing goals.
e. The Borough shall encourage senior citizen age restricted housing to
offer our older residents a place to live near home when they no longer
need a full size house with all of its attendant maintenance
responsibilities. A Senior Living Overlay Zone shall be established
which will allow age restricted housing.
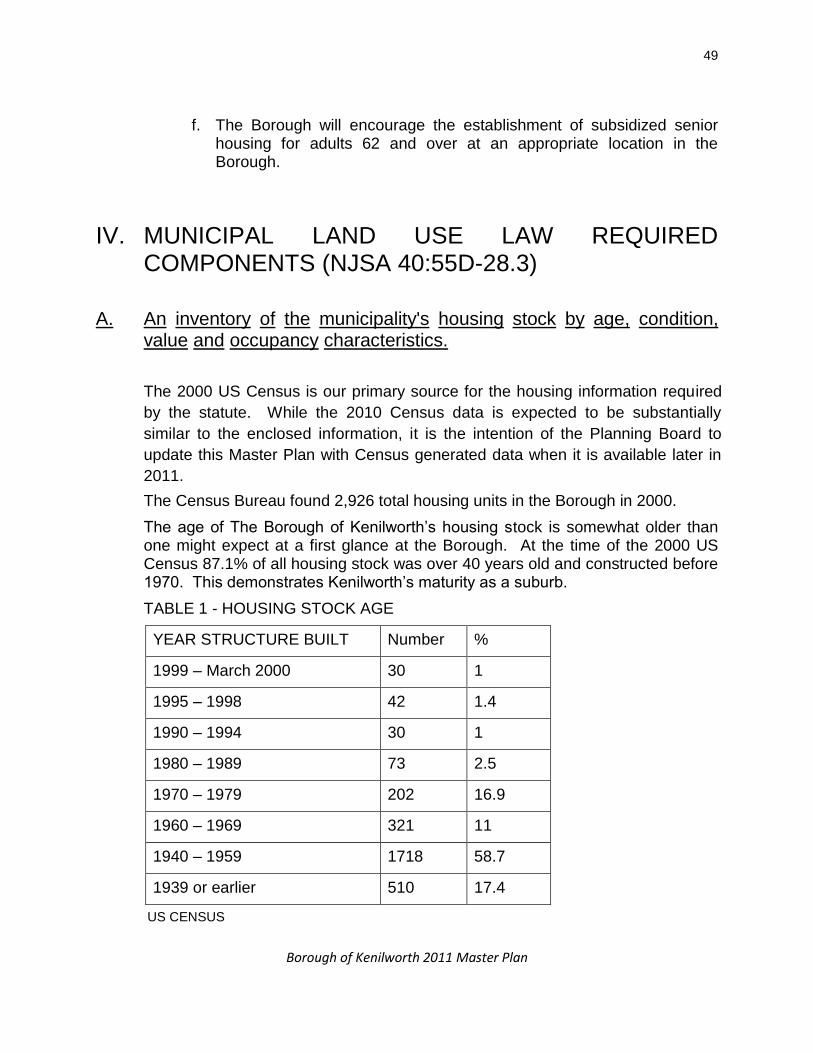
49
Borough of Kenilworth 2011 Master Plan
f. The Borough will encourage the establishment of subsidized senior housing for adults 62 and over at an appropriate location in the Borough.
IV. MUNICIPAL LAND USE LAW REQUIRED COMPONENTS (NJSA 40:55D-28.3)
A. An inventory of the municipality's housing stock by age, condition, value and occupancy characteristics.
The 2000 US Census is our primary source for the housing information required
by the statute. While the 2010 Census data is expected to be substantially
similar to the enclosed information, it is the intention of the Planning Board to
update this Master Plan with Census generated data when it is available later in
2011.
The Census Bureau found 2,926 total housing units in the Borough in 2000.
The age of The Borough of Kenilworth’s housing stock is somewhat older than one might expect at a first glance at the Borough. At the time of the 2000 US Census 87.1% of all housing stock was over 40 years old and constructed before 1970. This demonstrates Kenilworth’s maturity as a suburb.
TABLE 1 - HOUSING STOCK AGE
YEAR STRUCTURE BUILT Number %
1999 – March 2000 30 1
1995 – 1998 42 1.4
1990 – 1994 30 1
1980 – 1989 73 2.5
1970 – 1979 202 16.9
1960 – 1969 321 11
1940 – 1959 1718 58.7
1939 or earlier 510 17.4
US CENSUS
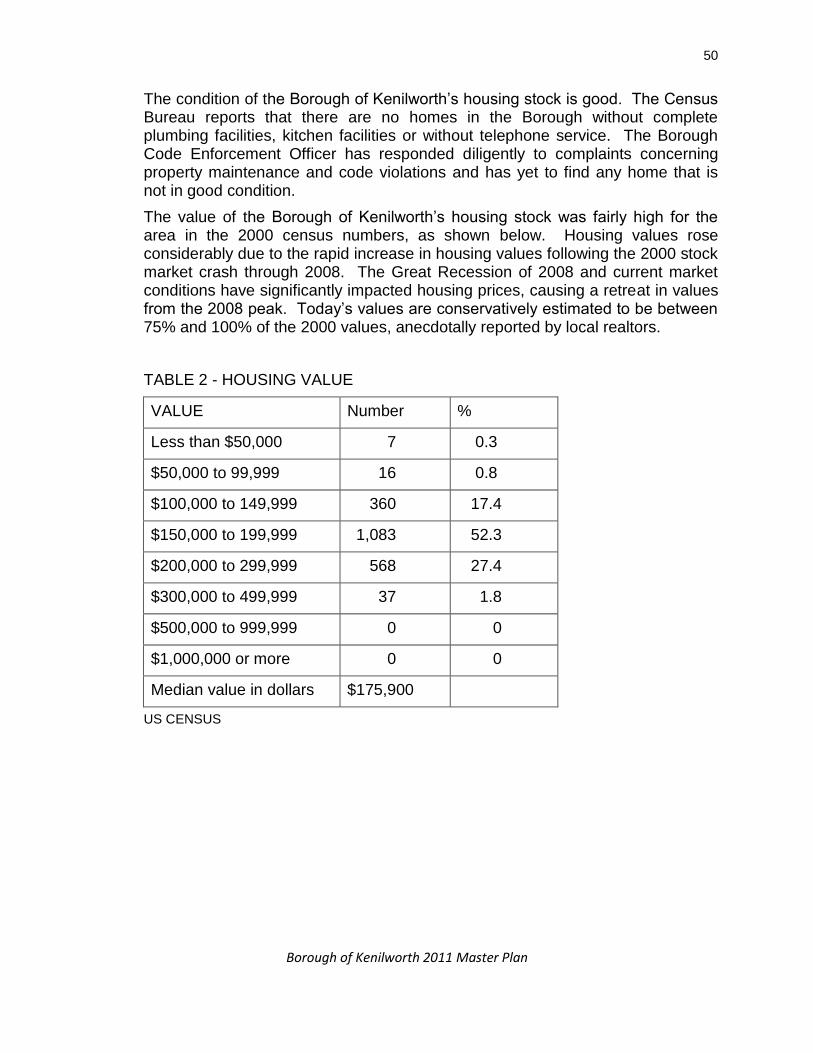
50
Borough of Kenilworth 2011 Master Plan
The condition of the Borough of Kenilworth’s housing stock is good. The Census Bureau reports that there are no homes in the Borough without complete plumbing facilities, kitchen facilities or without telephone service. The Borough Code Enforcement Officer has responded diligently to complaints concerning property maintenance and code violations and has yet to find any home that is not in good condition.
The value of the Borough of Kenilworth’s housing stock was fairly high for the area in the 2000 census numbers, as shown below. Housing values rose considerably due to the rapid increase in housing values following the 2000 stock market crash through 2008. The Great Recession of 2008 and current market conditions have significantly impacted housing prices, causing a retreat in values from the 2008 peak. Today’s values are conservatively estimated to be between 75% and 100% of the 2000 values, anecdotally reported by local realtors.
TABLE 2 - HOUSING VALUE
VALUE Number %
Less than $50,000 7 0.3
$50,000 to 99,999 16 0.8
$100,000 to 149,999 360 17.4
$150,000 to 199,999 1,083 52.3
$200,000 to 299,999 568 27.4
$300,000 to 499,999 37 1.8
$500,000 to 999,999 0 0
$1,000,000 or more 0 0
Median value in dollars $175,900
US CENSUS
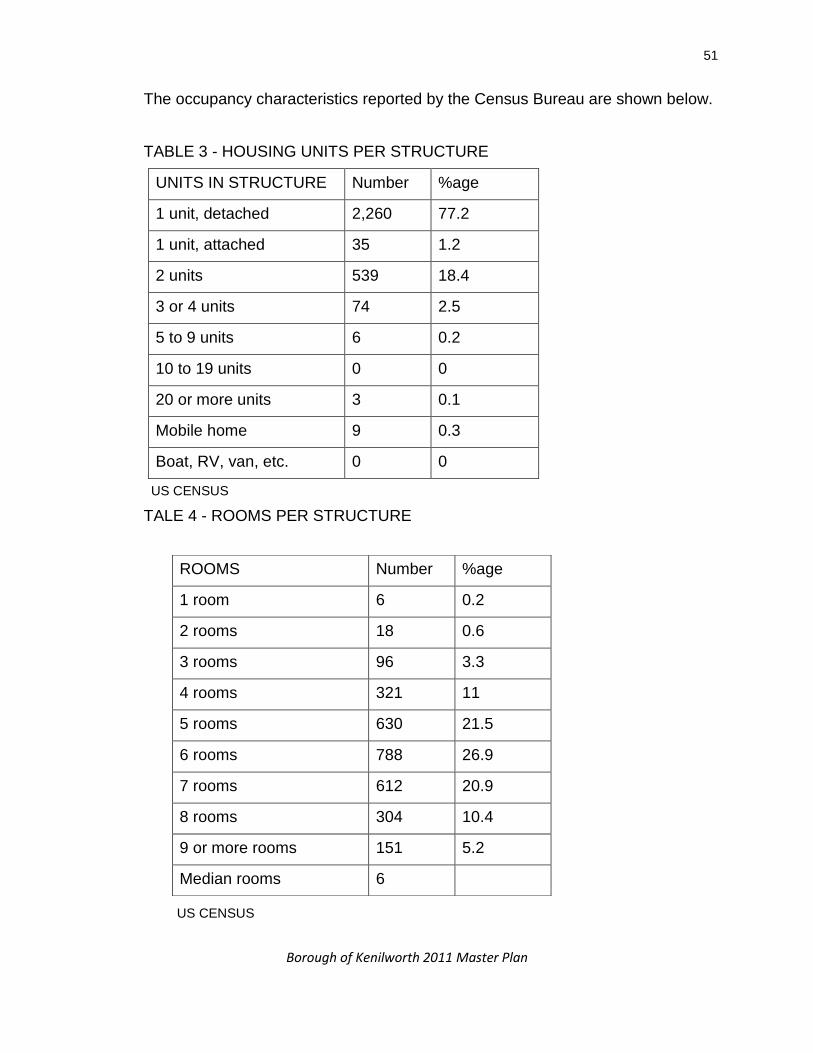
51
Borough of Kenilworth 2011 Master Plan
The occupancy characteristics reported by the Census Bureau are shown below.
TABLE 3 - HOUSING UNITS PER STRUCTURE
UNITS IN STRUCTURE Number %age
1 unit, detached 2,260 77.2
1 unit, attached 35 1.2
2 units 539 18.4
3 or 4 units 74 2.5
5 to 9 units 6 0.2
10 to 19 units 0 0
20 or more units 3 0.1
Mobile home 9 0.3
Boat, RV, van, etc. 0 0
US CENSUS
TALE 4 - ROOMS PER STRUCTURE
US CENSUS
ROOMS Number %age
1 room 6 0.2
2 rooms 18 0.6
3 rooms 96 3.3
4 rooms 321 11
5 rooms 630 21.5
6 rooms 788 26.9
7 rooms 612 20.9
8 rooms 304 10.4
9 or more rooms 151 5.2
Median rooms 6

52
Borough of Kenilworth 2011 Master Plan
TABLE 5 - OCCUPANTS PER ROOM
OCCUPANTS PER ROOM Number %age
Total occupied housing units 2,854 100
1.0 or less 2826 99
1.01 to 1.50 9 0.3
1.51 or more 19 0.7
US CENSUS
TABLE 6 - HOUSEHOLD AND FAMILY SIZES
HOUSEHOLDS BY TYPE Number %age
Total Households 2854 100
Family households 2117 74.2
With own children under 18 years 816 28.6
Married couple family 1666 58.4
With own children under 18 years 692 24.2
Female householder, no husband 340 11.9
With own children under 18 years 102 3.6
Nonfamily households 737 25.8
Householder living alone 611 21.4
Householder 65 or older 313 11
Households with under 18 years old 908 31.8
Households with 65 years or older 1009 35.4
Average household size 2.69
Average family size 3.15
US CENSUS
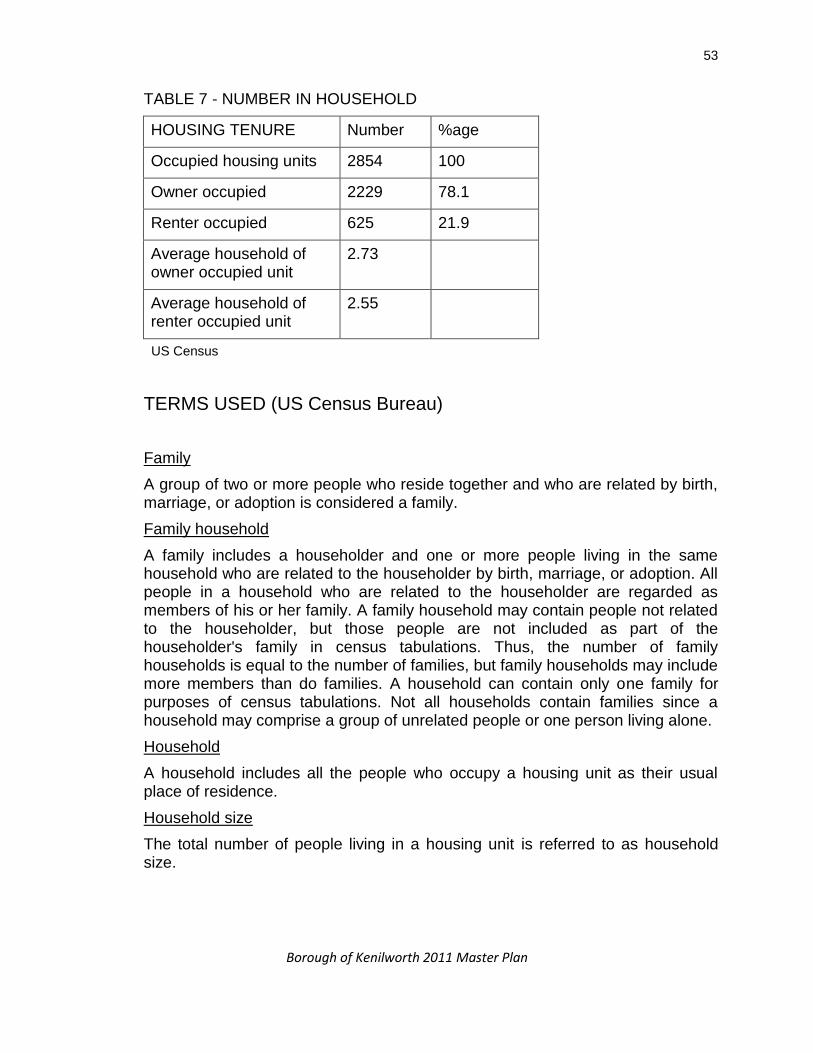
53
Borough of Kenilworth 2011 Master Plan
TABLE 7 - NUMBER IN HOUSEHOLD
HOUSING TENURE Number %age
Occupied housing units 2854 100
Owner occupied 2229 78.1
Renter occupied 625 21.9
Average household of owner occupied unit
2.73
Average household of renter occupied unit
2.55
US Census
TERMS USED (US Census Bureau)
Family
A group of two or more people who reside together and who are related by birth, marriage, or adoption is considered a family.
Family household
A family includes a householder and one or more people living in the same household who are related to the householder by birth, marriage, or adoption. All people in a household who are related to the householder are regarded as members of his or her family. A family household may contain people not related to the householder, but those people are not included as part of the householder's family in census tabulations. Thus, the number of family households is equal to the number of families, but family households may include more members than do families. A household can contain only one family for purposes of census tabulations. Not all households contain families since a household may comprise a group of unrelated people or one person living alone.
Household
A household includes all the people who occupy a housing unit as their usual place of residence.
Household size
The total number of people living in a housing unit is referred to as household size.

54
Borough of Kenilworth 2011 Master Plan
B. A projection of future housing construction for the next six years.
Very little vacant land is currently available in the Borough. Future residential growth may be infill, or replacement housing, or a possible influx of housing in commercial areas.
When reviewing the number of housing units certified and demolitions performed between 2000 and 2009, 42 housing units were added to the Kenilworth housing inventory in that 10 year period. This averages to 4 homes per year.
Based upon the past 10 years as well as proposed zoning changes, the Borough of Kenilworth projects that 24 additional housing units may be added to the Borough’s inventory between 2011 and 2016. This is based on four units per year over six years.
TABLE 8 - RESIDENTIAL HOUSING GROWTH 2000 - 2009
YEAR CERTIFICATES OF OCCUPANCY
DEMOLITIONS NET HOUSING
2000 10 2 8
2001 2 0 2
2002 3 4 -1
2003 9 13 -4
2004 17 9 8
2005 15 6 9
2006 16 5 11
2007 10 6 4
2008 5 3 2
2009 6 3 3
TOTALS 93 51 42
NJ Department of Community Affairs – Construction Reporter
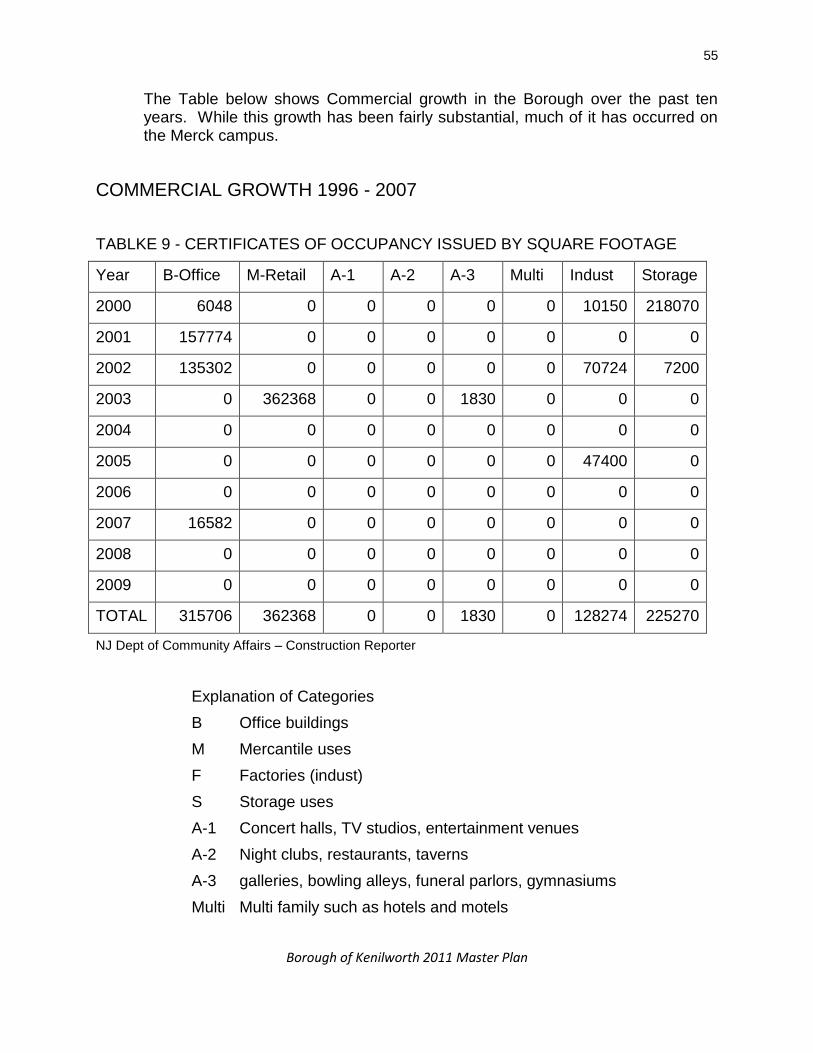
55
Borough of Kenilworth 2011 Master Plan
The Table below shows Commercial growth in the Borough over the past ten years. While this growth has been fairly substantial, much of it has occurred on the Merck campus.
COMMERCIAL GROWTH 1996 - 2007
TABLKE 9 - CERTIFICATES OF OCCUPANCY ISSUED BY SQUARE FOOTAGE
Year B-Office M-Retail A-1 A-2 A-3 Multi Indust Storage
2000 6048 0 0 0 0 0 10150 218070
2001 157774 0 0 0 0 0 0 0
2002 135302 0 0 0 0 0 70724 7200
2003 0 362368 0 0 1830 0 0 0
2004 0 0 0 0 0 0 0 0
2005 0 0 0 0 0 0 47400 0
2006 0 0 0 0 0 0 0 0
2007 16582 0 0 0 0 0 0 0
2008 0 0 0 0 0 0 0 0
2009 0 0 0 0 0 0 0 0
TOTAL 315706 362368 0 0 1830 0 128274 225270
NJ Dept of Community Affairs – Construction Reporter
Explanation of Categories
B Office buildings
M Mercantile uses
F Factories (indust)
S Storage uses
A-1 Concert halls, TV studios, entertainment venues
A-2 Night clubs, restaurants, taverns
A-3 galleries, bowling alleys, funeral parlors, gymnasiums
Multi Multi family such as hotels and motels
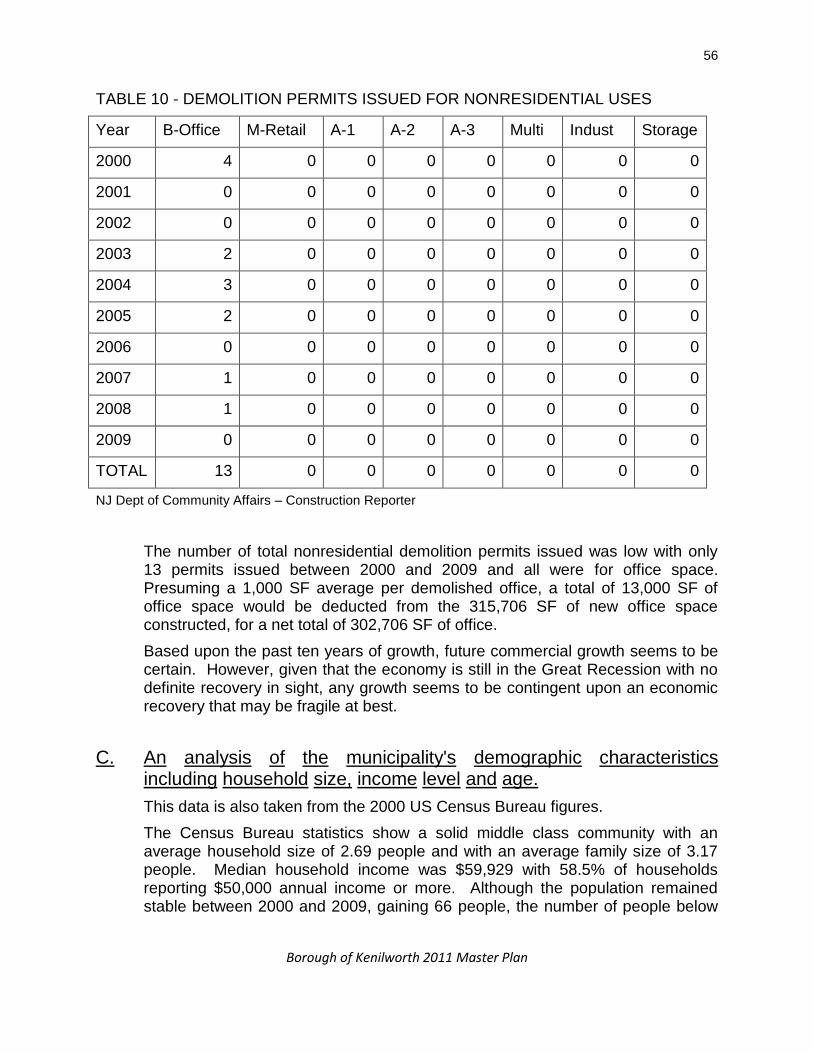
56
Borough of Kenilworth 2011 Master Plan
TABLE 10 - DEMOLITION PERMITS ISSUED FOR NONRESIDENTIAL USES
Year B-Office M-Retail A-1 A-2 A-3 Multi Indust Storage
2000 4 0 0 0 0 0 0 0
2001 0 0 0 0 0 0 0 0
2002 0 0 0 0 0 0 0 0
2003 2 0 0 0 0 0 0 0
2004 3 0 0 0 0 0 0 0
2005 2 0 0 0 0 0 0 0
2006 0 0 0 0 0 0 0 0
2007 1 0 0 0 0 0 0 0
2008 1 0 0 0 0 0 0 0
2009 0 0 0 0 0 0 0 0
TOTAL 13 0 0 0 0 0 0 0
NJ Dept of Community Affairs – Construction Reporter
The number of total nonresidential demolition permits issued was low with only 13 permits issued between 2000 and 2009 and all were for office space. Presuming a 1,000 SF average per demolished office, a total of 13,000 SF of office space would be deducted from the 315,706 SF of new office space constructed, for a net total of 302,706 SF of office.
Based upon the past ten years of growth, future commercial growth seems to be certain. However, given that the economy is still in the Great Recession with no definite recovery in sight, any growth seems to be contingent upon an economic recovery that may be fragile at best.
C. An analysis of the municipality's demographic characteristics including household size, income level and age.
This data is also taken from the 2000 US Census Bureau figures.
The Census Bureau statistics show a solid middle class community with an average household size of 2.69 people and with an average family size of 3.17 people. Median household income was $59,929 with 58.5% of households reporting $50,000 annual income or more. Although the population remained stable between 2000 and 2009, gaining 66 people, the number of people below

57
Borough of Kenilworth 2011 Master Plan
18 years old was 1,596 or 20.8% of the population. The number of people over 65 years of age was 1,339 people or 18.2% of the overall population.
TABLE 11 - AVERAGE SIZE
Average household size 2.69
Average family size 3.15
US Census
TABLE 12 - HOUSEHOLD INCOME IN 1999
Number %age
HOUSEHOLDS 2,846 100
Less than $10,000 74 2.6
$10,000 to 14,999 129 4.5
$15,000 to 24,999 271 9.5
$25,000 to 34,999 310 10.9
$35,000 to 49,999 396 13.9
$50,000 to 74,999 718 25.2
$75,000 to 99,999 503 17.7
$100,000 to 149,999 317 11.1
$150,000 to 199,999 77 2.7
$200,000 or more 51 1.8
Median household income $59,929
US Census
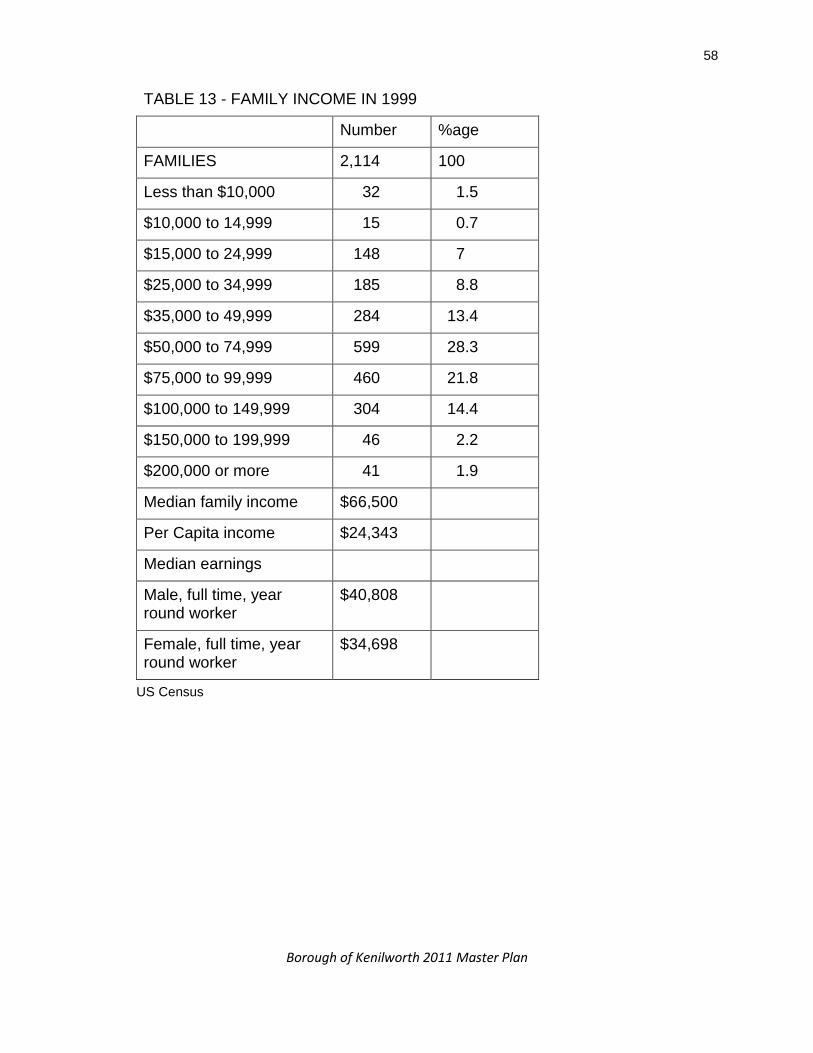
58
Borough of Kenilworth 2011 Master Plan
TABLE 13 - FAMILY INCOME IN 1999
Number %age
FAMILIES 2,114 100
Less than $10,000 32 1.5
$10,000 to 14,999 15 0.7
$15,000 to 24,999 148 7
$25,000 to 34,999 185 8.8
$35,000 to 49,999 284 13.4
$50,000 to 74,999 599 28.3
$75,000 to 99,999 460 21.8
$100,000 to 149,999 304 14.4
$150,000 to 199,999 46 2.2
$200,000 or more 41 1.9
Median family income $66,500
Per Capita income $24,343
Median earnings
Male, full time, year round worker
$40,808
Female, full time, year round worker
$34,698
US Census
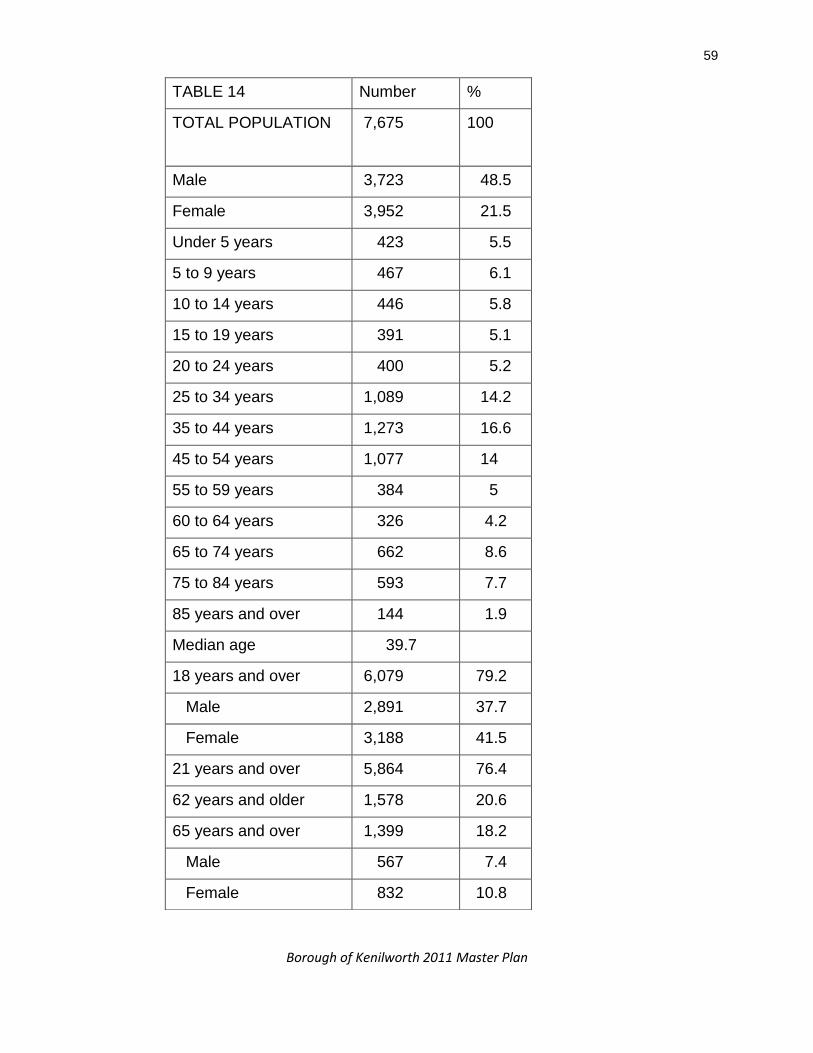
59
Borough of Kenilworth 2011 Master Plan
TABLE 14 Number %
TOTAL POPULATION 7,675
100
Male 3,723 48.5
Female 3,952 21.5
Under 5 years 423 5.5
5 to 9 years 467 6.1
10 to 14 years 446 5.8
15 to 19 years 391 5.1
20 to 24 years 400 5.2
25 to 34 years 1,089 14.2
35 to 44 years 1,273 16.6
45 to 54 years 1,077 14
55 to 59 years 384 5
60 to 64 years 326 4.2
65 to 74 years 662 8.6
75 to 84 years 593 7.7
85 years and over 144 1.9
Median age 39.7
18 years and over 6,079 79.2
Male 2,891 37.7
Female 3,188 41.5
21 years and over 5,864 76.4
62 years and older 1,578 20.6
65 years and over 1,399 18.2
Male 567 7.4
Female 832 10.8
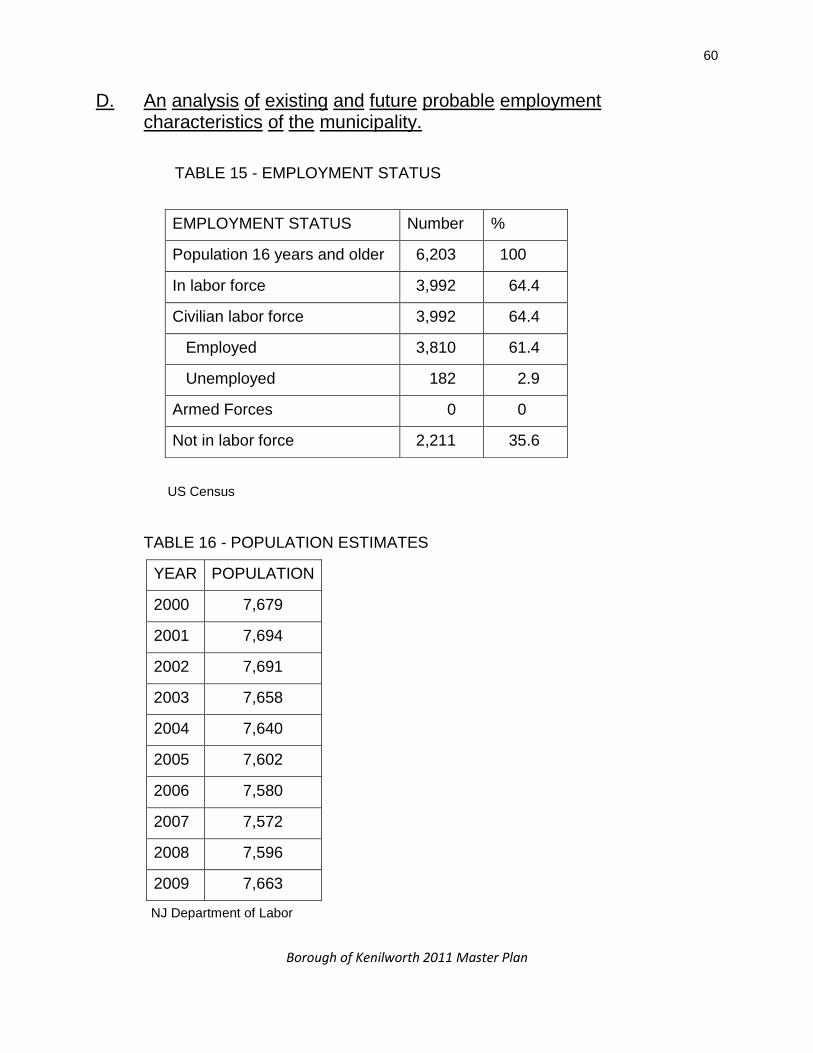
60
Borough of Kenilworth 2011 Master Plan
D. An analysis of existing and future probable employment characteristics of the municipality.
TABLE 15 - EMPLOYMENT STATUS
US Census
TABLE 16 - POPULATION ESTIMATES
YEAR POPULATION
2000 7,679
2001 7,694
2002 7,691
2003 7,658
2004 7,640
2005 7,602
2006 7,580
2007 7,572
2008 7,596
2009 7,663
NJ Department of Labor
EMPLOYMENT STATUS Number %
Population 16 years and older 6,203 100
In labor force 3,992 64.4
Civilian labor force 3,992 64.4
Employed 3,810 61.4
Unemployed 182 2.9
Armed Forces 0 0
Not in labor force 2,211 35.6
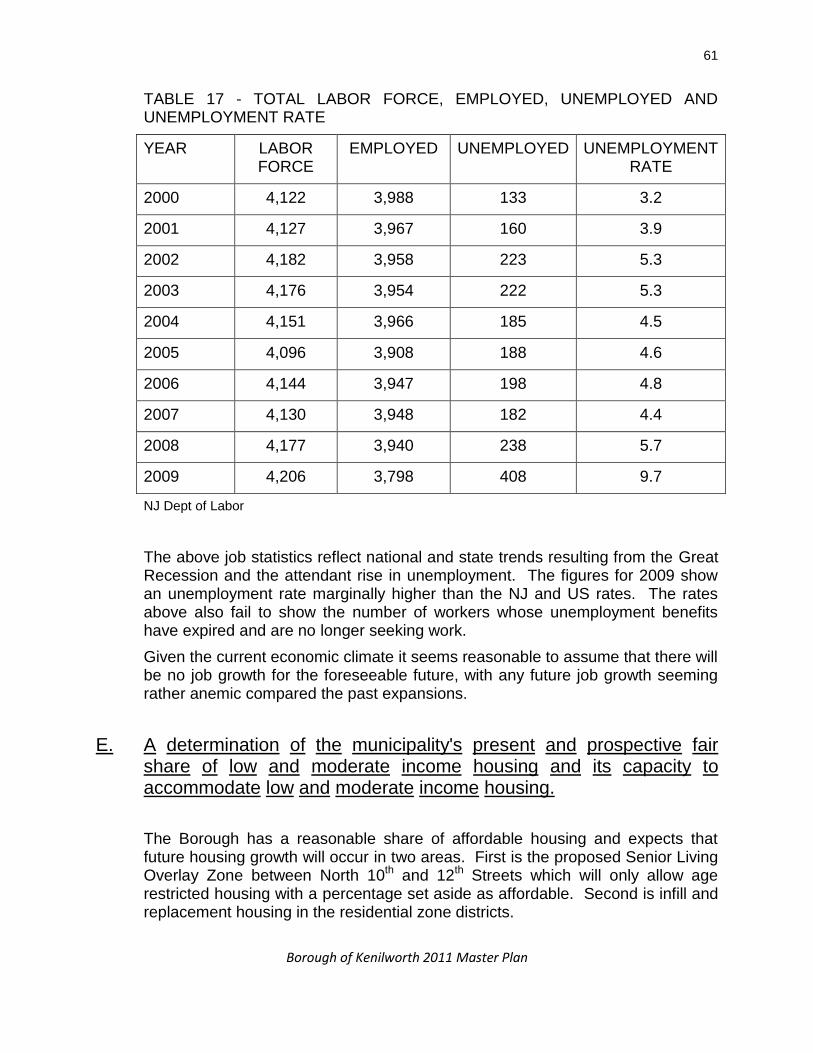
61
Borough of Kenilworth 2011 Master Plan
TABLE 17 - TOTAL LABOR FORCE, EMPLOYED, UNEMPLOYED AND UNEMPLOYMENT RATE
YEAR LABOR FORCE
EMPLOYED UNEMPLOYED UNEMPLOYMENT RATE
2000 4,122 3,988 133 3.2
2001 4,127 3,967 160 3.9
2002 4,182 3,958 223 5.3
2003 4,176 3,954 222 5.3
2004 4,151 3,966 185 4.5
2005 4,096 3,908 188 4.6
2006 4,144 3,947 198 4.8
2007 4,130 3,948 182 4.4
2008 4,177 3,940 238 5.7
2009 4,206 3,798 408 9.7
NJ Dept of Labor
The above job statistics reflect national and state trends resulting from the Great Recession and the attendant rise in unemployment. The figures for 2009 show an unemployment rate marginally higher than the NJ and US rates. The rates above also fail to show the number of workers whose unemployment benefits have expired and are no longer seeking work.
Given the current economic climate it seems reasonable to assume that there will be no job growth for the foreseeable future, with any future job growth seeming rather anemic compared the past expansions.
E. A determination of the municipality's present and prospective fair share of low and moderate income housing and its capacity to accommodate low and moderate income housing.
The Borough has a reasonable share of affordable housing and expects that future housing growth will occur in two areas. First is the proposed Senior Living Overlay Zone between North 10th and 12th Streets which will only allow age restricted housing with a percentage set aside as affordable. Second is infill and replacement housing in the residential zone districts.
62
Borough of Kenilworth 2011 Master Plan
F. A consideration of the lands that are most appropriate for the construction of low and moderate income housing, including structures which may be rehabilitated and lands of developers, if any, who have expressed a commitment to provide low and moderate income housing.
Several specific zoning changes are envisioned at this time as outlined in #5 above. A Senior Living Overlay Zone is proposed between North 10th and 12th Streets. Any senior housing built will include affordable units.
The Borough will also investigate the possibility of placing an additional Group Home for the Developmentally Disabled in town to provide additional affordable housing units. This would accommodate a portion of the population in need of housing as well as address the need of local residents.

63
Borough of Kenilworth 2011 Master Plan
V. CONCLUSION
The Borough’s Housing Element projects little future single family residential growth in the foreseeable future.
The Borough anticipates that affordable housing units will be generated by the proposed Senior Living Overlay zone. The Borough also will look into the possibility of establishing an additional group home for the Developmentally Disabled which by its very nature would constitute affordable housing.

64
Borough of Kenilworth 2011 Master Plan
STATEMENT OF PLAN RELATIONSHIPS
65
Borough of Kenilworth 2011 Master Plan
I. INTRODUCTION
The New Jersey Municipal Land Use Law (MLUL) requires that the Borough state the
relationship of its Master Plan to the plans of adjacent communities, the Union County
Master Plan, the State Development and Redevelopment Plan (SDRP), and the District
Solid Waste Management Plan.
The policy of the Borough of Kenilworth is to work with neighboring municipalities, the
County, and the State, in order to advance sound planning and develop compatible plans.
This section of the Borough Master Plan analyzes the relationship of the Borough plan to
the plans of the State, the County, and adjoining municipalities.
II. ANALYSIS OF SURROUNDING COMMUNITIES
The Borough of Kenilworth is bordered by Union Township to the north and east, Roselle
Park Borough to the south, Cranford Township to the south and Springfield Township to the
west.
A. Union Township
Bordering Kenilworth to the north and east, Union Township adjoins well over half of the
Borough. Along the northern border Union public lands adjoin Borough parkland.
Industrial lands adjoin the Borough’s Industrial and Commercial zones. Further east,
Galloping Hill Park straddles the Union/Kenilworth border. Along the eastern boundary,
retail business and both one family and senior citizen residential zones adjoin the
Borough’s Office Research and Industrial zones. With the exception of the industrial zone
adjoining Union residential zoning, the districts are compatible with each other.
B. Roselle Park Borough
Kenilworth shares its southern border along Colfax Avenue and Sumner Avenue with
Roselle Park Borough. Kenilworth zoning in this area calls for residential uses and industrial
uses. Roselle Park zones the adjoining lands as R-1 and R-4. Both are Residential zones.
The R-1 zone south of Colfax Avenue allows single family residential homes. The R-4
Garden Apartment District south of Sumner Avenue adjoins the Borough’s Industrial zone.
The Garden Apartment zone provides a transition use from the Industrial zone in
Kenilworth. The residential districts along Colfax Avenue are consistent with one another.

66
Borough of Kenilworth 2011 Master Plan
C. Cranford Township
Kenilworth shares a land boundary with Cranford to the south and west. R-1 and R-3 one
family residential districts abut Borough zoned residential land. The Orange Avenue
School and the Cranford Pool adjoin Kenilworth residential zones. Along the western
boundary of Kenilworth and Cranford is Nomahegan Park. Kenilworth has zoned all
county open space as Park. These zone districts are consistent with each other.
D. Springfield Township
Directly abutting Kenilworth to the west is Springfield Township. The portion of
Springfield bordering Kenilworth consists of lands planned for public open space
associated with Lenape Park, the Rahway River, and Nomahegan Brook. These areas are
zoned OS-GU for Open Space –Government Use which allows public parks and open
space. The land use plans along the Springfield and Kenilworth common border are
consistent.
III. UNION COUNTY PLAN
In 1998 Union County prepared a Master Plan consisting of the following elements:
Goals and Objectives
Demographics
Land Use Plan
Circulation/Transportation Plan
Economic Development Plan
Primary plan goals are as follows:
A. Housing
Goal: Promote the provision of a broad range of housing opportunities for all income
levels and household types by encouraging the maintenance or rehabilitation of the
existing housing stock and through the construction of new housing units.
B. Development
Goal: To facilitate the development of Union County by directing new growth to
environmentally suitable areas that can be provided with essential infrastructure and
support facilities and to revitalize the urban centers and corridors within the County.
67
Borough of Kenilworth 2011 Master Plan
C. Transportation/Circulation
Goal: To promote the development of an improved and balanced multi-modal
transportation system that integrates and links highway, bus, rail, air, waterborne transport
systems and pedestrian and bicycle facilities.
D. Economic Development
Goal: Continue County sponsored economic development efforts to reduce
unemployment, provide year-round employment opportunities and enhance the tax base
by encouraging compatible industrial, commercial, office and retail facilities to locate or
expand in Union County.
E. Conclusion
Planning goals in Kenilworth are consistent with goals identified in the Union County Master
Plan.
IV. SOLID WASTE MANAGEMENT PLAN
The New Jersey Solid Waste Management Act (N.J.S.A. 13:1E-1 et seq.) established
a comprehensive system for the management of solid waste in New Jersey. The act
designated all of the state's counties and the Hackensack Meadowlands District as solid
waste management districts. On August 13, 1980, the Department of Environmental
Protection (DEP) approved the Union County District Solid Waste Management Plan. DEP
passed the most recent amendment to this Plan on April 27, 2006.
Kenilworth complies with all state refuse and recycling requirements and will continue to
work with the County to achieve the planning goals enumerated in the Solid Waste
Management Plan.

68
Borough of Kenilworth 2011 Master Plan
V. THE NJ STATE DEVELOPMENT AND
REDEVELOPMENT PLAN (SDRP)
The State Planning Commission adopted the State Development and Redevelopment
Plan (SDRP) in June of 1992 and adopted a revised SDRP on March 1, 2001. A new
SDRP was released for cross acceptance in 2004. The SDRP contains goals,
objectives, and policies regarding the future development and redevelopment of New
Jersey. The primary objective of the SDRP is to guide development to areas where
infrastructure is available or can be readily extended such as along existing
transportation corridors, in developed or developing suburbs, and in urban areas. New
growth and development should be located in "centers," which are "compact" forms of
development, rather than in "sprawl" development. The overall goal of the SDRP is to
promote development and redevelopment that will consume less land, deplete fewer
natural resources and use the State's infrastructure more efficiently. Among these is
the redevelopment and revitalization of New Jersey's cities and urban areas. As set forth in
the 2001 SDRP Kenilworth was placed within the Metropolitan (PA1) and the Parks and
Natural Areas Planning Area as designated by the State Plan.
While the majority of the Borough is identified as within the Metropolitan Planning Area,
County park lands are identified by the state as Parks and Natural Areas associated with
the Rahway River stream corridor.
Kenilworth zoning is consistent with the Metropolitan Planning Area 1 (PA1) designation by
the State Plan.

69
Borough of Kenilworth 2011 Master Plan
APPENDIX 1
DEMOGRAPHIC PROFILE
Based on the 2000 US Census and the 2003 Kenilworth Smart Growth Report.
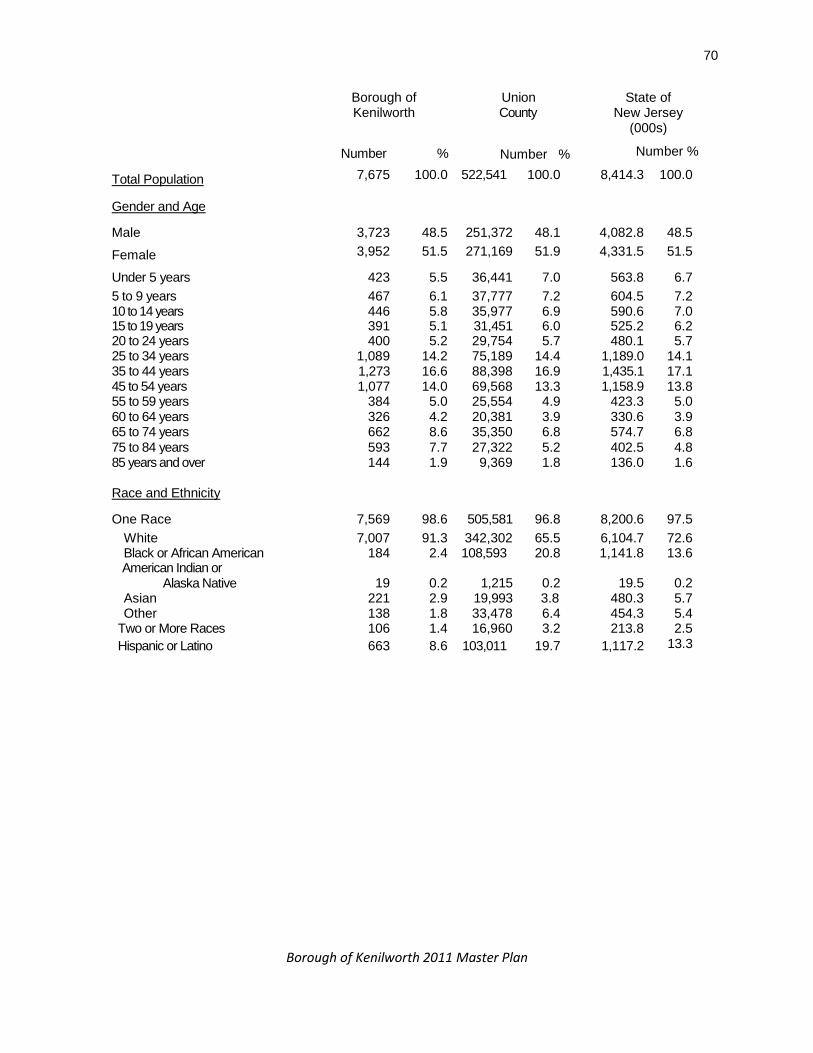
70
Borough of Kenilworth 2011 Master Plan
Borough of Kenilworth
Number %
Union County
Number %
State of New Jersey
(000s)
Number %
Total Population 7,675 100.0 522,541 100.0 8,414.3 100.0
Gender and Age
Male 3,723 48.5 251,372 48.1 4,082.8 48.5
Female 3,952 51.5 271,169 51.9 4,331.5 51.5
Under 5 years 423 5.5 36,441 7.0 563.8 6.7
5 to 9 years 467 6.1 37,777 7.2 604.5 7.2 10 to 14 years 446 5.8 35,977 6.9 590.6 7.0 15 to 19 years 391 5.1 31,451 6.0 525.2 6.2 20 to 24 years 400 5.2 29,754 5.7 480.1 5.7 25 to 34 years 1,089 14.2 75,189 14.4 1,189.0 14.1 35 to 44 years 1,273 16.6 88,398 16.9 1,435.1 17.1 45 to 54 years 1,077 14.0 69,568 13.3 1,158.9 13.8 55 to 59 years 384 5.0 25,554 4.9 423.3 5.0 60 to 64 years 326 4.2 20,381 3.9 330.6 3.9 65 to 74 years 662 8.6 35,350 6.8 574.7 6.8 75 to 84 years 593 7.7 27,322 5.2 402.5 4.8 85 years and over 144 1.9 9,369 1.8 136.0 1.6
Race and Ethnicity
One Race 7,569 98.6 505,581 96.8 8,200.6 97.5
White 7,007 91.3 342,302 65.5 6,104.7 72.6 Black or African American 184 2.4 108,593 20.8 1,141.8 13.6 American Indian or
Alaska Native 19 0.2 1,215 0.2 19.5 0.2 Asian 221 2.9 19,993 3.8 480.3 5.7 Other 138 1.8 33,478 6.4 454.3 5.4
Two or More Races 106 1.4 16,960 3.2 213.8 2.5
Hispanic or Latino 663 8.6 103,011 19.7 1,117.2 13.3
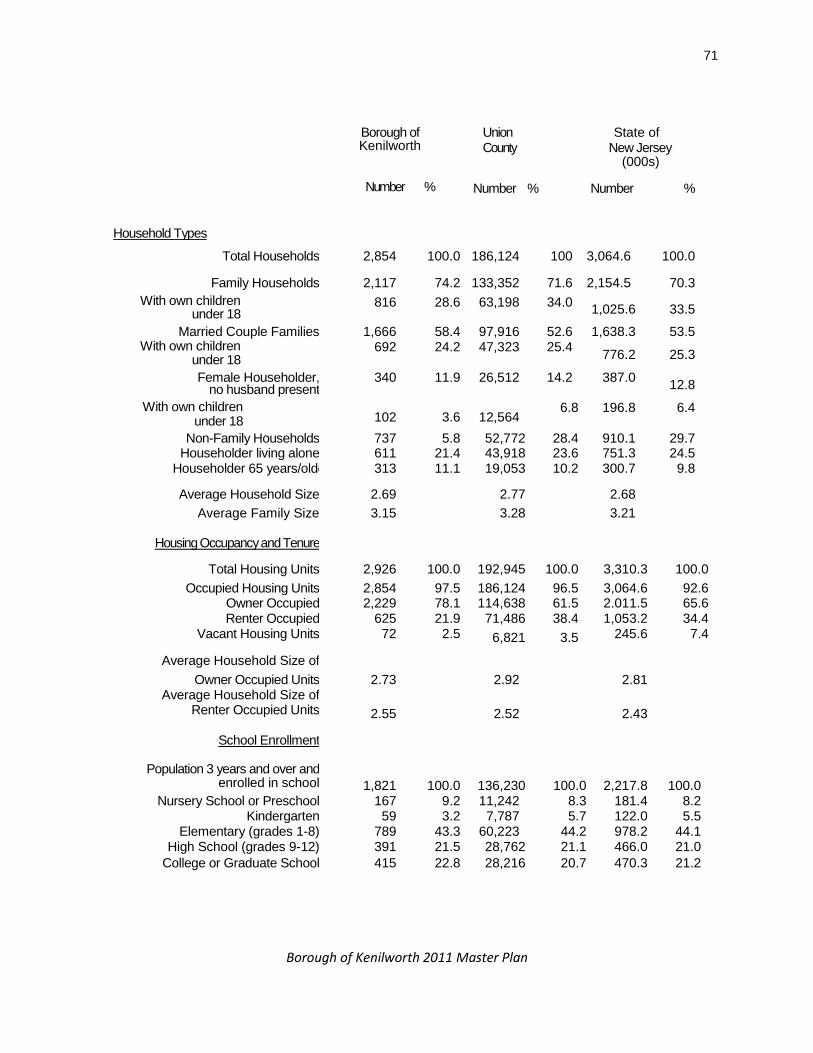
71
Borough of Kenilworth 2011 Master Plan
Household Types
Borough of Kenilworth
Number %
Union State of County New Jersey
(000s)
Number % Number %
Total Households 2,854 100.0 186,124 100 3,064.6 100.0
Family Households 2,117 74.2 133,352 71.6 2,154.5 70.3
With own children under 18
years
816 28.6 63,198 34.0 1,025.6 33.5
Married Couple Families 1,666 58.4 97,916 52.6 1,638.3 53.5 With own children
under 18 years
692 24.2 47,323 25.4 776.2 25.3
Female Householder, no husband present
340 11.9 26,512 14.2 387.0 12.8
With own children under 18
years
102 3.6 12,564 6.8 196.8 6.4
Non-Family Households 737 5.8 52,772 28.4 910.1 29.7 Householder living alone 611 21.4 43,918 23.6 751.3 24.5
Householder 65 years/older 313 11.1 19,053 10.2 300.7 9.8
Average Household Size 2.69 2.77 2.68
Average Family Size 3.15 3.28 3.21
Housing Occupancy and Tenure
Total Housing Units 2,926 100.0 192,945 100.0 3,310.3 100.0
Occupied Housing Units 2,854 97.5 186,124 96.5 3,064.6 92.6 Owner Occupied 2,229 78.1 114,638 61.5 2.011.5 65.6 Renter Occupied 625 21.9 71,486 38.4 1,053.2 34.4
Vacant Housing Units 72 2.5 6,821 3.5 245.6 7.4
Average Household Size of
Owner Occupied Units 2.73 2.92 2.81 Average Household Size of
Renter Occupied Units 2.55 2.52 2.43
School Enrollment
Population 3 years and over and enrolled in school 1,821 100.0 136,230 100.0 2,217.8 100.0
Nursery School or Preschool 167 9.2 11,242 8.3 181.4 8.2 Kindergarten 59 3.2 7,787 5.7 122.0 5.5
Elementary (grades 1-8) 789 43.3 60,223 44.2 978.2 44.1 High School (grades 9-12) 391 21.5 28,762 21.1 466.0 21.0
College or Graduate School 415 22.8 28,216 20.7 470.3 21.2
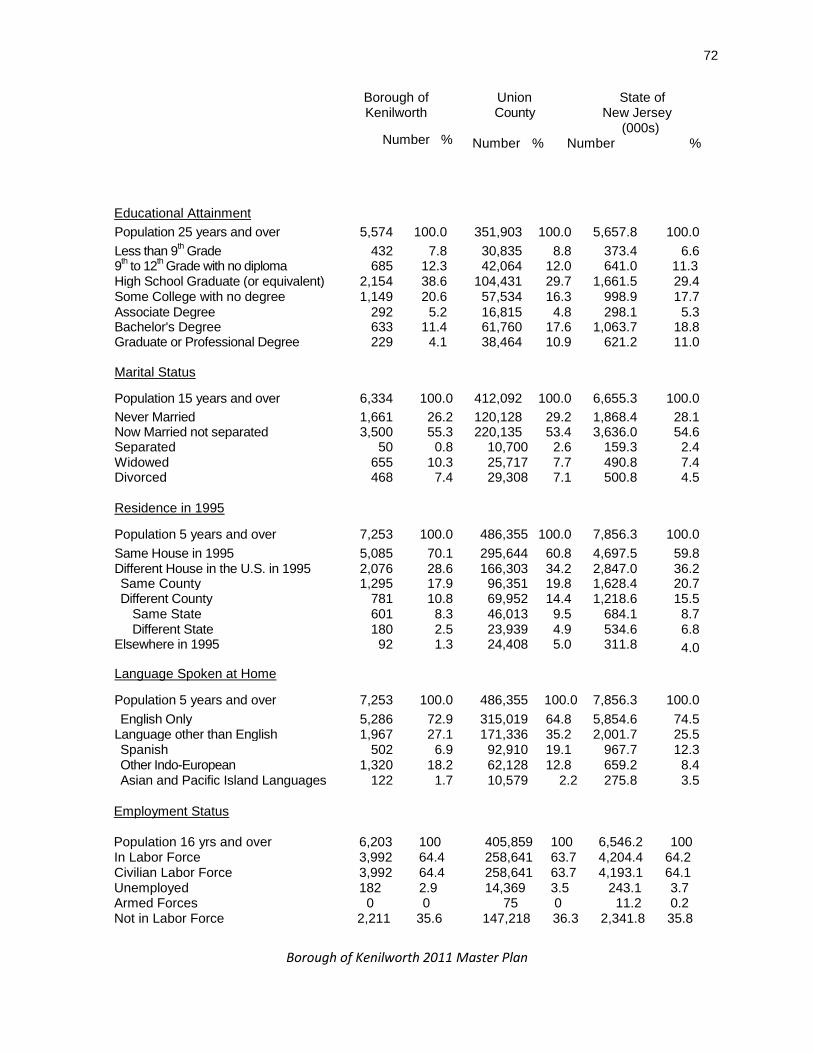
72
Borough of Kenilworth 2011 Master Plan
Educational Attainment
Borough of Kenilworth
Number %
Union State of County New Jersey
(000s) Number % Number %
Population 25 years and over 5,574 100.0 351,903 100.0 5,657.8 100.0
Less than 9th Grade 432 7.8 30,835 8.8 373.4 6.6
9th to 12
th Grade with no diploma 685 12.3 42,064 12.0 641.0 11.3
High School Graduate (or equivalent) 2,154 38.6 104,431 29.7 1,661.5 29.4 Some College with no degree 1,149 20.6 57,534 16.3 998.9 17.7 Associate Degree 292 5.2 16,815 4.8 298.1 5.3 Bachelor's Degree 633 11.4 61,760 17.6 1,063.7 18.8 Graduate or Professional Degree 229 4.1 38,464 10.9 621.2 11.0
Marital Status
Population 15 years and over 6,334 100.0 412,092 100.0 6,655.3 100.0
Never Married 1,661 26.2 120,128 29.2 1,868.4 28.1 Now Married not separated 3,500 55.3 220,135 53.4 3,636.0 54.6 Separated 50 0.8 10,700 2.6 159.3 2.4 Widowed 655 10.3 25,717 7.7 490.8 7.4 Divorced 468 7.4 29,308 7.1 500.8 4.5
Residence in 1995
Population 5 years and over 7,253 100.0 486,355 100.0 7,856.3 100.0
Same House in 1995 5,085 70.1 295,644 60.8 4,697.5 59.8 Different House in the U.S. in 1995 2,076 28.6 166,303 34.2 2,847.0 36.2 Same County 1,295 17.9 96,351 19.8 1,628.4 20.7 Different County 781 10.8 69,952 14.4 1,218.6 15.5
Same State 601 8.3 46,013 9.5 684.1 8.7 Different State 180 2.5 23,939 4.9 534.6 6.8
Elsewhere in 1995 92 1.3 24,408 5.0 311.8 4.0
Language Spoken at Home
Population 5 years and over 7,253 100.0 486,355 100.0 7,856.3 100.0
English Only 5,286 72.9 315,019 64.8 5,854.6 74.5 Language other than English 1,967 27.1 171,336 35.2 2,001.7 25.5 Spanish 502 6.9 92,910 19.1 967.7 12.3 Other Indo-European 1,320 18.2 62,128 12.8 659.2 8.4 Asian and Pacific Island Languages 122 1.7 10,579 2.2 275.8 3.5
Employment Status Population 16 yrs and over 6,203 100 405,859 100 6,546.2 100
In Labor Force 3,992 64.4 258,641 63.7 4,204.4 64.2 Civilian Labor Force 3,992 64.4 258,641 63.7 4,193.1 64.1 Unemployed 182 2.9 14,369 3.5 243.1 3.7 Armed Forces 0 0 75 0 11.2 0.2 Not in Labor Force 2,211 35.6 147,218 36.3 2,341.8 35.8

73
Borough of Kenilworth 2011 Master Plan
Commuting to Work
Borough of Kenilworth
Number %
Union State of County New Jersey(000s) Number % Number %
Workers 16 years and over 3,716 100.0 238,606 100.0 3,876.4 100.0
Car, truck or van, drove alone 3,176 85.5 169,325 71.0 2,828.3 73.0
Car, truck or van, carpooled 314 8.4 27,686 11.6 412.3 10.6
Public transportation (including Taxicab)
102 2.7 25,294 10.6 371.5 9.6
Walked 36 1.0 7,729 3.2 121.3 3.1 Other means 32 0.9 2,880 1.2 36.5 0.9
Worked at home 56 1.5 5,692 2.4 106.6 2.7
Mean Travel Time to Work (minutes) 24.6
28.7
30.0
Occupation
Employed Civilian Population 16 years and over
3,810 100.0 244,197 100 3,950.0 100.0 Management, Professional and
Related occupations 1,161 30.5 86,482 35.4 1,501.0 38.0 Service occupations 619 16.2 32,436 13.3 539.0 13.6 Sales and Office occupations 1,194 31.3 69,268 28.4 1,123.9 26.5 Farming, Fishing and Forestry 8 0.2 141 0.1 7.0 0.2 Construction, Extraction and
Maintenance 402 10.6 18,555 7.6 306.2 7.8 Production, Transportation and
Material Moving 426 11.2 37,315 15.3 473.0 12.0
Industry
Agriculture, Forestry, Fishing, Hunting and Mining
8 0.2 158 0.1 12.6 0.3 Construction 186 4.8 12,151 5.0 220.8 5.6
Manufacturing 615 16.1 36,638 15.0 472.7 12.0 Wholesale Trade 247 6.5 11,400 4.7 173.2 4.4 Retail Trade 320 8.4 24,964 10.2 447.3 11.3
Transportation, Warehousing and Utilities
284 7.5 18,211 7.5 234.8 5.9
Information 142 3.7 10,929 4.5 173.9 4.4 Finance, Insurance, Real Estate 320 8.4 23,493 9.6 352.7 8.9 Professional, Scientific, Management and Administrative
370 9.7 27,926 11.4 453.8 11.5
Educational, Health and Social Services 640 16.8 44,881 18.4 783.1 19.8 Arts, Entertainment, Recreation,
Accommodation and Food 289 7.6 13,067 5.4 271.9 6.9
Other Services 187 4.9 11,047 4.5 173.7 4.4
Public Administration 204 5.4 9,332 3.8 179.5 4.5

74
Borough of Kenilworth 2011 Master Plan
Class of Worker
Borough of Kenilworth
Number %
Union State of County New Jersey
(000s) Number % Number %
Private Wage and Salary Workers 3,103 81.4 201,538 82.5 3,193.5 80.8
Government Workers 490 12.9 31,341 12.8 550.4 13.9 Self-Employed 198 5.2 10,906 4.5 197.7 5.0 Unpaid Family Workers 19 0.5 412 0.2 8.5 0.2
Income in 1999
Households 2,846 100.0 186,003 100.0 3,065.8 100.0
Less than $10,000 74 2.6 12,758 6.9 213.9 7.0 $10,000 to $14,999 129 4.5 8,914 4.8 143.8 4.7 $15,000 to $24,999 271 9.5 17,734 9.5 288.6 9.4 $25,000 to $34,999 310 10.9 18,981 10.2 305.4 10.0 $35,000 to $49,999 396 13.8 25,624 13.8 437.4 14.3 $50,000 to $74,999 718 25.2 36,653 19.7 608.2 19.8 $75,000 to $99,999 503 17.7 24,363 13.1 413.9 13.5 $100,000 to $149,999 317 11.1 23,858 12.8 391.1 12.8 $150,000 to $199,999 77 2.7 8,465 4.5 130.5 4.3 $200,000 or more 51 1.8 8,743 4.7 132.8 4.3
Median Household Income $59,929 $55,339 $55,146
Families 2,114 100.0 134,140 100.0 2,167.6 100.0
Less than $10,000 32 1.5 5,365 4.0 88.8 4.1 $10,000 to $14,999 15 0.7 3,686 2.7 58.5 2.7 $15,000 to $24,999 148 7.0 9,669 7.2 156.9 7.2 $25,000 to $34,999 185 8.8 12,425 9.3 189.8 8.8 $35,000 to $49,999 284 13.4 17,862 13.3 293.4 13.5 $50,000 to $74,999 599 28.3 28,358 21.1 463.7 21.4 $75,000 to $99,999 460 21.8 20,277 15.1 342.1 15.8 $100,000 to $149,999 304 14.4 21,164 15.8 340.4 15.7 $150,000 to $199,999 46 2.2 7,417 5.5 115.7 5.3 $200,000 or more 41 1.9 7,917 5.9 118.1 5.4
Median Household Income $66,500 $65,234 $65,370
Per Capita Income $24,343 $26,992 $27,006
% Belo Below
w % Below % Below Poverty Status in 1999 Poverty Poverty Poverty Level Level Level
Families 40 1.9 8,512 6.3 135.5 6.3 With related children under 18 32 3.4 6,507 9.2 103.9 9.2
Families with Female Householder, no husband present 5 1.5 4,279 17.0 72.3 19.4
With related children under 18 5 3.7 3,669 24.7 62.6 27.4 Individuals 157 2.0 43,319 8.4 699.7 8.5 18 years and over 121 2.0 23,525 7.6 471.9 7.6
65 years and over 44 3.2 5,571 8.0 83.3 7.8
75
Borough of Kenilworth 2011 Master Plan
APPENDIX 2
MAPS
1. Existing Zoning Map - 1996
2. Existing Land Uses – 2010
3. Proposed Zone Districts - 2011
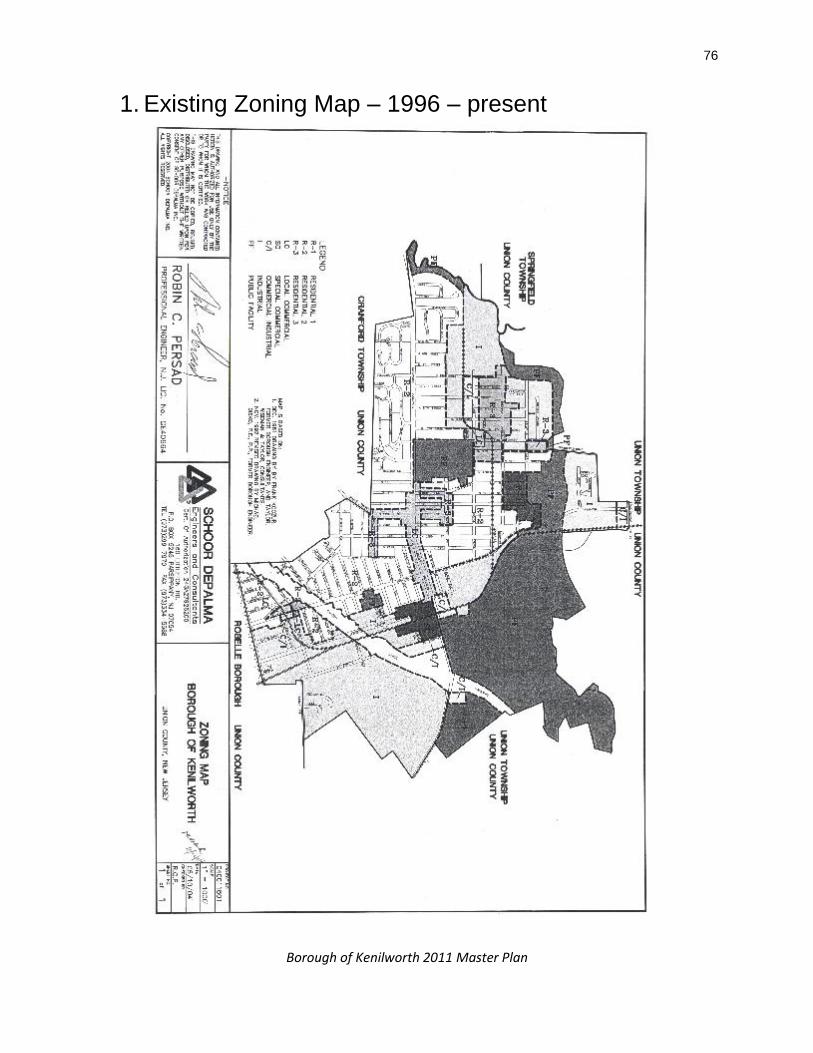
76
Borough of Kenilworth 2011 Master Plan
1. Existing Zoning Map – 1996 – present
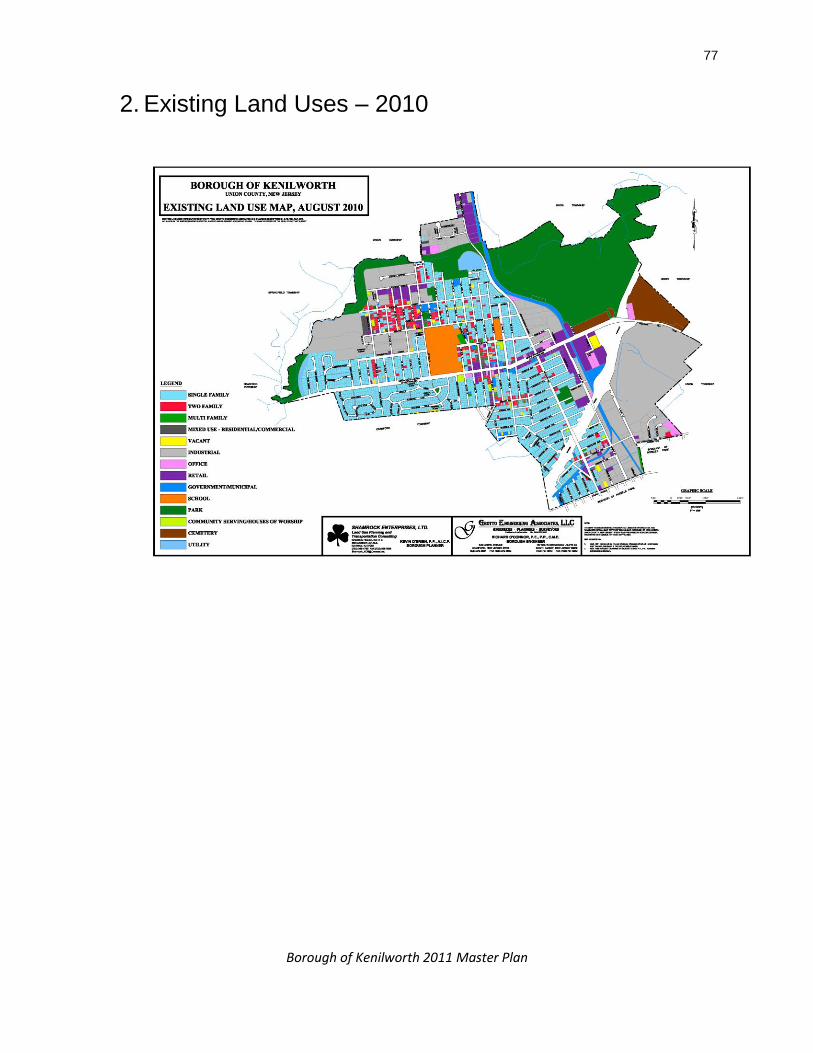
77
Borough of Kenilworth 2011 Master Plan
2. Existing Land Uses – 2010

78
Borough of Kenilworth 2011 Master Plan
3. Proposed Zone Districts - 2010
END OF DOCUMENT