Boronic acids as molecular inks for surface ... · 0.010 0.015 0.020 0.025 ... 0.06 0.08 0.10 0.12...
18
S-1 Electronic Supplementary Information Boronic acids as molecular inks for surface functionalization of polyvinyl alcohol substrates Ryuhei Nishiyabu,* Miku Tomura, Tomo Okade, and Yuji Kubo* Department of Applied Chemistry, Graduate School of Urban Environmental Sciences, Tokyo Metropolitan University, Minami-ohsawa, Hachioji, Tokyo 192-0397, Japan. Tel: +81-42-677-1111, Fax: +81-42-677-2821, E-mail: [email protected] *Corresponding authors: Dr. Ryuhei Nishiyabu and Prof. Dr. Yuji Kubo Electronic Supplementary Material (ESI) for New Journal of Chemistry. This journal is © The Royal Society of Chemistry and the Centre National de la Recherche Scientifique 2018
Transcript of Boronic acids as molecular inks for surface ... · 0.010 0.015 0.020 0.025 ... 0.06 0.08 0.10 0.12...

S-1
Electronic Supplementary Information
Boronic acids as molecular inks for surface functionalization of polyvinyl alcohol
substrates
Ryuhei Nishiyabu,* Miku Tomura, Tomo Okade, and Yuji Kubo*
Department of Applied Chemistry, Graduate School of Urban Environmental Sciences, Tokyo
Metropolitan University, Minami-ohsawa, Hachioji, Tokyo 192-0397, Japan. Tel: +81-42-677-1111,
Fax: +81-42-677-2821, E-mail: [email protected]
*Corresponding authors: Dr. Ryuhei Nishiyabu and Prof. Dr. Yuji Kubo
Electronic Supplementary Material (ESI) for New Journal of Chemistry.This journal is © The Royal Society of Chemistry and the Centre National de la Recherche Scientifique 2018
S-2
Scheme S1 Synthetic route for a boronic acid-appended dimethylaminoazobenzene (4).
Scheme S2 Synthetic route for a boronic acid-appended fluoroalkane (6).
Fig. S1 1H NMR spectrum of 4 in DMSO-d6.

S-3
Fig. S2 13C NMR spectrum of 4 in DMSO-d6.
Fig. S3 11B NMR spectrum of 4 in DMSO-d6.

S-4
Fig. S4 HRMS (ESI) of the isolated product (top and middle) and simulated (bottom) isotope
patterns of [4 + H]+.

S-5
Fig. S5 1H NMR spectrum of 6 in DMSO-d6.
Fig. S6 13C NMR spectrum of 6 in DMSO-d6.

S-6
Fig. S7 11B NMR spectrum of 6 in DMSO-d6.
Fig. S8 19F NMR spectrum of 6 in DMSO-d6.

S-7
Fig. S9 HRMS (ESI) of the product (top and middle) and simulated (bottom) isotope patterns of [6
+ Na]+.
Fig. S10 SEM image of the cross-section of the PVA film.
Film
S-8
200 150 100 50 0 -50
(ppm)
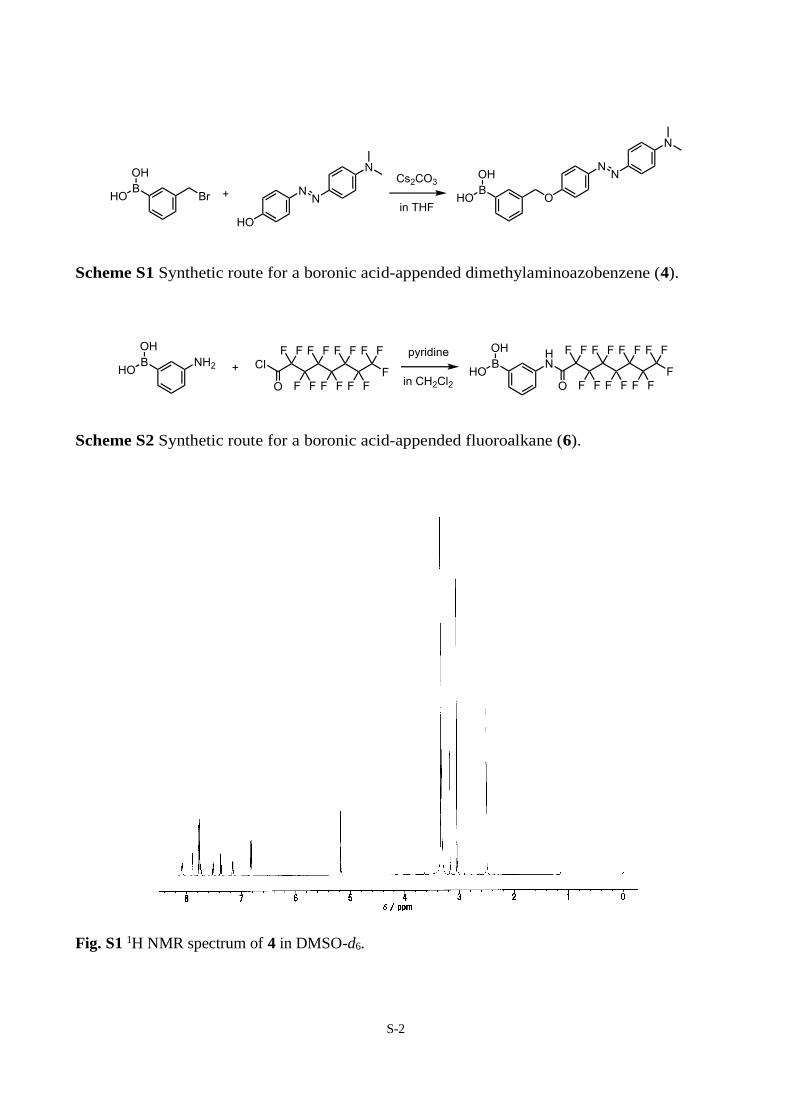
Fig. S11 Solid state 13C CP/MAS NMR spectrum of the PVA film.
Fig. S12 Photograph of the PVA-GA film on the glass slide (left) and SEM image of the cross-section
of the PVA-GA film (right).
200 150 100 50 0 -50
(ppm)
Fig. S13 Solid state 13C CP/MAS NMR spectrum of a PVA-GA film.
Film

S-9
Fig. S14 Photograph of the PVA-BA film on the glass slide (left) and SEM image of the cross-section
of the PVA-BA film (right).
200 150 100 50 0 -50
(ppm)
Fig. S15 Solid state 13C CP/MAS NMR spectrum of the PVA-BA film.
(a) (b)
Fig. S16 Photographs of (a) the empty marker pen and (b) the marker pen filled with methanol
solution containing 1a.
Film
S-10
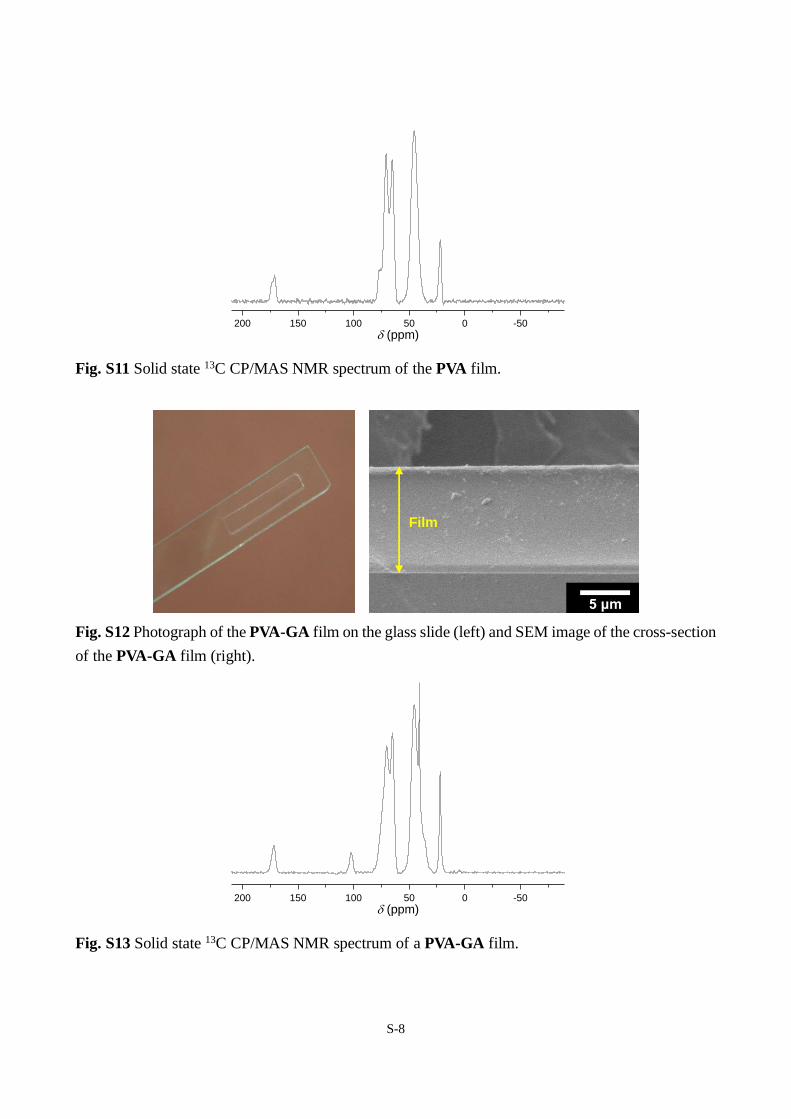
Fig. S17 Photographs of the 1a/PVA film on the glass slide (a) before and (b) after washing with
methanol.
500 550 600 6500.0
0.1
0.2
0.3
Ab
sorb
an
ce
Wavelength (nm)
Fig. S18 UV-vis absorption spectra of the 1a/PVA film before (circle) and after (square) washing
with methanol.
S-11
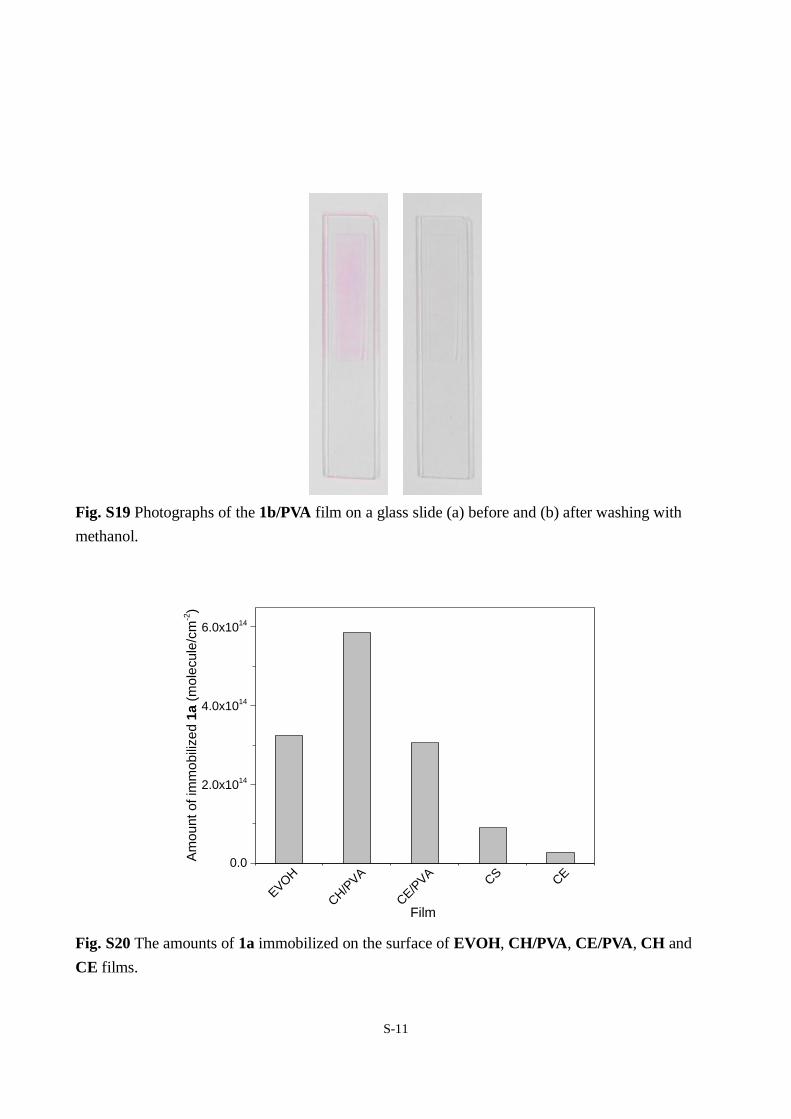
Fig. S19 Photographs of the 1b/PVA film on a glass slide (a) before and (b) after washing with
methanol.
EVOH
CH/P
VA
CE/P
VA
CS
CE
0.0
2.0x10¹⁴
4.0x10¹⁴
6.0x10¹⁴
Am
ou
nt
of
imm
ob
ilize
d 1
a (
mo
lecule
/cm
-2)
Film
Fig. S20 The amounts of 1a immobilized on the surface of EVOH, CH/PVA, CE/PVA, CH and
CE films.
S-12
500 400 300 200 100
404 402 400 398 396 194 192 190 188
C1s
B1s
N1s
Co
unt
(arb
. u
nit)
Binding energy (eV)
O1s
Co
unt (a
rb. unit)
Binding energy (eV)
Co
unt (a
rb. unit)
Binding energy (eV)
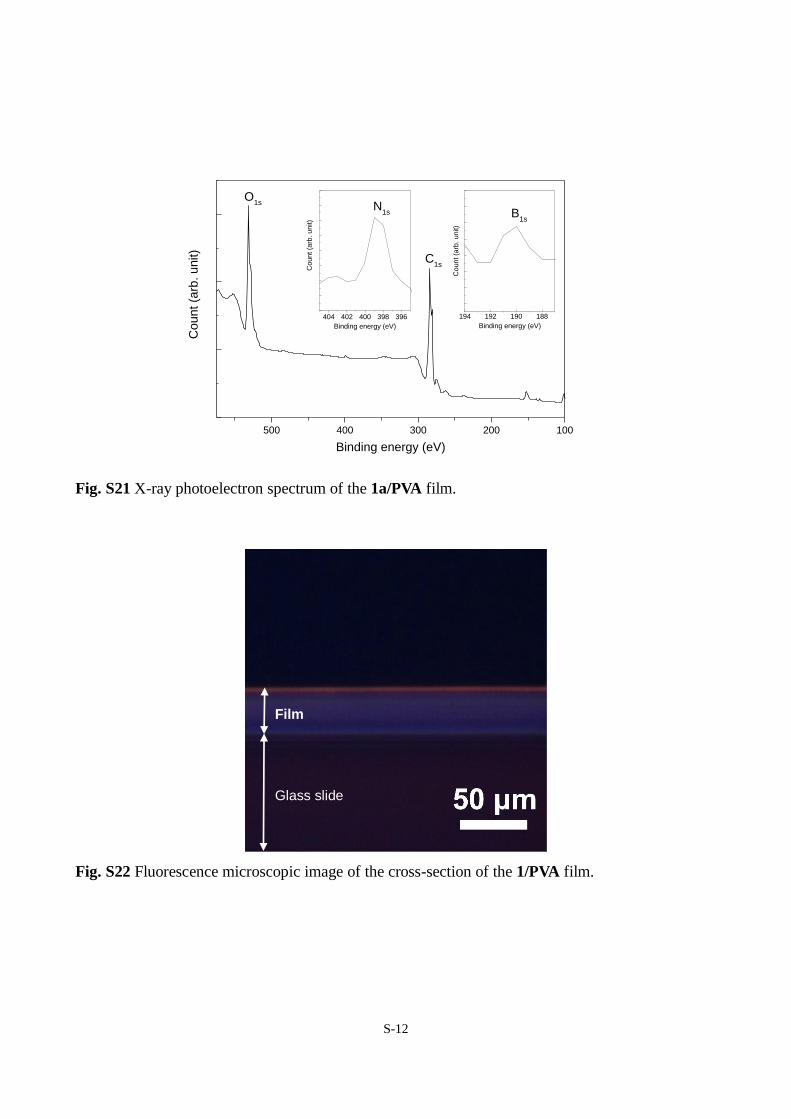
Fig. S21 X-ray photoelectron spectrum of the 1a/PVA film.
Fig. S22 Fluorescence microscopic image of the cross-section of the 1/PVA film.
Film
Glass slide

S-13
450 500 5500.00
0.05
0.10
0.15
Ab
sorb
an
ce
Wavelength (nm)
Fig. S23 UV-vis absorption spectra of the 2/PVA film before (circle) and after (square) washing with
methanol.
360 380 400 420 4400.000
0.005
0.010
0.015
0.020
0.025
Ab
sorb
an
ce
Wavelength (nm)
Fig. S24 UV-vis absorption spectra of the 3/PVA film before (circle) and after (square) washing with
methanol.

S-14
500 550 600 6500.00
0.05
0.10
0.15A
bsorb
an
ce
Wavelength (nm)
Fig. S25 UV-vis absorption spectra of the 1a/PVA-GA film before (circle) and after (square) washing
with methanol. The amount of immobilized 1a was determined to be 8.1 × 10¹⁴ molecule/cm2.
500 550 600 6500.0
0.1
0.2
0.3
Ab
sorb
an
ce
Wavelength (nm)
Fig. 26 UV-vis absorption spectra of 1a/PVA-BA film before (circle) and after (square) washing with
methanol. The amount of immobilized 1a was determined to be 1.4 × 10¹⁵ molecule/cm2.

S-15
350 400 450 500 550 600 6500.00
0.02
0.04
0.06
0.08
0.10
0.12
Absorb
ance
Wavelength (nm)
(a)
350 400 450 500 550 600 6500.00
0.02
0.04
0.06
0.08
0.10
0.12
Absorb
ance
Wavelength (nm)
(b)
350 400 450 500 550 600 6500.00
0.02
0.04
0.06
0.08
0.10
0.12
Ab
sorb
an
ce
Wavelength (nm)
(c)
350 400 450 500 550 600 6500.00
0.02
0.04
0.06
0.08
0.10
0.12
Ab
sorb
an
ce
Wavelength (nm)
(d)
350 400 450 500 550 600 6500.00
0.02
0.04
0.06
0.08
0.10
0.12
Absorb
ance
Wavelength (nm)
(e)
Fig. S27 Absorption spectral changes of the 4/PVA-BA film after repetitive immersion (5 min) in
acidic (solid line) and basic (dashed line) aqueous solutions. (a) First, (b) second, (c) third, (d) fourth
and (e) fifth cycles.
S-16
400 450 500 550 600 6500
50
100
150
200
250
30 min
Flu
ore
scence inte
nsity (
arb
. unit)
Wavelength (nm)
0 min
(a)
0 5 10 15 20 25 300
50
100
150
200
250
(b)
Flu
ore
scence inte
nsity (
arb
. unit)
Time (min)
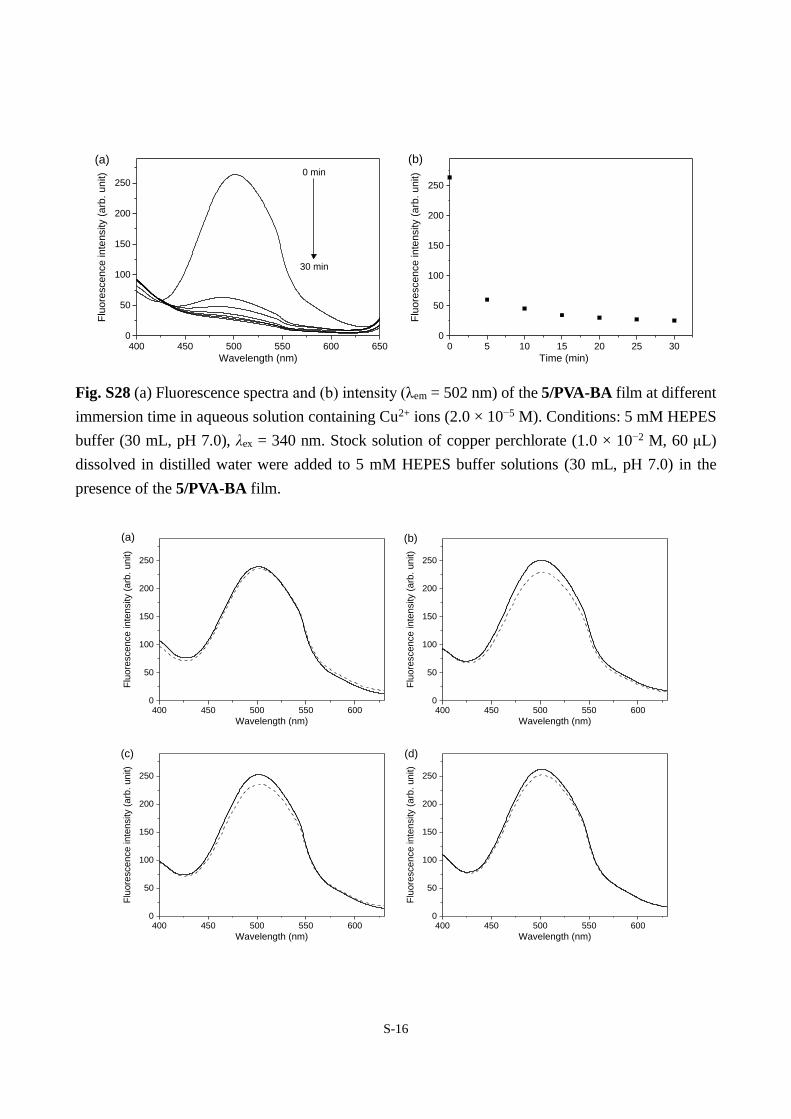
Fig. S28 (a) Fluorescence spectra and (b) intensity (λem = 502 nm) of the 5/PVA-BA film at different
immersion time in aqueous solution containing Cu2+ ions (2.0 × 10⁻⁵ M). Conditions: 5 mM HEPES
buffer (30 mL, pH 7.0), λex = 340 nm. Stock solution of copper perchlorate (1.0 × 10⁻² M, 60 μL)
dissolved in distilled water were added to 5 mM HEPES buffer solutions (30 mL, pH 7.0) in the
presence of the 5/PVA-BA film.
400 450 500 550 6000
50
100
150
200
250
Flu
ore
sce
nce
inte
nsity (
arb
. u
nit)
Wavelength (nm)
(a)
400 450 500 550 6000
50
100
150
200
250
(b)
Flu
ore
sce
nce
inte
nsity (
arb
. u
nit)
Wavelength (nm)
400 450 500 550 6000
50
100
150
200
250
(c)
Flu
ore
sce
nce
inte
nsity (
arb
. u
nit)
Wavelength (nm)
400 450 500 550 6000
50
100
150
200
250
(d)
Flu
ore
sce
nce
inte
nsity (
arb
. u
nit)
Wavelength (nm)

S-17
400 450 500 550 6000
50
100
150
200
250
(e)
Flu
ore
sce
nce
inte
nsity (
arb
. u
nit)
Wavelength (nm)
400 450 500 550 6000
50
100
150
200
250
(f)
Flu
ore
sce
nce
inte
nsity (
arb
. u
nit)
Wavelength (nm)
400 450 500 550 6000
50
100
150
200
250
(g)
Flu
ore
sce
nce
inte
nsity (
arb
. u
nit)
Wavelength (nm)
400 450 500 550 6000
50
100
150
200
250
(h)
Flu
ore
sce
nce
inte
nsity (
arb
. u
nit)
Wavelength (nm)
400 450 500 550 6000
50
100
150
200
250
(i)
Flu
ore
sce
nce
inte
nsity (
arb
. u
nit)
Wavelength (nm)
400 450 500 550 6000
50
100
150
200
250
(j)
Flu
ore
sce
nce
inte
nsity (
arb
. u
nit)
Wavelength (nm)
400 450 500 550 6000
50
100
150
200
250
(k)
Flu
ore
sce
nce
inte
nsity (
arb
. u
nit)
Wavelength (nm)
400 450 500 550 6000
50
100
150
200
250
(l)
Flu
ore
sce
nce
inte
nsity (
arb
. u
nit)
Wavelength (nm)

S-18
400 450 500 550 6000
50
100
150
200
250
(m)
Flu
ore
sce
nce
inte
nsity (
arb
. u
nit)
Wavelength (nm)
Fig. S29 Fluorescence spectra of 5/PVA-BA films after immersion in aqueous solution in the absence
(solid line) and the presence (dashed line) of (a) Na+, (b) K+, (c) Mg2+, (d) Ca2+, (e) Fe3+, (f) Co2+, (g)
Ni2+, (h) Cu2+, (i) Zn2+, (j) Cd2+, (k) Hg2+, (l) Al3+, and (m) Pb2+ ions. Conditions: 5 mM HEPES
buffer (30 mL, pH 7.0), [Mn+] = 2.0 × 10⁻⁵ M, λex = 340 nm. Solutions of metal perchlorates dissolved
in distilled water (1.0 × 10⁻² M, 60 μL) were added to 5 mM HEPES buffer solutions (30 mL, pH
7.0) in the presence of the 5/PVA-BA films.
800 700 600 500 400 300 200 100
404 402 400 398 396 194 192 190 188
F1s
C1s
B1sN
1s
Co
unt
(arb
. u
nit)
Binding energy (eV)
O1s
Co
unt (a
rb. unit)
Binding energy (eV)
Co
unt (a
rb. unit)
Binding energy (eV)
Fig. S30 X-ray photoelectron spectrum of the 6/PVA film.
![Regio- and Stereoselective Homologation of 1,2-Bis(Boronic ...The new process would require regio-and stereoselective homologation of the 1,2-bis(boronic ester).[7,8] By combining](https://static.fdocuments.in/doc/165x107/5e33af77001eaa2c117ec11b/regio-and-stereoselective-homologation-of-12-bisboronic-the-new-process-would.jpg)