Boosting Object Proposals: From Pascal to COCObiwiproposals/boosting-coco/data/... ·...
9
Boosting Object Proposals: From Pascal to COCO Jordi Pont-Tuset and Luc Van Gool Computer Vision Lab, ETH Z¨ urich, Switzerland {jponttuset,vangool}@vision.ee.ethz.ch Abstract Computer vision in general, and object proposals in par- ticular, are nowadays strongly influenced by the databases on which researchers evaluate the performance of their al- gorithms. This paper studies the transition from the Pascal Visual Object Challenge dataset, which has been the bench- mark of reference for the last years, to the updated, bigger, and more challenging Microsoft Common Objects in Con- text. We first review and deeply analyze the new challenges, and opportunities, that this database presents. We then sur- vey the current state of the art in object proposals and eval- uate it focusing on how it generalizes to the new dataset. In sight of these results, we propose various lines of research to take advantage of the new benchmark and improve the techniques. We explore one of these lines, which leads to an improvement over the state of the art of +5.2%. 1. Introduction The sliding windows approach [27] dominated the object detection literature for several years. It consists in sweep- ing a large amount of locations and sizes in the image, represented by rectangular windows, and then applying an object/non-object classifier on each of them. The number of swept windows is usually in the order of millions, so to get a reasonable speed one needs to rely on very simple classi- fiers carefully implemented using tools like integral images. In order to reduce the number of windows to consider, and thus being able to apply more advanced classification machinery, the concept of objectness [1] arose; which pro- vides a reduced number of windows, in the order of hun- dreds or thousands, aiming at keeping the true objects as much as possible. These techniques have been improv- ing to get more quality and efficiency until the present days [28, 7, 20, 25], widely known as bounding-box object proposals methods: they propose a reduced set of windows aiming at representing the bounding box of the true objects. Object windows give us the location and scale of the ob- jects, but they miss a crucial queue for object detection: its shape. While a window representation might be good Figure 1. Example segmentation annotations from the three stud- ied databases: Pascal SegVOC12 [11], SBD [12], and COCO [19] enough for certain types of roughly-rectangular objects such as faces or cars, it is certainly not precise enough to repre- sent more deformable objects such as animals or plants; and one might need the mask of the object for applications like image editing or inpainting. In this context, the segmented object proposal techniques arose [5, 9], whose objective is to provide a reduced set of object segmentations, that is, a small set of binary image masks indicating sets of pixels belonging to an object in the image. It currently has become an active topic of research in computer vision [18, 4, 22, 15, 25, 17, 6, 10]. Annotated databases play a crucial role in the improve- ment of these techniques, both for training the algorithms and for benchmarking and comparing different approaches. The Pascal Visual Object Challenge [11] database has been the driving force behind many of the improvements in latest years, providing high-quality bounding-box and segmenta- tion annotations for thousands of images. With the increasing computation power given by mod- ern computers and the annotation capacity provided by Amazon Mechanical Turk 1 , however, much bigger anno- tated databases are taking its place and further pushing the literature. ImageNet [23] provides annotated bound- ing boxes on half million images. Semantic Boundary Dataset (SBD) [12] extends the Pascal segmented annota- tions to more than ten thousand images. Most notably, the recent Microsoft Common Objects in Context (COCO) [19] 1 http://www.mturk.com 1
Transcript of Boosting Object Proposals: From Pascal to COCObiwiproposals/boosting-coco/data/... ·...

Boosting Object Proposals: From Pascal to COCO
Jordi Pont-Tuset and Luc Van GoolComputer Vision Lab, ETH Zurich, Switzerland{jponttuset,vangool}@vision.ee.ethz.ch
Abstract
Computer vision in general, and object proposals in par-ticular, are nowadays strongly influenced by the databaseson which researchers evaluate the performance of their al-gorithms. This paper studies the transition from the PascalVisual Object Challenge dataset, which has been the bench-mark of reference for the last years, to the updated, bigger,and more challenging Microsoft Common Objects in Con-text. We first review and deeply analyze the new challenges,and opportunities, that this database presents. We then sur-vey the current state of the art in object proposals and eval-uate it focusing on how it generalizes to the new dataset. Insight of these results, we propose various lines of researchto take advantage of the new benchmark and improve thetechniques. We explore one of these lines, which leads to animprovement over the state of the art of +5.2%.
1. IntroductionThe sliding windows approach [27] dominated the object
detection literature for several years. It consists in sweep-ing a large amount of locations and sizes in the image,represented by rectangular windows, and then applying anobject/non-object classifier on each of them. The number ofswept windows is usually in the order of millions, so to geta reasonable speed one needs to rely on very simple classi-fiers carefully implemented using tools like integral images.
In order to reduce the number of windows to consider,and thus being able to apply more advanced classificationmachinery, the concept of objectness [1] arose; which pro-vides a reduced number of windows, in the order of hun-dreds or thousands, aiming at keeping the true objects asmuch as possible. These techniques have been improv-ing to get more quality and efficiency until the presentdays [28, 7, 20, 25], widely known as bounding-box objectproposals methods: they propose a reduced set of windowsaiming at representing the bounding box of the true objects.
Object windows give us the location and scale of the ob-jects, but they miss a crucial queue for object detection:its shape. While a window representation might be good
Figure 1. Example segmentation annotations from the three stud-ied databases: Pascal SegVOC12 [11], SBD [12], and COCO [19]
enough for certain types of roughly-rectangular objects suchas faces or cars, it is certainly not precise enough to repre-sent more deformable objects such as animals or plants; andone might need the mask of the object for applications likeimage editing or inpainting.
In this context, the segmented object proposal techniquesarose [5, 9], whose objective is to provide a reduced set ofobject segmentations, that is, a small set of binary imagemasks indicating sets of pixels belonging to an object in theimage. It currently has become an active topic of researchin computer vision [18, 4, 22, 15, 25, 17, 6, 10].
Annotated databases play a crucial role in the improve-ment of these techniques, both for training the algorithmsand for benchmarking and comparing different approaches.The Pascal Visual Object Challenge [11] database has beenthe driving force behind many of the improvements in latestyears, providing high-quality bounding-box and segmenta-tion annotations for thousands of images.
With the increasing computation power given by mod-ern computers and the annotation capacity provided byAmazon Mechanical Turk1, however, much bigger anno-tated databases are taking its place and further pushingthe literature. ImageNet [23] provides annotated bound-ing boxes on half million images. Semantic BoundaryDataset (SBD) [12] extends the Pascal segmented annota-tions to more than ten thousand images. Most notably, therecent Microsoft Common Objects in Context (COCO) [19]
1http://www.mturk.com
1
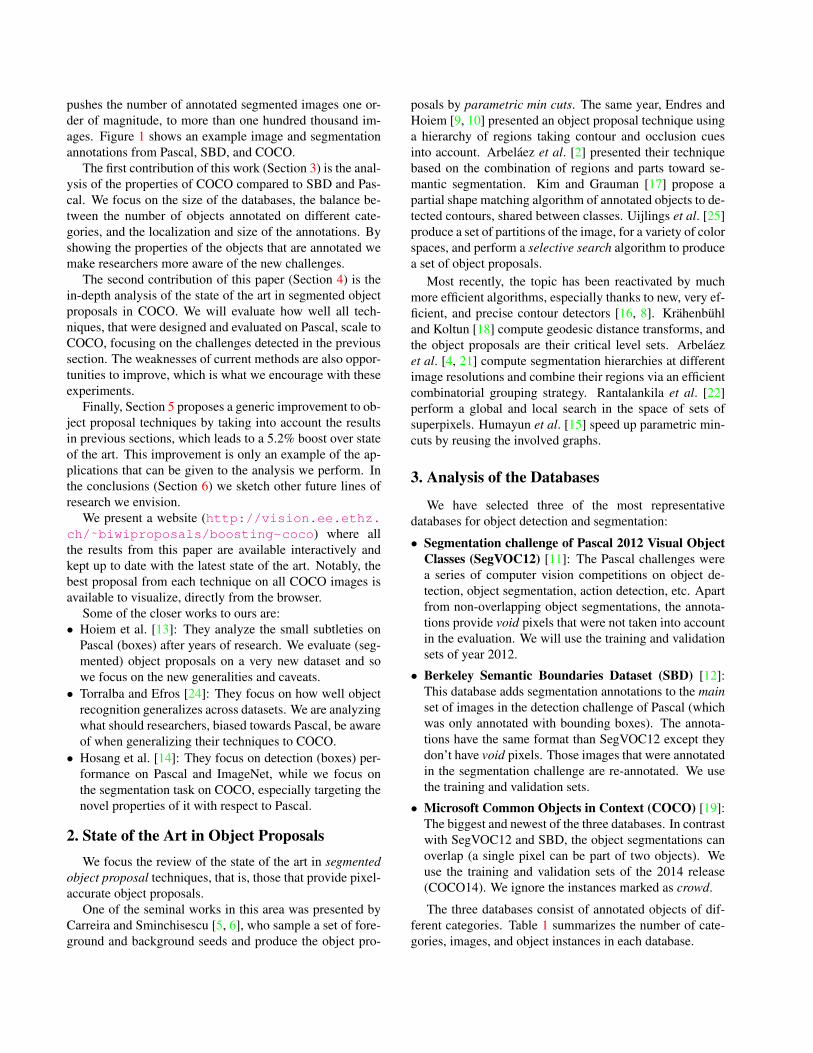
pushes the number of annotated segmented images one or-der of magnitude, to more than one hundred thousand im-ages. Figure 1 shows an example image and segmentationannotations from Pascal, SBD, and COCO.
The first contribution of this work (Section 3) is the anal-ysis of the properties of COCO compared to SBD and Pas-cal. We focus on the size of the databases, the balance be-tween the number of objects annotated on different cate-gories, and the localization and size of the annotations. Byshowing the properties of the objects that are annotated wemake researchers more aware of the new challenges.
The second contribution of this paper (Section 4) is thein-depth analysis of the state of the art in segmented objectproposals in COCO. We will evaluate how well all tech-niques, that were designed and evaluated on Pascal, scale toCOCO, focusing on the challenges detected in the previoussection. The weaknesses of current methods are also oppor-tunities to improve, which is what we encourage with theseexperiments.
Finally, Section 5 proposes a generic improvement to ob-ject proposal techniques by taking into account the resultsin previous sections, which leads to a 5.2% boost over stateof the art. This improvement is only an example of the ap-plications that can be given to the analysis we perform. Inthe conclusions (Section 6) we sketch other future lines ofresearch we envision.
We present a website (http://vision.ee.ethz.ch/˜biwiproposals/boosting-coco) where allthe results from this paper are available interactively andkept up to date with the latest state of the art. Notably, thebest proposal from each technique on all COCO images isavailable to visualize, directly from the browser.
Some of the closer works to ours are:• Hoiem et al. [13]: They analyze the small subtleties on
Pascal (boxes) after years of research. We evaluate (seg-mented) object proposals on a very new dataset and sowe focus on the new generalities and caveats.
• Torralba and Efros [24]: They focus on how well objectrecognition generalizes across datasets. We are analyzingwhat should researchers, biased towards Pascal, be awareof when generalizing their techniques to COCO.
• Hosang et al. [14]: They focus on detection (boxes) per-formance on Pascal and ImageNet, while we focus onthe segmentation task on COCO, especially targeting thenovel properties of it with respect to Pascal.
2. State of the Art in Object ProposalsWe focus the review of the state of the art in segmented
object proposal techniques, that is, those that provide pixel-accurate object proposals.
One of the seminal works in this area was presented byCarreira and Sminchisescu [5, 6], who sample a set of fore-ground and background seeds and produce the object pro-
posals by parametric min cuts. The same year, Endres andHoiem [9, 10] presented an object proposal technique usinga hierarchy of regions taking contour and occlusion cuesinto account. Arbelaez et al. [2] presented their techniquebased on the combination of regions and parts toward se-mantic segmentation. Kim and Grauman [17] propose apartial shape matching algorithm of annotated objects to de-tected contours, shared between classes. Uijlings et al. [25]produce a set of partitions of the image, for a variety of colorspaces, and perform a selective search algorithm to producea set of object proposals.
Most recently, the topic has been reactivated by muchmore efficient algorithms, especially thanks to new, very ef-ficient, and precise contour detectors [16, 8]. Krahenbuhland Koltun [18] compute geodesic distance transforms, andthe object proposals are their critical level sets. Arbelaezet al. [4, 21] compute segmentation hierarchies at differentimage resolutions and combine their regions via an efficientcombinatorial grouping strategy. Rantalankila et al. [22]perform a global and local search in the space of sets ofsuperpixels. Humayun et al. [15] speed up parametric min-cuts by reusing the involved graphs.
3. Analysis of the Databases
We have selected three of the most representativedatabases for object detection and segmentation:
• Segmentation challenge of Pascal 2012 Visual ObjectClasses (SegVOC12) [11]: The Pascal challenges werea series of computer vision competitions on object de-tection, object segmentation, action detection, etc. Apartfrom non-overlapping object segmentations, the annota-tions provide void pixels that were not taken into accountin the evaluation. We will use the training and validationsets of year 2012.
• Berkeley Semantic Boundaries Dataset (SBD) [12]:This database adds segmentation annotations to the mainset of images in the detection challenge of Pascal (whichwas only annotated with bounding boxes). The annota-tions have the same format than SegVOC12 except theydon’t have void pixels. Those images that were annotatedin the segmentation challenge are re-annotated. We usethe training and validation sets.
• Microsoft Common Objects in Context (COCO) [19]:The biggest and newest of the three databases. In contrastwith SegVOC12 and SBD, the object segmentations canoverlap (a single pixel can be part of two objects). Weuse the training and validation sets of the 2014 release(COCO14). We ignore the instances marked as crowd.
The three databases consist of annotated objects of dif-ferent categories. Table 1 summarizes the number of cate-gories, images, and object instances in each database.
Pascal SegVOC12 SBD COCO14Figure 2. Qualitative examples: Images and segmentation annotations from Pascal SegVOC12, SBD, and COCO14.
Number of Number of Number ofCategories Images Instances
SegVOC12 20 2 913 6 934Train+Val 1 464+1 449 3 507+3 427SBD 20 11 355 26 843Train+Val 8 498+2 857 20 172+6 671COCO14 80 123 287 886 284Train+Val 82 783+40 504 597 869+288 415
Table 1. Sizes of the databases
As we can observe, each new database is roughly oneorder of magnitude larger than its predecessor, giving moresignificance to the experiments at each step. COCO14 hasfour times the number of categories of previous databases,giving more representativity to the results. These 80 cate-gories are grouped into 12 super-categories.
The annotations in the three datasets are both in the formof bounding boxes and segmentations. Figure 2 shows someimages of the three datasets, along with their object seg-mentations. The SegVOC12 annotations include void re-gions (in cream color) that mark uncertainty or difficult pix-els. SBD annotations are shown in the same format thanSegVOC12 but they do not have void pixels.
COCO annotations have some particularities with re-spect to SBD and SegVOC12. First, some of the annota-tions mark objects that are really challenging to segment, asthe wine glasses that are semi-transparent. Some segmen-tations are less accurate than those in the previous datasets,such as the chair in Figure 2: the contour is not very accu-rate and the wall seen in between the bars is not subtracted.Finally, annotations in COCO overlap between them, mean-ing that some pixels are annotated as two different objects.The dogs in Figure 2, for instance, are annotated as dogs andsofa, which should be handled carefully in the evaluation.
3.1. Category Balance
The analysis of the results on these databases is com-monly separated into per-category performance, thus thedistribution of objects among categories is an important fea-
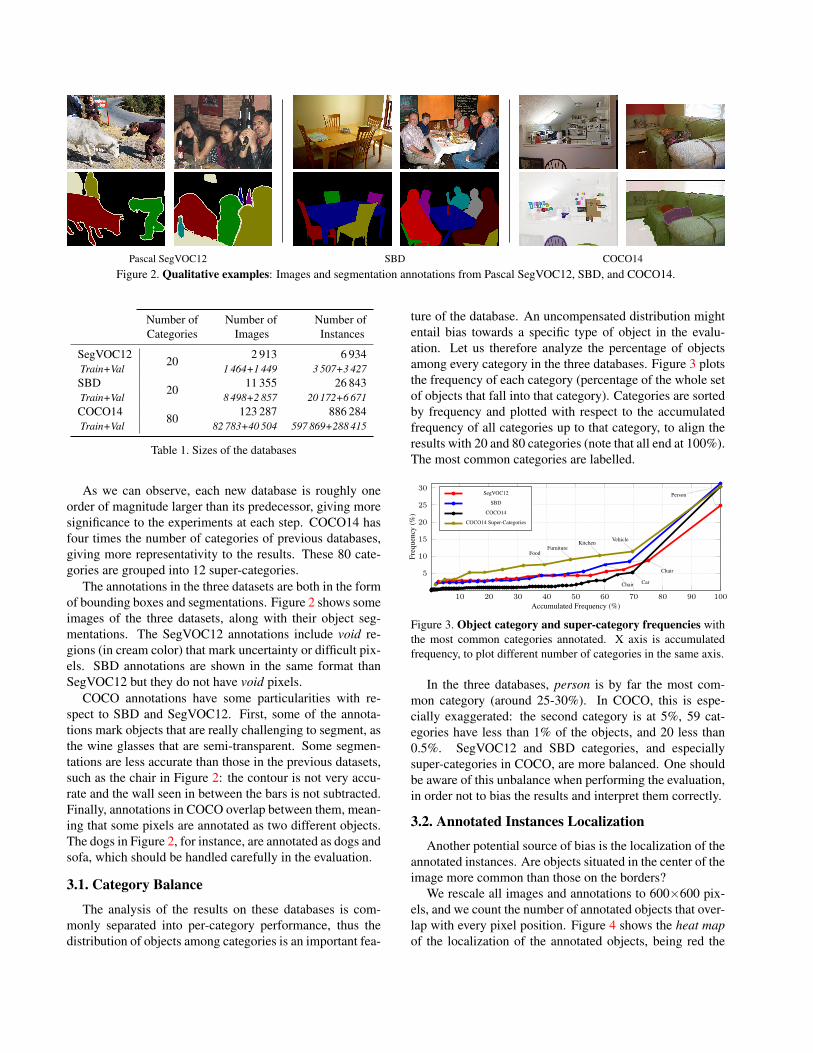
ture of the database. An uncompensated distribution mightentail bias towards a specific type of object in the evalu-ation. Let us therefore analyze the percentage of objectsamong every category in the three databases. Figure 3 plotsthe frequency of each category (percentage of the whole setof objects that fall into that category). Categories are sortedby frequency and plotted with respect to the accumulatedfrequency of all categories up to that category, to align theresults with 20 and 80 categories (note that all end at 100%).The most common categories are labelled.
10 20 30 40 50 60 70 80 90 100
5
10
15
20
25
30Person
Vehicle
Chair
CarChair
KitchenFurniture
Food
Accumulated Frequency (%)
Freq
uenc
y(%
)
SegVOC12
SBD
COCO14
COCO14 Super-Categories
Figure 3. Object category and super-category frequencies withthe most common categories annotated. X axis is accumulatedfrequency, to plot different number of categories in the same axis.
In the three databases, person is by far the most com-mon category (around 25-30%). In COCO, this is espe-cially exaggerated: the second category is at 5%, 59 cat-egories have less than 1% of the objects, and 20 less than0.5%. SegVOC12 and SBD categories, and especiallysuper-categories in COCO, are more balanced. One shouldbe aware of this unbalance when performing the evaluation,in order not to bias the results and interpret them correctly.
3.2. Annotated Instances Localization
Another potential source of bias is the localization of theannotated instances. Are objects situated in the center of theimage more common than those on the borders?
We rescale all images and annotations to 600×600 pix-els, and we count the number of annotated objects that over-lap with every pixel position. Figure 4 shows the heat mapof the localization of the annotated objects, being red the
most common localization (1), dark blue meaning that noobject overlaps that pixel (0), and the range in betweenmeaning that the value at that pixel is a certain ratio withrespect to the value at the most frequent pixel.
0 0.1 0.2 0.3 0.4 0.5 0.6 0.7 0.8 0.9 1
SegVOC 2012 SBD COCO 2014
Figure 4. Ground-truth object localization frequency: Heatmap of the localization of the annotated objects.
The three databases are biased towards objects in thecenter of the image. COCO is the one with more percent-age of objects close to the border of the lower part of theimage. The upper-half borders of the images are almostequally scarce in the three databases.
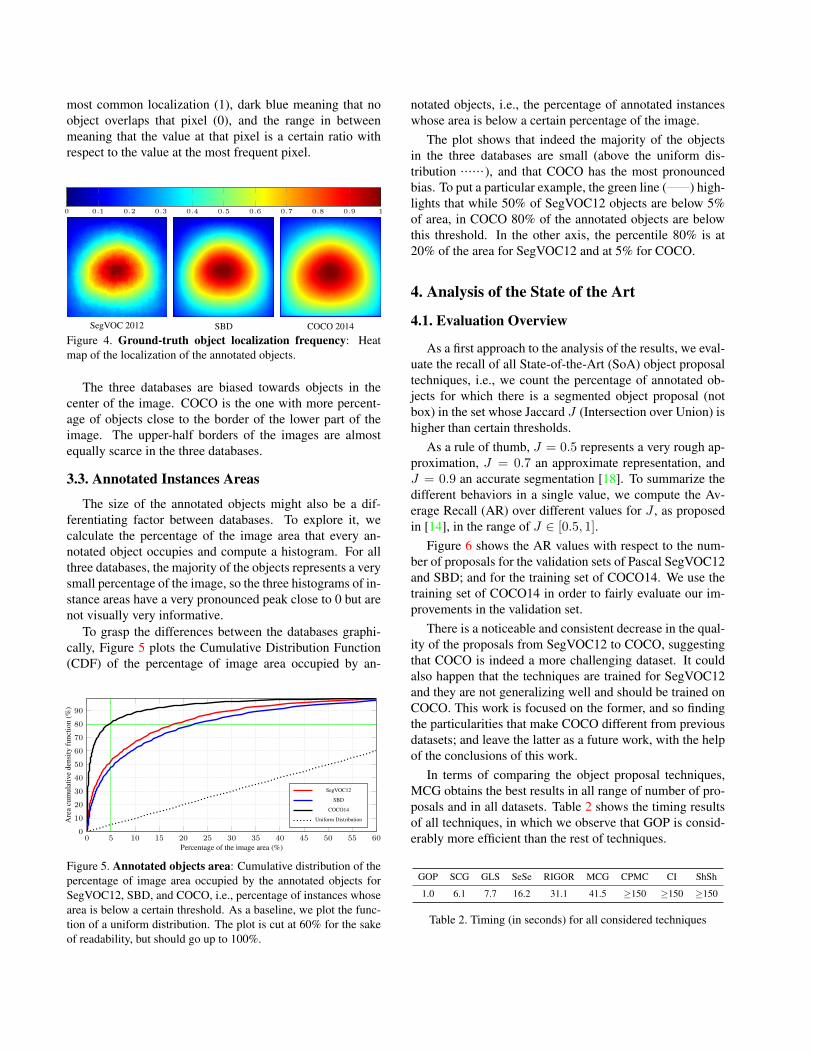
3.3. Annotated Instances Areas
The size of the annotated objects might also be a dif-ferentiating factor between databases. To explore it, wecalculate the percentage of the image area that every an-notated object occupies and compute a histogram. For allthree databases, the majority of the objects represents a verysmall percentage of the image, so the three histograms of in-stance areas have a very pronounced peak close to 0 but arenot visually very informative.
To grasp the differences between the databases graphi-cally, Figure 5 plots the Cumulative Distribution Function(CDF) of the percentage of image area occupied by an-
0 5 10 15 20 25 30 35 40 45 50 55 600
10
20
30
40
50
60
70
80
90
Percentage of the image area (%)
Are
acu
mul
ativ
ede
nsity
func
tion
(%)
SegVOC12
SBD
COCO14
Uniform Distribution
Figure 5. Annotated objects area: Cumulative distribution of thepercentage of image area occupied by the annotated objects forSegVOC12, SBD, and COCO, i.e., percentage of instances whosearea is below a certain threshold. As a baseline, we plot the func-tion of a uniform distribution. The plot is cut at 60% for the sakeof readability, but should go up to 100%.
notated objects, i.e., the percentage of annotated instanceswhose area is below a certain percentage of the image.
The plot shows that indeed the majority of the objectsin the three databases are small (above the uniform dis-tribution ), and that COCO has the most pronouncedbias. To put a particular example, the green line ( ) high-lights that while 50% of SegVOC12 objects are below 5%of area, in COCO 80% of the annotated objects are belowthis threshold. In the other axis, the percentile 80% is at20% of the area for SegVOC12 and at 5% for COCO.
4. Analysis of the State of the Art
4.1. Evaluation Overview
As a first approach to the analysis of the results, we eval-uate the recall of all State-of-the-Art (SoA) object proposaltechniques, i.e., we count the percentage of annotated ob-jects for which there is a segmented object proposal (notbox) in the set whose Jaccard J (Intersection over Union) ishigher than certain thresholds.
As a rule of thumb, J = 0.5 represents a very rough ap-proximation, J = 0.7 an approximate representation, andJ = 0.9 an accurate segmentation [18]. To summarize thedifferent behaviors in a single value, we compute the Av-erage Recall (AR) over different values for J , as proposedin [14], in the range of J ∈ [0.5, 1].
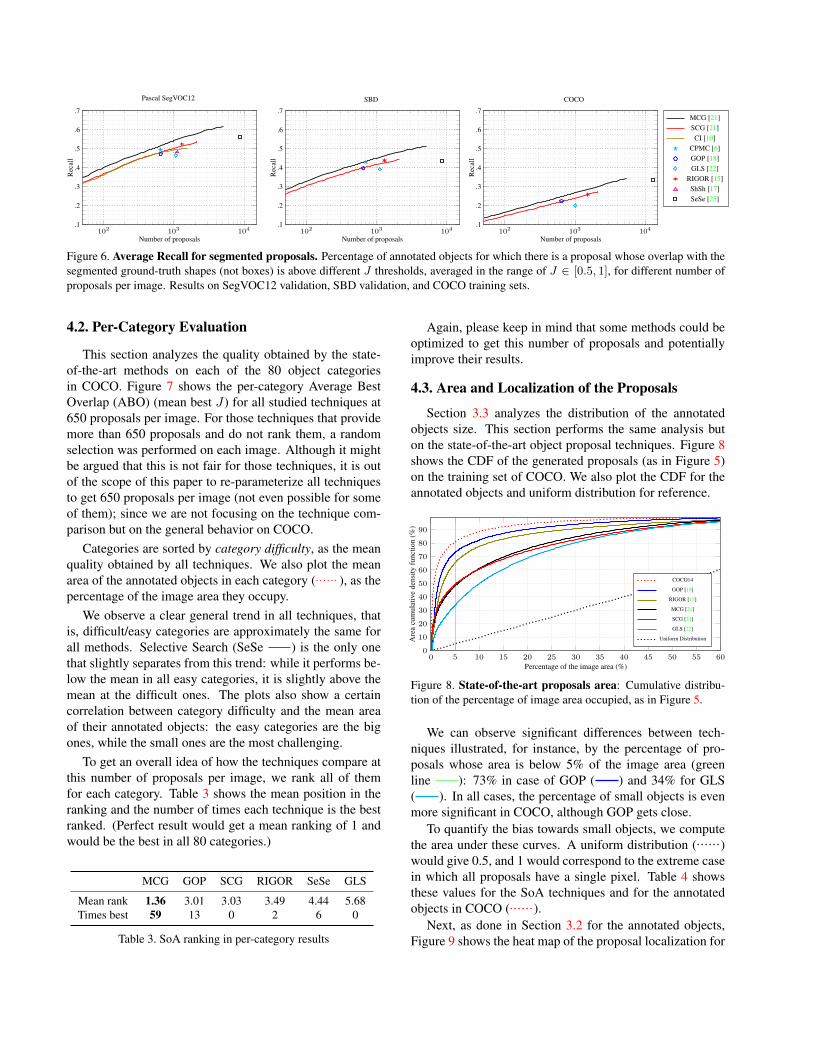
Figure 6 shows the AR values with respect to the num-ber of proposals for the validation sets of Pascal SegVOC12and SBD; and for the training set of COCO14. We use thetraining set of COCO14 in order to fairly evaluate our im-provements in the validation set.
There is a noticeable and consistent decrease in the qual-ity of the proposals from SegVOC12 to COCO, suggestingthat COCO is indeed a more challenging dataset. It couldalso happen that the techniques are trained for SegVOC12and they are not generalizing well and should be trained onCOCO. This work is focused on the former, and so findingthe particularities that make COCO different from previousdatasets; and leave the latter as a future work, with the helpof the conclusions of this work.
In terms of comparing the object proposal techniques,MCG obtains the best results in all range of number of pro-posals and in all datasets. Table 2 shows the timing resultsof all techniques, in which we observe that GOP is consid-erably more efficient than the rest of techniques.
GOP SCG GLS SeSe RIGOR MCG CPMC CI ShSh
1.0 6.1 7.7 16.2 31.1 41.5 ≥150 ≥150 ≥150
Table 2. Timing (in seconds) for all considered techniques
Pascal SegVOC12
102 103 104.1
.2
.3
.4
.5
.6
.7
Number of proposals
Rec
all
SBD
102 103 104.1
.2
.3
.4
.5
.6
.7
Number of proposals
Rec
all
COCO
102 103 104.1
.2
.3
.4
.5
.6
.7
Number of proposals
Rec
all
MCG [21]SCG [21]CI [10]
CPMC [6]GOP [18]GLS [22]
RIGOR [15]ShSh [17]SeSe [25]
Figure 6. Average Recall for segmented proposals. Percentage of annotated objects for which there is a proposal whose overlap with thesegmented ground-truth shapes (not boxes) is above different J thresholds, averaged in the range of J ∈ [0.5, 1], for different number ofproposals per image. Results on SegVOC12 validation, SBD validation, and COCO training sets.
4.2. Per-Category Evaluation
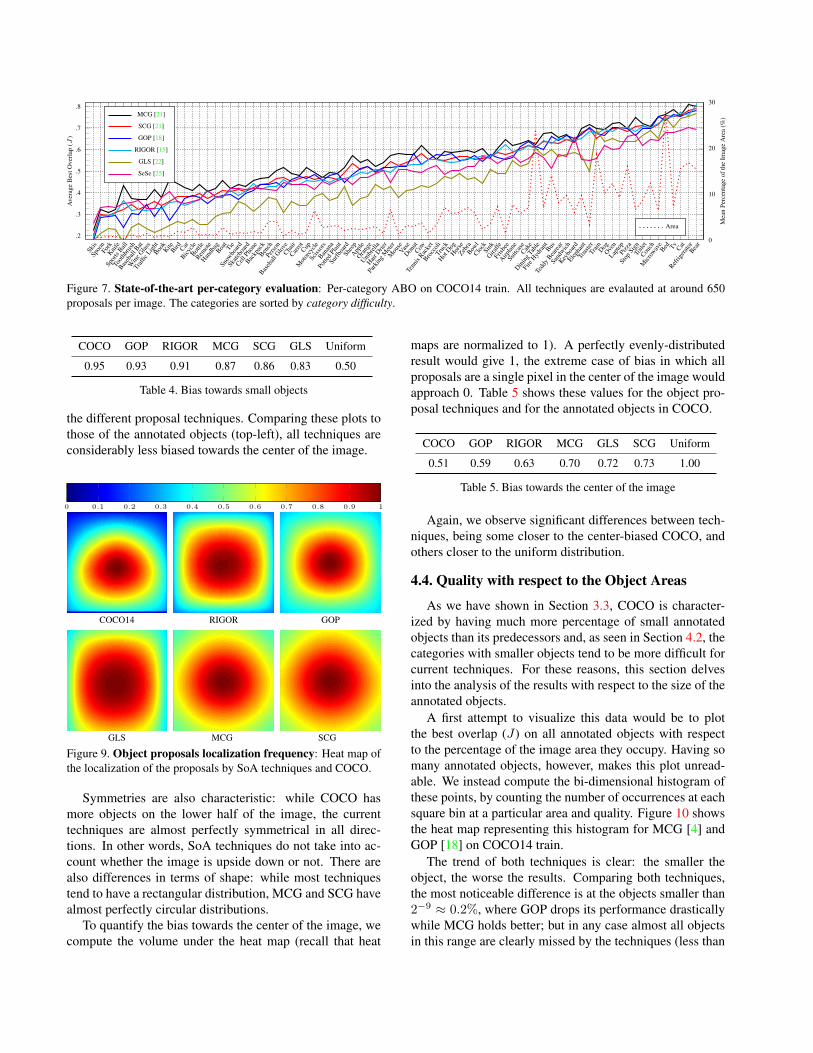
This section analyzes the quality obtained by the state-of-the-art methods on each of the 80 object categoriesin COCO. Figure 7 shows the per-category Average BestOverlap (ABO) (mean best J) for all studied techniques at650 proposals per image. For those techniques that providemore than 650 proposals and do not rank them, a randomselection was performed on each image. Although it mightbe argued that this is not fair for those techniques, it is outof the scope of this paper to re-parameterize all techniquesto get 650 proposals per image (not even possible for someof them); since we are not focusing on the technique com-parison but on the general behavior on COCO.
Categories are sorted by category difficulty, as the meanquality obtained by all techniques. We also plot the meanarea of the annotated objects in each category ( ), as thepercentage of the image area they occupy.
We observe a clear general trend in all techniques, thatis, difficult/easy categories are approximately the same forall methods. Selective Search (SeSe ) is the only onethat slightly separates from this trend: while it performs be-low the mean in all easy categories, it is slightly above themean at the difficult ones. The plots also show a certaincorrelation between category difficulty and the mean areaof their annotated objects: the easy categories are the bigones, while the small ones are the most challenging.
To get an overall idea of how the techniques compare atthis number of proposals per image, we rank all of themfor each category. Table 3 shows the mean position in theranking and the number of times each technique is the bestranked. (Perfect result would get a mean ranking of 1 andwould be the best in all 80 categories.)
MCG GOP SCG RIGOR SeSe GLS
Mean rank 1.36 3.01 3.03 3.49 4.44 5.68Times best 59 13 0 2 6 0
Table 3. SoA ranking in per-category results
Again, please keep in mind that some methods could beoptimized to get this number of proposals and potentiallyimprove their results.
4.3. Area and Localization of the Proposals
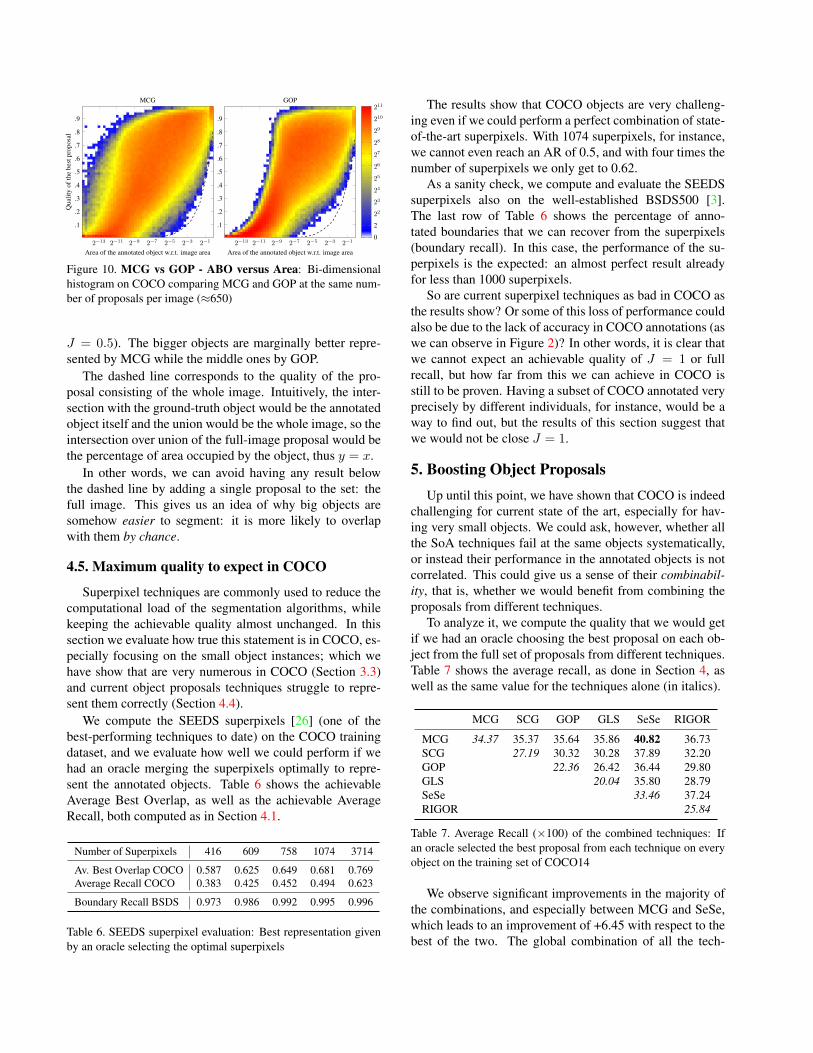
Section 3.3 analyzes the distribution of the annotatedobjects size. This section performs the same analysis buton the state-of-the-art object proposal techniques. Figure 8shows the CDF of the generated proposals (as in Figure 5)on the training set of COCO. We also plot the CDF for theannotated objects and uniform distribution for reference.
0 5 10 15 20 25 30 35 40 45 50 55 600
10
20
30
40
50
60
70
80
90
Percentage of the image area (%)
Are
acu
mul
ativ
ede
nsity
func
tion
(%)
COCO14
GOP [18]
RIGOR [15]
MCG [21]
SCG [21]
GLS [22]
Uniform Distribution
Figure 8. State-of-the-art proposals area: Cumulative distribu-tion of the percentage of image area occupied, as in Figure 5.
We can observe significant differences between tech-niques illustrated, for instance, by the percentage of pro-posals whose area is below 5% of the image area (greenline ): 73% in case of GOP ( ) and 34% for GLS( ). In all cases, the percentage of small objects is evenmore significant in COCO, although GOP gets close.
To quantify the bias towards small objects, we computethe area under these curves. A uniform distribution ( )would give 0.5, and 1 would correspond to the extreme casein which all proposals have a single pixel. Table 4 showsthese values for the SoA techniques and for the annotatedobjects in COCO ( ).
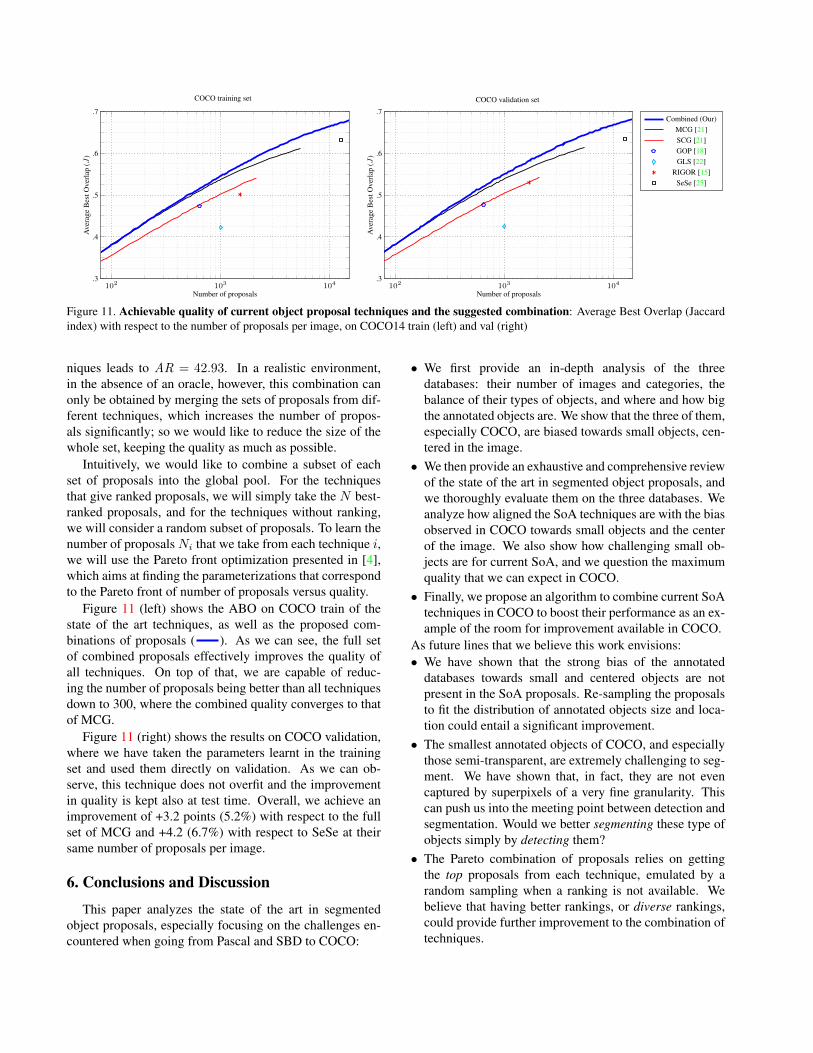
Next, as done in Section 3.2 for the annotated objects,Figure 9 shows the heat map of the proposal localization for
Skis
Spoo
nFo
rkKnif
eSp
orts
Ball
Tooth
brus
h
Baseb
allBat
Wine
Glass
Traffi
c Light
Book
KiteBird CarBicy
cleBott
leRem
oteHan
dbag
Boat
Tie
Snow
board
Skate
board
CellPh
one
Backp
ack
Bench
Perso
n
Baseb
allGlov
eCha
irCarr
otCup
Moto
rcycle
Sciss
ors
Banan
a
Potte
d Plan
tSu
rfboa
rdSh
eep
Apple
Orange
Umbrell
aHair
Drier
Park
ingM
eter
Mou
seVas
eDon
utCow
Tenn
isRac
ket
Brocc
oliTr
uck
HotDog
Horse
Zebra
Bowl
Clock
Sink
Giraffe
Frisb
eeAirp
lane
Suitc
ase
Cake
Dining
Table
Fire
Hydran
tBus
Tedd
y Bearea
rSa
ndwich
Keybo
ardElep
hant
Toas
terTr
ainDogOve
nLap
topPi
zza
Stop
Sign
Toile
tCou
chM
icrow
ave
Bed TvCat
Refrige
rator
Bear
.2
.3
.4
.5
.6
.7
.8
Ave
rage
Bes
tOve
rlap
(J)
MCG [21]
SCG [21]
GOP [18]
RIGOR [15]
GLS [22]
SeSe [25]
0
10
20
30
Mea
nPe
rcen
tage
ofth
eIm
age
Are
a(%
)
Area
Figure 7. State-of-the-art per-category evaluation: Per-category ABO on COCO14 train. All techniques are evalauted at around 650proposals per image. The categories are sorted by category difficulty.
COCO GOP RIGOR MCG SCG GLS Uniform
0.95 0.93 0.91 0.87 0.86 0.83 0.50
Table 4. Bias towards small objects
the different proposal techniques. Comparing these plots tothose of the annotated objects (top-left), all techniques areconsiderably less biased towards the center of the image.
0 0.1 0.2 0.3 0.4 0.5 0.6 0.7 0.8 0.9 1
COCO14 RIGOR GOP
GLS MCG SCG
Figure 9. Object proposals localization frequency: Heat map ofthe localization of the proposals by SoA techniques and COCO.
Symmetries are also characteristic: while COCO hasmore objects on the lower half of the image, the currenttechniques are almost perfectly symmetrical in all direc-tions. In other words, SoA techniques do not take into ac-count whether the image is upside down or not. There arealso differences in terms of shape: while most techniquestend to have a rectangular distribution, MCG and SCG havealmost perfectly circular distributions.
To quantify the bias towards the center of the image, wecompute the volume under the heat map (recall that heat
maps are normalized to 1). A perfectly evenly-distributedresult would give 1, the extreme case of bias in which allproposals are a single pixel in the center of the image wouldapproach 0. Table 5 shows these values for the object pro-posal techniques and for the annotated objects in COCO.
COCO GOP RIGOR MCG GLS SCG Uniform
0.51 0.59 0.63 0.70 0.72 0.73 1.00
Table 5. Bias towards the center of the image
Again, we observe significant differences between tech-niques, being some closer to the center-biased COCO, andothers closer to the uniform distribution.
4.4. Quality with respect to the Object Areas
As we have shown in Section 3.3, COCO is character-ized by having much more percentage of small annotatedobjects than its predecessors and, as seen in Section 4.2, thecategories with smaller objects tend to be more difficult forcurrent techniques. For these reasons, this section delvesinto the analysis of the results with respect to the size of theannotated objects.
A first attempt to visualize this data would be to plotthe best overlap (J) on all annotated objects with respectto the percentage of the image area they occupy. Having somany annotated objects, however, makes this plot unread-able. We instead compute the bi-dimensional histogram ofthese points, by counting the number of occurrences at eachsquare bin at a particular area and quality. Figure 10 showsthe heat map representing this histogram for MCG [4] andGOP [18] on COCO14 train.
The trend of both techniques is clear: the smaller theobject, the worse the results. Comparing both techniques,the most noticeable difference is at the objects smaller than2−9 ≈ 0.2%, where GOP drops its performance drasticallywhile MCG holds better; but in any case almost all objectsin this range are clearly missed by the techniques (less than
2−13 2−11 2−9 2−7 2−5 2−3 2−1
.1
.2
.3
.4
.5
.6
.7
.8
.9
Area of the annotated object w.r.t. image area
Qua
lity
ofth
ebe
stpr
opos
al
MCG
2−13 2−11 2−9 2−7 2−5 2−3 2−1
.1
.2
.3
.4
.5
.6
.7
.8
.9
Area of the annotated object w.r.t. image area
GOP
0
2
22
23
24
25
26
27
28
29
210
211
Figure 10. MCG vs GOP - ABO versus Area: Bi-dimensionalhistogram on COCO comparing MCG and GOP at the same num-ber of proposals per image (≈650)
J = 0.5). The bigger objects are marginally better repre-sented by MCG while the middle ones by GOP.
The dashed line corresponds to the quality of the pro-posal consisting of the whole image. Intuitively, the inter-section with the ground-truth object would be the annotatedobject itself and the union would be the whole image, so theintersection over union of the full-image proposal would bethe percentage of area occupied by the object, thus y = x.
In other words, we can avoid having any result belowthe dashed line by adding a single proposal to the set: thefull image. This gives us an idea of why big objects aresomehow easier to segment: it is more likely to overlapwith them by chance.
4.5. Maximum quality to expect in COCO
Superpixel techniques are commonly used to reduce thecomputational load of the segmentation algorithms, whilekeeping the achievable quality almost unchanged. In thissection we evaluate how true this statement is in COCO, es-pecially focusing on the small object instances; which wehave show that are very numerous in COCO (Section 3.3)and current object proposals techniques struggle to repre-sent them correctly (Section 4.4).
We compute the SEEDS superpixels [26] (one of thebest-performing techniques to date) on the COCO trainingdataset, and we evaluate how well we could perform if wehad an oracle merging the superpixels optimally to repre-sent the annotated objects. Table 6 shows the achievableAverage Best Overlap, as well as the achievable AverageRecall, both computed as in Section 4.1.
Number of Superpixels 416 609 758 1074 3714
Av. Best Overlap COCO 0.587 0.625 0.649 0.681 0.769Average Recall COCO 0.383 0.425 0.452 0.494 0.623
Boundary Recall BSDS 0.973 0.986 0.992 0.995 0.996
Table 6. SEEDS superpixel evaluation: Best representation givenby an oracle selecting the optimal superpixels
The results show that COCO objects are very challeng-ing even if we could perform a perfect combination of state-of-the-art superpixels. With 1074 superpixels, for instance,we cannot even reach an AR of 0.5, and with four times thenumber of superpixels we only get to 0.62.
As a sanity check, we compute and evaluate the SEEDSsuperpixels also on the well-established BSDS500 [3].The last row of Table 6 shows the percentage of anno-tated boundaries that we can recover from the superpixels(boundary recall). In this case, the performance of the su-perpixels is the expected: an almost perfect result alreadyfor less than 1000 superpixels.
So are current superpixel techniques as bad in COCO asthe results show? Or some of this loss of performance couldalso be due to the lack of accuracy in COCO annotations (aswe can observe in Figure 2)? In other words, it is clear thatwe cannot expect an achievable quality of J = 1 or fullrecall, but how far from this we can achieve in COCO isstill to be proven. Having a subset of COCO annotated veryprecisely by different individuals, for instance, would be away to find out, but the results of this section suggest thatwe would not be close J = 1.
5. Boosting Object ProposalsUp until this point, we have shown that COCO is indeed
challenging for current state of the art, especially for hav-ing very small objects. We could ask, however, whether allthe SoA techniques fail at the same objects systematically,or instead their performance in the annotated objects is notcorrelated. This could give us a sense of their combinabil-ity, that is, whether we would benefit from combining theproposals from different techniques.
To analyze it, we compute the quality that we would getif we had an oracle choosing the best proposal on each ob-ject from the full set of proposals from different techniques.Table 7 shows the average recall, as done in Section 4, aswell as the same value for the techniques alone (in italics).
MCG SCG GOP GLS SeSe RIGOR
MCG 34.37 35.37 35.64 35.86 40.82 36.73SCG 27.19 30.32 30.28 37.89 32.20GOP 22.36 26.42 36.44 29.80GLS 20.04 35.80 28.79SeSe 33.46 37.24RIGOR 25.84
Table 7. Average Recall (×100) of the combined techniques: Ifan oracle selected the best proposal from each technique on everyobject on the training set of COCO14
We observe significant improvements in the majority ofthe combinations, and especially between MCG and SeSe,which leads to an improvement of +6.45 with respect to thebest of the two. The global combination of all the tech-
COCO training set
102 103 104.3
.4
.5
.6
.7
Number of proposals
Ave
rage
Bes
tOve
rlap
(J)
COCO validation set
102 103 104.3
.4
.5
.6
.7
Number of proposals
Ave
rage
Bes
tOve
rlap
(J)
Combined (Our)MCG [21]SCG [21]GOP [18]GLS [22]
RIGOR [15]SeSe [25]
Figure 11. Achievable quality of current object proposal techniques and the suggested combination: Average Best Overlap (Jaccardindex) with respect to the number of proposals per image, on COCO14 train (left) and val (right)
niques leads to AR = 42.93. In a realistic environment,in the absence of an oracle, however, this combination canonly be obtained by merging the sets of proposals from dif-ferent techniques, which increases the number of propos-als significantly; so we would like to reduce the size of thewhole set, keeping the quality as much as possible.
Intuitively, we would like to combine a subset of eachset of proposals into the global pool. For the techniquesthat give ranked proposals, we will simply take the N best-ranked proposals, and for the techniques without ranking,we will consider a random subset of proposals. To learn thenumber of proposals Ni that we take from each technique i,we will use the Pareto front optimization presented in [4],which aims at finding the parameterizations that correspondto the Pareto front of number of proposals versus quality.
Figure 11 (left) shows the ABO on COCO train of thestate of the art techniques, as well as the proposed com-binations of proposals ( ). As we can see, the full setof combined proposals effectively improves the quality ofall techniques. On top of that, we are capable of reduc-ing the number of proposals being better than all techniquesdown to 300, where the combined quality converges to thatof MCG.
Figure 11 (right) shows the results on COCO validation,where we have taken the parameters learnt in the trainingset and used them directly on validation. As we can ob-serve, this technique does not overfit and the improvementin quality is kept also at test time. Overall, we achieve animprovement of +3.2 points (5.2%) with respect to the fullset of MCG and +4.2 (6.7%) with respect to SeSe at theirsame number of proposals per image.
6. Conclusions and Discussion
This paper analyzes the state of the art in segmentedobject proposals, especially focusing on the challenges en-countered when going from Pascal and SBD to COCO:
• We first provide an in-depth analysis of the threedatabases: their number of images and categories, thebalance of their types of objects, and where and how bigthe annotated objects are. We show that the three of them,especially COCO, are biased towards small objects, cen-tered in the image.
• We then provide an exhaustive and comprehensive reviewof the state of the art in segmented object proposals, andwe thoroughly evaluate them on the three databases. Weanalyze how aligned the SoA techniques are with the biasobserved in COCO towards small objects and the centerof the image. We also show how challenging small ob-jects are for current SoA, and we question the maximumquality that we can expect in COCO.
• Finally, we propose an algorithm to combine current SoAtechniques in COCO to boost their performance as an ex-ample of the room for improvement available in COCO.
As future lines that we believe this work envisions:• We have shown that the strong bias of the annotated
databases towards small and centered objects are notpresent in the SoA proposals. Re-sampling the proposalsto fit the distribution of annotated objects size and loca-tion could entail a significant improvement.
• The smallest annotated objects of COCO, and especiallythose semi-transparent, are extremely challenging to seg-ment. We have shown that, in fact, they are not evencaptured by superpixels of a very fine granularity. Thiscan push us into the meeting point between detection andsegmentation. Would we better segmenting these type ofobjects simply by detecting them?
• The Pareto combination of proposals relies on gettingthe top proposals from each technique, emulated by arandom sampling when a ranking is not available. Webelieve that having better rankings, or diverse rankings,could provide further improvement to the combination oftechniques.
References[1] B. Alexe, T. Deselaers, and V. Ferrari. What is an object? In
CVPR, pages 73–80, 2010. 1[2] P. Arbelaez, B. Hariharan, C. Gu, S. Gupta, L. Bourdev, and
J. Malik. Semantic segmentation using regions and parts. InCVPR, 2012. 2
[3] P. Arbelaez, M. Maire, C. C. Fowlkes, and J. Malik. Con-tour detection and hierarchical image segmentation. TPAMI,33(5):898–916, 2011. 7
[4] P. Arbelaez, J. Pont-Tuset, J. Barron, F. Marques, and J. Ma-lik. Multiscale combinatorial grouping. In CVPR, 2014. 1,2, 6, 8
[5] J. Carreira and C. Sminchisescu. Constrained parametricmin-cuts for automatic object segmentation. In CVPR, 2010.1, 2
[6] J. Carreira and C. Sminchisescu. CPMC: Automatic ob-ject segmentation using Constrained Parametric Min-Cuts.TPAMI, 34(7):1312–1328, 2012. 1, 2, 5
[7] M.-M. Cheng, Z. Zhang, W.-Y. Lin, and P. H. S. Torr.BING: Binarized normed gradients for objectness estimationat 300fps. In CVPR, 2014. 1
[8] P. Dollar and C. Zitnick. Structured forests for fast edge de-tection. ICCV, 2013. 2
[9] I. Endres and D. Hoiem. Category independent object pro-posals. In ECCV, pages 575–588, 2010. 1, 2
[10] I. Endres and D. Hoiem. Category-independent object pro-posals with diverse ranking. TPAMI, 36(2):222–234, 2014.1, 2, 5
[11] M. Everingham, L. Van Gool, C. K. I. Williams, J. Winn,and A. Zisserman. The PASCAL Visual Object ClassesChallenge 2012 (VOC2012) Results. http://www.pascal-network.org/challenges/VOC/voc2012/workshop/index.html.1, 2
[12] B. Hariharan, P. Arbelaez, L. Bourdev, S. Maji, and J. Malik.Semantic contours from inverse detectors. In ICCV, 2011. 1,2
[13] D. Hoiem, Y. Chodpathumwan, and Q. Dai. Diagnosing errorin object detectors. In ECCV, 2012. 2
[14] J. Hosang, R. Benenson, P. Dollar, and B. Schiele.What makes for effective detection proposals? InarXiv:1502.05082, 2015. 2, 4
[15] A. Humayun, F. Li, and J. M. Rehg. RIGOR: RecyclingInference in Graph Cuts for generating Object Regions. InCVPR, 2014. 1, 2, 5, 6, 8
[16] C. Z. J. Lim and P. Dollar. Sketch tokens: A learned mid-level representation for contour and object detection. CVPR,2013. 2
[17] J. Kim and K. Grauman. Shape sharing for object segmenta-tion. In ECCV, 2012. 1, 2, 5
[18] P. Krahenbuhl and V. Koltun. Geodesic object proposals. InECCV, 2014. 1, 2, 4, 5, 6, 8
[19] T.-Y. Lin, M. Maire, S. Belongie, J. Hays, P. Perona, D. Ra-manan, P. Dollar, and C. Zitnick. Microsoft COCO: Com-mon Objects in Context. In ECCV, 2014. 1, 2
[20] S. Manen, M. Guillaumin, and L. Van Gool. Prime Ob-ject Proposals with Randomized Prim’s Algorithm. In ICCV,2013. 1
[21] J. Pont-Tuset, P. Arbelaez, J. Barron, F.Marques, and J. Ma-lik. Multiscale combinatorial grouping for image segmen-tation and object proposal generation. arXiv:1503.00848,March 2015. 2, 5, 6, 8
[22] P. Rantalankila, J. Kannala, and E. Rahtu. Generating ob-ject segmentation proposals using global and local search. InCVPR, 2014. 1, 2, 5, 6, 8
[23] O. Russakovsky, J. Deng, H. Su, J. Krause, S. Satheesh,S. Ma, Z. Huang, A. Karpathy, A. Khosla, M. Bernstein,A. C. Berg, and L. Fei-Fei. ImageNet Large Scale VisualRecognition Challenge. International Journal of ComputerVision (IJCV), 2015. 1
[24] A. Torralba and A. A. Efros. Unbiased Look at Dataset Bias.In CVPR, 2011. 2
[25] J. R. R. Uijlings, K. E. A. van de Sande, T. Gevers, andA. W. M. Smeulders. Selective search for object recognition.IJCV, 104(2):154–171, 2013. 1, 2, 5, 6, 8
[26] M. Van den Bergh, X. Boix, G. Roig, and L. Van Gool.SEEDS: Superpixels Extracted via Energy-Driven Sampling.IJCV, 111(3):298–314, 2015. 7
[27] P. Viola and M. Jones. Robust real-time face detection. IJCV,57(2), 2004. 1
[28] C. L. Zitnick and P. Dollar. Edge boxes: Locating objectproposals from edges. In ECCV, 2014. 1