Book review on International finance by Ranbir Kumar Singh
52
1 International School of Management, Patna A Report On Internet Finance By: Ranbir Kumar Singh Roll No:-111309 PGDM (2011-2013) Faculty guide: Prof. A K Haldar Dr. Jagdish Prasad
-
Upload
ranbir-singh -
Category
Education
-
view
162 -
download
3
description
-Key Issues in International Business Finance -What is on the International CFO's desk -International (\Euro") Money and Bond Markets -What is the Balance of Payments?
Transcript of Book review on International finance by Ranbir Kumar Singh
1
International School of Management,
Patna
A
Report On
Internet Finance
By:
Ranbir Kumar Singh
Roll No:-111309
PGDM (2011-2013)
Faculty guide:
Prof. A K Haldar
Dr. Jagdish Prasad

2
Acknowledgements
I am extremely grateful to Prof. Anindra kumar Haldar (Dean of ISM, Patna), for
helping me and providing me useful information. By interacting with him during
my PGDM program, I learnt many knowledgeable things which is required to
become successful person at global aspect,
I am sure the knowledge imparted will go in a long way in
enriching my career.
I wish to acknowledge my indebtedness to my project guide, Along with my
project guide I would like to show my gratitude towards, Ms. Mona Haidri, also
like to thank my all classmates for their co-operation and all the helpful people at
ISM Patna. It was a privilege to work at ISM Patna. The project could not be
completed without their able support guidance.
Finally, I take this opportunity to thank all
3
Contents
I Introduction and Motivation for International Finance 1 Why does the Existence of Borders Matter for Finance?
1.1 Key Issues in International Business Finance . . . . . . . . . . . . . . . . . 1.1.1 Exchange-rate Risk . . . . . . . . . . . . . . . . . . . . . . . . . . . 1.1.2 Segmentation of the Consumer-good Markets . . . . . . . . . . . .
1.1.3 Credit risk . . . . . . . . . . . . . . . . . . . . . . . . . . . . . . . 1.1.4 Political risk . . . . . . . . . . . . . . . . . . . . . . . . . . . . . .
1.1.5 Capital-Market Segmentation Issues, including Aspects of Corpo- rate Governance . . . . . . . . . . . . . . . . . . . . . . . . . . . .
1.1.6 International Tax Issues . . . . . . . . . . . . . . . . . . . . . . . . 1.2 What is on the International CFO's desk? . . . . . . . . . . . . . . . . . .
1.2.1 Valuation . . . . . . . . . . . . . . . . . . . . . . . . . . . . . . . . 1.2.2 Funding . . . . . . . . . . . . . . . . . . . . . . . . . . . . . . . . .
1.2.3 Hedging and, more Generally, Risk Management . . . . . . . . . . 1.2.4 Interrelations Between Risk Management, Funding and Valuation.
1.3 Overview of this Book . . . . . . . . . . . . . . . . . . . . . . . . . . . . .
1.3.1 Part I: Motivation and Background Matter . . . . . . . . . . . . .
1.3.2 Part II: International Financial Markets . . . . . . . . . . . . . . .
1.3.3 Part III: Exchange Risk, Exposure, and Risk Management . . . . .
1.3.4 Part IV: Long-term Financing and Investment Decisions . . . . . .
2 International Finance: Institutional Background
2.1 Money and Banking: A Brief Review . . . . . . . . . . . . . . . . . . . . .
2.1.1 The Roles of Money . . . . . . . . . . . . . . . . . . . . . . . . . .
2.1.2 How Money Is Created . . . . . . . . . . . . . . . . . . . . . . . .
2.2 The International Payment Mechanism . . . . . . . . . . . . . . . . . . . .
2.2.1 Some Basic Principles . . . . . . . . . . . . . . . . . . . . . . . . . 2.2.2 DIT: Real-time Gross Settlement vs. Periodic Netting
2.2.3 International payments . . . . . . . . . . . . . . . . . . . . . . . .
2.3 International (\Euro") Money and Bond Markets . . . . . . . . . . . . . .
2.4 What is the Balance of Payments? . . . . . . . . . . . . . . . . . . . . . .
2.4.1 Definition & Principles Underlying the Balance of Payments . . .
2.4.2 Some Nitty-gritty . . . . . . . . . . . . . . . . . . . . . . . . . . . .
2.4.3 Statistical Discrepancy/Errors and Omissions . . . . . . . . . . . .
2.4.4 Where do Current Account Surpluses or Deficits Come From? . . .
2.4.5 The Net International Investment Account . . . . . . . . . . . . .
2.5 Exchange-rate Regimes . . . . . . . . . . . . . . . . . . . . . . . . . . . . .
2.5.1 Fixed Exchange Rates Relative to Gold . . . . . . . . . . . . . . .
4
CONTENTS 2.5.2 Fixed Exchange Rates vis-a-vis a Single Currency . . . . . . . . . 2.5.3 Fixed Exchange Rates Relative to a Basket . . . . . . . . . . . . . 2.5.4 The 1979{1993 Exchange Rate Mechanism (ERM) of the European Monetary System . . . . . . . . . . . . . . . . . . . . . . . . . . . .
2.5.5 Other Exchange Rate Systems . . . . . . . . . . . . . . . . . . . .
2.6 Test Your Understanding . . . . . . . . . . . . . . . . . . . . . . . . . . . .
2.6.1 Quiz Questions . . . . . . . . . . . . . . . . . . . . . . . . . . . . .
2.6.2 Applications . . . . . . . . . . . . . . . . . . . . . . . . . . . . . .
3 Spot Markets for Foreign Currency
3.1 Exchange Rates . . . . . . . . . . . . . . . . . . . . . . . . . . . . . . . . .
3.1.1 Definition of Exchange Rates . . . . . . . . . . . . . . . . . . . . .
3.1.2 Our Convention: Home Currency per Unit of Foreign Currency . .
3.1.3 The Indirect Quoting Convention . . . . . . . . . . . . . . . . . . .
3.1.4 Bid and Ask Rates . . . . . . . . . . . . . . . . . . . . . . . . . . .
3.1.5 Primary rates v crosses rates . . . . . . . . . . . . . . . . . . . . . .
3.1.6 Inverting Exchange Rates in the Presence of Spreads . . . . . . . .
3.2 Major Markets for Foreign Exchange . . . . . . . . . . . . . . . . . . . . .
3.2.1 How Exchange Markets Work . . . . . . . . . . . . . . . . . . . . .
3.2.2 Markets by Location and by Currency . . . . . . . . . . . . . . . .
3.2.3 Markets by Delivery Date . . . . . . . . . . . . . . . . . . . . . . .
3.3 The Law of One Price for Spot Exchange Quotes . . . . . . . . . . . . . .
3.3.1 Arbitrage across Competing Market Makers . . . . . . . . . . . . .
3.3.2 Shopping Around across Competing Market Makers . . . . . . . .
3.3.3 Triangular Arbitrage . . . . . . . . . . . . . . . . . . . . . . . . . . 3.4 Translating FC Figures: Nominal rates, PPP rates, and Deviations from PPP 3.4.1 The PPP rate . . . . . . . . . . . . . . . . . . . . . . . . . . . . . .
3.4.2 Commodity Price Parity . . . . . . . . . . . . . . . . . . . . . . . . 3.4.3 The Real Exchange Rate and (Deviations from) Absolute PPP. .
5
Why does the Existence of Borders Matter for Finance? Almost tautologically, international nance selects from the broad eld of nance
those issues that have to do with the existence of many distinct countries. The
fact that the world is organized into more or less independent entities instead of a
single global state complicates a CFO's life in many ways|ways that matter far
more than does the existence of provinces or states or Landen or departements
within a country. Below, we discuss the existence of national currencies and,
hence, the issue of exchange rates and exchange risk; the segmentation of goods
markets along predominantly national lines; in combi-nation with price stickiness, this
makes most exchange-rate changes \real"; the existence of separate judicial
systems, which further complicates the already big issue of credit risk, and has
given rise to private-justice solutions; the sovereign autonomy of countries, which
adds political risks to standard com-mercial credit risks the existence of separate
and occasionally incompatible tax systems, giving rise to issues of double and
triple taxation.
6
1.1 Key Issues in International Business Finance
1.1.1 Exchange-rate Risk
Why do most countries have their own money? One disarmingly simple reason is
that printing bank notes is pro table, obviously, and even the minting of coins is
usually a positive-NPV business. In the West, at least since the days of the Greeks
and Romans, governments have been involved as monopoly producers of coins
or at least as receivers of a royalty (\seignorage") from the use of the o cial logo.
More recently, the ascent of paper money, where pro t margins are almost too
good to be true, has led to o cial monopolies virtually everywhere. One reason
why money production is not handed over to the UN or the IMF or WB is that
governments dislike giving up their monopoly rents. For instance, the
shareholders of the European Central Bank are the individual Euro-countries, not
the eu itself; that is, the countries have given up their monetary independence,
but not their seignorage. In addition, having one's own money is a matter of
national pride too: most Brits or Danes would not even dream of surrendering
their beloved Pound Sterling or Crown for, of all things, a European currency.
Lastly, a country with its own money can adopt a monetary policy of its own,
tailored to the local situation. Giving up a local policy was a big issue at the time
the introduction of common European money was being debated.
If money had intrinsic value (e.g. a silver content), if that intrinsic value were
stable and immediately obvious to anybody, and if coins could be de-minted into
silver and silver re-minted into coins at no cost and without any delay, then the value
of a German Joachimsthaler relative to a Dutch Florin and a Spanish Real would all
be based on their relative silver content, and would be stable. But in practice, many
sovereigns were cheating with the silver content of their currency, and got away with
it in the short run. Also, there are costs in identifying a coin's true intrinsic value and
in converting Indian coins, say, into Moroccan ones. Finds of hoards dating from
the Roman or Medieval times reveal astounding di erences in the silver content
of various coins with the same denomination. For instance, among solidus pieces
from various mints and of many vintages, some have silver contents that are
twice that of other solidus coins found in the same hoard. In short, intrinsic value
did never nail down the market value in a precise way, not even in the days when
coins really were made of silver, and as a result exchange rates have always
uctuated. Since the advent of paper money and electronic money, of course,
intrinsic value no longer exists: the idea that paper money was convertible into
gold coins lost all credibility after WW1. After WW2, governments for some time
controlled the exchange rates, but largely threw in the towel in 1973-4. Since
then, exchange rates are based on relative trust, a ckle good, and the resulting
exchange-rate risk is a fact of life for all major currency pairs.
7
1.1.2 Segmentation of the Consumer-good Markets While there are true world markets|and, therefore, world prices|for commodities,
many consumer goods are really priced locally, and for traditional services the in-
ternational in uence is virtually absent. Unlike corporate buyers of say oil or corn
or aluminum, private consumers do not bother to shop around internationally for
the best prices: the amounts at stake are too small, and the transportation cost
and hassle and delay from international trade would be prohibitive anyway. Dis-
tributors, who are better placed for international shopping-around, prefer to
pocket the resulting quasi-rents themselves rather than passing them on to
consumers. For traditional services, international trade is not even an option. So
prices are not homogenized internationally even after conversion into a common
currency. One strong empirical regularity is that, internationally, prices rise with
GDP/capita. In Figure 1.1, for instance, you see prices of the Big Mac in various
countries, relative to the US price. Obviously, developed countries lead this list,
with growth countries showing up as less expensive by The Economist's Big Mac
standard. The ratio of Big Mac prices Switzerland/China is 3.80. Norway (not
shown here) was even more than ve times more expensive than China, in early
2006; and two years before, the gap Iceland/South Africa was equally wide.
Within a country, by contrast, there is less of this price heterogeneity. For ex-
ample, price di erences between \twin" towns that face each other across the us-
Canadian or us-Mexican border are many times larger than di erences between
East- and West-coast towns within the us. One likely reason that contributes to
more homogenous pricing within a country is that distributors are typically orga-
nized nationally. Of course, the absence of hassle with customs and international
shippers and foreign indirect tax administrations also helps.
A second observation is that prices tend to be sticky. Companies prefer to
avoid price increases, because the harm done to sales is not easily reversed:
consumers are resentful, or they just write o the company as \too expensive" so
that they do not even notice when prices come down again. Price decreases, on
the other hand, risk setting o price wars, and so on.
Now look at the combined picture of (i) price stickiness, (ii) lack of international
price arbitrage in consumption-good markets, and (iii) exchange-rate uctuations. The
result is real exchange risk. Barring cases of hyperin ation, short-run exchange-rate
uctuations have little or nothing to do with the internal prices in the countries that are
involved. So the appreciation of a currency is not systematically accompa-nied by
falling prices abroad or soaring prices at home so as to keep goods prices similar in
both countries. As a result, appreciation or depreciation can make a country less
attractive as a place to produce and export from or as a market to ex-port to. They
therefore a ect the market values and competitiveness of companies and economies
(\economic exposure"). For instance, the soaring usd in the Reagan years has meant
the end of many a us company's export business, and the rise of the dem in the 70s
forced Volkswagen to become a multi-country producer.
8
Real exchange risks also a ects asset values in a more subtle way.
Depending on where they live, investors from di erent countries realize di erent
real returns from one given asset if the real exchange rate changes. Thus, one of
the fundamental assumptions of e.g. the capm, that investors all agree on the
returns and risks of all assets, becomes untenable. While this may sound like a
very theoretical issue, it becomes more important once you start thinking about
capital budgeting. For instance, a us rm may be considering an investment in
South Africa, starting from projected cash ows in South-African Rand (sar). How
to proceed? Should the managers discount them using a sar discount rate, the
way a local investor would presumably do it, and then convert the PV into usd
using the current spot rate? Or should they do it the us way: use expected future
spot rates to convert the data into expected usd cash ows, to be discounted at a
usd rate? Should both approaches lead to the same answer? Can they, in fact?
Exchange risk is the issue that takes up more space than any other separate topic
in this book. Its importance can be seen from the fact that so many instruments exist
that help us cope with this type of uncertainty: forward contracts, currency futures
and options, and swaps. You need to understand all these instruments, their
interconnections, their uses and limitations, and their risks.
1.1.3 Credit risk
If a domestic customer does not pay, you resort to legal redress, and the courts
enforce the ruling. Internationally, one problem is that at least two legal systems
are involved, and they may contradict each other. Usually, therefore, the contract
will stipulate what court will rule and on the basis of what law|say Scottish law in
a New York court (I did not make this up). Even then, the new issue is that this
court cannot enforce its ruling outside its own jurisdiction.
This has given rise to private-contract solutions: we seek guarantees from
special-ized nancial institutions (banks, factors, insurance companies) that (i) are
better placed to deal with the credit risks we shifted towards them, and (ii) have
an in-centive to honor their own undertakings because they need to preserve a
reputation and safeguard relations with fellow banks etc. So you need to
understand where these perhaps Byzantine-sounding payment options (like D/A,
D/P, L/C without or with con rmation, factoring, and so on) come from, and why and
where they make sense.
9
1.1.4 Political risk
Governments that decide or rule as sovereigns, having in mind, the interest of their
country cannot be sued in court as long as what they do is constitutiona. Still, these
decisions can hurt a company. One example is imposing currency controls, that is,
block some or all exchange contracts, so that the money you have in a foreign bank
account gets stuck there (transfer risk). You need to know how you can react pro-
and retroactively. You also need to know how this risk has to be taken into account in
international capital budgeting. If and when your foreign-earned cash ow gets stuck
abroad, it is obviously worth less than its nominal converted value because you
cannot spend the money freely where and how you want|but how does one estimate
the probabilities of this happening at various dates, and how does one predict the
size of the value loss?
Another political risk is expropriation or nationalization, overtly or on the
stealth. While governments can also expropriate locally-owned companies (like
banks, in 1981 France), foreign companies in the \strategic" sectors (energy,
transportation, mining & extraction, and, atteringly, nance) are especially
vulnerable: most of them were expropriated or had to sell to locals in the 1970s.
The 2006 Bolivian example, where President Evo Morales announced that \The
state recovers title, possession and total and absolute control over [our oil and
gas] resources" (The Economist, May 4, 2006.) also has to do with such a sector.
Again, one issue for the nance sta is how to factor this in into NPV calculations.
10
1.1.5 Capital-Market Segmentation Issues, including Aspects of
Corporate Governance
A truly international stock and bond market does not exist. First, while stocks and
bonds of big corporations do get traded in many places and are held by investors
all over the world, mid-size or small-cap companies are largely one-country
instru-ments. Second, portfolios of individual and institutional investors exhibit
strong home bias|that is, heavy overweighting of local stocks relative to foreign
stocks| even regarding their holdings of shares in large corporations. A third
aspect of fragmentation in stock markets is that we see no genuine international
stock ex-changes (in the sense of institutions where organized trading of shares
takes place); instead, we have a lot of local bourses. A company that wants its
shares to be held in many places gets a listing on two or three or more
exchanges (dual or multiple listings; cross-listing): being traded in relatively
international places like London or New York is not enough, apparently, to
generate worldwide shareholdership. How come?
The three phenomena might be related, and caused by the problem of
asymmetric information and investor protection. Valuing a stock is more di cult
than valuing a bond, even a corporate bond, and the scope for misrepresentation
is huge, as the railroad and dotcom bubbles have shown. All countries have set
up some legislation and regulation to reduce the risks for investors, but there are
enormous di erences in the amount of information, certi cation and vetting
required for an initial public o ering (IPO). All countries think, or claim to think, the
other countries are fools by imposing so much/little regulation. The scope for
establishing a common world standard in the foreseeable future is nil. Pending
this, there can be no single world market for stocks.
11
The same holds for disclosure requirements once the stock has been launched, and
the whole issue of corporate governance. The big issue here is how to avoid man-agers
selfdealing or otherwise siphoning o cash that ought to be the shareholders'. Good
governance systems contain checks and balances, like separation of the jobs of
chairman of the Board of Directors and CEO; a su cient presence of independent directors
on the Board; an audit committee that closely watches the accounts; com-prehensive
information provision towards investors; a willingness, among the board members, to re
poorly performing CEO's, perhaps on the basis of pre-set perfor-mance criteria; a board
that can be red by the Assembly General Meeting in one shot (as opposed to staggered
boards, where every year only one fth comes up for (re)election, for example); and a AGM
that can formulate binding instructions to the Board and the CEO. Good governance also
requires good information provision, with detailed nancial statements accompanied by all
kinds of qualitative information.
But governance is not just a matter of corporate policies: it can, and ideally must,
be complemented by adequately functioning institutions in the country. For instance,
how active and independent are auditors, analysts (and, occasionally, news-paper
reporters)? Is a periodic evaluation of the company's nancial health by its house
bank(s), each time loan are rolled over or extended, a good substitute for outside
scrutiny? Are minority shareholders well protected, legally? How stringent are the
disclosure and certi cation requirements, and are they enforced? Are there active
large shareholders, like pension funds, that follow the company's performance and
put pressure onto management teams they are unhappy with? Is there an active
market for corporate o cers, so that good managers get rewarded and (especially)
vice versa? Is there an active acquisition market where poorly performing com-
panies get taken over and reorganized? Again, on all these counts there are huge di
erences across countries, which makes it impossible to set up one world stock
market. The OECD has been unable to come up with a common stance on even
something as fundamental as accounting standards. Telenet, a company discussed
in a case study in Part IV, has three sets of accounts: Belgian GAAP, US GAAP, and IFRS.
Even though in the us its shares are only sold to large private investors rather than the
general public, Telenet still had to create a special type of security for the us markets.
In short, markets are di erentiated by regulation and legal environment. In addi-
tion, companies occasionally issue two types of shares: those available for residents
of their home country, and unrestricted stocks that can be held internationally. Some
countries even impose this by law. China is a prominent example, but the list used to
include Korea, Taiwan, and Finland/Sweden/Norway. Typically, only a small fraction
of the shares was open to non-residents. Other legislation that occasionally still
fragments markets is a prohibition to hold forex; restrictions or prohibitions on
purchases of forex, especially for nancial (i.e. investment) purposes; caps on the
percentage of mutual funds or pension funds invested abroad, or minima for do-
mestic investments; dual exchange rates that penalize nancial transactions relative
to commercial ones; taxes on deposits by non-residents; requirements to invest at
zero interest rates at home, proportionally with foreign investments or even with
imports, and so on|you name it.

12
In OECD countries or NICs, this type of restrictions is now mostly gone. In December
2006, Thailand imposed some new regulations in order to discourage in ows|usually
the objective is to stop out ows|but hastily reversed them after the Bangkok stock
market had crashed by 15 percent; this example goes to show that this type of
restriction is simply not done anymore. But some countries never lifted them
altogether, like Chile, while in other countries the bureaucratic hassle is still strongly
discouraging (India) or virtually prohibiting (Russia) capital exports.
There are two repercussions for corporate nance. One is via the shareholders.
Speci cally, in countries with serious restrictions on outward investments, the invest-
ment menu is restricted and di erent from the opportunity set available to luckier
investors elsewhere. This then has implications for the way one works with the CAPM:
companies in a walled-o country have to de ne the market portfolio in a strictly local
way, while others may want to go all the way to the world-market version of the
market portfolio. So companies' discount rates are a ected and, therefore, their direct
investment decisions. Another corporate- nance implication is that a com-pany that
wants to issue shares abroad cannot simply go to some \international" market:
rather, it has to select a country and, often, a segment (an exchange|which
exchange? which board?|or the over-the-counter market or the private-investors
segment), carefully weighting the costs and bene ts of its choices. An important part
of the costs and bene ts have to do with the corporate-governance and disclosure
rami cations of the country and market segment one chooses.
1.1.6 International Tax Issues
Fiscal authorities are understandably creative when thinking up excuses to tax.
For instance, they typically want to touch all residents for a share in their income,
whether that income is domestic or foreign in origin; but they typically also insist
on taxing anybody making money inside the territory, whether the earner is a
resident or not. So a Icelandic professor making money in Luxembourg as
visiting faculty would be taxed by both Luxembourg|she did make money
there|and by Iceland| she is a resident there.
In corporate examples things get even worse. When an Icelandic corporation
sets up shop in Luxembourg, the subsidiary is taxed there on its pro ts: it is a
resident of Luxembourg, after all. But when that company then pays a dividend to
its parent, both Luxembourg and Iceland may want to tax the parent company
again: the parent makes money in L, but is a resident in I.
Fortunately, legislators everywhere agree that double or triple taxation maybe
somewhat overdoing things, so they advocate neutrality. But, as we shall see, there
is no agreement as to how a \neutral" system can be de ned, let alone how it is to be
implemented. This makes life for the CFO complicated. But it also makes life exciting,
because of the loopholes and clever combinations (\treaty shopping") that can
substantially a ect the tax burden.
13
1.2 What is on the International CFO's desk?
This book is a text on international nance. Thus, it does not address issues of multi-
national corporate strategy, and the discussion of international macroeconomics is
kept to a minimum. Within the nance discipline, it addresses only the problems
caused by the existence of many countries, as described in the preceding section.
One way to further describe the material is to think about the tasks assigned
to an international nancial manager. These tasks include asset valuation,
international funding, the hedging of exchange risk, and management of other
risks. We hasten to add that these functions cannot be viewed in isolation, as will
become clear as we proceed. 1.2.1 Valuation
One task of an international nance o cer is the valuation of projects with cash
ows that are risk free in terms of the foreign currency. For example, the manager
may need to evaluate a large export order with a price xed in foreign currency
and payable at a (known) future date. The future cash ow is risky in terms of the
domestic currency because the future exchange rate is uncertain. Just like one
would do with a domestic project with cash ows that are risky in terms of the
domestic currency, this export project should be subject to a Net Present Value
(NPV) analysis. Thus, the manager needs to know how to compute present values
when the source of risk is the uncertainty about the future exchange rate.
Valuation becomes even more complicated in the case of foreign direct
investment (FDI), where the cash ows are random even in terms of the foreign
currency. The issues to be dealt with now are how to discount cash ows subject
to both business risk and exchange risk, how to deal with tax complications and
political risks inherent in FDI, and how to determine the cost of capital depending on
whether or not the home and foreign capital markets are segmented.
14
1.2.2 Funding
A second task is, of course, funding the project. A standard nancing problem is
whether the rm should issue equity, debt, or equity-linked debt (like convertible
bonds). If bonds are issued or a loan is taken out, the standard questions are what
the optimal maturity is, and whether the terms o ered by a bank or a group of banks
are attractive or not. In an international setting, the additional issue to be considered
is whether the bond or loan should be denominated in home currency or in another
one, whether or when there are any tax issues in this choice, how the risk can be
quanti ed when it is correlated with other risks, and so on.
If funding is done in the stock markets, the issue is whether to issue stocks locally
or to get a secondary listing elsewhere|or perhaps even move the com-pany's
primary listing abroad. The targeted foreign market may be better orga-nized, have
more analysts that know and understand your business, and give access to deep-
pocketed investors who, being well-diversi ed already, are happy with lower expected
returns than the current shareholders. But there are important corporate-governance
issues as well, as we saw: getting a listing in a tough place is like receiving a certi
cate of good behavior and making a strong commitment to behave well in future too.
So the mere fact of getting such a listing can lift the value of the company as a
whole. There are, of course, costs too: publishing di erent accounts and reports to
meet diverging accounting and disclosure rules can be cumbersome and expensive,
and listing costs are not trivial either. Because of the corporate-governance issues,
cross-listings are not purely technical decisions that belong to the CFO's competence:
the whole Board of Directors should be involved.
1.2.3 Hedging and, more Generally, Risk Management
Another of the nancial manager's tasks usually is to reduce risks, like exchange
risk, that arise from corporate decisions. For example, a manager who has
accepted a large order from a customer, with a price xed in foreign currency and
payable at some (known) future point in time, may need to nd a way to hedge the
resulting exposure to exchange rates.
There are, however, many other sources of uncertainty besides exchange rates.
Some are also \market" risks: uncertainties stemming from interest rates, for in-
stance, or commodity prices or, for some companies, stock market gyrations. Ex-
change risk cannot be hedged in isolation, for the simple reason that market risks
tend to be correlated. As a result, many companies want to track the remaining
uncertainties of their entire portfolio of activities and contracts. This is usually
summarized in a number called value at risk (VaR), the maximum loss that can be
sustained with a given probability (say, 1 percent) over a given horizon (say, one
day), taking into account the correlations between the market risks.
15
1.2.4 Interrelations Between Risk Management, Funding and Val-uation
While the above taxonomy of CFO assignments is logical, it does not o er a good
structure for a textbook. One reason is that valuation, hedging, and funding are
interrelated. For instance, a rm may be unwilling to accept a positive-NPV export
contract (valuation) unless the currency risk can be hedged. Also, the funding issue
cannot be viewed in isolation from the hedging issue. For example, a Finnish
corporation that considers borrowing in Yen, should not make that decision without
pondering how this loan would a ect the rm's total risk. That is, the decision to borrow
Yen may be unacceptable unless a suitable hedge is available. In another example,
a German rm that has large and steady dollar revenues from exports might prefer
to borrow usd because such a loan provides not just funding, but also risk
reduction. In short, project evaluation, funding, and hedging have to be
considered together.
But risks do not stop at market risks. There are credit risks, political risks,
operational risks, reputation risks, and so on, and also these interact with the
more nancial issues. For instance, the evaluation of an export project should
obviously take into account the default risk. Similarly, NPV computations for FDI
projects should account for the risk that foreign cash ows may be blocked or that
the foreign business may be expropriated.
1.3 Overview of this Book
In the preceding section, we discussed the key issues in international nance on
the basis of managerial functions. As said, this is not a convenient way to
arrange the text because the functions are all interlinked. Instead, we proceed as
follows. We begin with an introductory chapter on the history of the international
monetary system. The remainder of this textbook, then, is divided into four parts:
(II ) International nancial markets and instruments; (III ) Exchange rate risk,
exposure, and risk management; and (IV ) Long-term nancing and investment
decisions. In most of the chapters except the next one, the focus is on corporate
nancial issues, such as risk management and funding and capital budgeting. Let
us brie y review the contents of each part below.
16
1.3.1 Part I: Motivation and Background Matter
After the present motivational chapter, we go over some background material: how is
money created, how is it paid internationally, what is the role of governments in
exchange markets, and what does the Balance of Payments mean for a country?
1.3.2 Part II: International Financial Markets
Part II of the book describes the currency market in its widest sense, that is, in-
cluding all its satellites or derivatives. Chapter 3 describes spot markets. Forward
markets, where price and quantity are contracted now but delivery and payment take
place at a known future moment, are introduced in Chapter 4, in a perfect-markets
setting. Chapter 5 shows how and when to use contracts in reality: for arbitrage,
taking into account costs; for hedging; for speculation; and for shopping-around and
structured- nance applications including, especially, swaps. Currency options and
shows how these options can be used to hedge against (or al-ternatively,
speculate on) foreign exchange risk. How one can price currency options is
explained in Chapter 9; we mostly use the so-called binomial approach but also
link it to the famous Black-Merton-Scholes model.
At any instant, the market value of a forward, futures, or options contract de-
pends on the prevailing spot rate (and, if the contract is not yet at the end of its
life, also on the domestic and foreign interest rates). This dependence on the
future spot rate means that all these contracts can be used to hedge the
exchange-rate risk to which the rm is exposed. The dependence of these
contracts on the future spot rate also means that their current market values can
be expressed, by relatively simple arbitrage arguments, as functions of the
current spot rate and of the domestic and foreign interest rate. Throughout this
part of the text, a uni ed approach based on arbitrage-free pricing is used to
value these assets whose payo s are dependent on the exchange rate.
17
1.3.3 Part III: Exchange Risk, Exposure, and Risk Management
This part opens with a discussion of the behavior and predictability of nominal
and real exchange rates. We conclude that exchange rates are hard to explain,
let alone to predict, and that most of the nominal uncertainty is also real, thus a
ecting the long-term value of a company.
This may sound like a good excuse to hedge. Yet one could argue that (i) hedging
is a standard nancial transaction; (ii) in e cient markets, nancial transactions are
zero-NPV deals; (iii) therefore, hedging does not add value. In Chapter 12 we show
the way out of this fallacy: hedging does add value if it does more than just increase
or decrease the rm's bank account|that is, if and when it a ects the rm's operations.
Given that rms may want to hedge, the next issue is how much to hedge: what is the
size of the exposure (Chapter 13)? We distinguish between contractual, operational,
and accounting exposures. Value at risk is reviewed in Chapter 14. Chapter 15
concludes this part with a description and critical discussion of the various ways to
insure credit risks and transfer risks in international trade.
18
Spot Markets for Foreign Currency In this chapter, we study the mechanics of the spot exchange market. The rst section
explains the various ways in which exchange rates can be quoted, and the second
section how the exchange markets themselves operate. Section 3 then con-siders
exchange transactions in greater detail, focusing on bid and ask rates (that is, the
rates at which a bank buys and sells). This also gives us an opportunity to learn
about arbitrage. Speci cally, in the third section, we shall already apply arbitrage
arguments to the simplest possible problem, the relation between rates quoted by di
erent banks for the same currency. Understanding this simple application now will
make it easier to digest more complicated versions of similar arguments later. One
such application already occurs in the fourth section, where we use arbitrage
arguments to explain how exchange rates quoted, for example, by German banks
(against eur) relate to rates o ered by New Zealand banks (against the nzd).
The chapter ends with the concepts and empirical evidence on, \Purchasing
Power Parity (ppp)" rates and real exchange rate… The conclusion of that part
will be that exchange rates can make or break an exporting company, not just
because of capital losses on foreign-currency-denominated receivables but
possibly also because of a loss of competitiveness. Exchange risk even
interferes with capital market equilibrium and the capital asset pricing model.
These ndings motivate the attention given to exchange rates in this book.
19
3.1 Exchange Rates
As we begin exploring exchange rates, we rst provide a de nition. We then
describe the convention that is used to quote exchange rates throughout this
book, as well as the conventions used in the exchange market. Finally, we
explain how exchange rates are quoted in the presence of bid-ask spreads.
3.1.1 De nition of Exchange Rates
An exchange rate is the amount of a currency that one needs in order to buy one
unit of another currency, or it is the amount of a currency that one receives when
selling one unit of another currency. An example of an exchange rate quote is 0.8
usd per cad (which we will usually denote as \usd/cad 0.8"): you can, for
instance, buy a cad by paying usd 0.80.
In the above, we have combined currency names following the conventions in
physics: eur/usd means euros per dollar just like km/hr means kilometers per
hour. This is the most logical. For instance, if you exchange 3m dollars into euros
at a rate of 0.8 euros per dollar, the result is a number of euros. This ts with our
notation: usd 3m eur=usd 0:8 = eur 2:4m:
(3.1) This may seem self-evident. The reason why we bring this up is that pros do it di erently. In the convention typically adopted by traders, bankers and journalists, eur/usd is not the dimension of the quote but the name of the exchange rate: the Euro quoted in dollars, not its dimension. That is, traders etc. write \eur/usd =
1.2345" whereas we write \St = usd/eur 1.2345". The dimension the trader asks for is
usd/eur, the inverse of what they write|but they do not mean a dimension, they mean
a name.1 In all our examples we use dimensions. The \name" notation pops up
occasionally in press clippings or pictures of trading screens etc, and should not be a problem. To harden yourself, stare at the following line for a full minute:
Eur=usd: | {z }
Name
usd=eur 1:25: (3.2) | {z } Dimension
The tell-tale di erence is that the dimension is immediately followed (or, occasion-
ally, preceded) by the number. If there is no number, or if there is an \=" or \is" or
\equals" etc between the ratio and the number, it must be the name of a rate.
Sometimes practitioners drop the slash in the name and write EURUSD or EUR:USD
instead of EUR/USD, which makes more sense.
It is even more crucial that you understand how exchange rates are quoted. While the
notation is occasionally confusing|are we using dimensions or names?|there could be
even more confusion as to which currency should be used as the numeraire. While you
are familiar with the idea of buying goods and services, you may be less used to buying
money with money. With exchange transactions, you need to agree which money is
being bought or sold. There would be no ambiguity if one of the currencies were your
home currency. A purchase then means that you obtained foreign currency and paid in
home currency, the way you would do it with your other purchases too; and a sale
20
means that you delivered foreign currency and received home currency. If neither
currency is your home currency, then you need to establish which of the two acts
as the home currency. Example 3.1 In a Paris bank, a tourist hands over usd 1,000 to the bank clerk and receives
cad 1,250 in return. This event would be described di erently depending on
whether the person is a us tourist, a Canadian, or a Frenchman:
The us tourist would view this as a purchase of cad 1,250 at a total cost of
usd 1,000, implying a unit price of [usd 1,000]/ [cad 1.250] = usd/cad 0.8.
The Canadian would think of this transaction as a sale of usd 1,000 for cad
1,250, implying a unit price of [cad 1,250]/ [usd 1,000] = cad/usd 1.25.
The Frenchman would regard this as an exchange of two foreign
currencies, and would be at a loss if he would be asked which of these is
being sold and which bought.
Among pros, the currency in which the price is expressed is called the quoting
currency, and the currency whose price is being quoted is called the base
currency or reference currency. We avoid the terms, except in the next two lines.
We just noted that pros denote a rate as base/quoting (or, better, base:quoting)
while its dimensions are quoting/base. A di erent issue is whether the quoting
currency is the home or the foreign one.
21
3.1.2 Our Convention: Home Currency per Unit of Foreign Cur-rency
Once we agree which country is, or acts as, the home country, we can agree to
quote exchange rates as the price in units of home currency (hc), per unit of
foreign currency (fc). That is, we quote the rate as hc/fc throughout this text,
meaning that one unit of foreign currency is worth N home-currency units
(dimension hc/fc). As we shall see, some people do it di erently and state that
with one unit of home currency, they can buy M = 1=N units of foreign currency
(fc/hc). We adopt the hc/fc convention because it is the most natural one. It is the
convention we use when buying goods. For example, we say \the price is 5
dollars per umbrella" (hc/umbrella) not, \with one dollar you can buy one- fth of
an umbrella" (umbrellas per unit of home currency). Example 3.2 1. A quote like usd/eur 1.25 is an American's natural quote for the eur; it is the
usd prices an American gets or pays per eur. For Germans or other Eurolanders,
a quote as eur/usd (euros per dollar) is the more natural one. 2. A quote like usd/cad 0.75 is an American's natural quote for the cad, since the
cad is the currency in the denominator: a price in usd per cad
Expressing prices in hc is the convention for not just umbrellas but also for nancial
assets. Thus, standard nance results hold: the current market value is the expected
future value (including interest earned), discounted at a rate that takes into account
the risk. Under the alternative quotation, confusingly, the current value would be
determined by the inverse of the expected inverse of future value, multiplied by unity
plus the required return. (If you just felt you had to read this sentence twice, you may
want to consider reading end-of-chapter Teknote 3.1 instead.)
The direct (hc/fc) quoting convention used to be standard in continental Eu-
rope, and is called the direct quote, or the \right" quote. In the us, a price with
dimension usd/fc is called \American terms". The alternative is called the \indi-
rect" or \left" quote or, in the US, \European terms". Let's see who uses which
and why.
22
3.1.3 The Indirect Quoting Convention
One group of people using mostly indirect quotes are professional traders in the us.
Between 1944 and the mid-80s, each and every exchange deal went through the
usd; even when a German needed to buy chf, the dem would rst be converted into
usd and these dollars were then exchanged for chf. Naturally, when NY traders talk
to, say, their German counterparts, both must talk the same language, quotewise;
otherwise too much time would be wasted inverting each other's rates all the time.
Both Germans and Americans actually preferred to quote in terms of dem/usd rather
than usd/dem, for the simple reason that the o cial parities, set by the German
government, were expressed in dem/usd.2 More in general, us professionals use the
exchange-rate convention as quoted in the other country. Thus, for countries that
quote directly themselves, like Japan, New York traders would talk jpy/usd. But in the
case of countries that quote indirectly themselves, like the uk, pros would also use
usd/gbp. Thus, us pros use indirect quotes for countries that themselves quote
directly, and direct quotes for countries that themselves quote indirectly.
As already hinted at, in the uk one uses the reverse quote, the number of for-eign units that can be bought with one pound, or fc/hc. Some former British-Commonwealth countries (for instance, Australia, New Zealand, and pre-eur Ire-
land) do likewise.3 One reason is that, prior to WW1, the pound was the world's
reserve currency and played the role taken over by the dollar after WW2. In ad-dition, until 1967 the gbp was still severely non-decimal|one pound consisted of
twenty shilling, each worth twelve pence4|while non-pound currencies had gone
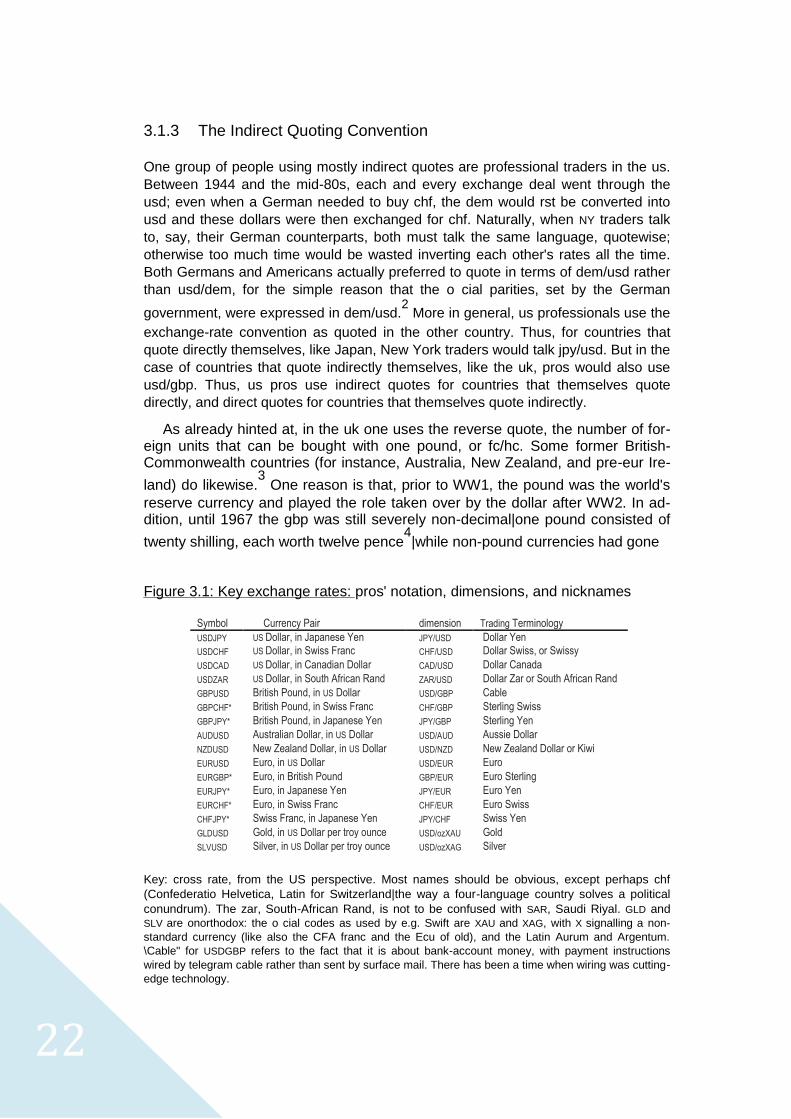
Figure 3.1: Key exchange rates: pros' notation, dimensions, and nicknames
Symbol Currency Pair dimension Trading Terminology USDJPY US Dollar, in Japanese Yen JPY/USD Dollar Yen USDCHF US Dollar, in Swiss Franc CHF/USD Dollar Swiss, or Swissy USDCAD US Dollar, in Canadian Dollar CAD/USD Dollar Canada USDZAR US Dollar, in South African Rand ZAR/USD Dollar Zar or South African Rand GBPUSD British Pound, in US Dollar USD/GBP Cable GBPCHF* British Pound, in Swiss Franc CHF/GBP Sterling Swiss GBPJPY* British Pound, in Japanese Yen JPY/GBP Sterling Yen AUDUSD Australian Dollar, in US Dollar USD/AUD Aussie Dollar NZDUSD New Zealand Dollar, in US Dollar USD/NZD New Zealand Dollar or Kiwi EURUSD Euro, in US Dollar USD/EUR Euro EURGBP* Euro, in British Pound GBP/EUR Euro Sterling EURJPY* Euro, in Japanese Yen JPY/EUR Euro Yen EURCHF* Euro, in Swiss Franc CHF/EUR Euro Swiss CHFJPY* Swiss Franc, in Japanese Yen JPY/CHF Swiss Yen GLDUSD Gold, in US Dollar per troy ounce USD/ozXAU Gold SLVUSD Silver, in US Dollar per troy ounce USD/ozXAG Silver
Key: cross rate, from the US perspective. Most names should be obvious, except perhaps chf
(Confederatio Helvetica, Latin for Switzerland|the way a four-language country solves a political
conundrum). The zar, South-African Rand, is not to be confused with SAR, Saudi Riyal. GLD and SLV are onorthodox: the o cial codes as used by e.g. Swift are XAU and XAG, with X signalling a non-
standard currency (like also the CFA franc and the Ecu of old), and the Latin Aurum and Argentum.
\Cable" for USDGBP refers to the fact that it is about bank-account money, with payment instructions
wired by telegram cable rather than sent by surface mail. There has been a time when wiring was cutting-
edge technology.
23
Decimal ages ago, It is much easier to multiply or divide by a decimal number,
say fc/gbp 0.79208, than with a number like $1/s5/d3 (one pound, ve shillings,
and three pence). So both Brits and non-Brits preferred to talk fc units per pound.
A third (and more recent) class of people using the indirect quote are the Eu-
rolanders, who always quote rates like usd/eur or jpy/eur even though they tradi-
tionally quoted directly (like dem/usd). Cynics conjecture that the Europeans may
have coveted the reserve-currency status associated with an indirect quote.
Another possible reason is that, initially, the Euro was foreign to all existing
currencies. For example, to Germans the Euro was introduced as worth two dem,
so they would think it quite naturally to introduce it to Americans and Japanese
as worth 1.20 usd or 110 jpy. When, eventually, the Euro had become the home
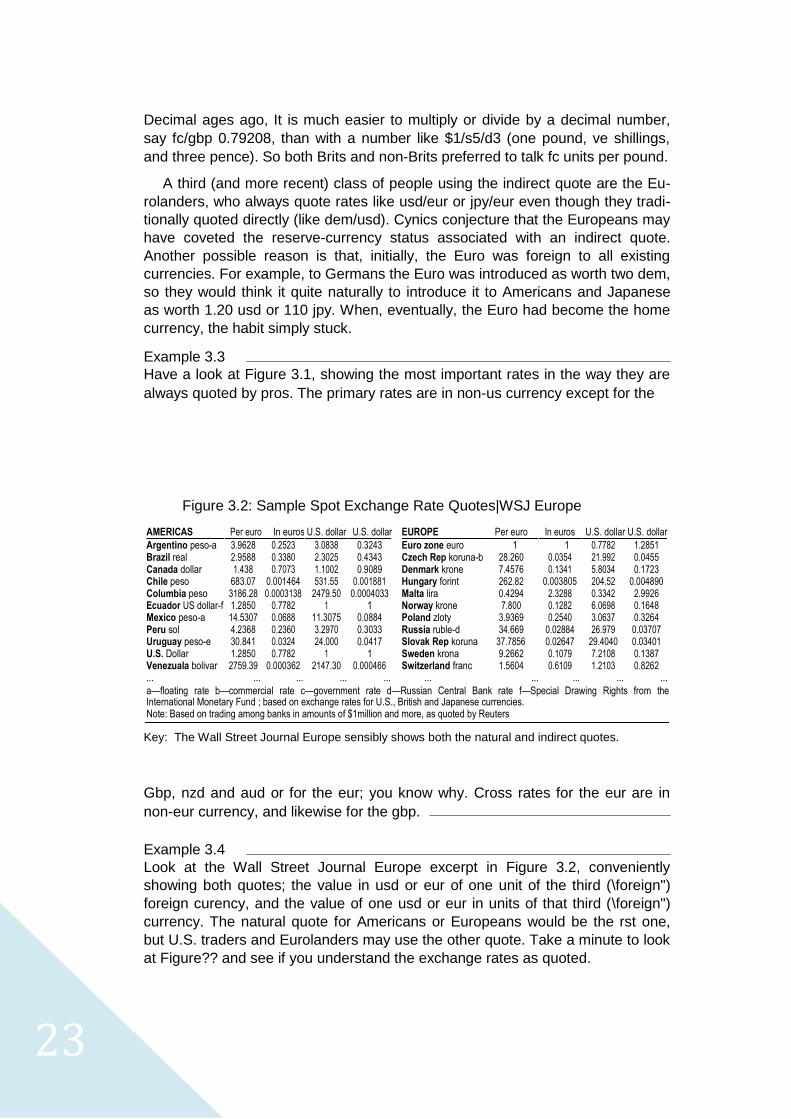
currency, the habit simply stuck. Example 3.3 Have a look at Figure 3.1, showing the most important rates in the way they are
always quoted by pros. The primary rates are in non-us currency except for the
Figure 3.2: Sample Spot Exchange Rate Quotes|WSJ Europe
AMERICAS Per euro In euros U.S. dollar U.S. dollar EUROPE Per euro In euros U.S. dollar U.S. dollar
Argentino peso-a 3.9628 0.2523 3.0838 0.3243 Euro zone euro 1 1 0.7782 1.2851
Brazil real 2.9588 0.3380 2.3025 0.4343 Czech Rep koruna-b 28.260 0.0354 21.992 0.0455
Canada dollar 1.438 0.7073 1.1002 0.9089 Denmark krone 7.4576 0.1341 5.8034 0.1723
Chile peso 683.07 0.001464 531.55 0.001881 Hungary forint 262.82 0.003805 204.52 0.004890
Columbia peso 3186.28 0.0003138 2479.50 0.0004033 Malta lira 0.4294 2.3288 0.3342 2.9926
Ecuador US dollar-f 1.2850 0.7782 1 1 Norway krone 7.800 0.1282 6.0698 0.1648
Mexico peso-a 14.5307 0.0688 11.3075 0.0884 Poland zloty 3.9369 0.2540 3.0637 0.3264
Peru sol 4.2368 0.2360 3.2970 0.3033 Russia ruble-d 34.669 0.02884 26.979 0.03707
Uruguay peso-e 30.841 0.0324 24.000 0.0417 Slovak Rep koruna 37.7856 0.02647 29.4040 0.03401
U.S. Dollar 1.2850 0.7782 1 1 Sweden krona 9.2662 0.1079 7.2108 0.1387
Venezuala bolivar 2759.39 0.000362 2147.30 0.000466 Switzerland franc 1.5604 0.6109 1.2103 0.8262
... ... ... ... ... ... ... ... ... ... a—floating rate b—commercial rate c—government rate d—Russian Central Bank rate f—Special Drawing Rights from the International Monetary Fund ; based on exchange rates for U.S., British and Japanese currencies. Note: Based on trading among banks in amounts of $1million and more, as quoted by Reuters Key: The Wall Street Journal Europe sensibly shows both the natural and indirect quotes. Gbp, nzd and aud or for the eur; you know why. Cross rates for the eur are in
non-eur currency, and likewise for the gbp.
Example 3.4 Look at the Wall Street Journal Europe excerpt in Figure 3.2, conveniently
showing both quotes; the value in usd or eur of one unit of the third (\foreign")
foreign curency, and the value of one usd or eur in units of that third (\foreign")
currency. The natural quote for Americans or Europeans would be the rst one,
but U.S. traders and Eurolanders may use the other quote. Take a minute to look
at Figure?? and see if you understand the exchange rates as quoted.
24
Q1. What is the dollar equivalent of one Euro, according to the quotes in The
Wall Street Journal? A1. If your answer is usd 1.285, you are correct. Q2. Determine the amount of Peruvian sol per eur. A2. If you answered 4.2368 sol per eur, you are right.
3.1.4 Bid and Ask Rates
When you deal with foreign currency, you will discover that you pay a higher price at
the time of purchase than when you sell one currency for another. For example, for
dollar-rouble deals the currency booth in your hotel will quote two numbers, say
rub/usd 35-36. This means that if you sell usd for rub, you receive rub 35, while if you
wish to buy usd you will have to pay rub 36. The rate at which the bank will buy a
currency from you is called the bid rate: they bid (i.e. they announce that they are
willing to pay) 35 per dollar; and the rate at which the bank will sell a currency to you
is the ask rate (they ask 36 per dollar). It is, initially, safer not to think about the
meaning of bidding and asking because the words refer to the bank's view, not
yours. Just remember that you buy at the bank's ask rate, and you sell at the
bank's bid rate. The bid is the lower quote, and ask is the higher one. The Ask
comes higher in the alphabet|use any trick that works, until you get used to it.
Indeed, if exchange rates are being quoted with the currency of interest|the
currency you are buying or selling|in the denominator, then the ask rate will be higher
than the bid rate. Obviously, it could not be the other way around: with a bid rate
above the ask rate you would be able to make huge risk-free pro ts by buying at a
the ask and immediately reselling at the assumedly high bid. No bank will allow you
to buy low and then immediately resell at a pro t without taking any risk, because
your sure gains would obviously mean sure losses for the bank. In theory, there
could still be room for a situation \bid rate = ask rate" (which o ers no such arbitrage
opportunities). Yet, the real-world situation is invariably \bid rate < ask rate": banks
want to make some money from foreign-currency transactions.
Another way to think of this di erence between the ask and the bid rate in fact
is that the di erence contains the bank's commission for exchanging currencies.
The di erence between the buying and selling rates is called the spread, and you
can think of the bank's implicit commission as being equal to half the spread. The
following example explains why the commission is half of the spread rather than
the spread itself.
25
Example 3.5 Suppose that you can buy cad at rub/cad 38.6, and sell at rub/cad 38.0. With these
rates, you can think of a purchase as occurring at the midpoint rate (rub/cad 38.3),
grossed up with a commission of 0.30. Likewise, a sale can be thought of as a sale
at the midpoint, 38.3, from which the bank withholds a commission of 0.30. Thus, the
equivalent commission per one-way transaction is the di erence between the bid (or
ask) and the midpoint rate, that is, half the spread. (The spread itself would be the
cost of a round-trip deal|buy and then sell).
To get an idea of whether your house bank charges a low commission, you
can ask for a two-way quote to see if the spread is small. If this is the case, you
probably do not have to check with other banks. However for large transactions,
you should also compare the spot quotes given by di erent banks. (This will be
examined further in Sections 3.3 and 3.3.3.) We discuss the determinants of
spreads later, after we have described the market microstructure.
26
3.1.5 Primary rates v cross rates
As of 1945 and until well into the 1980s, all exchange rates in the wholesale segment
were against the usd… They were and are called primary rates, while any rate not
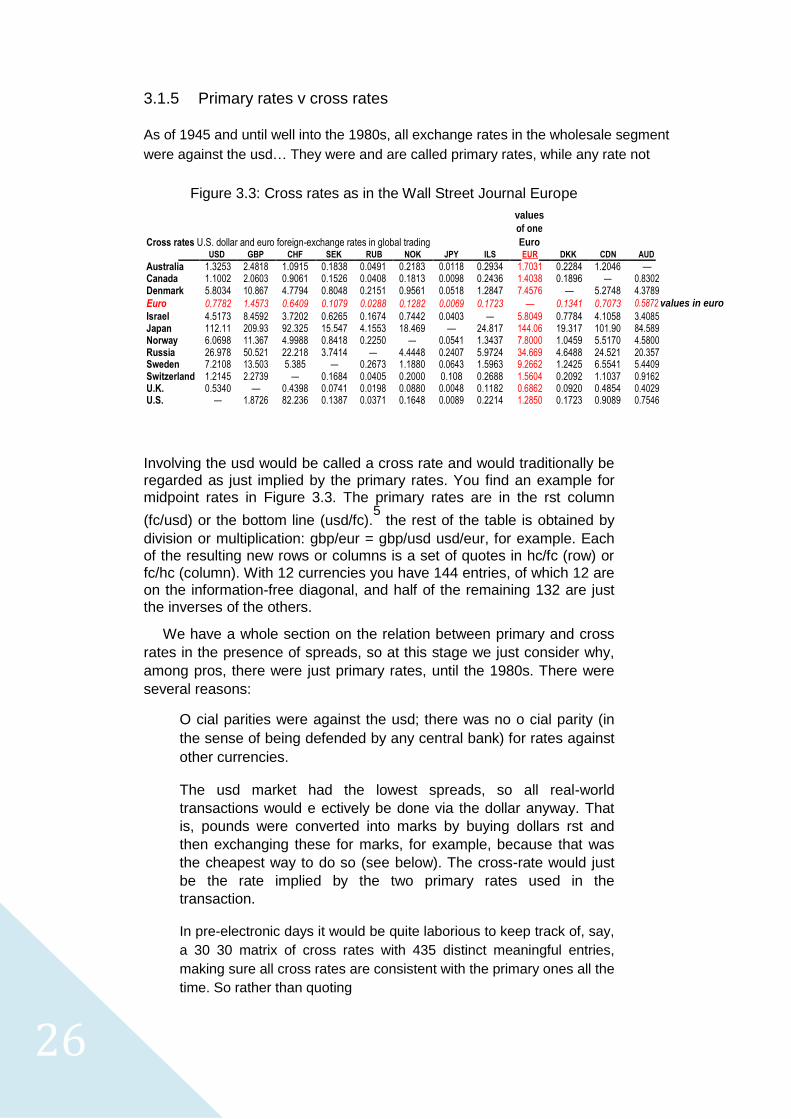
Figure 3.3: Cross rates as in the Wall Street Journal Europe
values
of one
Cross rates U.S. dollar and euro foreign-exchange rates in global trading Euro USD GBP CHF SEK RUB NOK JPY ILS EUR DKK CDN AUD Australia 1.3253 2.4818 1.0915 0.1838 0.0491 0.2183 0.0118 0.2934 1.7031 0.2284 1.2046 — Canada 1.1002 2.0603 0.9061 0.1526 0.0408 0.1813 0.0098 0.2436 1.4038 0.1896 — 0.8302 Denmark 5.8034 10.867 4.7794 0.8048 0.2151 0.9561 0.0518 1.2847 7.4576 — 5.2748 4.3789 Euro 0.7782 1.4573 0.6409 0.1079 0.0288 0.1282 0.0069 0.1723 — 0.1341 0.7073 0.5872 values in euro Israel 4.5173 8.4592 3.7202 0.6265 0.1674 0.7442 0.0403 — 5.8049 0.7784 4.1058 3.4085 Japan 112.11 209.93 92.325 15.547 4.1553 18.469 — 24.817 144.06 19.317 101.90 84.589 Norway 6.0698 11.367 4.9988 0.8418 0.2250 — 0.0541 1.3437 7.8000 1.0459 5.5170 4.5800 Russia 26.978 50.521 22.218 3.7414 — 4.4448 0.2407 5.9724 34.669 4.6488 24.521 20.357 Sweden 7.2108 13.503 5.385 — 0.2673 1.1880 0.0643 1.5963 9.2662 1.2425 6.5541 5.4409 Switzerland 1.2145 2.2739 — 0.1684 0.0405 0.2000 0.108 0.2688 1.5604 0.2092 1.1037 0.9162 U.K. 0.5340 — 0.4398 0.0741 0.0198 0.0880 0.0048 0.1182 0.6862 0.0920 0.4854 0.4029 U.S. — 1.8726 82.236 0.1387 0.0371 0.1648 0.0089 0.2214 1.2850 0.1723 0.9089 0.7546
Involving the usd would be called a cross rate and would traditionally be regarded as just implied by the primary rates. You find an example for midpoint rates in Figure 3.3. The primary rates are in the rst column
(fc/usd) or the bottom line (usd/fc).5 the rest of the table is obtained by
division or multiplication: gbp/eur = gbp/usd usd/eur, for example. Each of the resulting new rows or columns is a set of quotes in hc/fc (row) or
fc/hc (column). With 12 currencies you have 144 entries, of which 12 are on the information-free diagonal, and half of the remaining 132 are just the inverses of the others.
We have a whole section on the relation between primary and cross
rates in the presence of spreads, so at this stage we just consider why,
among pros, there were just primary rates, until the 1980s. There were
several reasons:
O cial parities were against the usd; there was no o cial parity (in
the sense of being defended by any central bank) for rates against
other currencies.
The usd market had the lowest spreads, so all real-world
transactions would e ectively be done via the dollar anyway. That
is, pounds were converted into marks by buying dollars rst and
then exchanging these for marks, for example, because that was
the cheapest way to do so (see below). The cross-rate would just
be the rate implied by the two primary rates used in the
transaction.
In pre-electronic days it would be quite laborious to keep track of, say,
a 30 30 matrix of cross rates with 435 distinct meaningful entries,
making sure all cross rates are consistent with the primary ones all the
time. So rather than quoting
27
cross rates all the time, banks just showed primary quotes and then
computed cross rates if and when needed. By the 1980s desktop computers were around everywhere and, for many pairs of
\big" currencies the volume of cross transactions had become large enough to make
direct cross exchanges competitive compared to exchanges via the usd. O cial
exchange rates were gone in many cases, or in the erm case had become
multilateral. So we now see explicit quotes for some of the cross rates. Look at
Figure 3.2 to see what rates have active multilateral electronic markets|a good
indication of there being a reasonable volume. Note also that for some new eu
members the market against the eur works well while the market against the usd
lacks liquidity; that is, for these countries the rate against the euro is economically
the key one even though Americans would regard it as just a cross rate.
3.1.6 Inverting Exchange Rates in the Presence of Spreads
The next issue is how a pair of quotes for one currency can be translated into a pair
of quotes for a di erent currency. The rule is that the inverse of a bid quote is an ask
quote, and vice versa. To conceptualize this, consider the following illustration.
Example 3.6 An Indian investor wants to convert her cad into usd and contacts her house bank,
Standard Chartered. Being neither American nor Canadian, the bank has no nat-ural
preference for either currency and might quote the exchange rate as either usd/cad
or cad/usd. The Indian bank would make sure that its potential quotes are perfectly
compatible. If it quotes from a Canadian viewpoint, the bank gives a cad/usd quote
(which says how many cad the investor must pay for one usd|for instance, cad/usd
1.5). If it uses the us perspective, the bank gives a usd/cad quote, which says how
many usd the us investor gets for one cad, 0.66667.
The bank's alternative ways of quoting will be fully compatible if
SCAD=usd = 1 (3.3)
Susd=CAD
bid;t
ask;t
SCAD=usd = 1 (3.4)
Susd=CAD
ask;t
bid;t
To fully understand this, recall that what looks like buying (at the ask) to a us
resident looks like selling to a Canadian|at the Canadian's bid. Alternatively,
recall that the ask is the higher of the two quotes. But if you invert two numbers,
the inverse of the larger number will, of course, be smaller than the inverse of the
smaller number. Because the inverse of a larger number is a smaller number, the
inverse ask must become the bid, and vice versa.
28
Example 3.7 Suppose that you read the following quote on the Reuters screen: usd/cad 1.000-
1.005. Q1. What is the bank's buying and selling rate for cad? A1. The bank's buying rate for cad is usd 1.000 and its selling rate is usd 1.005;
that is, you sell cad at usd 1.000 and buy at 1.005. Q2. What, therefore, are the bank's buying and selling rates for usd (in cad)? A2.
The bank's buying rate or bid for usd is 1/1.005 = cad/usd 0.995025 (probably
rounded to 0.9950) and the selling rate or ask is 1/1.000 = 1.000; that is, wearing
your Canadian hat, you sell usd at cad 0.9950 and buy at 1.000.
One corollary is that in countries like the uk, where the reverse or indirect quote is
used, the rate relevant when you buy is the lower of the two, while the higher quote is
the relevant rate when you sell. Thus, it is important to be aware of what the foreign
currency is, and what convention is being used for quoting the exchange rate. Again,
it is always easier and more convenient to have the foreign currency in the
denominator. That way the usual logic will work: banks buy low and sell high.
3.2 Major Markets for Foreign Exchange
In this section, we describe the size and structure of the exchange market and
the type of transactions one can make in this market. 3.2.1 How Exchange Markets Work
The foreign exchange market is not an organized market. Stock markets or futures
markets are: they have xed opening hours, a more or less centralized mechanism to
match supply and demand, standardized contracts, an o cial publication channel for
data on volumes and prices, and a speci c location or one designated group of
computers running everything. In contrast, the exchange market consists of a whole-
sale tier, which is an informal network of about 500 banks and currency brokerages
that deal with each other and with large corporations, and a retail tier, where you and
I buy and sell foreign exchange. At any point in time, wholesale exchange mar-kets
on at least one continent are active, so that the world-wide exchange market is open
twenty-four hours a day (see Figure 3.4). Until the mid-90s, most interbank dealing
was done over the telephone; most conversations were taperecorded, and later con
rmed by mail, telex, or fax. Reuters|which was already omnipresent with its
information screens|and EBS6 have now built computer networks which
29
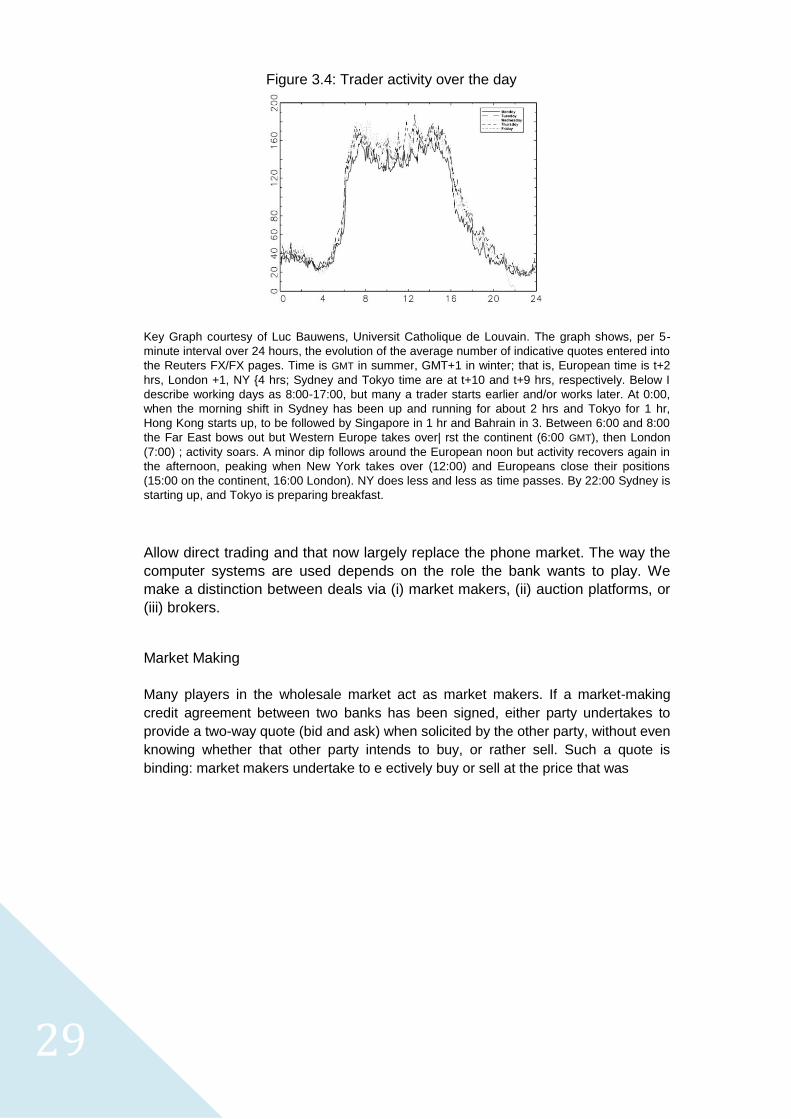
Figure 3.4: Trader activity over the day Key Graph courtesy of Luc Bauwens, Universit Catholique de Louvain. The graph shows, per 5-
minute interval over 24 hours, the evolution of the average number of indicative quotes entered into
the Reuters FX/FX pages. Time is GMT in summer, GMT+1 in winter; that is, European time is t+2
hrs, London +1, NY {4 hrs; Sydney and Tokyo time are at t+10 and t+9 hrs, respectively. Below I
describe working days as 8:00-17:00, but many a trader starts earlier and/or works later. At 0:00,
when the morning shift in Sydney has been up and running for about 2 hrs and Tokyo for 1 hr,
Hong Kong starts up, to be followed by Singapore in 1 hr and Bahrain in 3. Between 6:00 and 8:00
the Far East bows out but Western Europe takes over| rst the continent (6:00 GMT), then London
(7:00) ; activity soars. A minor dip follows around the European noon but activity recovers again in
the afternoon, peaking when New York takes over (12:00) and Europeans close their positions
(15:00 on the continent, 16:00 London). NY does less and less as time passes. By 22:00 Sydney is
starting up, and Tokyo is preparing breakfast. Allow direct trading and that now largely replace the phone market. The way the
computer systems are used depends on the role the bank wants to play. We
make a distinction between deals via (i) market makers, (ii) auction platforms, or
(iii) brokers. Market Making
Many players in the wholesale market act as market makers. If a market-making
credit agreement between two banks has been signed, either party undertakes to
provide a two-way quote (bid and ask) when solicited by the other party, without even
knowing whether that other party intends to buy, or rather sell. Such a quote is
binding: market makers undertake to e ectively buy or sell at the price that was
30
Example 3.8 Deutsche may ask Hong Kong & Shanghai for a quote of eur against usd. HSBC
must then provide a bid and anfiask without knowing the direction of Deutsche's
possible trade; and if Deutsche replies with \I buy 10 million" then HSBC must sell
that quantity at the price they quoted.
Of course there are limits to the market makers' commitments to their quotes.
First, potential customers should decide almost immediately whether to buy (\mine"),
or to sell (\yours"), or not to deal; they cannot invoke a quote made, say, three min-
utes ago. Second, if the intended transaction exceeds a mutually-agreed level, laid
down in the prior credit agreement|say usd 25m|market makers can refuse. For
larger transactions, the trader asking for a quote should reveal immediately what the
size of the transaction will be. Third, the credit agreement also provides a limit to the
total amount of open contracts that can be outstanding between the two banks at any
moment; if the limit is reached, no more deals are allowed.
Transactions via binding two-way quotes are typically concluded on computers, via
kind of chatting windows (more grandly called \conversations"). Bank A's trader X
clicks his conversation window with trader Y at bank B|there may be up to 64 such
windows open at any given point of time|and might type in, for instance, PLS
EUR/USD, meaning \please provide a quote for the eur, in usd". Player A can also
mention the quantity, in millions. The millions are omitted; that is, 5 means ve million;
and the quantity bears on the currency in the denominator, traditionally the usd or the
gbp. B's trader may answer, for instance, 13-16 meaning that (the last two digits of)
her bid and ask are 13 and 16. (Traders never waste time by mentioning the leading
numbers: everybody knows what these are. Only the \small" numbers are
mentioned.) The rst party can let the o er lapse; if not, he answers MINE or YOURS,
mentions the quantity if not already indicated, and hits the SEND key. The deal's
done, and both traders now pass on the information to their \back o ce", which enters
the data into the information systems. The back o ces will also check with each other
to see whether the inputs match; with the logs of the conversations, disputes are of
course far less likely than before, when everything went by phone and when traders
handed down hand-scribbled \tickets" to the accountants who then checked with
each other via telexes. Voice deals still exist, but they are getting rarer.
31
Implications of Market Making for the Size of the Bid-ask Spread and the
Maximum Order Size
Normally, the lower the volume in a particular market, the higher the spread.
Also, during holidays, weekends, or lunch times, spreads widen. Spreads are
also higher in periods of uncertainty, including the open and close of the market
every day. Maximum order quantities for normal quotes follow a similar pattern: a
market maker is prepared to handle large lots if the market is liquid (thick) or the
volatility low.
All these phenomena are explained by the risk of market making. Notably, if a
customer has \hit" a market maker, the latter normally wants to get rid of that new
position quickly. But in a thin or volatile market, the price may already have moved
against the market maker before he or she was able to close out. Thus, in a thin or
volatile market, the market maker wants a bigger commission as compensation for
the risk, and puts a lower cap on the size of the deals that can be executed at this
spread. For the same reason, quotes for an unusually large position are wide too:
getting rid of a very large amount takes more time, and during that time anything
could happen. In the retail end of the market, in contrast, the spread increases for
smaller transactions. This is because 100 small transactions, each for usd 100,000,
cost more time and e ort than one big transaction of usd 10m.
For high-volume currencies like the usd/eur, the di erence between one market-
maker's own bid and ask is often as low as three basis points (in a quote of four or
ve digits, like 1.2345 or 0.9876), and the di erence between the best bid (across
all market makers) and the best ask (also across all market makers) may be just
two or one or, occasionally, zero basis points. See Section 3.3.2 for more
information on quoting behavior.
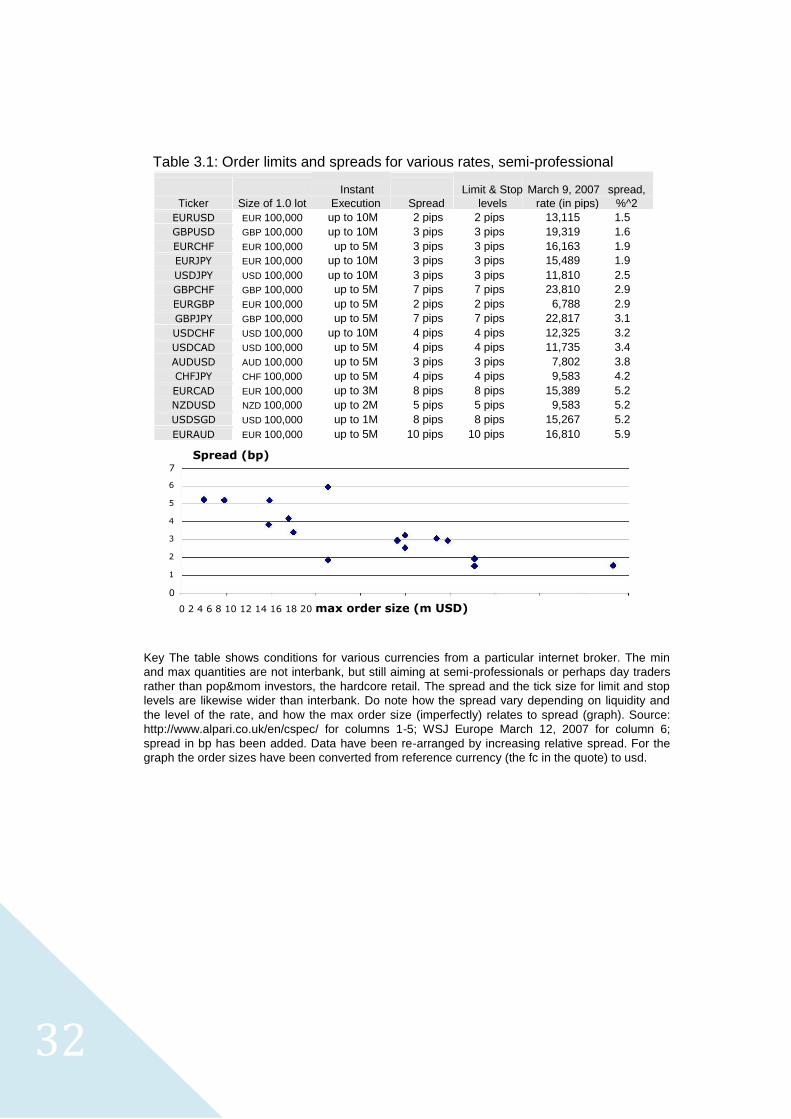
Table 3.1 shows the minimum and maximum amounts quoted by an internet
32
Table 3.1: Order limits and spreads for various rates, semi-professional
Instant
Limit & Stop March 9, 2007 spread,
Ticker Size of 1.0 lot Execution Spread levels rate (in pips) %^2
EURUSD EUR 100,000 up to 10M 2 pips 2 pips 13,115 1.5
GBPUSD GBP 100,000 up to 10M 3 pips 3 pips 19,319 1.6
EURCHF EUR 100,000 up to 5M 3 pips 3 pips 16,163 1.9
EURJPY EUR 100,000 up to 10M 3 pips 3 pips 15,489 1.9
USDJPY USD 100,000 up to 10M 3 pips 3 pips 11,810 2.5
GBPCHF GBP 100,000 up to 5M 7 pips 7 pips 23,810 2.9
EURGBP EUR 100,000 up to 5M 2 pips 2 pips 6,788 2.9
GBPJPY GBP 100,000 up to 5M 7 pips 7 pips 22,817 3.1
USDCHF USD 100,000 up to 10M 4 pips 4 pips 12,325 3.2
USDCAD USD 100,000 up to 5M 4 pips 4 pips 11,735 3.4
AUDUSD AUD 100,000 up to 5M 3 pips 3 pips 7,802 3.8
CHFJPY CHF 100,000 up to 5M 4 pips 4 pips 9,583 4.2
EURCAD EUR 100,000 up to 3M 8 pips 8 pips 15,389 5.2
NZDUSD NZD 100,000 up to 2M 5 pips 5 pips 9,583 5.2
USDSGD USD 100,000 up to 1M 8 pips 8 pips 15,267 5.2
EURAUD EUR 100,000 up to 5M 10 pips 10 pips 16,810 5.9
Spread (bp) 7
6
5
4 3
2
1
0 0 2 4 6 8 10 12 14 16 18 20 max order size (m USD)
Key The table shows conditions for various currencies from a particular internet broker. The min
and max quantities are not interbank, but still aiming at semi-professionals or perhaps day traders
rather than pop&mom investors, the hardcore retail. The spread and the tick size for limit and stop
levels are likewise wider than interbank. Do note how the spread vary depending on liquidity and
the level of the rate, and how the max order size (imperfectly) relates to spread (graph). Source:
http://www.alpari.co.uk/en/cspec/ for columns 1-5; WSJ Europe March 12, 2007 for column 6;
spread in bp has been added. Data have been re-arranged by increasing relative spread. For the
graph the order sizes have been converted from reference currency (the fc in the quote) to usd.
33
Auctioning of Through a Broking System
All the above was about market making. Beside these purely bilateral deals|the
successors to bilateral phone conversations|there nowadays are increasingly many
semi-multilateral deals. If a trader actively wants to buy, or sell, she may enter a limit
order into EBS' or Reuters' limit-order book rather than calling a number of market
makers or waiting until someone else calls her. This is comparable to you o ering,
say, a used car for sale on eBay rather than calling various car dealers or posting a
sign on your door and then waiting until someone rings your bell. For instance, bank
A may have eur 30m for sale and want at least usd/eur 1.3007 for them|an ask price.
The bank posts this info, for instance, on Reuters' \3000" system… Reuters' window,
at any moment, then shows the best bid across all \buy" limit orders, and the best
ask among all \sell" limit orders outstanding at that moment. For instance, on
Reuters' 3000 screen a line eur/usd 10-11 3 R means that the highest bid posted at
that very moment is 10, the lowest ask 11, and that the quantities for these limit
orders are, respectively, 3 and \a number exceeding
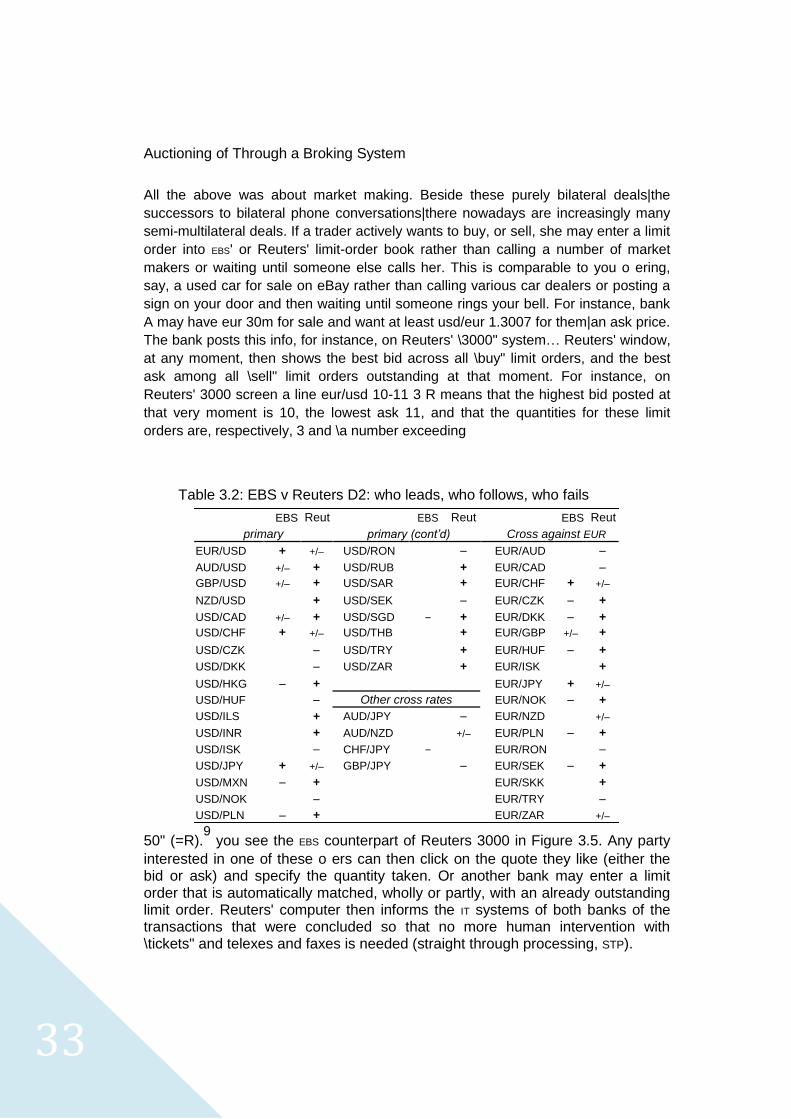
Table 3.2: EBS v Reuters D2: who leads, who follows, who fails
EBS Reut EBS Reut EBS Reut primary primary (cont’d) Cross against EUR
EUR/USD + +/– USD/RON – EUR/AUD – AUD/USD +/– + USD/RUB + EUR/CAD – GBP/USD +/– + USD/SAR + EUR/CHF + +/– NZD/USD + USD/SEK – EUR/CZK – + USD/CAD +/– + USD/SGD – + EUR/DKK – + USD/CHF + +/– USD/THB + EUR/GBP +/– + USD/CZK – USD/TRY + EUR/HUF – + USD/DKK – USD/ZAR + EUR/ISK + USD/HKG – + EUR/JPY + +/– USD/HUF – Other cross rates EUR/NOK – + USD/ILS + AUD/JPY – EUR/NZD +/– USD/INR + AUD/NZD +/– EUR/PLN – + USD/ISK – CHF/JPY – EUR/RON – USD/JPY + +/– GBP/JPY – EUR/SEK – + USD/MXN – + EUR/SKK + USD/NOK – EUR/TRY – USD/PLN – + EUR/ZAR +/–
50" (=R).9 you see the EBS counterpart of Reuters 3000 in Figure 3.5. Any party
interested in one of these o ers can then click on the quote they like (either the bid or ask) and specify the quantity taken. Or another bank may enter a limit order that is automatically matched, wholly or partly, with an already outstanding limit order. Reuters' computer then informs the IT systems of both banks of the transactions that were concluded so that no more human intervention with \tickets" and telexes and faxes is needed (straight through processing, STP).
34
The decision by an FX trader whether to use EBS or Reuters Dealing 3000 (aka D2)
is driven largely by currency pair…In practice, EBS is used mainly for eur/usd, usd/jpy,
eur/jpy, usd/chf and eur/chf, and Reuters D2 is used for all other interbank currency
pairs. Have a look at Table 3.2 to see who leads where. In these multilateral
electronic dealing systems, the spread for eur/usd is typically one pip, that is, one
hundredth of a usd cent. (Online currency brokers targeting private investors typically
o er a 2-pip spread; just feed \foreign exchange" into your web search engine to nd
these brokers.) For other exchange rates spreads are often wider.
Note that the advent of these multilateral systems has made the market
somewhat more like an organized market: there is centralization of buy and sell
orders into one matching mechanism, there are membership rules (not anyone
can log on into the program), rules about orders, etc. But the exchange market is
still fully private, whereas many exchanges are semi-o cial institutions that are
heavily regulated and need, at least, a license. Brokers
A last way of shopping around in foreign exchange markets is through currency
brokers. In the telephone-market days, brokers used to do the middleperson stu
that nowadays is handled via limit-order books: on behalf of a bank or company,
the broker would call many market makers and identify the best counterpart.
Roughly half of the transaction volume in the exchange market used to occur
through brokers. Nowadays, brokers are mainly used for unusually large
transactions or \structured" deals involving, say, options next to spot and/or
forward; for bread-and-butter deals their role is much reduced.
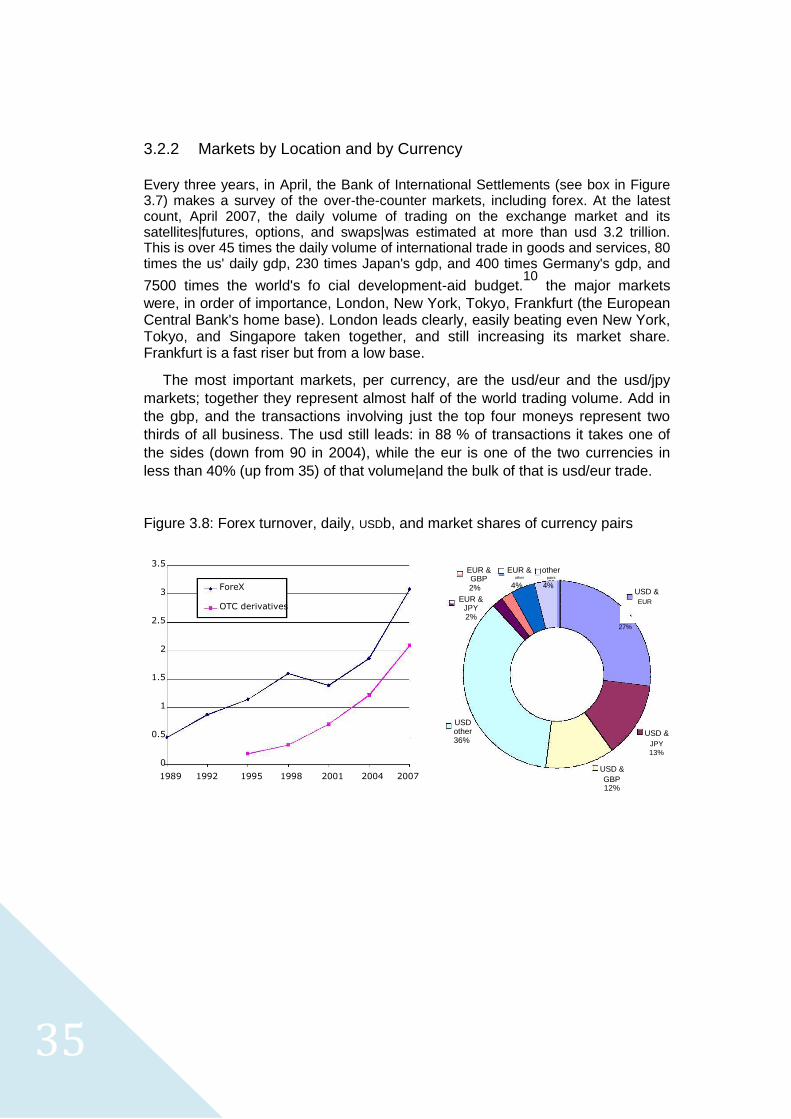
35
3.2.2 Markets by Location and by Currency
Every three years, in April, the Bank of International Settlements (see box in Figure 3.7) makes a survey of the over-the-counter markets, including forex. At the latest count, April 2007, the daily volume of trading on the exchange market and its satellites|futures, options, and swaps|was estimated at more than usd 3.2 trillion. This is over 45 times the daily volume of international trade in goods and services, 80 times the us' daily gdp, 230 times Japan's gdp, and 400 times Germany's gdp, and
7500 times the world's fo cial development-aid budget.10
the major markets
were, in order of importance, London, New York, Tokyo, Frankfurt (the European Central Bank's home base). London leads clearly, easily beating even New York, Tokyo, and Singapore taken together, and still increasing its market share. Frankfurt is a fast riser but from a low base.
The most important markets, per currency, are the usd/eur and the usd/jpy
markets; together they represent almost half of the world trading volume. Add in
the gbp, and the transactions involving just the top four moneys represent two
thirds of all business. The usd still leads: in 88 % of transactions it takes one of
the sides (down from 90 in 2004), while the eur is one of the two currencies in
less than 40% (up from 35) of that volume|and the bulk of that is usd/eur trade.
Figure 3.8: Forex turnover, daily, USDb, and market shares of currency pairs
3.5
3 ForeX
OTC derivatives
2.5
2
1.5
1
0.5
0
1989 1992 1995 1998 2001 2004 2007
EUR & EUR & other
GBP other pairs
4%
4%
2%
EUR &
JPY
2%
USD other 36%
USD & EUR
27%
USD & JPY
13% USD & GBP 12%
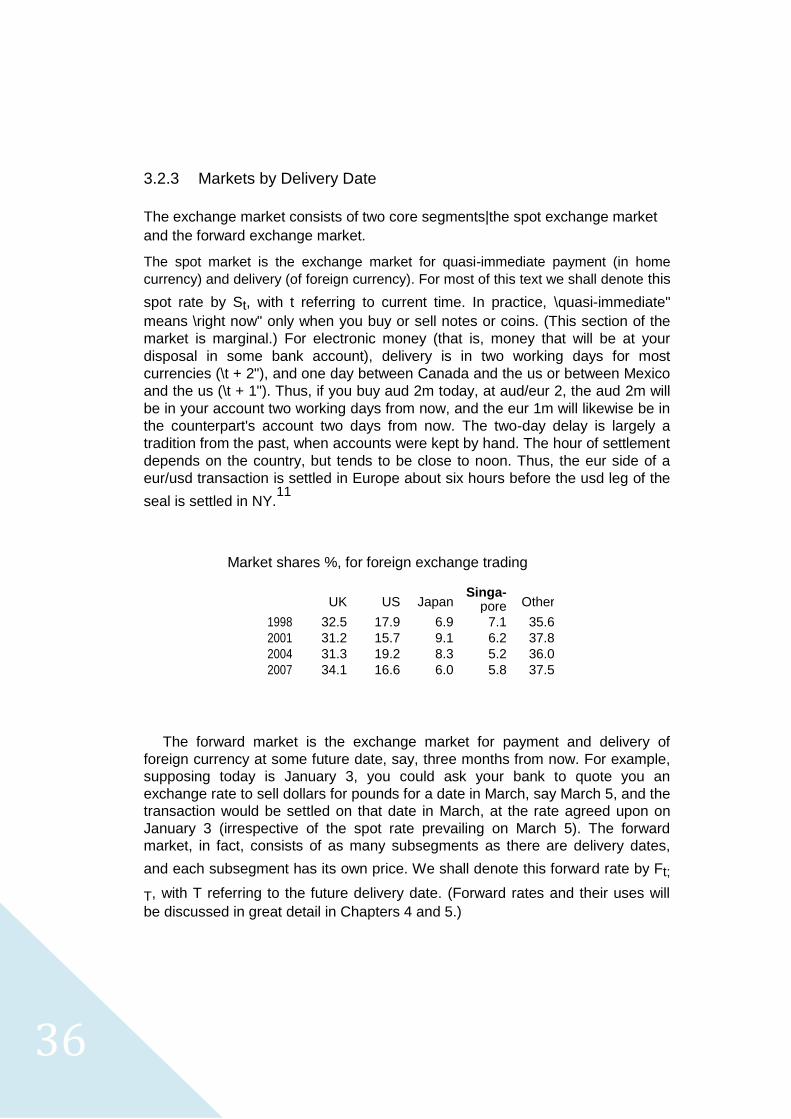
36
3.2.3 Markets by Delivery Date
The exchange market consists of two core segments|the spot exchange market
and the forward exchange market. The spot market is the exchange market for quasi-immediate payment (in home
currency) and delivery (of foreign currency). For most of this text we shall denote this
spot rate by St, with t referring to current time. In practice, \quasi-immediate"
means \right now" only when you buy or sell notes or coins. (This section of the
market is marginal.) For electronic money (that is, money that will be at your
disposal in some bank account), delivery is in two working days for most
currencies (\t + 2"), and one day between Canada and the us or between Mexico
and the us (\t + 1"). Thus, if you buy aud 2m today, at aud/eur 2, the aud 2m will
be in your account two working days from now, and the eur 1m will likewise be in
the counterpart's account two days from now. The two-day delay is largely a
tradition from the past, when accounts were kept by hand. The hour of settlement
depends on the country, but tends to be close to noon. Thus, the eur side of a
eur/usd transaction is settled in Europe about six hours before the usd leg of the
seal is settled in NY.11
Market shares %, for foreign exchange trading
UK US Japan
Singa- Other pore
1998 32.5 17.9 6.9 7.1 35.6
2001 31.2 15.7 9.1 6.2 37.8
2004 31.3 19.2 8.3 5.2 36.0
2007 34.1 16.6 6.0 5.8 37.5
The forward market is the exchange market for payment and delivery of
foreign currency at some future date, say, three months from now. For example,
supposing today is January 3, you could ask your bank to quote you an
exchange rate to sell dollars for pounds for a date in March, say March 5, and the
transaction would be settled on that date in March, at the rate agreed upon on
January 3 (irrespective of the spot rate prevailing on March 5). The forward
market, in fact, consists of as many subsegments as there are delivery dates,
and each subsegment has its own price. We shall denote this forward rate by Ft;
T, with T referring to the future delivery date. (Forward rates and their uses will
be discussed in great detail in Chapters 4 and 5.)
37
The most active forward markets are for 30, 90, 180, 270, and 360 days, but
nowadays bankers routinely quote rates up to ten years forward, and occasionally
even beyond ten years. Note that months are indicated as thirty days. In principle,
30-day contract is settled one month later than a spot contract, and a 180-day for-
ward contract is settled six months later than a spot contract|each time including
the two-day initial-delay convention.12
Example 3.9 A 180-day contract signed on March 2 works as follows. Assuming that March 4
is a working day, spot settlement would have been on March 4. For a 180-day
forward deal, the settlement date would be moved by six months to, in principle,
September 4, or the rst working day thereafter if that would have been a holiday.
The actual number of calendar days is at least (2+)184 days: there are four 31-
day months in the March-September window.
The above holds for standard dates, But you can always obtain a price for a
\broken date" (i.e. a non-standard maturity), too. For instance, on April 20 you
can stipulate settlement on November 19 or any other desired date.
Worldwide, spot transactions represent less than 50 percent of the total
foreign-exchange market volume. The forward market, together with the closely
related swap market (see Chapter 7), make up over 50 percent of the volume.
About 3 percent of total trade consists of currency-futures contracts (a variant of
forward contracts traded in secondary markets|see Chapter 6) and currency
options (see Chapter 8).
After this digression on the meaning of exchange rates and their relation to
real quantities, we now return to the operations of the spot exchange market. We
want to introduce one of the cornerstones of nance theory, the Law of One Price.
38
3.3 The Law of One Price for Spot Exchange Quotes
In frictionless markets, two securities that have identical cash ows must have the
same price. This is called the Law of One Price. There are two mechanisms that
enforce this law. The rst one is called arbitrage and the second one can be called
shopping around. We explain these two concepts below.
Suppose that two assets or portfolios with identical cash ows do not have the same
price. Then any holder of the overpriced asset could simultaneously sell this asset and
buy the cheaper asset instead, thus netting the price di erence without taking on any
additional risk. If one does not hold the overpriced asset, one could still take advantage of
this mispricing by short-selling13
the overpriced asset and covering this with the purchase
of the cheaper security. For example, you sell an overpriced
asset at 1.2135 and buy a perfect substitute at 1.2133, netting 0.0002 per unit
right now and no net cash ow at T . Such transactions are called arbitrage. These
arbitrage transactions generate an excess supply of the overpriced asset and an
excess demand for the underpriced asset, moving the prices of these two assets
towards each other. In frictionless markets, this process stops only when the two
prices are identical. Note that apart from the arbitrage gain, an arbitrage
transaction does not lead to a change in the net position of the arbitrageur; that
is, it yields a sure pro t without requiring any additional investment.
The second mechanism that enforces the Law of One Price is shopping around.
Here, in contrast to arbitrage, investors do intend to make particular changes in their
portfolios. Shopping around has to do with the fact that, when choosing between di
erent ways of making given investments, clever investors choose the most
advantageous way of doing so. Therefore, when choosing between assets with
identical cash ows, investors buy the underpriced assets rather than the more
expensive ones. Likewise, when choosing which assets to sell, investors sell the
overpriced ones rather than the ones that are relatively cheap. This demand for the
underpriced assets and supply of the overpriced ones again leads to a reduction in
the di erence between the prices of these two securities.
Although the arbitrage and shopping-around mechanisms both tend to enforce
the Law of One Price, there are two di erences between these mechanisms.
39
First, an arbitrage transaction is a round-trip transaction. That is, you buy and
sell, thus ending up with the same position with which you started. As arbitrage
requires a two-way transaction, it’s in uence stops as soon as the price di
erence is down to the sum of the transactions costs (buying and selling). In
contrast, in shopping around one wish to make a particular transaction,
And the issue is which of the two assets is cheaper to trade. As a result, the in uence of shopping around can go on as long as the price di erence exceeds the di erence of the two transactions costs.
Second, arbitrage is a strong force because it does not require any capital and
can, therefore, generate enormous volumes. In contrast, shopping around can
be a price-equalizing mechanism only if there are investors who wish to make
that particular transaction. This exogenously triggered volume, if any, is always
nite and may be exhausted before it has actually equalized the prices.
In this section, we apply these arguments to spot rates quoted for the same
currencies by di erent market makers. In a perfect exchange market with zero
spreads, arbitrage implies that the rate quoted by bank X must equal the rate
quoted by bank Y: there can be only one price for a given currency|otherwise,
there is an arbitrage opportunity.
Example 3.10
If Citibank quotes dem/usd 1.6500, while Morgan Chase quotes dem/usd
1.6501, both at zero spreads, then
there is an arbitrage opportunity. You can buy cheap usd from Citibank and
immediately sell to Morgan Chase, netting dem 0.0001 per usd. You will, of
course, make as many usd transactions as you can. So will everybody else.
The e ect of this massive trading is that either Citibank or Morgan Chase, or
both, will have to change their quotes so as to stop the rapid accumulation
of long or short positions. That is, situations with arbitrage pro ts are
inconsistent with equilibrium, and are eliminated very rapidly.
there is also a shopping-around pressure. All buyers of usd will buy from
Citibank, and all sellers will deal with Morgan Chase.
The only way to avoid such trading imbalances is if both banks quote the same rate.
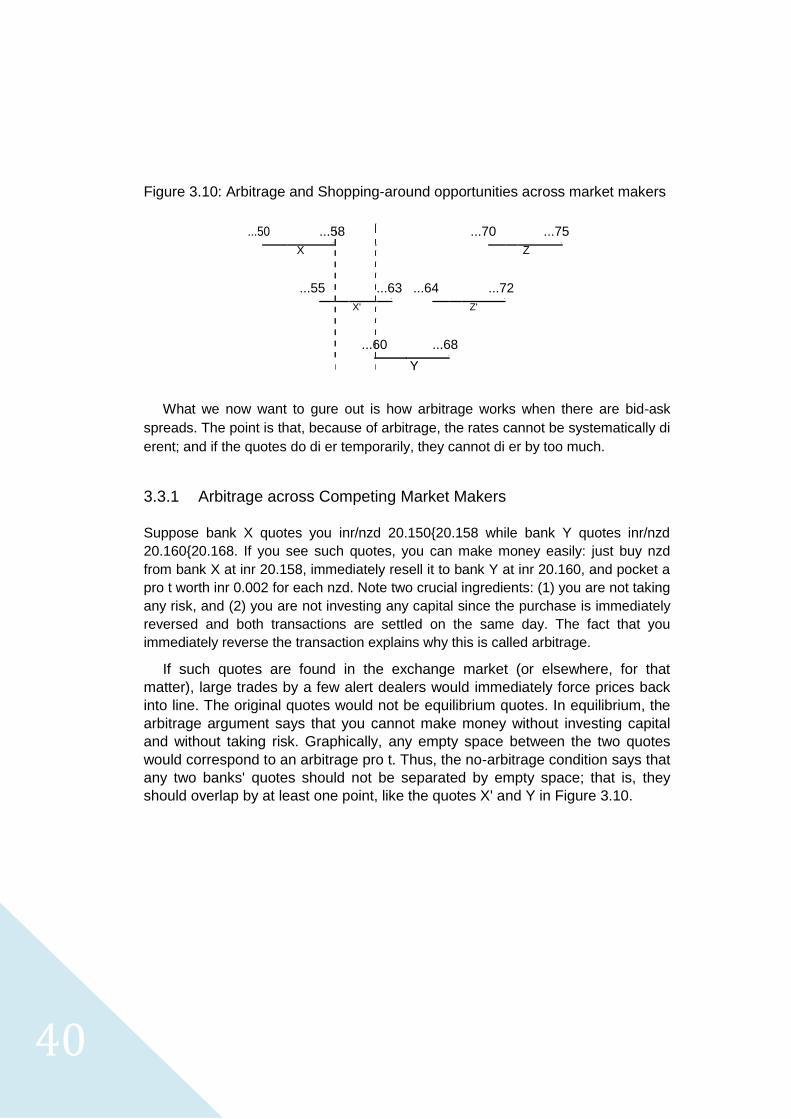
40
Figure 3.10: Arbitrage and Shopping-around opportunities across market makers
...50 ...58 ...70 ...75
- -
X Z
...55
...63 ...64
...72
- -
X'
Z'
...60
...68
-
Y
What we now want to gure out is how arbitrage works when there are bid-ask
spreads. The point is that, because of arbitrage, the rates cannot be systematically di
erent; and if the quotes do di er temporarily, they cannot di er by too much. 3.3.1 Arbitrage across Competing Market Makers
Suppose bank X quotes you inr/nzd 20.150{20.158 while bank Y quotes inr/nzd
20.160{20.168. If you see such quotes, you can make money easily: just buy nzd
from bank X at inr 20.158, immediately resell it to bank Y at inr 20.160, and pocket a
pro t worth inr 0.002 for each nzd. Note two crucial ingredients: (1) you are not taking
any risk, and (2) you are not investing any capital since the purchase is immediately
reversed and both transactions are settled on the same day. The fact that you
immediately reverse the transaction explains why this is called arbitrage.
If such quotes are found in the exchange market (or elsewhere, for that
matter), large trades by a few alert dealers would immediately force prices back
into line. The original quotes would not be equilibrium quotes. In equilibrium, the
arbitrage argument says that you cannot make money without investing capital
and without taking risk. Graphically, any empty space between the two quotes
would correspond to an arbitrage pro t. Thus, the no-arbitrage condition says that
any two banks' quotes should not be separated by empty space; that is, they
should overlap by at least one point, like the quotes X' and Y in Figure 3.10.
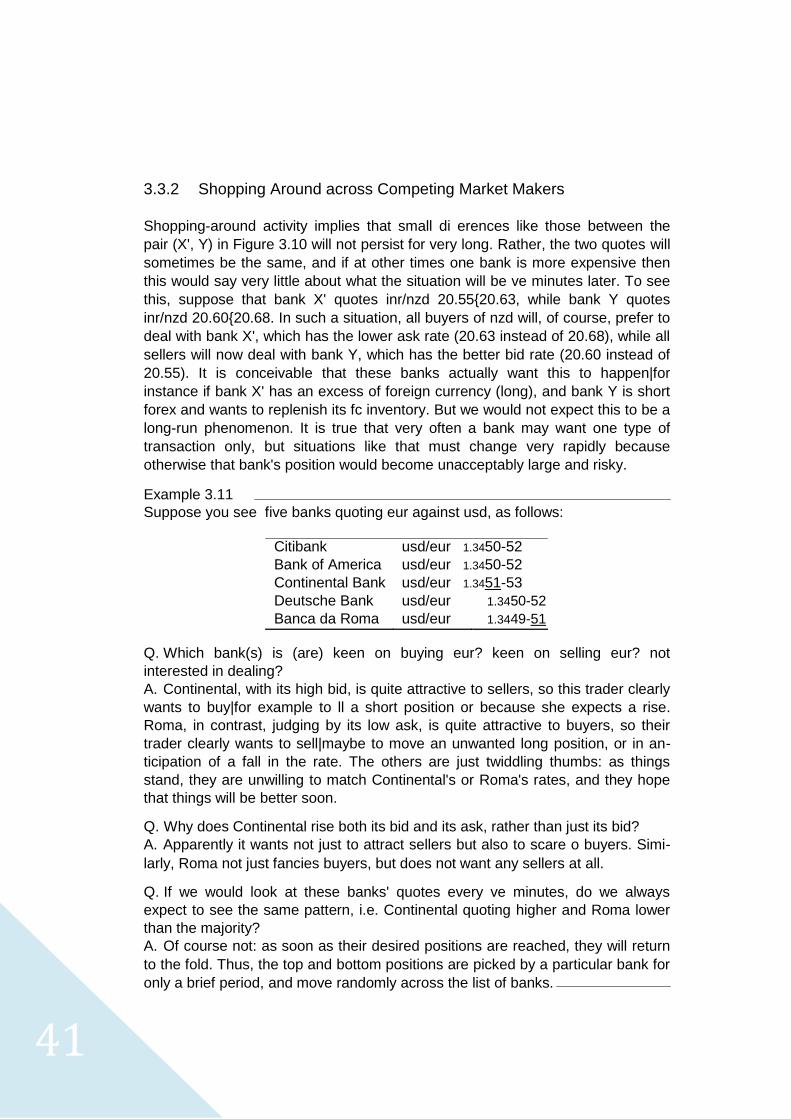
41
3.3.2 Shopping Around across Competing Market Makers
Shopping-around activity implies that small di erences like those between the
pair (X', Y) in Figure 3.10 will not persist for very long. Rather, the two quotes will
sometimes be the same, and if at other times one bank is more expensive then
this would say very little about what the situation will be ve minutes later. To see
this, suppose that bank X' quotes inr/nzd 20.55{20.63, while bank Y quotes
inr/nzd 20.60{20.68. In such a situation, all buyers of nzd will, of course, prefer to
deal with bank X', which has the lower ask rate (20.63 instead of 20.68), while all
sellers will now deal with bank Y, which has the better bid rate (20.60 instead of
20.55). It is conceivable that these banks actually want this to happen|for
instance if bank X' has an excess of foreign currency (long), and bank Y is short
forex and wants to replenish its fc inventory. But we would not expect this to be a
long-run phenomenon. It is true that very often a bank may want one type of
transaction only, but situations like that must change very rapidly because
otherwise that bank's position would become unacceptably large and risky. Example 3.11 Suppose you see five banks quoting eur against usd, as follows:
Citibank usd/eur 1.3450-52 Bank of America usd/eur 1.3450-52 Continental Bank usd/eur 1.3451-53 Deutsche Bank usd/eur 1.3450-52 Banca da Roma usd/eur 1.3449-51
Q. Which bank(s) is (are) keen on buying eur? keen on selling eur? not
interested in dealing?
A. Continental, with its high bid, is quite attractive to sellers, so this trader clearly
wants to buy|for example to ll a short position or because she expects a rise.
Roma, in contrast, judging by its low ask, is quite attractive to buyers, so their
trader clearly wants to sell|maybe to move an unwanted long position, or in an-
ticipation of a fall in the rate. The others are just twiddling thumbs: as things
stand, they are unwilling to match Continental's or Roma's rates, and they hope
that things will be better soon. Q. Why does Continental rise both its bid and its ask, rather than just its bid? A. Apparently it wants not just to attract sellers but also to scare o buyers. Simi-
larly, Roma not just fancies buyers, but does not want any sellers at all. Q. If we would look at these banks' quotes every ve minutes, do we always
expect to see the same pattern, i.e. Continental quoting higher and Roma lower
than the majority?
A. Of course not: as soon as their desired positions are reached, they will return
to the fold. Thus, the top and bottom positions are picked by a particular bank for
only a brief period, and move randomly across the list of banks.
42
3.3.3 Triangular Arbitrage
Now that we know how exchange rates are quoted and what arbitrage means, let us
look at the relationships that exist between spot rates quoted in various currencies.
Convert gbp into Aussies, one gbp should buy 1.5 1.6 = 2.4 aud. With this
aud/gbp rate and assuming a zero spread,
Nobody can make a free-lunch pro t by any sequence of transactions, and
Everyone is indifierent between direct conversions between two currencies
and indirect, triangular transactions.
Below, we see what the implications of arbitrage and shopping around are
when there are bid-ask spreads. In order to simplify matters, we shall rst show
how to compute the implied rates from an indirect route. We shall call these
implied rates the synthetic rates. Having identi ed these synthetic rates, we can
then invoke the same mechanisms that enforce the Law of One Price as when
we studied the relationship between the quotes made by various market makers. Computing Synthetic Cross-Rates
In general, a synthetic version of a contract is a combination of two or more other
transactions that achieves the same objective as the original contract. That is,
the combination of the two or more contracts replicates the outcome of the
original contract. We shall use the notion of replication repeatedly in this
textbook. For now, consider a simple spot transaction: a Japanese investor
wants to convert jpy into gbp.
The investor can use the direct market and buy gbp against jpy. We will call
this the original contract.
Alternatively, the investor can rst buy usd with jpy, and then immediately
exchange the usd for gbp. This is a combination of two contracts. It
replicates the original contract since, by combining the two transactions, the
investor initially pays jpy, and ultimately ends up with gbp. Thus, this is a
synthetic way of achieving the original transaction.
Note that the synthetic contract may be the more e cient way to deal, since the
usd market has a lot of volume (or depth) in every country, and therefore has
smaller spreads. (This is why the usd is involved in 90 percent of the trades). Let
us see how the synthetic jpy/gbp rates can be computed.
Example 3.13 What are the synthetic jpy/gbp rates, bid and ask, if the quotes are jpy/usd
101.07 - 101.20 and usd/gbp 1.3840 -1.3850? Step 1: multiply or divide? The dimension of the rate we are looking for is
43
jpy/gbp. Because the dimensions of the two quotes given to us are usd/gbp and
jpy/usd, the way to obtain the synthetic rate is to multiply the rates, as follows:
[jpy/gbp ] = [jpy/usd ] [usd/gbp ] (3.5) Note that on the right-hand side of the equation, the usd in the denominator of
the rst quote cancels out with the usd in the numerator of the second quote,
leaving us with the desired jpy/gbp number. Step 2: bids or asks? The rst quote is the natural quote for a Japanese agent, the
second one takes the usd as the base. Consider the synthetic ask (relevant for
buying gbp from a jpy position). Starting from jpy we buy usd, so we need the
ask; and with the usd we buy gbp, so we again need ask. Thus,
Synthetic St; askjpy=gbp
= St; askjpy=usd
St; askusd=gbp
(3.6) = 101:20 1:3850 = 140:16
By a similar argument, we can obtain the rate at which we can synthetically sell
gbp into usd and these into jpy:
Synthetic St; bidjpy=gbp
= St; bidjpy=usd
St; bidusd=gbp
(3.7) = 101:07 1:3840 = 139:88
This example is the rst instance of the Law of the Worst Possible Combination
or the Rip-O Rule. You already know that for any single transaction, the bank
gives you the worst rate from your point of view (this is how the bank makes
money). It follows that if you make a sequence of transactions, you will inevitably
get the worst possible cumulative outcome. This Law of the Worst Possible
Combination is the rst Fundamental Law of Real-world Capital Markets. In our
example, this law works as follows:
Note that we are computing a product. The synthetic ask rate for the gbp
(the higher rate, the one at which you buy) turns out to be the highest
possible product of the two exchange rates: we multiply the two high rates,
ask times ask. Note nally that, if the purpose is to buy forex, then a high
rate is also an unfavorable rate. In short, we buy at the worst rate, the
highest possible combined rate.
We see that, likewise, the synthetic bid rate for the gbp (the lower rate, the
one at which you sell) turns out to be the lowest possible product of the two
exchange rates: we multiply the two low rates, bid times bid. Note also that,
if the purpose is to sell forex, then a low rate is also an unfavorable rate. In
short, we sell at the worst rate, the lowest possible combined rate.
Let us look at another example. The data are the same except that the British
quotes now are directed not indirect.
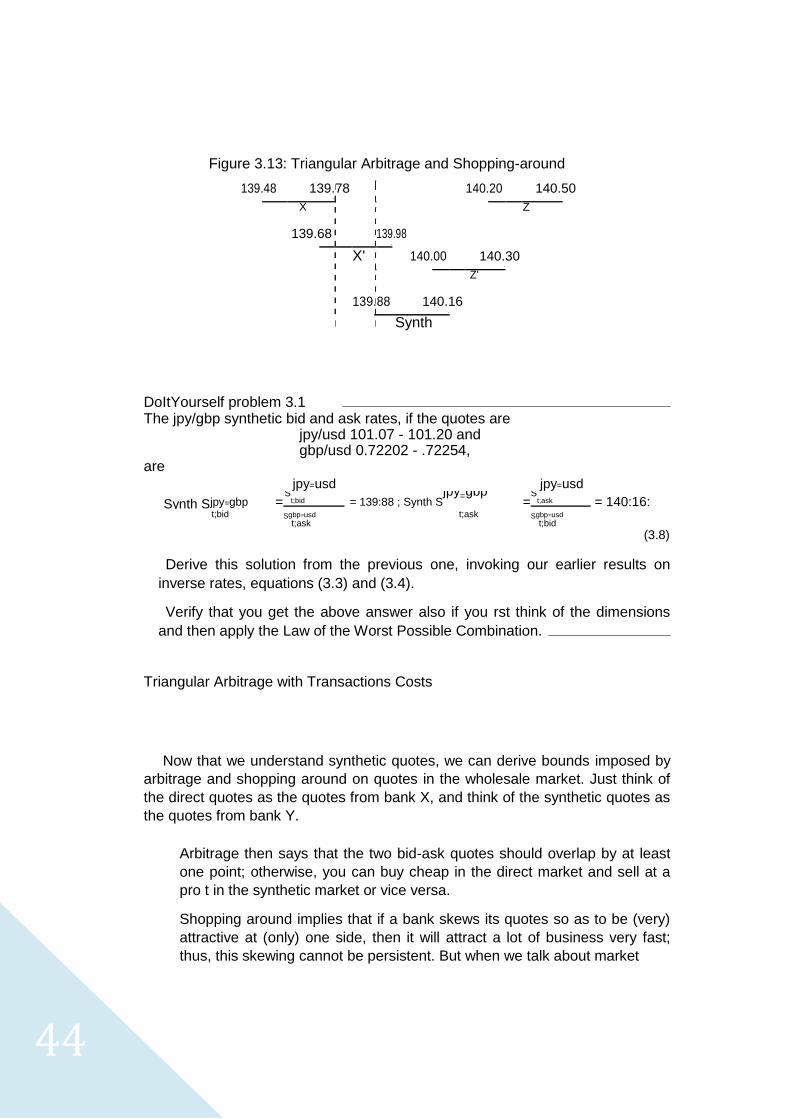
44
Figure 3.13: Triangular Arbitrage and Shopping-around
139.48 139.78 140.20 140.50
- -
X Z
139.68
139.98
-
X'
140.00
140.30
-
Z'
139.88
140.16
-
Synth
DoItYourself problem 3.1 The jpy/gbp synthetic bid and ask rates, if the quotes are
jpy/usd 101.07 - 101.20 and gbp/usd 0.72202 - .72254,
are jpy=usd jpy=usd
Synth Sjpy=gbp = S
t;bid = 139:88 ; Synth Sjpy=gbp
= S
t;ask = 140:16:
t;bid Sgbp=usd t;ask Sgbp=usd
t;ask t;bid
(3.8)
Derive this solution from the previous one, invoking our earlier results on
inverse rates, equations (3.3) and (3.4).
Verify that you get the above answer also if you rst think of the dimensions
and then apply the Law of the Worst Possible Combination. Triangular Arbitrage with Transactions Costs
Now that we understand synthetic quotes, we can derive bounds imposed by
arbitrage and shopping around on quotes in the wholesale market. Just think of
the direct quotes as the quotes from bank X, and think of the synthetic quotes as
the quotes from bank Y.
Arbitrage then says that the two bid-ask quotes should overlap by at least
one point; otherwise, you can buy cheap in the direct market and sell at a
pro t in the synthetic market or vice versa.
Shopping around implies that if a bank skews its quotes so as to be (very)
attractive at (only) one side, then it will attract a lot of business very fast;
thus, this skewing cannot be persistent. But when we talk about market
45
quotes (the best bid, and the best ask, across all market makers) rather than the
quotes by an individual dealer, the force is even stronger. Individually, a market
maker may very well want to make one of its quotes unappealing for some time, as
we saw. But if there are many market makers it would be quite unlikely that, across
all market makers, even the best direct quote would still be unappealing against the
synthetic one, for that would mean that among all the competing market makers
there is not a single one that is interested in that particular type of deal. Thus,
instances where a direct quote is dominated by a synthetic one at one side should be
rare and short-lived, and the more so the higher the number of market makers.
The above assumes that the direct market has enough volume. Indeed, with a
very thin market, the spread required to make market-making sustainable may
be too wide to allow the direct market to compete on both sides with the
synthetic market via a heavily-traded vehicle currency (like the usd or the eur).
The volume and depth of the wholesale market for dollars relative to almost
any other currency is so large (and the spreads, therefore, so small) that a
substantial part of the nondollar transactions are, in fact, still executed by way
of the dollar. Direct cross-deals have emerged as of the mid 1980s only, and
are still con ned to heavy-volume currency pairs.
As a nal note, in the retail markets most customers have no direct access to cross
rates, and bank clerks occasionally compute cross rates even where the actual
transaction could be executed very di erently. A Japanese bank, for instance, would
post quotes for jpy/gbp and jpy/eur rates for its retail customers, but typically not for
gbp/eur. Should a retail customer sell eur and buy gbp, the clerk would actually
compute the synthetic rates we just derived, as if the customer rst went from eur to
jpy and then to gbp, even if in the bank's trading room the actual conversion may be
done directly from eur into gbp. Unless you have an account with a Euroland or uk
bank, or enough clout with your home bank, you would have little choice but to
accept the large spread implied by such synthetic rates.
This nishes our tour of the workings of the exchange markets... We continue
the chapter with some wise advice on the merits and shortcomings of using
exchange rates to translate foreign amounts of money. This brings us to the twin
concepts of \ppp" and \real" exchange rates, key issues to understand the
relevance of currency risk.
46
3.4 Translating FC Figures: Nominal rates, PPP rates, and Deviations from PPP
Obviously, when you exchange a fc amount into hc or vice versa, you will use the
exchange rate relevant at the moment. But actual transactions like this are not the
sole conceivable purpose for such a conversion; rather, the purpose may just be
translation, that is, to have an idea what a fc amount means in a unit that you are
more familiar with, the hc. For instance, if a resident of Vanuatu tells you she's
making 1m Vatus a month, most people would not have a clue whether they
should be impressed or not. In a case like this we don't want to actually
exchange any Vatus into our own hc; we'd simply like to translate a fc number
into a (to us) more meaningful unit.
The most commonly used solution is to resort to the market exchange rate to
make the translation. The result is an improvement on the fc amount in the sense
that you know what you would be able to do with this converted amount if you
consumed it here, at home. But your objective may be to have a feel for what the
fc amount would mean to a resident of the foreign country, that is, if the money is
consumed there, not here. Both questions|the purchasing power of some amount
of money in your home country, and the purchasing power abroad|provide the
same answer if prices abroad and at home are on average the same once they
have been converted into the same currency. This situation is known as
(Absolute) Purchasing Power parity (APPP). As we will illustrate below, APPP does
not hold in reality, with deviations becoming more important the more di erent the
two countries are in terms of location or economic development. 3.4.1 The PPP rate
To have a more reliable feel for what a given amount of foreign money really
means locally, one needs for each country a number called the price level, which
we denote by (at home, and in hc), and (abroad, and in fc), respectively. A price
level is an absolute amount of currency|not an index number|needed to buy a
standard consumption bundle. Computing price levels for di erent countries
makes sense only if the consumption bundle whose cost is being measured is
the same across countries. In a simple economy where fast food would be the
only commodity, the bundle may be one soda, one burger, one fries (medium), a
salad and a co ee|let's call this the BigMeal. We simply jot down the prices of the
components abroad and at home, and tot them up into price levels for BigMeals.
Any di erences in price levels, after conversion into a common currency,
would make a simple conversion of a fc amount into the hc rather misleading if
translated price levels are very di ferent:
47
Example 3.14 You often chat with a friend living in the Republic of Freedonia where, since the
presidency of Groucho Marx, the currency is the Freedonian Crown (fdk). Let St
= usd/fdk 0.010. You earn usd 50 per unit of time, your Freedonian friend 2000 fdk. What does that income really mean if the standard consumption bundle, our BigMeal, costs usd 5 here and fdk 250 in Freedonia?
At the spot rate of usd/fdk 0.010, your friend seems to earn only 2000 0;
010 = usd 20, suggesting that she is 60 percent worse of than you.
But this ignores price di erences. What you "really" earn is 50/5 = 10
Big-Meals, while your friend makes 2000/250 = 8 BigMeals. That is,
your friend is "really" almost as well o as you are. What's the PPP rate?
To buy 8 BigMeals at home, you would need 8 5 = usd 40. So one way to
summarize the situation is that fdk 2000 means as much to your friend
abroad as usd 40 means here, to you… The usd 40 is called the
translation of fdk 2000 using the Purchasing Power Parity rate rather than
the nominal rate, and the implied ppp rate is the 40/2000 = 0.020 usd per
fdk, the ratio of the two price levels.
Let's generalize. Suppose you want to have a feel for what a fc amount
Y \really" means to a foreigner. The question can be made more precise
as follows: ^ ^
Give me a hc amount Y such that its purchasing power here, Y = t, equals the
purchasing power abroad of the original amount, Y = t :
^ Y^ Y
Find Y such that t = t
) Y^
=
t Y (3.9)
t
def t
= S^tppp Y ; where S^t
ppp = (3.10)
t
So we can always compute the ppp rate as the ratio of the two price levels. For example, your friend's foreign amount (fdk 2000) could have been translated at the ppp rate, 5/250 = 0.020, which would have told you immediately that her income buys as much (in Freedonia) as usd 40 buys here. Example 3.15 End 2006, the CIA Factbook
(http://www.cia.gov/cia/publications/factbook/geos/rs.html) assessed Russia's
2005 gdp at 1.589 usd trillion using the ppp rate, and at 740.7 billion using the
nominal o cial rate. What is the explanation: are prices lower in Russia than in
the us, or is it the inverse?
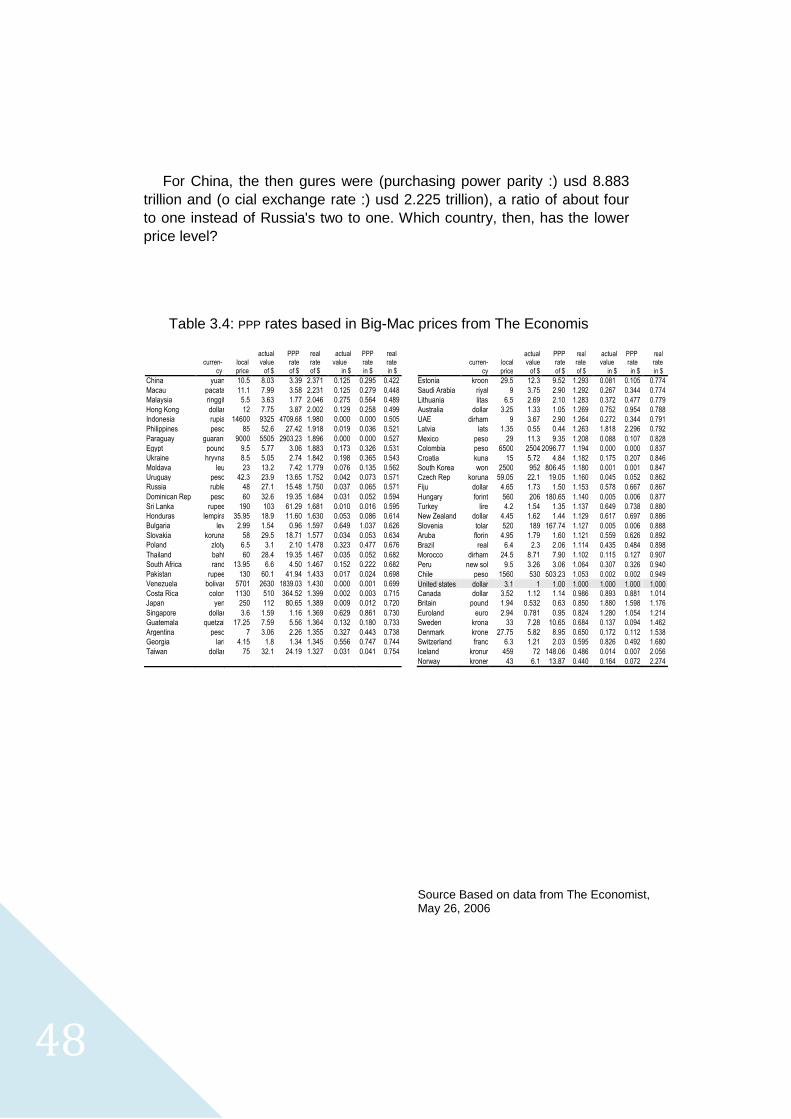
48
For China, the then gures were (purchasing power parity :) usd 8.883
trillion and (o cial exchange rate :) usd 2.225 trillion), a ratio of about four
to one instead of Russia's two to one. Which country, then, has the lower
price level?
Table 3.4: PPP rates based in Big-Mac prices from The Economis
actual PPP real actual PPP real curren- local value rate rate value rate rate cy price of $ of $ of $ in $ in $ in $ China yuan 10.5 8.03 3.39 2.371 0.125 0.295 0.422 Macau pacata 11.1 7.99 3.58 2.231 0.125 0.279 0.448 Malaysia ringgit 5.5 3.63 1.77 2.046 0.275 0.564 0.489 Hong Kong dollar 12 7.75 3.87 2.002 0.129 0.258 0.499 Indonesia rupia 14600 9325 4709.68 1.980 0.000 0.000 0.505 Philippines peso 85 52.6 27.42 1.918 0.019 0.036 0.521 Paraguay guarani 9000 5505 2903.23 1.896 0.000 0.000 0.527 Egypt pound 9.5 5.77 3.06 1.883 0.173 0.326 0.531 Ukraine hryvna 8.5 5.05 2.74 1.842 0.198 0.365 0.543 Moldava leu 23 13.2 7.42 1.779 0.076 0.135 0.562 Uruguay peso 42.3 23.9 13.65 1.752 0.042 0.073 0.571 Russia ruble 48 27.1 15.48 1.750 0.037 0.065 0.571 Dominican Rep peso 60 32.6 19.35 1.684 0.031 0.052 0.594 Sri Lanka rupee 190 103 61.29 1.681 0.010 0.016 0.595 Honduras lempira 35.95 18.9 11.60 1.630 0.053 0.086 0.614 Bulgaria lev 2.99 1.54 0.96 1.597 0.649 1.037 0.626 Slovakia koruna 58 29.5 18.71 1.577 0.034 0.053 0.634 Poland zloty 6.5 3.1 2.10 1.478 0.323 0.477 0.676 Thailand baht 60 28.4 19.35 1.467 0.035 0.052 0.682 South Africa rand 13.95 6.6 4.50 1.467 0.152 0.222 0.682 Pakistan rupee 130 60.1 41.94 1.433 0.017 0.024 0.698 Venezuela bolivar 5701 2630 1839.03 1.430 0.000 0.001 0.699 Costa Rica colon 1130 510 364.52 1.399 0.002 0.003 0.715 Japan yen 250 112 80.65 1.389 0.009 0.012 0.720 Singapore dollar 3.6 1.59 1.16 1.369 0.629 0.861 0.730 Guatemala quetzal 17.25 7.59 5.56 1.364 0.132 0.180 0.733 Argentina peso 7 3.06 2.26 1.355 0.327 0.443 0.738 Georgia lari 4.15 1.8 1.34 1.345 0.556 0.747 0.744 Taiwan dollar 75 32.1 24.19 1.327 0.031 0.041 0.754
actual PPP real actual PPP real curren- local value rate rate value rate rate cy price of $ of $ of $ in $ in $ in $ Estonia kroon 29.5 12.3 9.52 1.293 0.081 0.105 0.774 Saudi Arabia riyal 9 3.75 2.90 1.292 0.267 0.344 0.774 Lithuania litas 6.5 2.69 2.10 1.283 0.372 0.477 0.779 Australia dollar 3.25 1.33 1.05 1.269 0.752 0.954 0.788 UAE dirham 9 3.67 2.90 1.264 0.272 0.344 0.791 Latvia lats 1.35 0.55 0.44 1.263 1.818 2.296 0.792 Mexico peso 29 11.3 9.35 1.208 0.088 0.107 0.828 Colombia peso 6500 2504 2096.77 1.194 0.000 0.000 0.837 Croatia kuna 15 5.72 4.84 1.182 0.175 0.207 0.846 South Korea won 2500 952 806.45 1.180 0.001 0.001 0.847 Czech Rep koruna 59.05 22.1 19.05 1.160 0.045 0.052 0.862 Fiju dollar 4.65 1.73 1.50 1.153 0.578 0.667 0.867 Hungary forint 560 206 180.65 1.140 0.005 0.006 0.877 Turkey lire 4.2 1.54 1.35 1.137 0.649 0.738 0.880 New Zealand dollar 4.45 1.62 1.44 1.129 0.617 0.697 0.886 Slovenia tolar 520 189 167.74 1.127 0.005 0.006 0.888 Aruba florin 4.95 1.79 1.60 1.121 0.559 0.626 0.892 Brazil real 6.4 2.3 2.06 1.114 0.435 0.484 0.898 Morocco dirham 24.5 8.71 7.90 1.102 0.115 0.127 0.907 Peru new sol 9.5 3.26 3.06 1.064 0.307 0.326 0.940 Chile peso 1560 530 503.23 1.053 0.002 0.002 0.949 United states dollar 3.1 1 1.00 1.000 1.000 1.000 1.000 Canada dollar 3.52 1.12 1.14 0.986 0.893 0.881 1.014 Britain pound 1.94 0.532 0.63 0.850 1.880 1.598 1.176 Euroland euro 2.94 0.781 0.95 0.824 1.280 1.054 1.214 Sweden krona 33 7.28 10.65 0.684 0.137 0.094 1.462 Denmark krone 27.75 5.82 8.95 0.650 0.172 0.112 1.538 Switzerland franc 6.3 1.21 2.03 0.595 0.826 0.492 1.680 Iceland kronur 459 72 148.06 0.486 0.014 0.007 2.056 Norway kroner 43 6.1 13.87 0.440 0.164 0.072 2.274 Source Based on data from The Economist, May 26, 2006
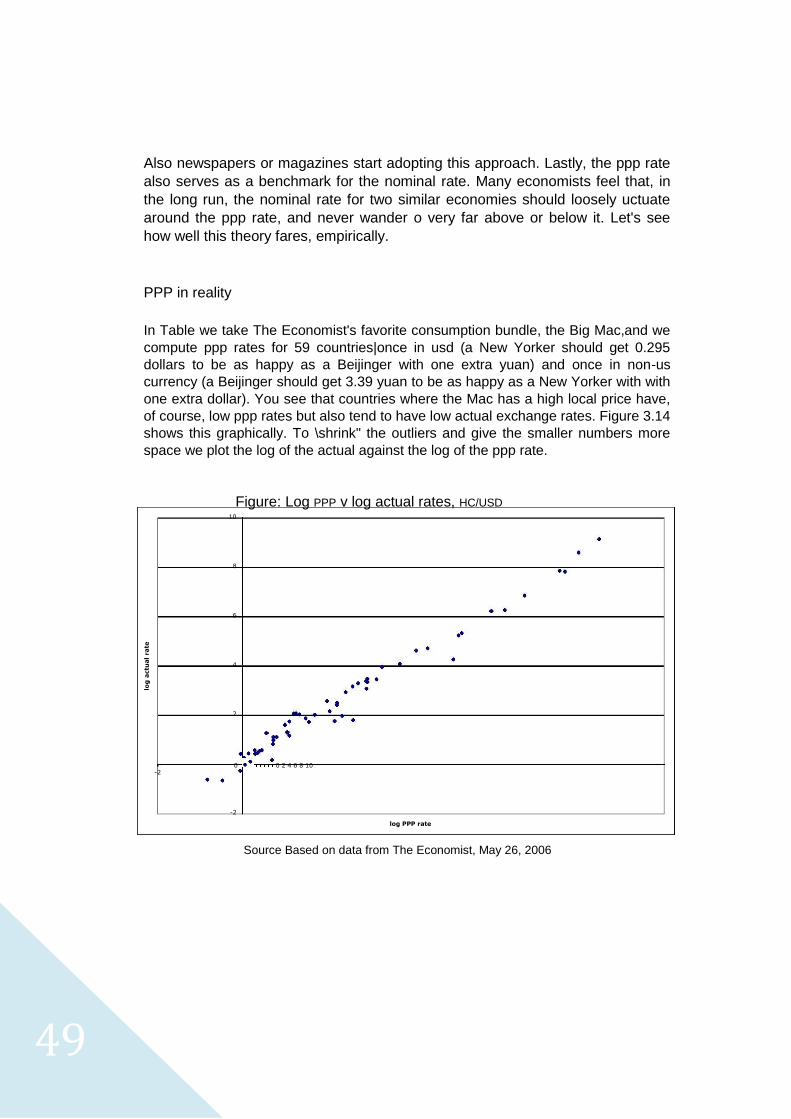
49
Also newspapers or magazines start adopting this approach. Lastly, the ppp rate
also serves as a benchmark for the nominal rate. Many economists feel that, in
the long run, the nominal rate for two similar economies should loosely uctuate
around the ppp rate, and never wander o very far above or below it. Let's see
how well this theory fares, empirically.
PPP in reality
In Table we take The Economist's favorite consumption bundle, the Big Mac,and we
compute ppp rates for 59 countries|once in usd (a New Yorker should get 0.295
dollars to be as happy as a Beijinger with one extra yuan) and once in non-us
currency (a Beijinger should get 3.39 yuan to be as happy as a New Yorker with with
one extra dollar). You see that countries where the Mac has a high local price have,
of course, low ppp rates but also tend to have low actual exchange rates. Figure 3.14
shows this graphically. To \shrink" the outliers and give the smaller numbers more
space we plot the log of the actual against the log of the ppp rate. Figure: Log PPP v log actual rates, HC/USD
log
actu
al
rate
-2
10 8 6 4 2
0 0 2 4 6 8 10
-2
log PPP rate Source Based on data from The Economist, May 26, 2006
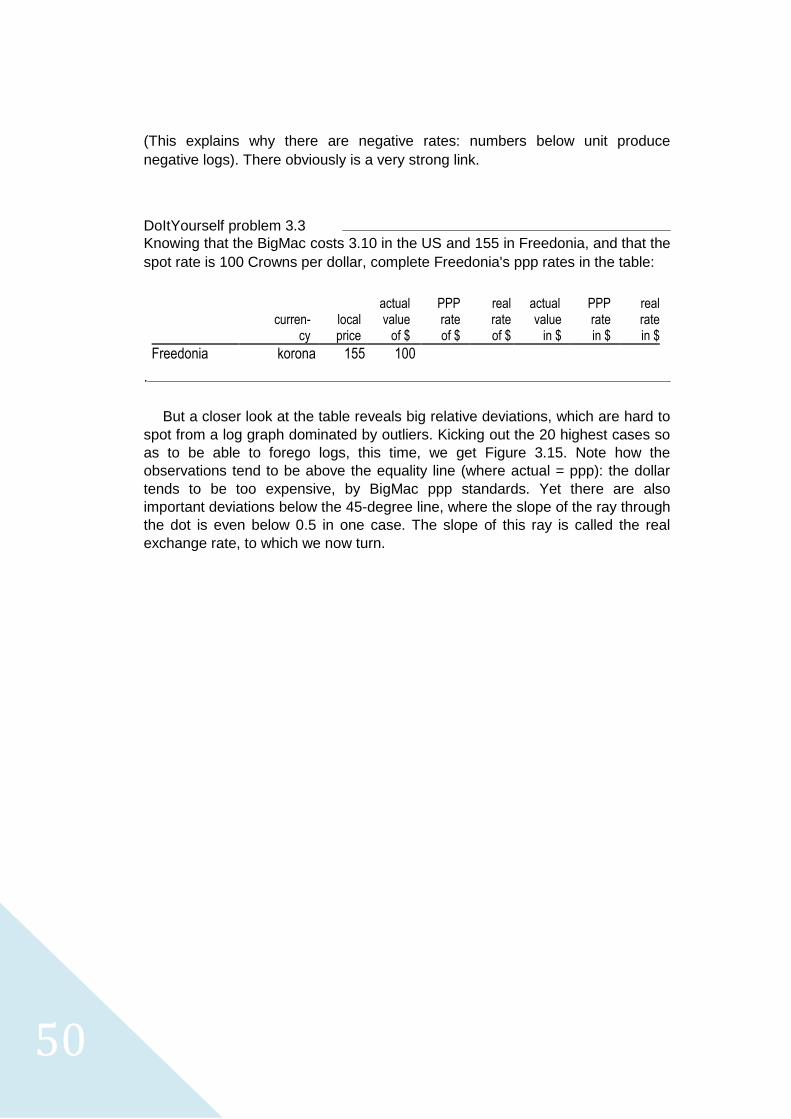
50
(This explains why there are negative rates: numbers below unit produce
negative logs). There obviously is a very strong link.
DoItYourself problem 3.3 Knowing that the BigMac costs 3.10 in the US and 155 in Freedonia, and that the
spot rate is 100 Crowns per dollar, complete Freedonia's ppp rates in the table:
actual PPP real actual PPP real curren- local value rate rate value rate rate cy price of $ of $ of $ in $ in $ in $
Freedonia korona 155 100 .
But a closer look at the table reveals big relative deviations, which are hard to
spot from a log graph dominated by outliers. Kicking out the 20 highest cases so
as to be able to forego logs, this time, we get Figure 3.15. Note how the
observations tend to be above the equality line (where actual = ppp): the dollar
tends to be too expensive, by BigMac ppp standards. Yet there are also
important deviations below the 45-degree line, where the slope of the ray through
the dot is even below 0.5 in one case. The slope of this ray is called the real
exchange rate, to which we now turn.
51
3.4.2 Commodity Price Parity
A concept used in textbooks is Commodity Price Parity (CPP). It is said to hold
when translated prices for an individual good are equalized across two countries:
CPP holds if Pj;t = St Pj;t;
With j referring to an individual good, and Pj (Pj) referring to its price at home, in
hc (abroad, in fc). In fact, all the Big Mac evidence shown thus far is about CPP rather than PPP, a distinction that The Economist tends to gloss over.
CPP would hold if trading were costless and instantaneous. Obviously, in reality it
does not work across the board; for commodities it is not too bad an approximation
(within the bounds created by transportation costs and the like), but for consumer
goods it is essentially a joke.
PPP in the true sense|i.e. for a bundle of goods|would clearly hold if CPP held for
every individual good, or if deviations from CPP washed out after averaging across
many goods. As we have seen, this is not really the case; apparently, too many
deviations from CPP turn out to be in the same direction, suggesting there is a
common force behind them. Forget CPP.
3.4.3 The Real Exchange Rate and (Deviations from) Absolute PPP
The real exchange rate (RER) is a measure of how far the nominal rate di ers from the
ppp one: it simply is the nominal exchange rate divided by the ppp counterpart. Example 3.16 In our Freedonian story, the nominal rate was 0.010 usd/fdk while the ppp rate
was 0.020 usd/fdk; thus, the real rate was 0.5|a large deviation from unity, but
not uncommon between two very di erent economies.
52
The real rate is a dimensionless number| [hc/fc] divided by [hc/fc]. In a way, it
simply tells us what the ratio is of the translated price levels:
def S
t
RERt =
^ppp
St
= Stt ; from :
t
Again, in the example one can nd the RER for the fdk against the usd by trans-
lating into usd the foreign price of the BigMeal, fdk 250 0.010 = usd 2.5, and
divide it by the domestic price level, 5, which gets us 2.5/5 = 0.5. Thus, the RER
rate tells you how much cheaper (if RER < 1) or more expensive (if RER > 1) the
foreign country is. A country with a below-unity real rate would be a nice place to
spend your domestic income, or could be an attractive base to export from, but
may not be the best place to export to. These are very di erent questions than
the one answered by the ppp rate.
Obviously, if the real rate equals unity, both countries have the same price
level. If that is true, Absolute ppp is said to hold:
Absolute ppp holds if RER t
= 1 ,
S t = Sppp
, S
t =
t
t t
The countries have been ranked on the basis of the real rate. Two observations
stand out. First, there is a ve-to-one ratio between the most and least expensive
countries, Norway and China. So deviations from ppp are big. Second, there is a
system to it, to some extent: undervalued currencies tend to be developing ones, and
overvalued ones developed. (The fact that thus usd is not top is anomalous, in this
view. The long-lasting de cit in its CA may be one reason).


![[XLS]itijind.org.initijind.org.in/Followup2013-2015.xlsx · Web viewSHOBHA SOM NATH PARUL RAMESH JND/GITI/2014(A)-I/S/CPA/6083 RITU KARAMBIR SINGH RANBIR SINGH SOMBIR PAWAN KUMAR](https://static.fdocuments.in/doc/165x107/5b097f687f8b9a5f6d8e0175/xls-viewshobha-som-nath-parul-ramesh-jndgiti2014a-iscpa6083-ritu-karambir.jpg)