BONG LJUNGDAHL AB
13
BONG LJUNGDAHL AB Uddevägen 3 • Box 516 • SE-291 25 Kristianstad Phone +46 (0)44 20 70 00 • Fax +46 (0)44 20 70 91 Public limited company (publ.) Corp. reg. no. 556034-1579 www.bongljungdahl.se • Bong continued its positive earnings trend in the second quarter of 2005 with a profit before tax of SEK 9 (-3 P 1) ) million. For the first six months of 2004, profit before tax was SEK 17 (-3 1) ) million and profit after tax was SEK 12 (-2 2) ) million. • Second quarter volumes were relatively stable compared with the prior year and net sales reached SEK 447 (444) million. Net sales for the first six months reached SEK 900 (934) million. • Earnings per share amounted to SEK 0.90 (-0.16 3) ). • Cash flow after investment activities totalled SEK 18 (21) million for the second quarter and SEK 10 (29) million for the first half of the year. • Bong has signed an agreement for the sale of its Danish property. The sale will generate a capital gain of SEK 16 million in the third quarter. • A new action programme involving a reduction in staff by around 100 positions was initiated at the start of the third quarter. Q2 Q2 Q1-2 Q1- 2 SEK M 2005 2004 2005 2004 Net sales 447 444 900 934 Operating profit 18 62 37 74 Adjusted operating profit 18 1) 8 37 1) 19 Profit before tax 9 52 17 52 Adjusted profit before tax 9 1) -3 17 1) -3 Cash flow after investing activities 18 21 10 29 1) Excluding final settlement of SEK 61.4 million in dispute with former owner of Bauwens Group and restructuring charges of SEK 6.8 million. 2) Excluding one-time items according to 1) above, amounting to SEK 48.2 million after tax . 3) Earnings per share for the first half of 2004 were SEK 3.47 including non-recurring items of SEK 48.2 million after tax . BONG LJUNGDAHL AB Interim report January - June 2005
Transcript of BONG LJUNGDAHL AB

BONG LJUNGDAHL AB Uddevägen 3 • Box 516 • SE-291 25 Kristianstad
Phone +46 (0)44 20 70 00 • Fax +46 (0)44 20 70 91 Public limited company (publ.) Corp. reg. no. 556034-1579
www.bongljungdahl.se
• Bong continued its positive earnings trend in the second quarter of 2005 with a profit before tax of
SEK 9 (-3 P1)) million. For the first six months of 2004, profit before tax was SEK 17 (-3 1)) million and profit after tax was SEK 12 (-2 2)) million.
• Second quarter volumes were relatively stable compared with the prior year and net sales reached
SEK 447 (444) million. Net sales for the first six months reached SEK 900 (934) million. • Earnings per share amounted to SEK 0.90 (-0.16 3)). • Cash flow after investment activities totalled SEK 18 (21) million for the second quarter and SEK
10 (29) million for the first half of the year. • Bong has signed an agreement for the sale of its Danish property. The sale will generate a capital
gain of SEK 16 million in the third quarter. • A new action programme involving a reduction in staff by around 100 positions was initiated at
the start of the third quarter. Q2 Q2 Q1-2 Q1- 2SEK M 2005 2004 2005 2004
Net sales 447 444 900 934Operating profit 18 62 37 74
Adjusted operating profit 18 1) 8 37 1) 19Profit before tax 9 52 17 52Adjusted profit before tax 9 1) -3 17 1) -3Cash flow after investing activities 18 21 10 29 1) Excluding final settlement of SEK 61.4 million in dispute with former owner of Bauwens Group and restructuring charges of SEK 6.8 million. 2) Excluding one-time items according to 1) above, amounting to SEK 48.2 million after tax. 3) Earnings per share for the first half of 2004 were SEK 3.47 including non-recurring items of SEK 48.2 million after tax.
BONG LJUNGDAHL AB Interim report January - June 2005

MARKETS In the first half of 2005, envelope volumes fell by an estimated 3-4 per cent compared with the previous year. Volumes in Germany were down by around 5 per cent. The envelope markets in Sweden, Denmark, Norway, the UK and the Netherlands also suffered from flagging demand and shrank by around 2-3 per cent in the first six months of the year. In Finland, volumes were largely unchanged from the same period of 2004. The Eastern European market continued to develop favourably with volume growth of 5-10 per cent in several countries. The ongoing consolidation of the industry continued in the second quarter of 2005 as Mayer Kuvert in Germany acquired the Norwegian envelope manufacturer Lyche and Tompla/La Couronne took over the German/Polish manufacturer Fehling and Mill Lane Envelopes in England. In addition, French-based Hamelin acquired the English envelope maker John Dickinson at the beginning of July. Following these transactions, the five largest envelope manufacturers in Europe command around 65 per cent of the total market. In pace with a successive decrease in traditional administrative mail, i.e. payments, account statements and similar, all markets are showing rising demand for direct mail envelopes and protective envelopes adapted for e-business packages. Our assessment is that within a few years, the shrinking market for administrative mail envelopes will be offset by growth for these higher value added products. Compared with the first half of 2004, Bong’s volumes have declined. This is partly due to lower demand and partly to a more selective sales process aimed at improving profitability. The volume decrease was especially pronounced in the first quarter of 2005, while the second quarter was relatively stable. SALES AND PROFIT, JANUARY -JUNE 2005 Consolidated net sales for the first half of 2005 fell by a total of around 4 per cent year-on-year to SEK 900 (934) million. Sales were down by 6 per cent as a result of lower volumes, while changes in prices and the product mix boosted sales by around 2 per cent. Exchange rate fluctuations had only a marginal effect on sales. Operating profit reached SEK 37 (19 1)) million. Compared with 2004, the upturn was especially noticeable in Germany and Scandinavia. Net financial items totalled SEK –20 (-22) million and were strengthened by the Group’s lower net debt and falling interest rates. Profit before tax was SEK 17 (-3 1)) million. SALES AND PROFIT, APRIL-JUNE 2005 Second quarter sales were up slightly over the previous year and amounted to SEK 447 (444) million. Sales decreased by 0.5 per cent as a result of lower volumes, while changes in prices and the product mix boosted sales by 1 per cent. Exchange rate fluctuations had only a marginal effect on sales. Operating profit for the second quarter is reported at SEK 18 (8 1)) million. Profit before tax was SEK 9 (-3 1)) million.
1) Excluding final settlement of SEK 61.4 million in dispute with former owner of Bauwens Group and restructuring charges of SEK 6.8 million.
2
3
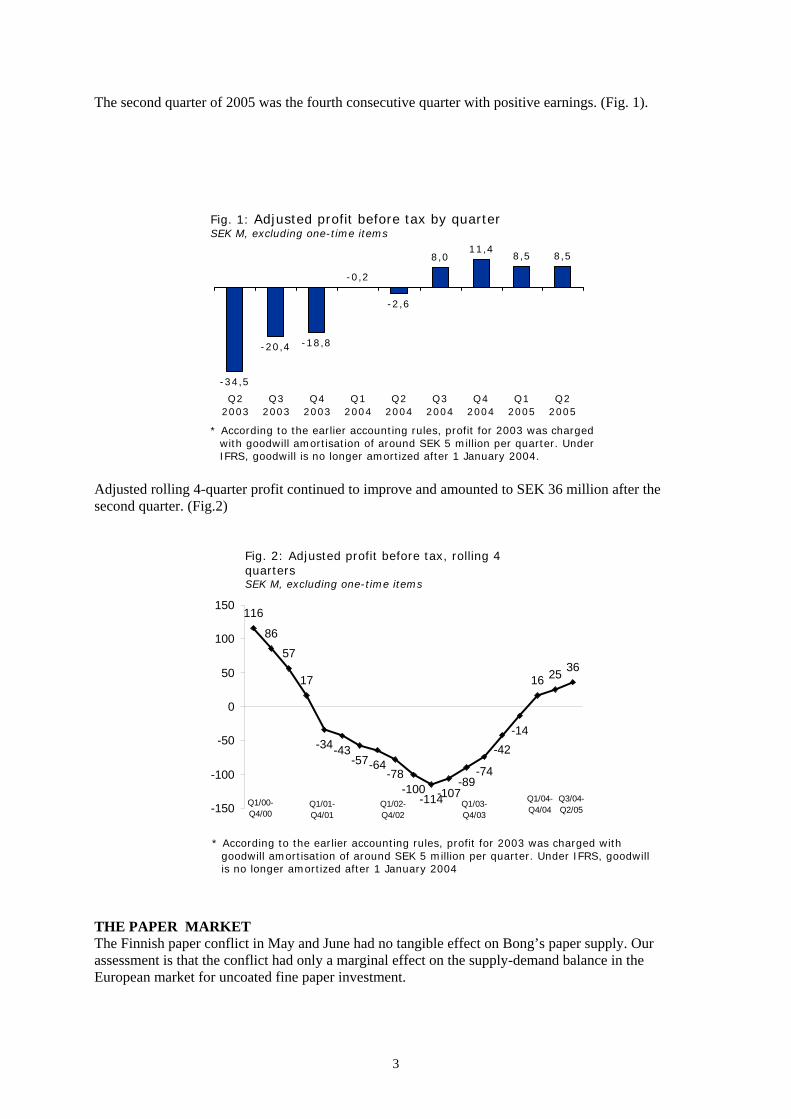
Adjusted rollisecond quarter. (Fig.2) THE PAPER MARKET The Finnish paper conflict in May and June had no tangible effect on Bong’s paper supply. Our assessment is that the conflict had only a marginal effect on the supply-demand balance in the European market for uncoated fine paper investment.
The second quarter of 2005 was the fourth consecutive quarter with positive earnings. (Fig. 1).
ng 4-quarter profit continued to improve and amounted to SEK 36 million after the
-34-43-57-64
-78-100
-114-107-89
-74
-42-14
116
86
57
17 251636
-150
-100
-50
0
50
100
150
Q1/00-Q4/00
Q1/03-Q4/03
Q3/04-Q2/05
Q1/01-Q4/01
Q1/02-Q4/02
Q1/04-Q4/04
Fig. 2: Adjusted profit before tax, rolling 4 quarters SEK M, excluding one-time items
* According to the earlier accounting rules, profit for 2003 was charged with
* According to the earlier accounting rules, profit for 2003 was charged with goodwill amortisation of around SEK 5 million per quarter. Under IFRS, goodwill is no longer amortized after 1 January 2004.
goodwill amortisation of around SEK 5 million per quarter. Under IFRS, goodwill is no longer amortized after 1 January 2004
Fig. 1: Adjusted profit before tax by quarter SEK M, excluding one-time items
-34,5
-20,4 -18,8
-0,2
-2,6
8,011,4
8,5 8,5
Q22003
Q32003
Q42003
Q12004
Q22004
Q32004
Q42004
Q12005
Q22005

CASH FLOW The Group’s cash flow after investment activities for the second quarter was SEK 18 (21) million. For the first half of 2005, cash flow after investing activities amounted to SEK 10 (29) million. Although working capital increased as an effect of seasonal and periodic fluctuations in current receivables and liabilities, the positive earnings trend and restrictive investment led to a positive cash flow.
FINANCIAL POSITION Liquid assets at 30 June 2005 totalled SEK 37 million (31 Dec. 2004: SEK 39 million) excluding granted but unutilised overdraft facilities of SEK 168 million (31 Dec. 2004: SEK 148 million).
Consolidated equity at 30 June 2005 was SEK 552 million (31 Dec. 2004: SEK 510 million). Translation of the net assets of foreign subsidiaries to SEK has increased consolidated equity by SEK 28 million. During the period, net loan debt increased by SEK 28 million to SEK 803 million (31 Dec. 2004: SEK 775 million). Exchange rate movements caused net loan debt to rise by around SEK 38 million, while the positive cash flow reduced net debt by SEK 10 million. The net debt/equity ratio decreased to 1.45 (31 Dec. 2004: 1.52). The equity ratio was 32 per cent (31 Dec. 2004: 30 per cent). The Group’s target is an equity ratio of at least 30 per cent over time. CAPITAL EXPENDITURE The period’s net investments in fixed assets amounted to SEK 14 (90) million. The year-earlier figure included the acquisition of Kirjekuori OY in Finland. PERSONNEL The average number of employees during the period was 1,314 (1,420). At the end of June 2005, the number of employees in the Group was 1,287 (1,425). PARENT COMPANY The activities of the Parent Company include administration of operating subsidiaries and Group management functions. Net sales amounted to SEK 0 (0). The period’s profit before tax was SEK -18 (23) million. Investments during the period were insignificant (0). The Parent Company’s liquid assets totalled SEK 1 million (31 Dec. 2004: SEK 1 million) excluding granted but unutilised overdraft facilities of SEK 32 (28) million. WARRANT PROGRAMME According to the decision of the AGM on 10 May 2005, senior executives in Bong were offered the opportunity to buy subscription warrants in the company during the second quarter. All five members of the group management purchased the maximum allotment of warrants amounting to 50,000 each, worth a combined SEK 1.65 million, which was were paid in and added to shareholders’ equity. The warrants, issued in three separate series, may be exercised for subscription during the period from 1 July 2007 to 30 June 2010 inclusive. An additional 50,000 subscription warrants were reserved for possible future members of the group management. EVENTS AFTER THE END OF THE SECOND QUARTER Sale of property in Denmark In July, Bong signed an agreement for the sale of its Danish property, which will generate a capital gain of SEK 16 million in the third quarter. The cash flow effect of the transaction is estimated at SEK
4

35 million. Bong will continue to use parts of the property as a tenant, with premises that are better suited to its needs. Profitability and productivity improvement programme As part of Bong’s continuous efforts to cut costs, a programme aimed at boosting productivity was launched at the beginning of the third quarter. The motive for the programme is that Group sees potential to raise productivity in a number of functions such as production, administration, etc. The programme will affect a total of around 100 positions in Scandinavia, the UK, Germany and Finland. In addition to the employees who have already resigned or been given notice, the company has initiated negotiations for a reduction of 31 positions in Nybro, 6 in Kristianstad, some 20 in the UK, around 10 in Germany, 3 in Denmark and 2 in Finland. The cost of the programme is estimated at approximately SEK 25 million and will be charged to the profit and loss statement as a one-time expense in the third quarter. The savings are expected to reach SEK 25 million on an annual basis, and will emerge successively starting in the fourth quarter of 2005. ACCOUNTING PRINCIPLES With effect from 1 January 2005, Bong presents its financial statements in compliance with International Financial Reporting Standards (IFRS). This interim report has been prepared in accordance with IAS 34. The date of transition to IFRS is 1 January 2004, which means that the comparative figures for 2004 have been restated to IFRS. The effects of transition to IFRS and changed accounting principles are described in Appendix 1. With effect from 1 January 2005, the Parent Company applies the Swedish Financial Accounting Standards Council’s recommendation RR 32 Accounting for Legal Entities, with retrospective restatement as of January 2004. The main rule in the recommendation states that legal entities whose securities are listed on a Swedish stock exchange on the balance sheet date shall apply those IFRSs that are applied in the consolidated financial statements. The transition to RR 32 has not had any effect on the reported results for 2004. FUTURE OUTLOOK Although the European envelope market began to show signs of recovery in the past year, we do not anticipate any significant volume growth in the market during 2005. However, we expect Bong Ljungdahl’s positive earnings trend to continue throughout the year. Kristianstad , 17 August 2005 BONG LJUNGDAHL AB Anders Davidsson President & CEO AUDITORS’ REPORT We have reviewed the consolidated financial report for Bong Ljungdahl AB (publ.) for the period ended 30 June 2005 in accordance with the recommendation of the Institute for the Accountancy Profession in Sweden (FAR). A review is limited primarily to inquiries of company personnel and analytical procedures applied to the financial data. These procedures do not provide all the evidence that would be required in an audit, thus the level of assurance provided is less than given in an audit. We have not performed an audit and, accordingly we do not express an audit opinion.
5

Based on our review, we have not become aware of any matter that makes us believe that the interim report does not fulfil the requirements for interim financial reports according to the Swedish Annual Accounts Act and IAS 34. Kristianstad , 17 August 2005 Anders Lundin Dan Andersson Authorised Public Accountant Authorised Public Accountant The interim report will be presented in a teleconference starting at 3:30 p.m. on 17 August. 30. The number to the teleconference is +46 (0)8- 505 20 114. By 2:30 p.m. there will be pictures available on our website www.bongljungdahl.se For additional information about the interim report, please contact Anders Davidsson, President and CEO of Bong Ljungdahl AB. Telephone (switchboard) +46 (0)44 20 70 00, (direct) +46 (0)44 20 70 80, (mobile) +46 (0)70 545 70 80. Coming reports: Interim report January – September 2005 9 November 2005 Year-end report 2005 13 February 2006 Bong is one of Europe’s leading envelope companies. The Group has an annual turnover of approximately SEK 1.8 billion, some 1,300 employees and an annual manufacturing capacity of around 15 billion envelopes at its factories in Sweden, Denmark, Norway, Finland, Poland, Germany, Belgium, the UK and Ireland. Bong has a very strong market position, particularly in Northern Europe, and conducts sales and marketing in eleven European countries through its own sales organisations. The Group sees attractive opportunities for further expansion and development. Bong is a publicly listed company and its shares are quoted on the O list of the Stockholm Stock Exchange__________________________________________________________________________________
.
6

INTERIM REPORT 30 JUNE 2005 CONSOLIDATED PROFIT AND April - June Jan – June July 04- Jan -DecLOSS ACCOUNTS IN SUMMARY 2005 2004 2005 2004 June 05 2004(SEK M) 3 mths 3 mths 6 mths 6 mths 12 mths 12 mthsNet sales 446.6 444.3 900.3 934.4 1 773.3 1 807.4Cost of goods sold -358.1 -367.3 -721.3 -768.2 -1 429.2 -1 476.1Gross profit 88.5 77.0 179.0 166.2 344.1 331.3 Selling expenses -35.5 -35.6 -71.8 -73.2 -139.6 -140.9Administrative expenses -37.8 -40.9 -74.5 -81.2 -149.2 -155.9Other operating income and expenses 2.8 61.7 3.9 61.9 21.1 79.1Operating profit 18.0 62.2 36.6 73.7 76.4 113.6 Net financial items -9.5 -10.2 -19.6 -21.9 -39.9 -42.2Profit before tax 8.5 52.0 17.0 51.8 36.5 71.4 Tax -2.4 -5.1 -5.0 -5.7 -18.3 -19.0Profit after tax 6.1 46.9 12.0 46.1 18.2 52.4 Earnings per share before dilution 0.47 3.61 0.92 3.55 1.40 4.03Earnings per share after dilution 0.45 3.52 0.90 3.47 1.38 3.95 CONSOLIDATED BALANCE 30 June 30 June 31 DecSHEETS IN SUMMARY (SEK M) 2005 2004 2004Assets Intangible assets 1) 330.3 324.1 317.1Tangible assets 701.3 759.2 704.1Financial assets 63.7 67.6 62.9Inventories 267.9 265.2 242.4Current receivables 327.1 322.1 306.8Cash and bank 37.5 51.8 38.6Total assets 1,727.8 1,790.0 1,671.9 Equity and liabilities Equity 552.0 512.2 510.2Long-term liabilities 2) 573.2 604.9 586.1Current liabilities 2) 602.6 672.9 575.6Total equity and liabilities 1,727.8 1,790.0 1,671.9 1) Of which, goodwill 326.3 319.1 313.12) Of which, interest-bearing 842.8 878.7 816.6
7

KEY RATIOS Jan - June July 2004- Jan-Dec 2005 2004 June2005 2004 Earnings per share after dilution, SEK 1) 0.90 3.47 1.38 3.95Ditto calculated on adjusted profit/loss, SEK 1) 0.90 -0.16 2.04 0.99 Earnings per share before dilution, SEK 0.92 3.55 1.40 4.03Ditto calculated on adjusted profit/loss, SEK 0.92 -0.16 2.08 1.00 Equity per share after dilution, SEK 43.40 39.94 43.40 39.79Ditto before full conversion 42.45 39.38 42.45 39.23 Operating margin, % 2) 4.1 2.0 4.3 3.3Profit margin, % 2) 1.9 -0.3 2.1 0.9 Return on equity, % 2) - 5.2 2.6Return on capital employed, % 2) - 5.6 4.4 Equity ratio, % 31.9 28.6 31.9 30.5Net debt/equity ratio, times 1.45 1.61 1.45 1.52Interest coverage ratio, times 2) 1.8 0.9 1.9 1.4 Capital employed, SEK M 1 394.8 1 391.0 1 394.8 1 326.8Interest-bearing net loan debt, SEK M 802.8 823.2 802.8 775.1 No. of shares outstanding at end of period before conversion 13,004,986 13,004,986 13,004,986 13,004,986No. of shares outstanding at end of period after full conversion 13,651,180 13,351,180 13,651,180 13,351,180Average number of shares before conversion 13,004,986 13,004,986 13,004,986 13,004,986Average number of shares after full conversion 13,434,513 13,351,180 13,392,847 13,351,180 1) The dilution effect is not taken into account if it leads to an improved result 2) Calculated on adjusted profit/loss as stated below. Adjusted profit: Operating profit according to the consolidated balance sheet 36.6 73.7 76.4 113.6 Final settlement in dispute with former owner of Bauwens Group - -61.5 - -61.5Capital gain on the sale of fixed assets - -12.4 -12.4Restructuring charges - 6.8 12.3 19.1 Adjusted operating profit 36.6 19.0 76.3 58.8 CHANGES IN CONSOLIDATED Jan - June Jan-DecEQUITY (SEK M) 2005 2004 2004Opening balance for the period 510.2 463.4 463.4Payment for warrants 1.6 Translation differences 28.2 2.6 -5.6Profit for the period 12.0 46.2 52.4Closing balance for the period 552.0 512.2 510.2
8
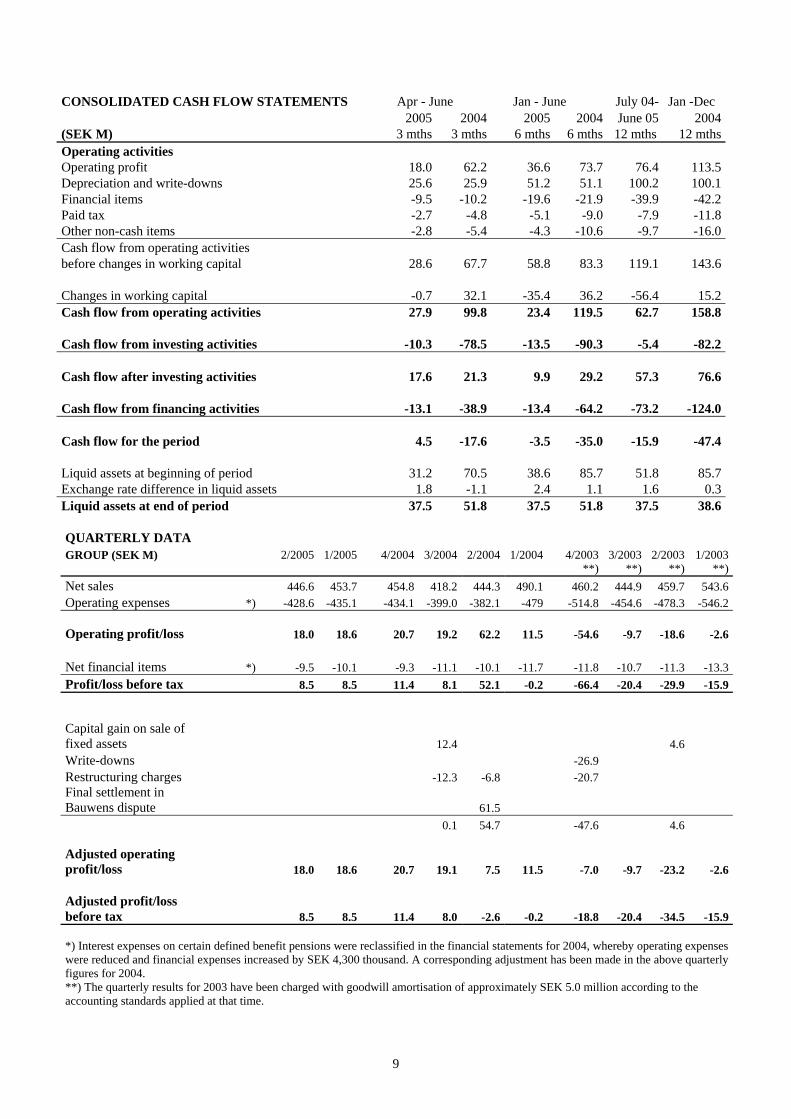
CONSOLIDATED CASH FLOW STATEMENTS Apr - June Jan - June July 04- Jan -Dec 2005 2004 2005 2004 June 05 2004(SEK M) 3 mths 3 mths 6 mths 6 mths 12 mths 12 mthsOperating activities Operating profit 18.0 62.2 36.6 73.7 76.4 113.5Depreciation and write-downs 25.6 25.9 51.2 51.1 100.2 100.1Financial items -9.5 -10.2 -19.6 -21.9 -39.9 -42.2Paid tax -2.7 -4.8 -5.1 -9.0 -7.9 -11.8Other non-cash items -2.8 -5.4 -4.3 -10.6 -9.7 -16.0Cash flow from operating activities before changes in working capital 28.6 67.7 58.8 83.3 119.1 143.6 Changes in working capital -0.7 32.1 -35.4 36.2 -56.4 15.2Cash flow from operating activities 27.9 99.8 23.4 119.5 62.7 158.8 Cash flow from investing activities -10.3 -78.5 -13.5 -90.3 -5.4 -82.2 Cash flow after investing activities 17.6 21.3 9.9 29.2 57.3 76.6 Cash flow from financing activities -13.1 -38.9 -13.4 -64.2 -73.2 -124.0 Cash flow for the period 4.5 -17.6 -3.5 -35.0 -15.9 -47.4 Liquid assets at beginning of period 31.2 70.5 38.6 85.7 51.8 85.7Exchange rate difference in liquid assets 1.8 -1.1 2.4 1.1 1.6 0.3Liquid assets at end of period 37.5 51.8 37.5 51.8 37.5 38.6
QUARTERLY DATA GROUP (SEK M) 2/2005 1/2005 4/2004 3/2004 2/2004 1/2004 4/2003 3/2003 2/2003 1/2003 **) **) **) **)Net sales 446.6 453.7 454.8 418.2 444.3 490.1 460.2 444.9 459.7 543.6Operating expenses *) -428.6 -435.1 -434.1 -399.0 -382.1 -479 -514.8 -454.6 -478.3 -546.2 Operating profit/loss 18.0 18.6 20.7 19.2 62.2 11.5 -54.6 -9.7 -18.6 -2.6 Net financial items *) -9.5 -10.1 -9.3 -11.1 -10.1 -11.7 -11.8 -10.7 -11.3 -13.3Profit/loss before tax 8.5 8.5 11.4 8.1 52.1 -0.2 -66.4 -20.4 -29.9 -15.9 Capital gain on sale of fixed assets 12.4 4.6 Write-downs -26.9 Restructuring charges -12.3 -6.8 -20.7 Final settlement in Bauwens dispute 61.5 0.1 54.7 -47.6 4.6 Adjusted operating profit/loss 18.0 18.6 20.7 19.1 7.5 11.5 -7.0 -9.7 -23.2 -2.6 Adjusted profit/loss before tax 8.5 8.5 11.4 8.0 -2.6 -0.2 -18.8 -20.4 -34.5 -15.9 *) Interest expenses on certain defined benefit pensions were reclassified in the financial statements for 2004, whereby operating expenses were reduced and financial expenses increased by SEK 4,300 thousand. A corresponding adjustment has been made in the above quarterly figures for 2004. **) The quarterly results for 2003 have been charged with goodwill amortisation of approximately SEK 5.0 million according to the accounting standards applied at that time.
9

APPENDIX TO INTERIM REPORT, JANUARY - JUNI 2005
ACCOUNTING STANDARDS 2005 With effect from 1 January 2005, Bong presents its financial statements in accordance with International Financial Reporting Standards (IFRS) endorsed by the EU. The comparative figures for 2004 have been restated. The most significant adjustment is the add-back of goodwill amortisation reported during 2004 (SEK 20.8 million). The transition to IFRS has been carried out with the application of the provisions in IFRS 1, First Time Adoption of IFRS. As permitted by IFRS 1, the Group has chosen not to restate acquisitions prior to 1 January 2004 and has reset accumulated translation differences in equity to zero. Goodwill is valued at cost less accumulated write-downs, and is tested for impairment at least annually. In this interim report, the goodwill amortisation that is stated in the annual report for 2004 has been added back in the comparative figures for 2004 in this interim report. IAS 39 and 32 as applied with effect from 1 January 2005. The application of IAS 39 has had no effect on the opening balance for 2005. Compared with the earlier rules, derivatives (forward exchange contracts) are taken up at fair value in the balance sheet. Changes in value are recognised in the profit and loss account for the period in which they arise. Accounts receivable and payable in foreign currency were previously translated at the hedged forward rate, but are now translated at the closing day rate. In other respects, the application of IAS 39 has not given rise to any changes in the Group’s financial statements. Restatement of the profit and loss accounts and balance sheets for 2004 according to the rules in IAS 39 would require recognition of outstanding forward contracts at fair value. The items under the heading “Provisions” have been reclassified as long-term and current liabilities. Aside from the above adaptations to IFRS, the financial statements have been prepared according to the same accounting and valuation methods used in the most recent annual report. TRANSITION TO IFRS 2005 The effects of adjustments in historical data are described below. The reported effects are preliminary and are based on the currently endorsed standards, which may be subject to revision during the period prior to 31 December 2005. Notes 1. Add-back of goodwill. The tax effect refers to locally reported goodwill arising on the acquisition
of net assets. 2. Reclassification of “Provisions” to long-term and current liabilities.
10

CONSOLIDATED PROFIT AND LOSS Effect of IFRSACCOUNTS IN SUMMARY 2004 transition 2004(SEK thousands) Note Jan - Dec to IFRS Jan – DecNet sales 1,807,436 - 1 807,436Cost of goods sold -1,476,074 - -1 476,074Gross profit 331,362 - 331,362Selling expenses -140,931 - -140,931Administrative expenses -155,972 - -155,972Other operating income and expenses 79,089 - 79,089Goodwill amortisation -20,806 20,806 0Operating profit 1 92,742 20,806 113,548Net financial items -42,183 - -42,183Profit before tax 50,559 20,806 71,365Tax 1 -17,386 -1,577 -18,963Profit after tax 33,173 19,229 52,402 CONSOLIDATED PROFIT AND LOSS Effect of IFRSACCOUNTS IN SUMMARY 2004 transition 2004(SEK thousands) Note April -June to IFRS April –JuneNet sales 444,265 - 444,265Cost of goods sold -367,338 - -367,338Gross profit 76,927 - 76,927Selling expenses -35,585 - -35,585Administrative expenses -40,891 - -40,891Other operating income and expenses 61,777 - 61,777Goodwill amortisation -5,053 5,053 0Operating profit 1 57,175 5,053 62,228Net financial items -10,174 - -10,174Profit before tax 47,001 5,053 52,054Tax 1 -4,752 -389 -5,141Profit after tax 42,249 4,664 46,913 CONSOLIDATED PROFIT AND LOSS Effect of IFRSACCOUNTS IN SUMMARY 2004 transition 2004(SEK thousands) Note Jan - June to IFRS Jan – JuneNet sales 934,367 - 934,367Cost of goods sold -768,185 - -768,185Gross profit 166,182 - 166,182Selling expenses -73,179 - -73,179Administrative expenses -81,251 - -81,251Other operating income and expenses 61,950 - 61,950Goodwill amortisation -10,049 10,049 0Operating profit 1 63,653 10,049 73,702Net financial items -21,864 - -21,864Profit before tax 41,789 10,049 51,838Tax 1 -4,891 -789 -5,680Profit after tax 36,898 9,260 46,158
11

CONSOLIDATED BALANCE SHEETS Effect of IFRSIN SUMMARY (SEK M) CB transition CB Note 31 Dec. 2004 to IFRS 31 Dec. 2004Assets Intangible assets 1 296,646 20,483 317,129Tangible assets 704,062 704,062Financial assets 62,904 62,904Total fixed assets 1,063,612 20,483 1,084,095 Inventories 242,414 242,414Current receivables 306,784 306,784Cash and bank 38,572 38,572Total current assets 587,770 0 587,770 Total assets 1,651,382 20,483 1,671,865 Equity and liabilities Equity 1 491,232 18,922 510,154Provisions 2 170,527 -170,527 0Long-term liabilities 2 418,033 168,109 586,142Current liabilities 2 571,590 3,979 575,569Total equity and liabilities 1,651,382 20,483 1,671,865 CONSOLIDATED BALANCE SHEETS Effect of IFRSIN SUMMARY (SEK M) CB transition CB Note 30 June 2004 to IFRS 30 June 2004Assets Intangible assets 1 314,027 10,033 324,060Tangible assets 759,204 759,204Financial assets 67,577 67,577Total fixed assets 1,140,808 10,033 1,150,841 Inventories 265,187 265,187Current receivables 322,142 322,142Cash and bank 51,801 51,801Total current assets 639,130 0 639,130 Total assets 1,779,938 10,033 1,789,971 Equity and liabilities Equity 1 502,945 9,244 512,189Provisions 2 194,926 -194,926 0Long-term liabilities 2 419,535 185,385 604,920Current liabilities 2 662,532 10,330 672,862Total equity and liabilities 1,779,938 10,033 1,789,971
12

CONSOLIDATED CASH FLOW STATEMENTS 2004 Effect of Adjusted(SEK thousands) 2004 transition 2004
Note Jan -Dec to IFRS Jan - DecOperating activities Operating profit 1 92,742 20,806 113,548Depreciation and write-downs 1 120,874 -20,806 100,068Financial items -42,183 - -42,183Paid tax -11,823 - -11,823Other non-cash items -16,064 - -16,064Cash flow from operating activities before changes in working capital 143,546 0 143,546Changes in working capital 15,217 - 15,217Cash flow from operating activities 158,763 0 158,763Cash flow from investing activities -82,157 - -82,157Cash flow after investing activities 76,606 0 76,606Cash flow from financing activities -124,001 - -124,001Cash flow for the period -47,395 0 -47,395 CONSOLIDATED CASH FLOW STATEMENTS, Q2, 2004 Effect of Adjusted(SEK thousands) 2004 transition 2004
Note Apr -June to IFRS Apr -JuneOperating activities Operating profit 1 57,225 5,053 62,278Depreciation and write-downs 1 30,954 -5,053 25,901Financial items -10,224 - -10,224Paid tax -4,820 - -4,820Other non-cash items -5,395 - -5,395Cash flow from operating activities before changes in working capital 67,740 0 67,740Changes in working capital 32,133 - 32,133Cash flow from operating activities 99,873 0 99,873Cash flow from investing activities -78,578 - -78,578Cash flow after investing activities 21,295 0 21,295Cash flow from financing activities -38,850 - -38,850Cash flow for the period -17,555 0 -17,555 CONSOLIDATED CASH FLOW STATEMENTS, Q1-Q2, 2004 Effect of Adjusted(SEK thousands) 2004 transition 2004
Note Jan - June to IFRS Jan - JuneOperating activities Operating profit 1 63,653 10,049 73,702Depreciation and write-downs 1 61,138 -10,049 51,089Financial items -21,864 - -21,864Paid tax -9,009 - -9,009Other non-cash items -10,639 - -10,639Cash flow from operating activities before changes in working capital 83,279 0 83,279Changes in working capital 36,238 - 36,238Cash flow from operating activities 119,517 0 119,517Cash flow from investing activities -90,342 - -90,342Cash flow after investing activities 29,175 0 29,175Cash flow from financing activities -64,138 - -64,138Cash flow for the period -34,963 0 -34,963
13