Bone Decalcification, Conventional Decalcification, Rapid ... · Bone Decalcification, Conventional...
107
Transcript of Bone Decalcification, Conventional Decalcification, Rapid ... · Bone Decalcification, Conventional...


Chapter 1: Introduction 1
Keywords
Bone Decalcification, Conventional Decalcification, Rapid Decalcification,
Histology, Decalcification Endpoint

2 Chapter 1: Introduction
Abstract
Bone decalcification is a time consuming process for conducting routine histological
analysis of specimens in research and pathology. Numerous approaches have been
trialled to increase the rate of decalcification time without compromising
histological quality. In this study a laboratory microwave was used to increase the
temperature and perfusion of decalcification solutions in mice, rat and sheep bone.
Bone was decalcified with 10% Ethylenediaminetetraacetic acid, 10% formic acid,
10% Hydrochloric acid and 5% nitric acid, both conventionally (4°C & 25°C) and in a
KOS-milestone microwave (37°C). Decalcification was monitored by micro-
computed tomography analysis to determine the endpoint of decalcification of
bone. Specimens in a microwave decalcified on average 50 – 80% faster than
conventional methods in all species when EDTA was used. Furthermore, in formic,
hydrochloric and nitric acids decalcification in the microwave was 40 – 50% quicker
than the respective conventional conditions. Histology results from the EDTA and
formic acid groups showed preservation of antigens and tissue morphology in all
species, in contrast to the hydrochloric and nitric acid groups were the evidence of
tissue damage and a loss of antigenicity were observed. In conclusion, specimens
decalcified in the microwave using EDTA and formic acid, maintained tissue
morphology and antigenicity which was similar to the conventional conditions. This
study shows that a laboratory microwave is a valuable appliance that could be used
to decrease the time of decalcification of bone tissue while maintaining histological
accuracy.

4 Chapter 1: Introduction
Weight Loss .................................................................................................. 53
4.3 Discussion ..................................................................................................... 57
Chapter 5: Histological evaluation of various decalcification conditions ..... 61
5.1 Histological staining of bone ......................................................................... 61 5.1.1 Mice staining ........................................................................................ 61 5.1.2 Rat staining .......................................................................................... 67 5.1.3 Sheep staining ...................................................................................... 74
5.2 Histological Discussion ................................................................................. 80 5.2.1 Tissue morphology ............................................................................... 80 5.2.2 Immunohistochemistry ......................................................................... 81
Chapter 6: Conclusion .................................................................................... 84
6.1 General Conclusion ....................................................................................... 84
6.2 Study Limitations & Future Work ................................................................. 85
Bibliography ......................................................................................................... 87
Chapter 7: Appendix A .................................................................................. 93

Chapter 1: Introduction 5
List of Figures
Figure 2-1: Mechanism of EDTA chelation of calcium, calcium is chelated by the
oxygen molecules……………………………………………………………………19
Figure 3-1: Sectioning and preparing specimens for decalcification………………27
Figure 4-1: Pilot study results demonstrating the total amount of time required to
decalcify bone ………………………………………………………………………38
Figure 4-2: Representative 3D µCT images of the pilot study……………………..39
Figure 4-3A: Representative 3D µCT images of mice tibia decalcified in EDTA and
formic acid at indicated time points…………………………………………………45
Figure 4-3B: Representative 3D µCT images of mice tibia decalcified in HCl and
nitric acid at indicated time points…………………………………………………..46
Figure 4-4A: Representative 3D µCT images of rat tibia decalcified in EDTA at
indicated time points………………………………………………………………...47
Figure 4-4B: Representative 3D µCT images of rat tibia decalcified in formic acid at
indicated time points………………………………………………………………...48
Figure 4-4C: Representative 3D µCT images of rat tibia decalcified in HCl at
indicated time points………………………………………………………………...49
Figure 4-4D: Representative 3D µCT images of rat tibia decalcified in nitric acid at
indicated time points………………………………………………………………...50
Figure 4-5A: Representative 3D µCT images of sheep tibias decalcified in EDTA
and formic acid at indicated time points…………………………………………….51
Figure 4-5B: Representative 3D µCT images of sheep tibias decalcified in HCl and
nitric acid at indicated time points…………………………………………………..52
Figure 4-6: Graphical representation of the change in mice tibia weight, pH of
decalcification solution and rate of bone volume loss over time……………………54
Figure 4-7: Graphical representation of the change in rat tibia weight, pH of
decalcification solution and rate of bone volume loss over time……………………55
Figure 4-8: Graphical representation of the change in sheep tibia weight, pH of
decalcification solution and rate of bone volume loss over time……………………56
Figure 5-1: Hematoxylin & Eosin staining in mice tibia…………………………...62
Figure 5-2: Safranin O & Fast green staining in mice tibia for cartilage and bone...63
Figure 5-3: Collagen-1 immunohistochemistry in mice tibia for bone matrix……..65
6 Chapter 1: Introduction
Figure 5-4: vWF immunohistochemistry in mice tibia for vasculature and serum
proteins………………………………………………………………………………66
Figure 5-5: Hematoxylin & Eosin staining in rat tibia……………………………..68
Figure 5-6: Safranin O & Fast green staining in rat tibia for cartilage and bone…..70
Figure 5-7: Collagen-1 immunohistochemistry in rat tibia for bone matrix………..71
Figure 5-8: vWF immunohistochemistry in rat tibia for vasculature and serum
proteins………………………………………………………………………………73
Figure 5-9: Hematoxylin & Eosin staining in sheep tibia………………………….76
Figure 5-10: Collagen-1 immunohistochemistry in sheep tibia for bone matrix…...77
Figure 5-11: vWF immunohistochemistry in rat tibia for vasculature and serum
proteins………………………………………………………………………………79
Chapter 1: Introduction 7
List of Tables
Table 2-4: Summary of rapid decalcification attempts and tissue morphology
preservation…………………………………………………………………...…20-21
Table 2-5: Summary table of microwave decalcification experiments……...….23-24
Table 3-1: Pilot study µCT scanning schedule for decalcifying specimens……28-29
Table 3-2: Decalcification specimen groups, species and conditions………............29
Table 3-3: Micro CT time points for assessing decalcification progress……….30-31
Table 3-4: Protocols for tissue processing specimens for paraffin embedding……32
Table 3-5: Protocols for H&E, Safranin O and IHC staining…………………..34-36
8 Chapter 1: Introduction
List of Abbreviations
°C Degrees Celsius
µCT Micro Computed Topography
BV Bone Volume
Col-1 Collagen Type 1
DAB 3, 3 – diaminobenzidine
EDTA Ethylenediaminetetraacetic Acid
HCl Hydrochloric Acid
H&E Hematoxylin and Eosin
HRP HorseRadish-Peroxidase
IHC Immunohistochemistry
Mins Minutes
OCT Optimal Cutting Temperature
Rpm Revolutions per Minute
Saf-O Safranin O
Secs Seconds
vWF von Willebrand Factor
Chapter 1: Introduction 9
QUT Verified Signature

10 Chapter 1: Introduction
Acknowledgements
“Alone we can do so little, together we can do so much” – Helen Keller
This research project could not have been possible without the support of many
who I am grateful to have encountered along my journey.
I would firstly like to thank my supervisory team
Dr Vaida Glatt – Primary supervisor
Associate Professor Mia Woodruff – Secondary supervisor
Professor Mark Pearcy – Tertiary supervisor
I appreciate all the support that my supervisory team provided me with along the
way. I would like to especially acknowledge Dr Vaida Glatt for her tutelage in
improving my scientific literacy and helping me push myself to levels of
achievement I did not believe was possible. This project would not have been
possible without her belief in my abilities and her tenacity to encourage me to
achieve more.
I would like to thank my family, my mother and sister in particular for the emotional
and financial support they provided me throughout the project when things got
tough. My dog Coco for always being cheerful when skies were grey, if I could learn
to embrace her optimism and enthusiasm for every second of life I would be a
better person for it.
I would like to thank my IHBI friends for their lunchtime conversations about
science and non-related issues. Dr Keith Blackwood, Dr Caroline Grant, Emily Bailey,
Pelin Tufecki, Nicole Loechel, Stephanie Fountain, Michal Bartnikowski, Sha Pather,
Nick Quirk, Jess Thompson, Daniel Singh, Cosmo Hutmacher, Chandan Mager, Emily
Bryan, Stephanie Fay and Flavia Savi all offered me friendship and support I am
grateful for.
Finally I would like to achknowledge the Faculty of Science and Engineering at QUT
for providing me with the faculty scholarship and financial assistance required to
complete this project. Furthermore, I would like to thank QUT for providing me with
this opportunity to further my education, career and provide me with this chance to
further discover and explore myself as a person and as a scientist.

Chapter 1: Introduction 11
Chapter 1: Introduction
“I do not think there is any thrill that can go through the human heart like that felt by the inventor as he sees some creation of the brain unfolding to success... such emotions make a man forget food, sleep, friends, love, everything..” Nikola Tesla
1.1 OVERVIEW
Histological analysis is the microscopic analysis of two-dimensional tissue sections
obtained by a process of fixation, embedding, sectioning and staining. It is one of
the most commonly used outcome measures to evaluate tissue morphology of in
vivo animal models in orthopaedic research as well as for clinical diagnostic
evaluations. There are two methods that are routinely used to process bone
specimens for histological analysis, it is either embedding in paraffin wax or
polymeric resins. Paraffin sections are usually 5 µm in thickness, which is ideal not
only for examining of individual cells, but also for immunohistochemistry (IHC) in
the detection of target proteins. However, paraffin also has its limitations allowing
for only smaller sized specimens (25mm x 30mm x 5mm) to be used in the
embedding process, and does not provide a sufficiently hard matrix for cutting the
thinner slices needed for electron microscopy (typically 80-100 nm thick), which
require embedding in, epoxy or acrylic resins.
Resin embedding can generate an entire overview of the specimen and can be used
to analyse calcified tissue. However, the polymerisation process produces a
significant amount of heat, which is potentially negative to the antigenicity of bone
proteins, making IHC analysis difficult. For this reason, paraffin embedding is a more
commonly used method, being cheaper and less time consuming than resin
embedding. Paraffin also has an added advantage over resin as it has a larger range
of staining options. Moreover, because of the dense nature of bone tissue,
sectioning paraffin embedded bone specimens is not possible due to the lack of
infiltration of paraffin wax into the specimen, which requires the removal of calcium
ions from hydroxyapatite in bone. This time consuming process is known as
decalcification, and depending upon the method used to reach complete

12 Chapter 1: Introduction
decalcification, the amount of time and quality of outcome varies considerably.
This project aims to address this issue by investigating multiple methods to increase
the rate of decalcification of bone explants from in vivo studies while at the same
time preserving the tissue and antigen integrity post decalcification for IHC analysis.
1.2 AIMS & SIGNIFICANCE
The novelty of this project was to determine a faster method to decalcify bone
using a microwave that is specifically intended for this purpose. This is extremely
important, as it greatly reduces the time required to complete histological analysis.
The methods evaluated during this project could potentially be adopted by research
and pathology labs that routinely decalcify bone.
Hypothesis
Bone that is rapidly decalcified in a microwave in EDTA will retain
antigenicity and tissue morphology.
Aims
1. To monitor the rate of decalcification using a micro computed
tomography (µCT) system
2. To investigate if rapid decalcification has a detrimental effect on the
tissue morphology and antigenicity
1.3 THESIS OUTLINE
Chapter 2: Literature Review
This chapter includes a comprehensive literature review on bone decalcification
methods and their relativity to current histology techniques. Briefly, this chapter
explores the mechanisms behind bone decalcification and the development of
methods to decrease the time required to achieve endpoint. Microwave methods
become a focal point in the review as this method is the most promising method to
achieve aim 2.
Chapter 3: Methodology
This chapter outlines the research design and experimental methods used in this
study to test the hypothesis and aims. The collection of bone tissue, processing,

Chapter 1: Introduction 13
decalcification, µCT analysis and histology is all outlined in detail and chronological
order.
Chapter 4: Results of decalcification times by Micro CT analysis
This chapter focuses on measuring mineral bone loss throughout decalcification
using a µCT system. An exact endpoint time for each decalcification treatment for
each species of bone was determined with a reproducible degree of accuracy.
Chapter 5: Evaluation of various decalcification conditions on histological staining
This chapter outlines the histological findings from the study. Staining results were
assessed by the degree of tissue preservation observed when compared to the
conventional control method.
Chapter 6: Conclusion
This chapter summarises the results and forms conclusions about the results from
the study in relation to the hypothesis and aims. This chapter also comments on the
study limitations and proposed future work for this area of research.


Chapter 2: Literature Review 15
Chapter 2: Literature Review
2.1 PREFACE
This chapter reviews the current techniques used in the decalcification process of
bone for histological analysis. A brief overview of histological techniques is
presented, as well as an outline of the problems encountered with current
decalcification methods. Rapid techniques for decalcification are introduced and
reviewed with a focus on microwave assisted decalcification, which is investigated
in this thesis.
2.2 BONE HISTOLOGY OVERVIEW
Histology is defined as the study of the microscopic structure of biological tissues.
The histology process involves the collection, fixation, sectioning and staining of
tissues for microscopic analysis. Scientists and pathologists routinely perform
histological study of tissue to understand microbiology and microstructures [1]–[3].
It is performed on two different tissue types, soft tissue and hard tissue. Soft tissue
is defined as a non-mineralised tissue that can be embedded with paraffin wax and
sectioned into thin slices, e.g., liver, kidney, brain, thyroid, tendon, muscle, etc.
Hard tissue is defined as tissue that is mineralised and is too dense for infiltration
with paraffin wax, therefore, this tissue requires demineralisation prior to paraffin
wax embedding so the specimen can be sectioned - examples of hard tissues are
bone, tooth enamel and atherosclerotic plaques [4].
Fixation
Fixation is defined as the process of using a preservative solution to prevent tissue
decomposition for further analysis; improper fixation of a specimen will result in
tissue artefacts or an irreversible loss of cellular quality [5]. The two most
commonly used solutions to fix tissues are either 10% neutral buffered formalin
(NBF) or 4% para-formaldehyde (PFA) [6]. The time of fixation depends on the

16 Chapter 2: Literature Review
density of tissues and the sample size. For example, denser tissues like bone
require longer fixation times due to the lack o f solution penetration into the
tissue. Whereas softer tissue, like kidney, fix quicker due to the easier
penetration of fixative into the deeper layers of tissue.
Decalcification
Tissue decalcification is the process of removing calcium ions from the
extracellular matrix to allow for the tissue to be histologically investigated.
Tissue is submerged into a decalcification solution that causes calcium ions
to dissolve into solution. The process of decalcification is covered in more
detail in section 2.3 of this thesis.
Tissue Processing
Processing is the final step in tissue preparation prior to paraffin embedding,
and is carried out by immersing tissues in graded ethanol solutions of
increasing concentrations ranging from 50 -100% to dehydrate the
specimen. Xylene is then used to clear the tissue of residual ethanol as
paraffin wax and ethanol are immiscible. Specimens are then immersed in
molten paraffin wax to ensure complete penetration throughout the
specimen so that embedding is uniform.
Embedding
A hard tissue like bone can be embedded using one of three methods: a
Methyl- methacrylate (MMA) resin, flash freezing of a fresh tissue in OCT
(optimal cutting temperature) compound for cryosectioning or embedding a
decalcified tissue into paraffin wax [7]. Resin embedding is less frequently
used by research and pathology labs as it is expensive, requires special
equipment and training, and may potentially degenerate target proteins or
enzyme activity due to the exothermic nature of the embedding process
[8]. If cryosectioning is used to process bone then decalcification of tissue is
not required, however, the quality of the sections produced often have poor
results of tissue morphology [9], [10]. An advantage of cryosectioning is it
can be used to achieve rapid results; however, a drawback of this method
Chapter 2: Literature Review 17
is the expense, difficulty to achieve good outcomes and requires
specialized training and extensive experience. Embedding specimens in
paraffin wax is the most common method used to prepare specimens for
microtome sectioning. Paraffin embedding is a technique that does not
require extensive training, is cost effective and specimens can be orientated
in various planes. This method allows for multiple sections to be cut with
ease and the tissue morphology is well preserved.
2.3 BONE DECALCIFICATION METHODS FOR HISTOLOGY
There are two phases of bone, the organic and inorganic phase [11]. The organic
phase of bone consists of blood vessels and bone specific proteins, which lets bone
interact with its surrounding environment. The inorganic phase of bone is the
mineralised part of bone which is made up of hydroxyapatite [12]. Calcium and
phosphate ions are part of the hydroxyapatite molecule that forms the crystalline
structure of bone. Calcium is one of the key components in giving bone its
mechanical properties and crystalline matrix [12]. To perform paraffin histology on
bone it is vital to remove the calcium from the hydroxyapatite matrix so that the
bone can be sectioned by microtomy [13]. Demineralisation of bone occurs by using
either a chelating agent, mineral acid or an organic acid to remove the calcium
component from the tissue [14], [15].
In order to decalcify bone, an acid free solution was originally proposed in 1923,
however, this method was deemed impractical as it required special apparatus,
training and a laborious process [16]. Subsequently, a method using trichloroacetic
acid was trialled in 1923 [16], however, this method was quickly abandoned as it
also failed to decalcify bone. Since then, various acids such as nitric, formic,
hydrochloric (HCl) and ethylenediaminetetraacetic acid (EDTA) have been
successfully used to decalcify bone. [13], [16], [17]. Acidic solutions were favoured
because they were able to decalcify bone without any specific apparatus, although
in the early stages of research there was a lack of agreement over an optimal
method. For this reason, many research laboratories developed ‘in house’ protocols

18 Chapter 2: Literature Review
from the studies on acids to meet their requirements, and as a result limited
publications were available on this research subject. As the need for diagnosing
bone disorders increased along with the use of animal models in pre-clinical testing,
the standardization for decalcification of bone became a more focused research
topic. Consequently, more research was conducted on bone decalcification and a
consensus within the research community was reached over reliable decalcification
solution and conditions [13], [17]–[19].
The ideal decalcification solution had to rapidly decalcify the bone while not
interfering with the gross tissue morphology [20], [21]. These criteria were intended
to ensure that any histological staining performed on processed specimens was not
compromised by the decalcification solution affecting the tissue integrity. This was
particularly important for immunohistochemistry analysis where chromogen tagged
antibodies are used to stain proteins of interest, and where using more acidic
decalcification solutions have been shown to cause damage to tissue [18]–[22]. For
this reason, the importance of preserving tissue quality for histological analysis has
resulted in the vast majority of solutions based on 1 of the 4 most commonly used
acids in decreasing order of strength: nitric, hydrochloric, formic and EDTA [15]. The
strength of each decalcification solution is defined by the mechanism in which
calcium is removed from bone.
Mineral acids (nitric and hydrochloric acid), and organic acid (formic acid) use
hydrogen ions to break the bond between calcium ions and hydroxyapatite. This
then causes the dissolution of hydroxyapatite into calcium ions that form salt and
allows inorganic phosphate to become soluble, which is shown in the following
equation.
Ca (10) (PO4)6(OH) 2(s) + 8H+(aq) 10Ca2+
(aq) + 6HPO42-
(aq) +2H2O(l)
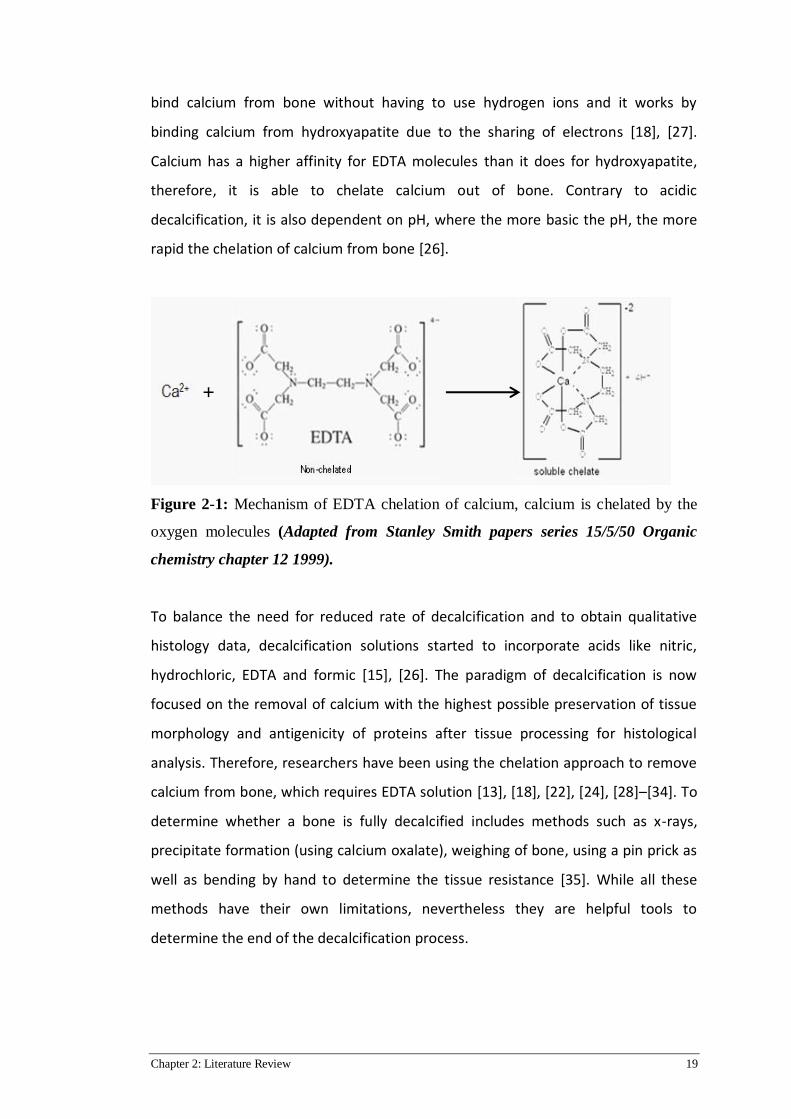
On the contrary, a compound that works via the chelation approach decalcifies
bone on a different principle. The chelation of calcium from bone is achieved using
EDTA, and is demonstrated in Figure 1 below. Chelation is the compound’s ability to
Chapter 2: Literature Review 19
bind calcium from bone without having to use hydrogen ions and it works by
binding calcium from hydroxyapatite due to the sharing of electrons [18], [27].
Calcium has a higher affinity for EDTA molecules than it does for hydroxyapatite,
therefore, it is able to chelate calcium out of bone. Contrary to acidic
decalcification, it is also dependent on pH, where the more basic the pH, the more
rapid the chelation of calcium from bone [26].
Figure 2-1: Mechanism of EDTA chelation of calcium, calcium is chelated by the
oxygen molecules (Adapted from Stanley Smith papers series 15/5/50 Organic
chemistry chapter 12 1999).
To balance the need for reduced rate of decalcification and to obtain qualitative
histology data, decalcification solutions started to incorporate acids like nitric,
hydrochloric, EDTA and formic [15], [26]. The paradigm of decalcification is now
focused on the removal of calcium with the highest possible preservation of tissue
morphology and antigenicity of proteins after tissue processing for histological
analysis. Therefore, researchers have been using the chelation approach to remove
calcium from bone, which requires EDTA solution [13], [18], [22], [24], [28]–[34]. To
determine whether a bone is fully decalcified includes methods such as x-rays,
precipitate formation (using calcium oxalate), weighing of bone, using a pin prick as
well as bending by hand to determine the tissue resistance [35]. While all these
methods have their own limitations, nevertheless they are helpful tools to
determine the end of the decalcification process.
+

20 Chapter 2: Literature Review
While advances in histological techniques have led to a form of standardisation, the
chelation approach (EDTA) used in bone research is limited by the slow process of
bone decalcification. For example, bone harvested from small animals such as mice
and rats can take weeks to decalcify, whereas bone harvested from larger animals
like sheep and bovine can take months [13], [15], [19], [26], [36]. Therefore, finding
a new approach to increase the rate of the decalcification process and to maintain a
high degree of tissue morphology has become a focus in this research area [25].
2.4 DEVELOPMENTS IN RAPID DECALCIFICATION
The most commonly reported method found in literature to decalcify bone is the
use of 10% EDTA at 4°C (refrigeration) or 25°C (room temperature) changing the
solution on a weekly basis [23], [25], [37], [38]. Nevertheless, due to its nature, the
process of decalcification is time consuming, and depending on the specimen size,
can take from several weeks up to several months to complete [39]. For this reason,
there have been attempts to develop a rapid decalcification procedure in order to
reduce the time required for decalcification, and at the same time not cause
significant damage to the tissue morphology. Even though the process for
developing a rapid decalcification technique dates back as far as the 1966 (first use
of a conventional microwave) [17], it is evident from the reports in the literature
that there is a lack of standardisation on the specimen size and tissue used for
experimentation. As a result, it is difficult to determine the most appropriate
method to increase the rate of decalcification while preserving morphology of
tissue (Table 2.4) [15], [20], [22], [26], [28], [39]–[41].
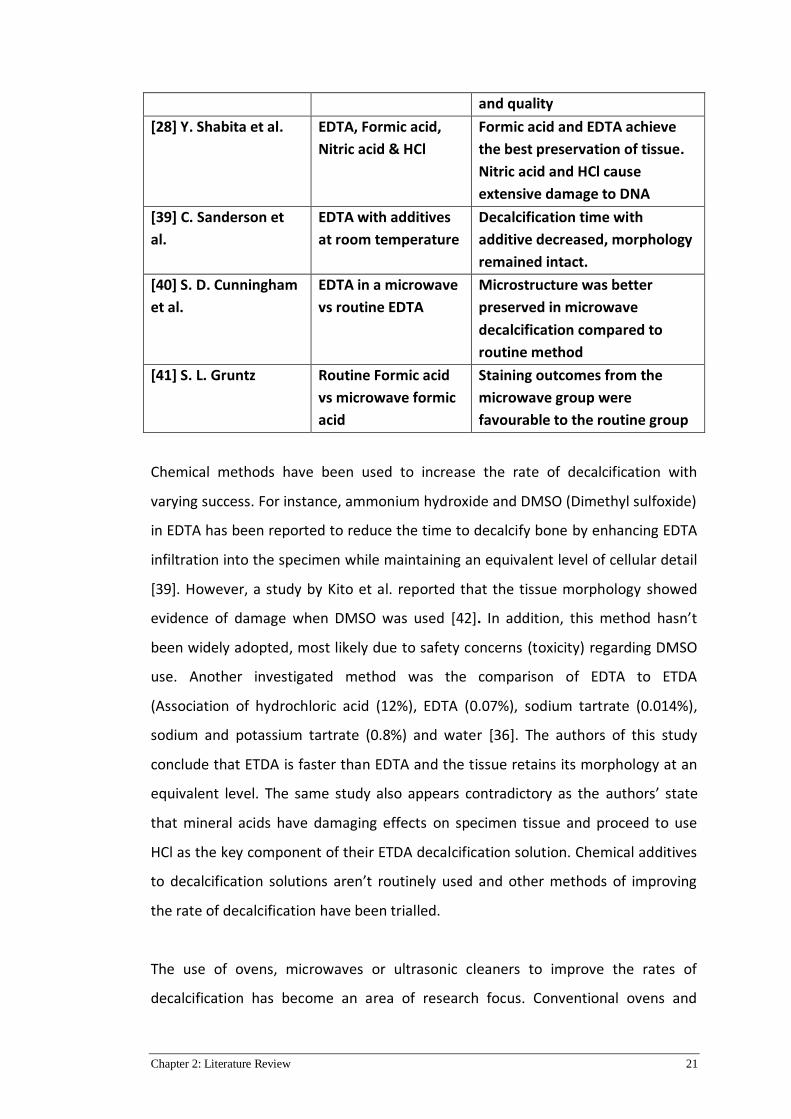
Table 2-4: Summary of rapid decalcification attempts and morphology
preservation
Author Methodology Findings
[15] R. A. Skinner et al. Formic acid at room
or fridge temperature
Formic acid did not negatively
affect staining results.
[20] V.J. Madden et al. EDTA in a microwave
and room
temperature
Microwave decalcification at
37°C did not effect
microstructure of cells compared
to routine 4°C method
[22] S. Jimson et al. EDTA, HCl, nitric acid,
formic acid
Concludes formic acid is the
most practical acid for speed
Chapter 2: Literature Review 21
and quality
[28] Y. Shabita et al. EDTA, Formic acid,
Nitric acid & HCl
Formic acid and EDTA achieve
the best preservation of tissue.
Nitric acid and HCl cause
extensive damage to DNA
[39] C. Sanderson et
al.
EDTA with additives
at room temperature
Decalcification time with
additive decreased, morphology
remained intact.
[40] S. D. Cunningham
et al.
EDTA in a microwave
vs routine EDTA
Microstructure was better
preserved in microwave
decalcification compared to
routine method
[41] S. L. Gruntz Routine Formic acid
vs microwave formic
acid
Staining outcomes from the
microwave group were
favourable to the routine group
Chemical methods have been used to increase the rate of decalcification with
varying success. For instance, ammonium hydroxide and DMSO (Dimethyl sulfoxide)
in EDTA has been reported to reduce the time to decalcify bone by enhancing EDTA
infiltration into the specimen while maintaining an equivalent level of cellular detail
[39]. However, a study by Kito et al. reported that the tissue morphology showed
evidence of damage when DMSO was used [42]. In addition, this method hasn’t
been widely adopted, most likely due to safety concerns (toxicity) regarding DMSO
use. Another investigated method was the comparison of EDTA to ETDA
(Association of hydrochloric acid (12%), EDTA (0.07%), sodium tartrate (0.014%),
sodium and potassium tartrate (0.8%) and water [36]. The authors of this study
conclude that ETDA is faster than EDTA and the tissue retains its morphology at an
equivalent level. The same study also appears contradictory as the authors’ state
that mineral acids have damaging effects on specimen tissue and proceed to use
HCl as the key component of their ETDA decalcification solution. Chemical additives
to decalcification solutions aren’t routinely used and other methods of improving
the rate of decalcification have been trialled.
The use of ovens, microwaves or ultrasonic cleaners to improve the rates of
decalcification has become an area of research focus. Conventional ovens and
22 Chapter 2: Literature Review
microwave ovens are used to increase the temperature of decalcification and
therefore increase the diffusion rate of solution through bone [43]. This will be
covered in more detail in section 2.5. Similarly, rapid decalcification using an
ultrasonic cleaner with formic acid has also been trialled [44]. Ultrasonic cleaners
and microwaves use the same principle to increase the rate of decalcification,
however, in the ultrasonic cleaner the creation of waves increases the molecular
activity of the solution resulting in more interactions between the bone and
decalcification solution [44]. A study by Hideki et al. reported that an ultrasonic
cleaner with formic acid and 30% mannitol decalcified bone retaining its antigens,
but this study did not compare their findings with a control group (standard
histology protocol). This study also acknowledged the limitations of ultrasonic
cleaners, stating that temperature distribution is not uniform and requires frequent
recalibration [44]. Based on these studies, the goal of this current study is to
develop an optimal rapid decalcification method using a microwave to reduce the
time required for bone decalcification without compromising tissue morphology.
2.5 MICROWAVES IN RAPID DECALCIFICATION
In recent years microwaves have been introduced as a new method to increase
decalcification rates in bone. Several studies have shown that a microwave used
under certain conditions can result in rapidly decreased decalcification times while
still preserving the integrity of the studied tissues [19], [20], [26], [29], [40], [44].
The temperatures used in microwave studies vary from 25°C, 37°C, 45°C, 60°C
[43][45][46] [21] or haven’t been specifically recorded [22], [37]. For instance, even
though previous reports suggested that using strong mineral acids such as
hydrochloric or nitric for decalcification were detrimental to tissue morphology
[20], [22], [24], [26], [44], other studies have reported that the use of the same
acids can yield acceptable results when used in combination with a conventional
microwave [26], [12]. EDTA has also been explored using a microwave to increase
the rate of decalcification. These studies showed no detrimental effect on tissue
morphology, however, they only focused on one antigen for IHC or only one
temperature for decalcification [20], [21], [24], [26], [34], [37], [38], [40], [41], [44]–

Chapter 2: Literature Review 23
[47]. It should be also mentioned that the antigens investigated by those studies
were robust and highly specific to the type of bone being tested. A study performed
on mice skulls used EDTA to assess temperatures and their effects on nucleic
stability and β-Galactosidase activity at 37°C, 42°C and 50°C [48], the authors
concluded that at 42°C nucleic acid and amino acid stability was achieved. Although
microwaves have become the most reliable method to decrease the decalcification
time of bone [22], [49], despite that, these studies have a narrow focus on the
conditions, acids and bone specimens used. Studies need to be performed that
include a range of antigens from matrix proteins to highly specific cell markers.
Investigating these antigens would provide more insight into the potential benefits
and implementation of microwave induced rapid decalcification. The
aforementioned suggests the rapid decalcification method using a microwave
shows promise, but requires further investigation, which forms the merit for the
thesis.
Table 2 – 5: Summary table of microwave decalcification experiments
Author Methodology Findings
[21] E. Keithley et al. Routine EDTA vs
Microwave EDTA
Immunohistochemistry was not
effected by the microwave
compared to the routine method
[24] V.J. Madden et al. EDTA in a microwave
and room
temperature
Microwave decalcification at
37°C did not effect
microstructure of cells compared
to routine 4°C method
[26] G. Callis et al. EDTA, HCl, nitric acid,
formic acid
Concludes microwave
decalcification is faster and
staining is adequate
[37] G. Travlos EDTA and mineral
acids
Mineral acids cause damage to
tissue morphology, EDTA is
favourable however, heat
smearing of nuclei may occur
[38] J. Neves et al. EDTA and nitric acid
in a microwave
EDTA decalcification showed
well preserved tissue

24 Chapter 2: Literature Review
morphology, nitric acid showed
evidence of tissue damage.
[40] S. D. Cunningham
et al.
EDTA in a microwave
vs routine EDTA
Microstructure was better
preserved in microwave
decalcification compared to
routine method
[41] S. L. Gruntz Routine Formic acid
vs microwave formic
acid
Staining outcomes from the
microwave group were
favourable to the routine group
[44] H. Hatta et al. Formic acid in
sonicator
Staining results for both H & E
and IHC showed evidence of
well-preserved tissue and
antigen morphology
[45] E. C. Weisberger
et al.
Microwave
decalcification for in
house use
Staining results were adequate
for clinical use and microwaves
reduced decalcification time
[46] P. Tinling EDTA microwave vs
routine method
Microwaves had no observable
negative consequences on tissue
morphology
[47] W. Howat et al. Formalin fixation of
fresh tissue in a
microwave
Microwave use did not have any
negative effects on tissue
morphology or DNA integrity.

Chapter 3: Research Design 25
Chapter 3: Research Design
3.1 PREFACE
This chapter describes the research design and methodology that was used in
testing the hypothesis of this study.
3.2 RESEARCH DESIGN
3.2.1 Aim 1: To Monitor the Rate of Bone Decalcification Using a Micro CT
system
Sections of female Merino sheep, the intact rats and mice tibiae (n = 3 per group)
were decalcified using conventional and rapid decalcification methods. Tibae were
chosen as a model because it is commonly used in bone research [50], [51]. Intact
tibiae were harvested from sheep, and then sectioned into smaller fragments to
ensure each experimental group consisted of tibia sections from 3 different animals.
To minimize variability, specimens from Wistar rats and C57Bl6 mice, were matched
by age and gender. Groups of specimens were decalcified in 10% EDTA, 5% nitric,
10% hydrochloric, and 10% formic acid solutions as they are the most commonly
used acids for decalcification. For a rapid decalcification study groups of specimens
were decalcified at 37°C in a microwave designed for this purpose (KOS Milestone,
Abacus) and compared to the specimens decalcified using the standard protocol at
4°C and 25°C methods (control groups). The rate of the decalcification was
monitored using µCT. First, a pilot study was performed to determine the frequency
of time points for µCT scanning as shown in section 3.3 of this chapter (Table 1).
Results from this pilot study were used to conduct the main study.
3.2.2 Aim 2: To Investigate if Rapid Decalcification Has a Detrimental Effect on
the Tissue Morphology & Antigenicity
After Aim 1 was complete the tissue integrity of the specimens was analysed using
histological analyses. Specimens were embedded in paraffin wax and sectioned. To
determine the overall tissue morphology all specimens were stained with

26 Chapter 3: Research Design
hematoxylin and eosin (H & E), and safranin-O staining was used for cartilage
viability. The IHC analysis focused on protein viability using collagen-1 and vWF
antibodies. Collagen type 1 (col-1) is the main structural protein in bone matrix, this
protein gives bone its tensile strength and serves as an organisational framework
for the mineral structure. VonWillebrand factor (vWF) is part of the clotting cascade
and is used in orthopaedic studies to assess vasculature throughout bone as part of
the mineralisation and remodelling process, it is highly specific to activated
epithelial cells. These markers served as quality control for the tissues that undergo
rapid decalcification. Results from the rapidly decalcified groups were compared to
the staining of the current gold standard (EDTA 4°C).
3.3 MATERIALS & METHODS
3.3.1 Specimen Harvesting & Fixation
All animal samples were acquired through the tissue use notification program of
the local animal ethics committee, Queensland University of Technology,
Brisbane, QLD (# 1400000377).
Mice, rat and sheep tibias were harvested from sacrificed animals, mice and rat
tibiae were left fully intact and placed straight into 4% paraformaldehyde solution
(Sigma-Aldrich, Castle Hill, NSW) immediately after the sacrifice. A total of 3 tibias
were collected from different animals per treatment group. Sheep tibias were
sectioned into thin slices using an EXAKT 310 diamond cutter band saw and weighed
with a microbalance to make sure that the weight of each specimen was
approximately 1.65 grams. Excess soft tissue was stripped away from the bone to
allow for greater surface area and perfusion of fixative solution into the bone to
maximise antigen preservation. Fixation was done at 4°C placed on agitation
equipment; fixation times were: for mice 24 hours, for rats 48 hours and for sheep
96 hours. Specimens were stored in 70% ethanol post fixation at 4°C to preserve
antigenicity.

Chapter 3: Research Design 27
3.3.2 Pilot Study
All samples undergoing decalcification were weighed and photographed, and then
placed into the individual specimen containers with 50mL of respective
decalcification solution. A specimen from each group was scanned at selected
intervals to determine the total time required to reach complete decalcification. A
pilot study was performed using one specimen from each group to get an
approximate estimate of the time points that need to be monitored before
performing the study on a larger scale. Briefly, specimens were placed either into
EDTA, formic acid, hydrochloric acid or nitric acid at 4°C, 25°C using agitation, and at
25°C and 37°C in a KOS microwave (KOS rapid microwave tissue processor,
Milestone) at 20% power (150 watts) while being stirred at 400rpm. An additional
study comparing agitation and non-agitated decalcification was tested at 4°C for the
acid groups for the sheep pilot study to assess if it decreased the rate of
decalcification. Sheep, rat and mice tibia were scanned by µCT (µCT40; Scanco
Medical, Bassersdorf, Switzerland) with an isotropic voxel size at 30µm, 16µm, and
12µm respectively, using 70kV energy and 200-ms integration time. The frequency
of specimen scanning is indicated in the Table 3-1. All bones were
deemed decalcified when bone volume (BV) had reached 0 (%) value as measured
by µCT.
Figure 3-1: An example of how a sheep tibia was sectioned. Bone from the
diaphysis was stripped of soft tissue and sectioned into slices that were
approximately the same weight and size.
28 Chapter 3: Research Design
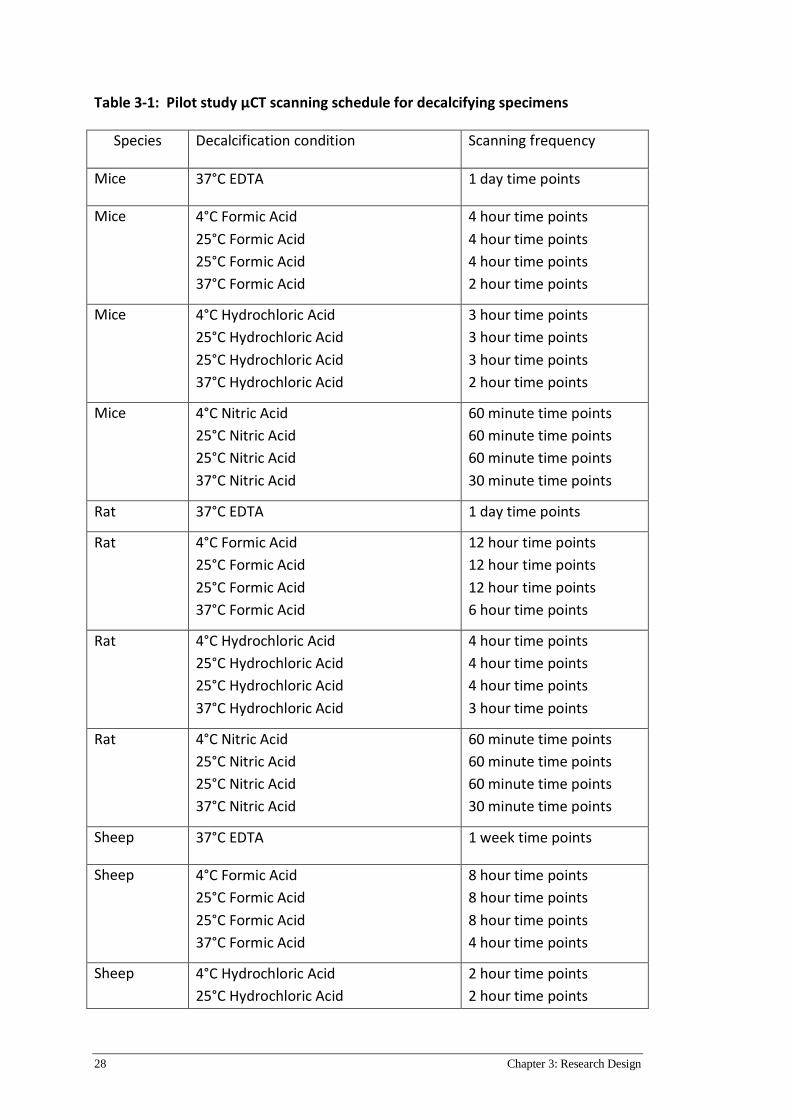
Table 3-1: Pilot study µCT scanning schedule for decalcifying specimens
Species Decalcification condition Scanning frequency
Mice 37°C EDTA 1 day time points
Mice 4°C Formic Acid
25°C Formic Acid
25°C Formic Acid
37°C Formic Acid
4 hour time points
4 hour time points
4 hour time points
2 hour time points
Mice 4°C Hydrochloric Acid
25°C Hydrochloric Acid
25°C Hydrochloric Acid
37°C Hydrochloric Acid
3 hour time points
3 hour time points
3 hour time points
2 hour time points
Mice 4°C Nitric Acid
25°C Nitric Acid
25°C Nitric Acid
37°C Nitric Acid
60 minute time points
60 minute time points
60 minute time points
30 minute time points
Rat 37°C EDTA 1 day time points
Rat 4°C Formic Acid
25°C Formic Acid
25°C Formic Acid
37°C Formic Acid
12 hour time points
12 hour time points
12 hour time points
6 hour time points
Rat 4°C Hydrochloric Acid
25°C Hydrochloric Acid
25°C Hydrochloric Acid
37°C Hydrochloric Acid
4 hour time points
4 hour time points
4 hour time points
3 hour time points
Rat 4°C Nitric Acid
25°C Nitric Acid
25°C Nitric Acid
37°C Nitric Acid
60 minute time points
60 minute time points
60 minute time points
30 minute time points
Sheep 37°C EDTA 1 week time points
Sheep 4°C Formic Acid
25°C Formic Acid
25°C Formic Acid
37°C Formic Acid
8 hour time points
8 hour time points
8 hour time points
4 hour time points
Sheep 4°C Hydrochloric Acid
25°C Hydrochloric Acid
2 hour time points
2 hour time points

Chapter 3: Research Design 29
25°C Hydrochloric Acid
37°C Hydrochloric Acid
2 hour time points
1 hour time points
Sheep 4°C Nitric Acid
25°C Nitric Acid
25°C Nitric Acid
37°C Nitric Acid
60 minute time points
60 minute time points
60 minute time points
30 minute time points
3.3.3 Decalcification & Micro CT Analysis
After fixation specimens were divided up into their respective groups for
decalcification as shown in Table 3-2.
Table 3-2: Decalcification specimen groups, species and conditions
Temperature Species Acids Specimen Number
4° Conventional
Decalcification
Benchtop method
Mouse
Rat
Sheep
10% EDTA
10% Formic Acid
10% HCL
5% Nitric Acid
n = 3 per acid group
and temperature.
e.g. 4°C EDTA n = 3
25° Conventional
Decalcification
Benchtop method
Mouse
Rat
Sheep
10% EDTA
10% Formic Acid
10% HCl
5% Nitric Acid
n = 3 per acid group
and temperature.
e.g. 25°C EDTA n = 3
25° Rapid
Decalcification
Microwave
Method
Mouse
Rat
Sheep
10% EDTA
10% Formic Acid
10% HCl
5% Nitric Acid
n = 3 per acid group
and temperature.
e.g. 25°C EDTA n = 3
37° Rapid
Decalcification
Microwave
Method
Mouse
Rat
Sheep
10% EDTA
10% Formic Acid
10% HCL
5% Nitric Acid
n = 3 per acid group
and temperature.
e.g. 37°C EDTA n = 3
Prior to each time point specimens were weighed, photographed and the pH of the
decalcification solution was measured before the specimen was scanned by µCT

30 Chapter 3: Research Design
with the set parameters as indicated in the section 3.3.2. After each micro CT scan
the specimens were placed back into their decalcification container until the next
time point, and the entire procedure was repeated. Specimens in EDTA had their
decalcification solutions changed on weekly basis, acid groups were scheduled to be
changed if the pH was measured to be greater than 5.0, however, this did not occur
in this study and as a result acids were not replenished. All bones were
deemed decalcified when bone volume (BV) had reached 0 (%) value as measured
by µCT. After reaching endpoints the nitric, HCL and formic acid specimens were
neutralised in their specimen containers using sodium bicarbonate powder until the
pH was neutral. Specimens were then washed in running tap water for 4 hours and
placed into 70% ethanol in preparation for paraffin wax embedding.
After the time points were established in the pilot study the main study was
conducted. Mice, rat and sheep tibial specimens were organised into groups of 3
specimens as shown in Table 3-1 & 3-2. Microwave and µCT protocols were the
same as for the pilot study described above. Results in chapter 4.2.1 demonstrate
that decalcification at 25°C in the KOS milestone microwave was the same as 25°C
on the benchtop. Therefore, the use of a microwave at 25°C was discontinued from
the remainder of the study as it did not offer any differences to the benchtop
decalcification. Table 3.3 shows an amended experimental plan taking into account
the removal of the 25°C microwave group.
Table 3-3: Micro CT time points for assessing decalcification progress
TIMEPOINTS TO BE SCANNED TO MONITOR DECLALCIFCATION PROGRESS
Species Acid Temperature Time points
Mice 10%
EDTA
4°C
25°C
37°C
t= 0 & every 24 hours
t= 0 & every 24 hours
t= 0 & every 12 hours
Mice 10%
Formic
4°C
25°C
37°C
t= 0 & every 4 hours
t= 0 & every 4 hours
t= 0 & every 2 hours
Mice 10% HCl 4°C
25°C
t= 0 & every 4 hours
t= 0 & every 4 hours

Chapter 3: Research Design 31
37°C t= 0 & every 2 hours
Mice 5% Nitric 4°C
25°C
37°C
t= 0 & every 2 hours
t= 0 & every 2 hours
t= 0 & every 1 hours
Rats EDTA 4°C
25°C
37°C
t= 0 & every 1 week
t= 0 & every 1 week
t= 0 & every 1 day
Rats Formic 4°C
25°C
37°C
t= 0 & every 12 hours
t= 0 & every 12 hours
t= 0 & every 6 hours
Rats HCl 4°C
25°C
37°C
t= 0 & every 4 hours
t= 0 & every 4 hours
t= 0 & every 3 hours
Rats Nitric 4°C
25°C
37°C
t= 0 & every 1 hour
t= 0 & every 1 hour
t= 0 & every 30 mins
Sheep EDTA 4°C
25°C
37°C
t= 0 & every 2 weeks
t= 0 & every 2 weeks
t= 0 & every 1 week
Sheep Formic 4°C
25°C
37°C
t= 0 & every 8 hours
t= 0 & every 8 hours
t= 0 & every 4 hours
Sheep HCl 4°C
25°C
37°C
t= 0 & every 2 hours
t= 0 & every 2 hours
t= 0 & every 1 hour
Sheep Nitric 4°C
25°C
37°C
t= 0 & every 1 hour
t= 0 & every 1 hour
t= 0 & every 30 mins
3.3.4 Histology
Specimens were processed in an Excelsior S3 Tissue processor (Thermoscientific,
Scoresby Vic) by dehydrating through graded ethanol solutions, cleared in xylene
and infiltrated with paraffin wax (Table 3-4). After processing specimens were
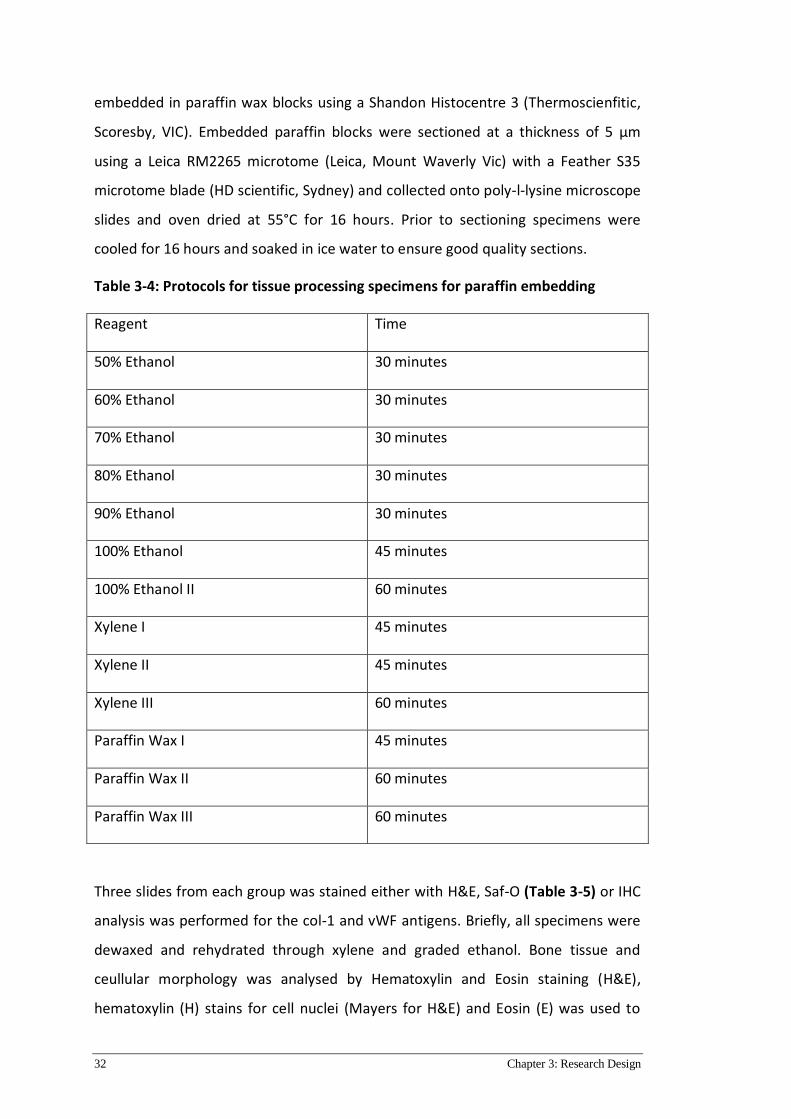
32 Chapter 3: Research Design
embedded in paraffin wax blocks using a Shandon Histocentre 3 (Thermoscienfitic,
Scoresby, VIC). Embedded paraffin blocks were sectioned at a thickness of 5 µm
using a Leica RM2265 microtome (Leica, Mount Waverly Vic) with a Feather S35
microtome blade (HD scientific, Sydney) and collected onto poly-l-lysine microscope
slides and oven dried at 55°C for 16 hours. Prior to sectioning specimens were
cooled for 16 hours and soaked in ice water to ensure good quality sections.
Table 3-4: Protocols for tissue processing specimens for paraffin embedding
Reagent Time
50% Ethanol 30 minutes
60% Ethanol 30 minutes
70% Ethanol 30 minutes
80% Ethanol 30 minutes
90% Ethanol 30 minutes
100% Ethanol 45 minutes
100% Ethanol II 60 minutes
Xylene I 45 minutes
Xylene II 45 minutes
Xylene III 60 minutes
Paraffin Wax I 45 minutes
Paraffin Wax II 60 minutes
Paraffin Wax III 60 minutes
Three slides from each group was stained either with H&E, Saf-O (Table 3-5) or IHC
analysis was performed for the col-1 and vWF antigens. Briefly, all specimens were
dewaxed and rehydrated through xylene and graded ethanol. Bone tissue and
ceullular morphology was analysed by Hematoxylin and Eosin staining (H&E),
hematoxylin (H) stains for cell nuclei (Mayers for H&E) and Eosin (E) was used to
Chapter 3: Research Design 33
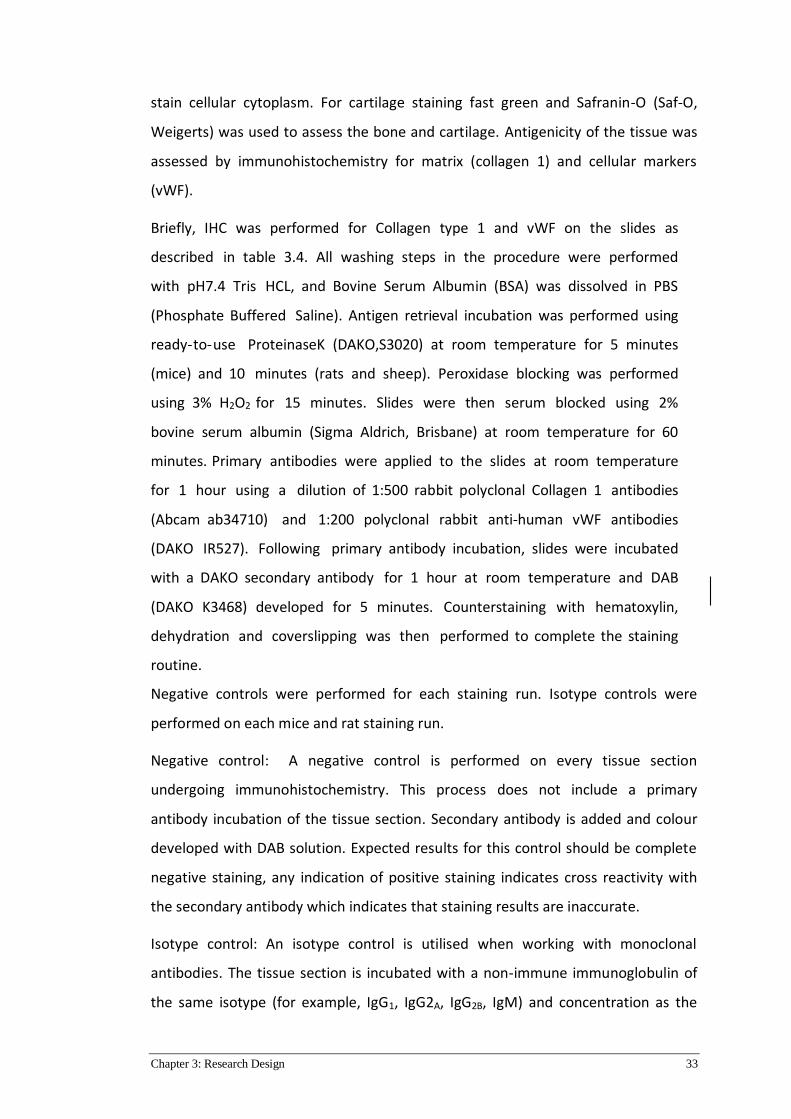
stain cellular cytoplasm. For cartilage staining fast green and Safranin-O (Saf-O,
Weigerts) was used to assess the bone and cartilage. Antigenicity of the tissue was
assessed by immunohistochemistry for matrix (collagen 1) and cellular markers
(vWF).
Briefly, IHC was performed for Collagen type 1 and vWF on the slides as
described in table 3.4. All washing steps in the procedure were performed
with pH7.4 Tris HCL, and Bovine Serum Albumin (BSA) was dissolved in PBS
(Phosphate Buffered Saline). Antigen retrieval incubation was performed using
ready-to-use ProteinaseK (DAKO,S3020) at room temperature for 5 minutes
(mice) and 10 minutes (rats and sheep). Peroxidase blocking was performed
using 3% H2O2 for 15 minutes. Slides were then serum blocked using 2%
bovine serum albumin (Sigma Aldrich, Brisbane) at room temperature for 60
minutes. Primary antibodies were applied to the slides at room temperature
for 1 hour using a dilution of 1:500 rabbit polyclonal Collagen 1 antibodies
(Abcam ab34710) and 1:200 polyclonal rabbit anti-human vWF antibodies
(DAKO IR527). Following primary antibody incubation, slides were incubated
with a DAKO secondary antibody for 1 hour at room temperature and DAB
(DAKO K3468) developed for 5 minutes. Counterstaining with hematoxylin,
dehydration and coverslipping was then performed to complete the staining
routine.
Negative controls were performed for each staining run. Isotype controls were
performed on each mice and rat staining run.
Negative control: A negative control is performed on every tissue section
undergoing immunohistochemistry. This process does not include a primary
antibody incubation of the tissue section. Secondary antibody is added and colour
developed with DAB solution. Expected results for this control should be complete
negative staining, any indication of positive staining indicates cross reactivity with
the secondary antibody which indicates that staining results are inaccurate.
Isotype control: An isotype control is utilised when working with monoclonal
antibodies. The tissue section is incubated with a non-immune immunoglobulin of
the same isotype (for example, IgG1, IgG2A, IgG2B, IgM) and concentration as the
34 Chapter 3: Research Design
primary monoclonal antibody. This is performed to identify if positive staining was
caused by non-specific interactions of immunoglobulin molecules with the tissue
section. Positive staining using this control indicates antibody cross reactivity with
the tissue type which indicates a potential to interpret the results as a false positive.
This is only performed if the origin of the antibodies used has cross reactivity
potential with the target species.
Results were not interpreted if the negative controls or isotype control failed. After
staining slides were then dehydrated through graded ethanol and cleared with
xylene and finally were mounted using Eukitt mounting medium (Sigma-Aldrich,
Castle Hill, NSW) and coverslipped using a 52 x 20mm coverslip (Thermoscientific,
Scoresby, VIC).
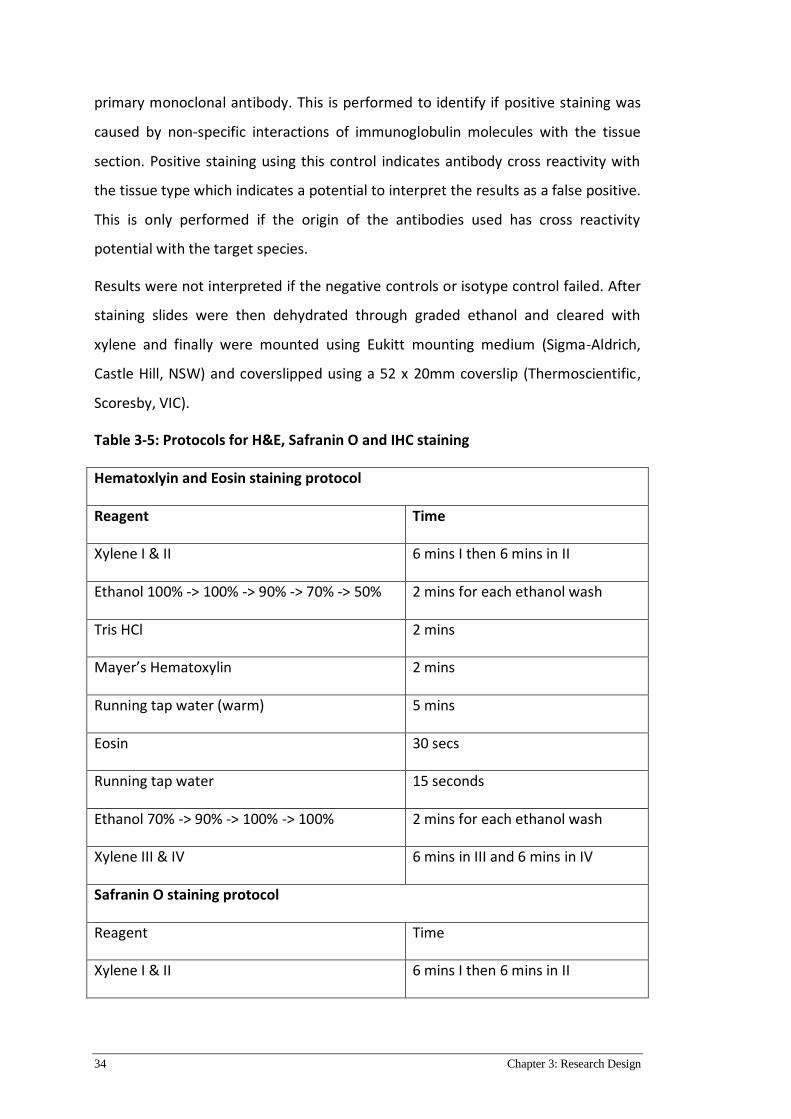
Table 3-5: Protocols for H&E, Safranin O and IHC staining
Hematoxlyin and Eosin staining protocol
Reagent Time
Xylene I & II 6 mins I then 6 mins in II
Ethanol 100% -> 100% -> 90% -> 70% -> 50% 2 mins for each ethanol wash
Tris HCl 2 mins
Mayer’s Hematoxylin 2 mins
Running tap water (warm) 5 mins
Eosin 30 secs
Running tap water 15 seconds
Ethanol 70% -> 90% -> 100% -> 100% 2 mins for each ethanol wash
Xylene III & IV 6 mins in III and 6 mins in IV
Safranin O staining protocol
Reagent Time
Xylene I & II 6 mins I then 6 mins in II
Chapter 3: Research Design 35
Ethanol 100% -> 100% -> 90% -> 70% ->50% 2 mins for each ethanol wash
Running tap water 2 mins
Weigerts Iron Hematoxylin 2 mins
2% Acid alcohol 30 secs
Running tap water (warm) 5 mins
0.05% Fast Green FCF 5 mins
1% Acetic Acid 30 secs
0.1% Safranin O 5 mins
Ethanol 100% -> 100% -> 100% 2 mins for each ethanol wash
Xylene III & IV 6 mins in III and 6 mins in IV
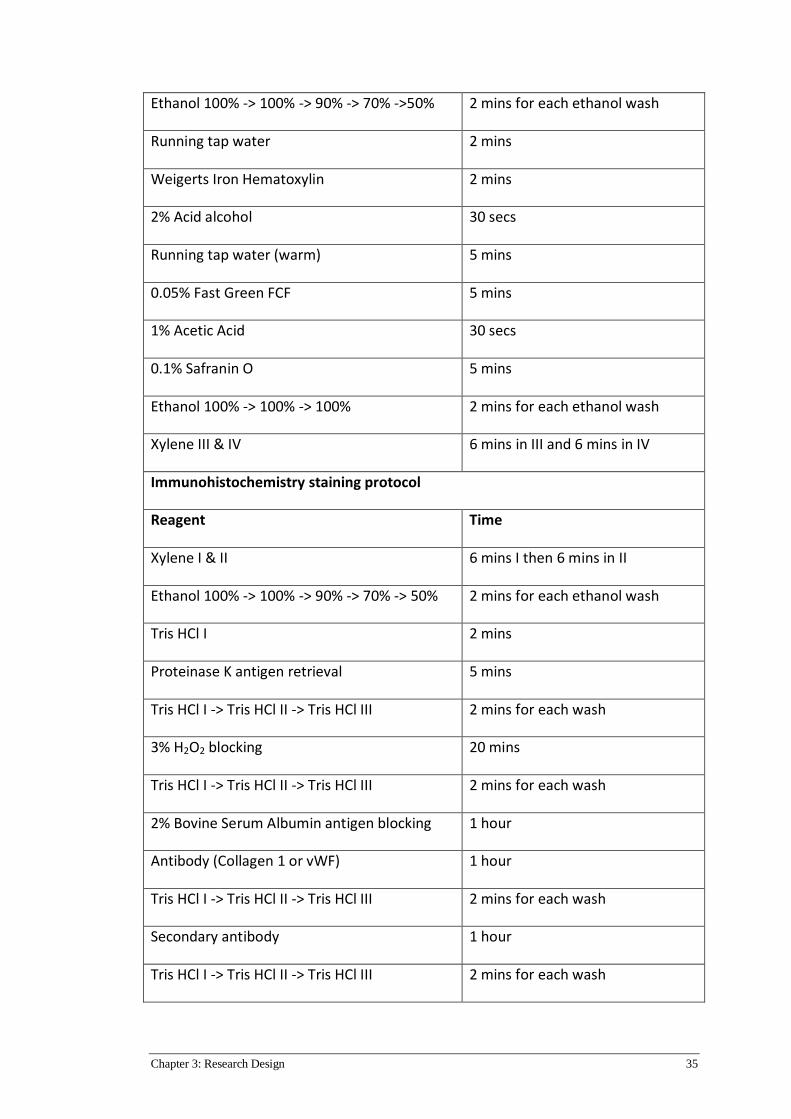
Immunohistochemistry staining protocol
Reagent Time
Xylene I & II 6 mins I then 6 mins in II
Ethanol 100% -> 100% -> 90% -> 70% -> 50% 2 mins for each ethanol wash
Tris HCl I 2 mins
Proteinase K antigen retrieval 5 mins
Tris HCl I -> Tris HCl II -> Tris HCl III 2 mins for each wash
3% H2O2 blocking 20 mins
Tris HCl I -> Tris HCl II -> Tris HCl III 2 mins for each wash
2% Bovine Serum Albumin antigen blocking 1 hour
Antibody (Collagen 1 or vWF) 1 hour
Tris HCl I -> Tris HCl II -> Tris HCl III 2 mins for each wash
Secondary antibody 1 hour
Tris HCl I -> Tris HCl II -> Tris HCl III 2 mins for each wash

36 Chapter 3: Research Design
DAB substrate 5 mins
Tris HCl I -> Tris HCl II -> Tris HCl III 2 mins for each wash
Mayers hematoxylin 2 mins
Running tap water (warm) 5 mins
Ethanol 70% -> 90% -> 100% -> 100% 2 mins for each ethanol wash
Xylene III & IV 6 mins in III and 6 mins in IV

Chapter 4: Results of decalcification times determined by Micro CT analysis 37
Chapter 4: Results of decalcification times
determined by Micro CT
analysis
4.1 PREFACE
This chapter investigates an approximate time frame for complete decalcification of
specimens. Briefly mice, rat and sheep specimens were decalcified and scanned by
micro-CT at determined intervals.
4.2 MICRO CT DATA & DECALCIFICATION TIMES
4.2.1 Pilot Study
A pilot study was performed to estimate an approximate rapid decalcification time
for formic, hydrochloric and nitric acid using one specimen per group from all
species. All specimens were first decalcified and scanned using µCT as described in
chapter 3 section 3.3.2. Results from the pilot study demonstrated that there was
no difference between microwave and benchtop decalcification at 25°C and as a
result this particular group was discontinued from further analysis of the main
study. The results from the pilot study confirmed the selection of time points and
these were used for the remainder of the study (Figure 4-1).
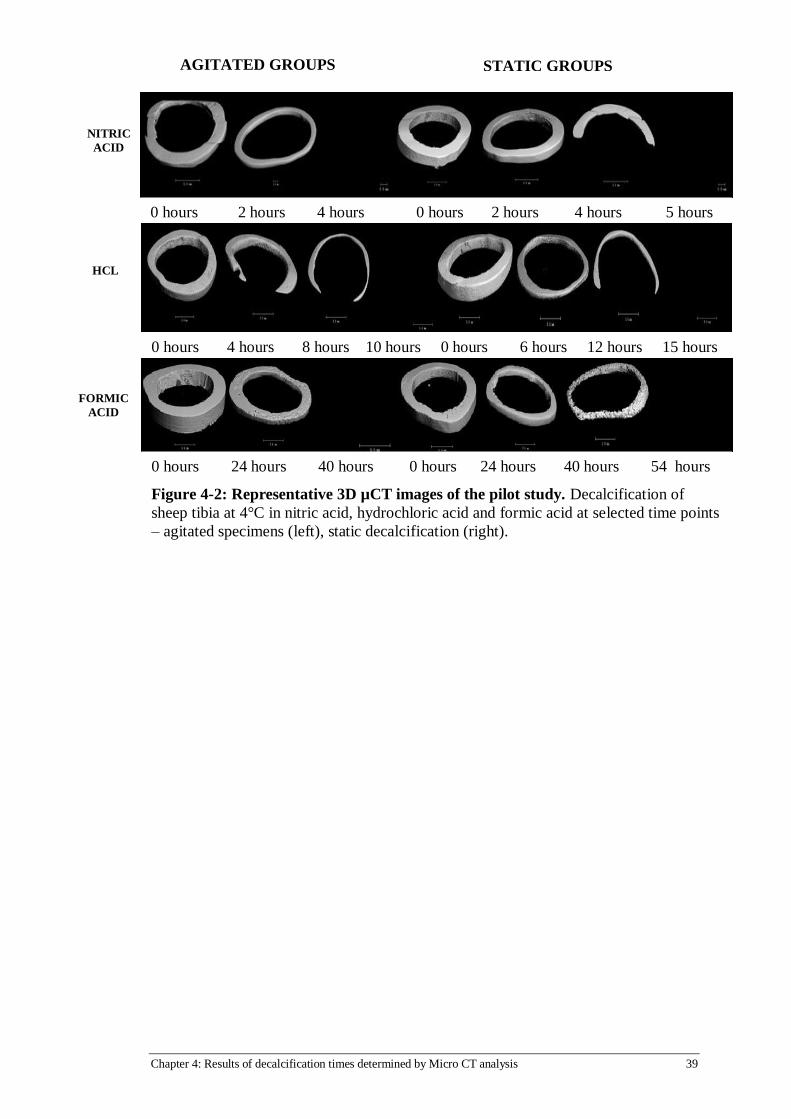
Sheep specimens were subjected to an additional test during the pilot study, they
were decalcified at 4°C with and without agitation. Results from this study
demonstrated that agitation reduced the time required to reach complete
decalcification (Figure 4-2). Therefore, for the remainder of this study agitation was
applied to all the specimens to reduce decalcification time.
38 Chapter 4: Results of decalcification times determined by Micro CT analysis
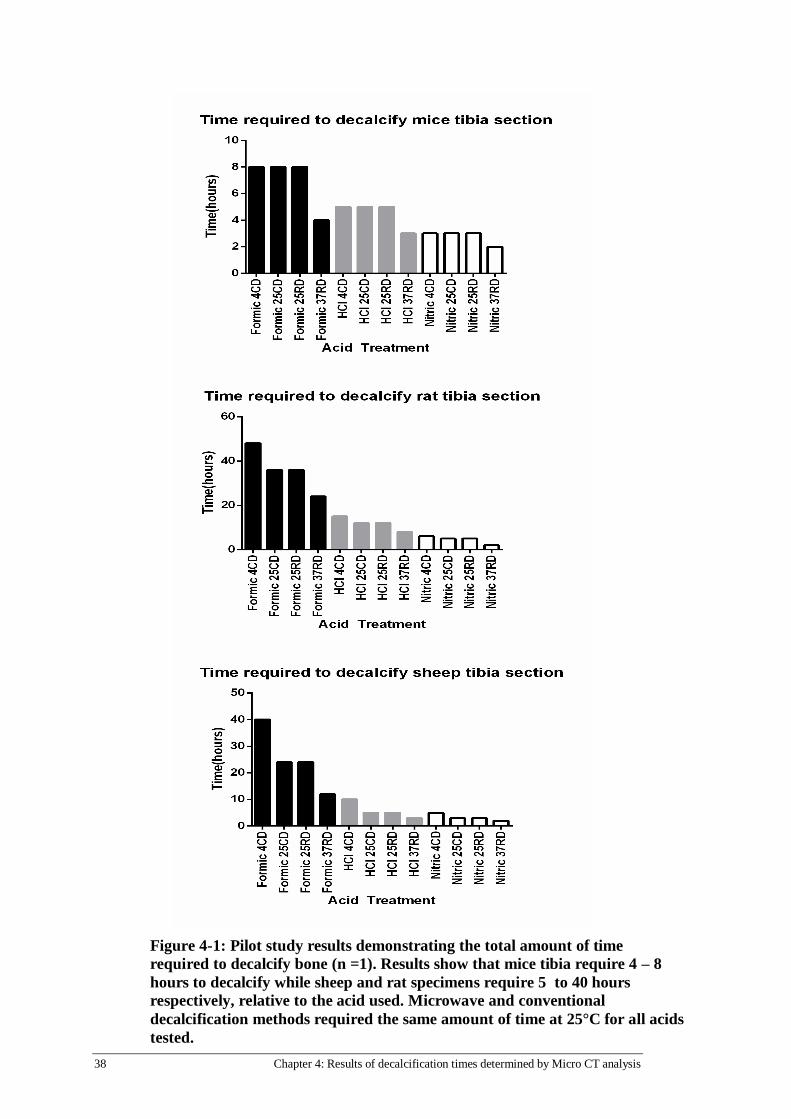
Figure 4-1: Pilot study results demonstrating the total amount of time
required to decalcify bone (n =1). Results show that mice tibia require 4 – 8
hours to decalcify while sheep and rat specimens require 5 to 40 hours
respectively, relative to the acid used. Microwave and conventional
decalcification methods required the same amount of time at 25°C for all acids
tested.
Chapter 4: Results of decalcification times determined by Micro CT analysis 39
0 hours 2 hours 4 hours 0 hours 2 hours 4 hours 5 hours
0 hours 4 hours 8 hours 10 hours 0 hours 6 hours 12 hours 15 hours
0 hours 24 hours 40 hours 0 hours 24 hours 40 hours 54 hours
Figure 4-2: Representative 3D µCT images of the pilot study. Decalcification of
sheep tibia at 4°C in nitric acid, hydrochloric acid and formic acid at selected time points
– agitated specimens (left), static decalcification (right).
FORMIC
ACID
HCL
NITRIC
ACID
AGITATED GROUPS STATIC GROUPS
40 Chapter 4: Results of decalcification times determined by Micro CT analysis
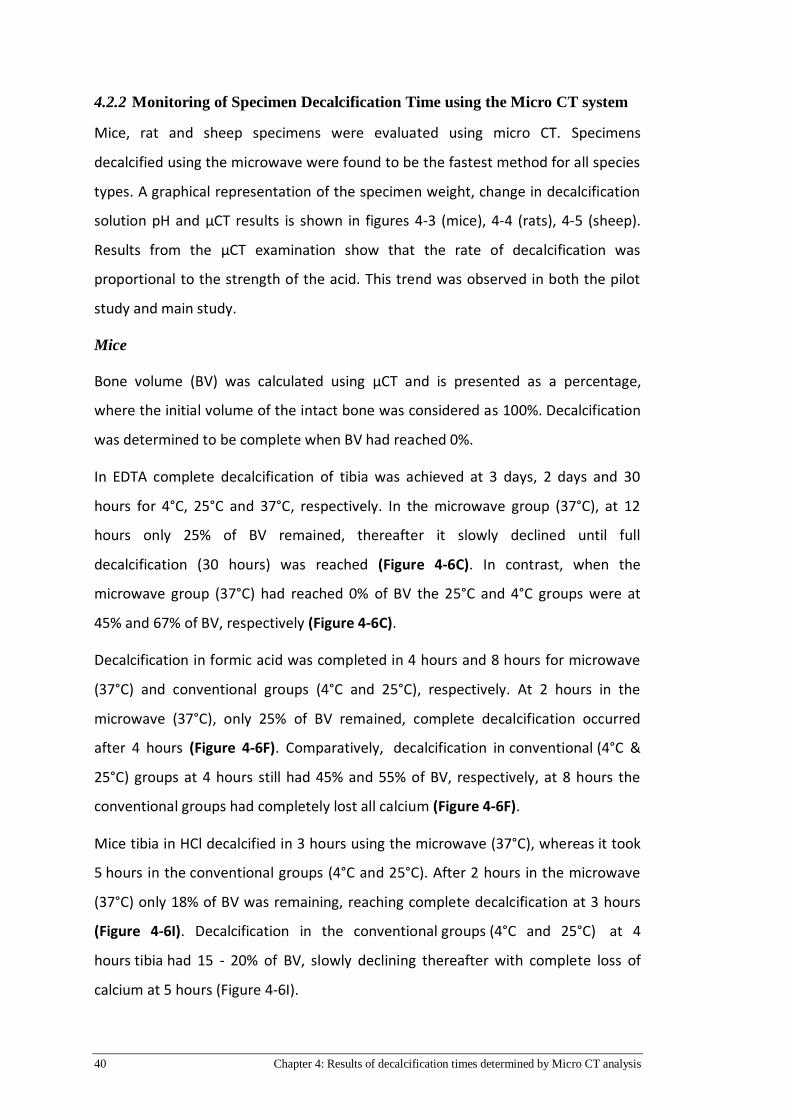
4.2.2 Monitoring of Specimen Decalcification Time using the Micro CT system
Mice, rat and sheep specimens were evaluated using micro CT. Specimens
decalcified using the microwave were found to be the fastest method for all species
types. A graphical representation of the specimen weight, change in decalcification
solution pH and µCT results is shown in figures 4-3 (mice), 4-4 (rats), 4-5 (sheep).
Results from the µCT examination show that the rate of decalcification was
proportional to the strength of the acid. This trend was observed in both the pilot
study and main study.
Mice
Bone volume (BV) was calculated using µCT and is presented as a percentage,
where the initial volume of the intact bone was considered as 100%. Decalcification
was determined to be complete when BV had reached 0%.
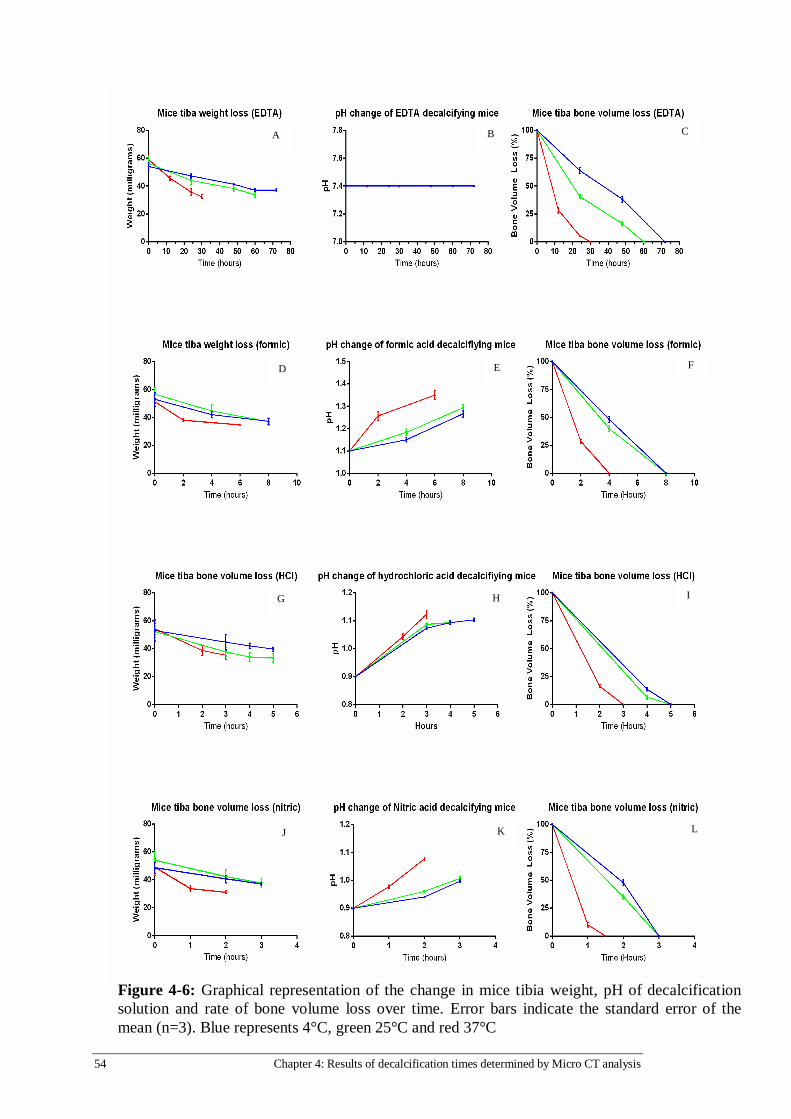
In EDTA complete decalcification of tibia was achieved at 3 days, 2 days and 30
hours for 4°C, 25°C and 37°C, respectively. In the microwave group (37°C), at 12
hours only 25% of BV remained, thereafter it slowly declined until full
decalcification (30 hours) was reached (Figure 4-6C). In contrast, when the
microwave group (37°C) had reached 0% of BV the 25°C and 4°C groups were at
45% and 67% of BV, respectively (Figure 4-6C).
Decalcification in formic acid was completed in 4 hours and 8 hours for microwave
(37°C) and conventional groups (4°C and 25°C), respectively. At 2 hours in the
microwave (37°C), only 25% of BV remained, complete decalcification occurred
after 4 hours (Figure 4-6F). Comparatively, decalcification in conventional (4°C &
25°C) groups at 4 hours still had 45% and 55% of BV, respectively, at 8 hours the
conventional groups had completely lost all calcium (Figure 4-6F).
Mice tibia in HCl decalcified in 3 hours using the microwave (37°C), whereas it took
5 hours in the conventional groups (4°C and 25°C). After 2 hours in the microwave
(37°C) only 18% of BV was remaining, reaching complete decalcification at 3 hours
(Figure 4-6I). Decalcification in the conventional groups (4°C and 25°C) at 4
hours tibia had 15 - 20% of BV, slowly declining thereafter with complete loss of
calcium at 5 hours (Figure 4-6I).

Chapter 4: Results of decalcification times determined by Micro CT analysis 41
In nitric acid mice tibia decalcified in 90 minutes using the microwave (37°C),
whereas it took 3 hours using conventional conditions (4°C and 25°C). The
microwave group (37°C), had only 10% of BV remaining after 1 hour, and reached
complete decalcification after 90 minutes. Furthermore, at 2 hours the conventional
groups (4° and 25°C) had 50% and 37% of BV remaining, respectively. Conventional
groups reached their endpoints at 3 hours.
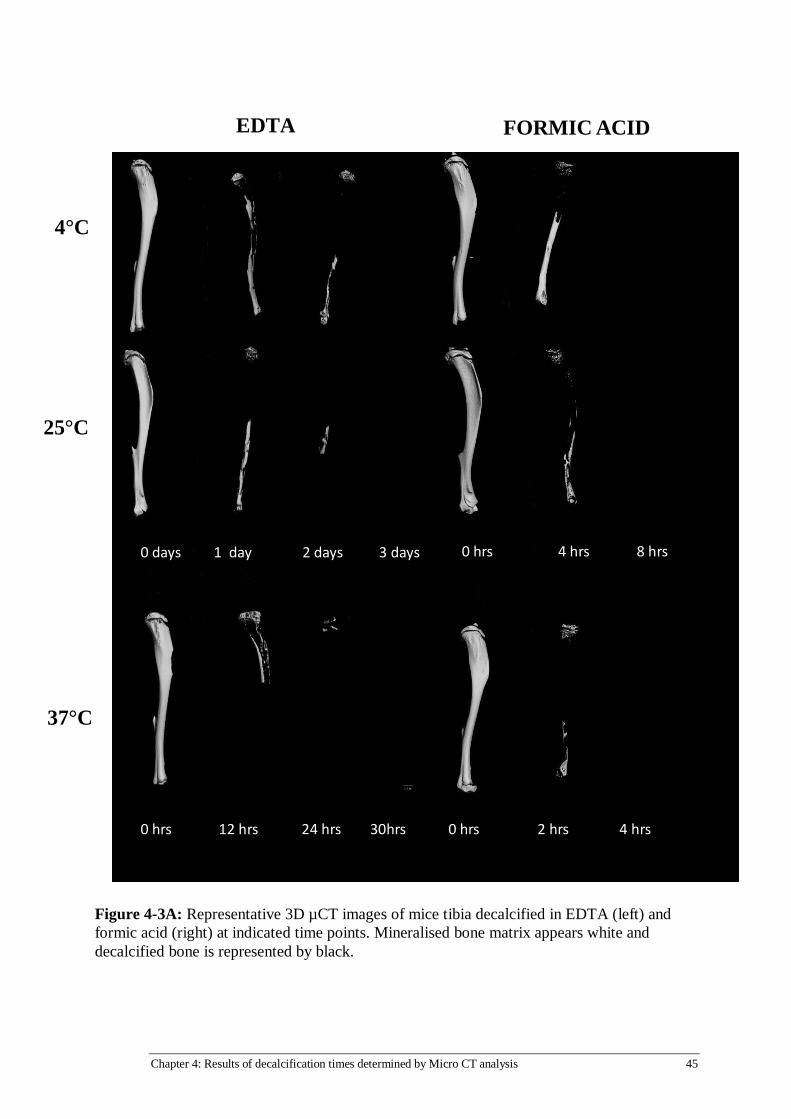
The data was also confirmed by uCT images. In EDTA, formic and nitric acids
specimens had segments of bone still present in the distal, proximal and diaphysis
in late stages of decalcification (Figure 4-3A & B). In contrast, specimens in HCl at 4
hours, proximal and distal ends of the bone were still present, whereas at 5 hours
were completely decalcified (Figure 4-3B). Not surprisingly, the fastest
decalcification times were achieved in specimens subjected to microwave
conditions (37°C) regardless of solution used. In summary nitric acid decalcification
was achieved in 1.5 – 3 hours which was faster compared to HCL (3 – 5 hours),
formic acid (4 – 6 - 8 hours) and EDTA (30 - 50 - 72 hours).
Rats
Rat tibias in EDTA were completely decalcified in 5 days using the microwave (37°C),
contrastingly it took 5 and 4 weeks at 4°C and 25°C, respectively. In the microwave
group (37°C) the rate of BV% loss was rapid when compared to the conventional
groups (4°C & 25°C). At 1 week tibias in the microwave group had completely
decalcified whereas in the conventional groups 50% of BV was remaining (Figure 4-
7C). At 2 weeks the conventional groups (4°C & 25°C) had 25% and 15% of BV
remaining, respectively (Figure 4-7C). Gradually the remaining bone was lost in the
conventional groups until decalcification was complete.
Formic acid decalcified rat tibias in 24 hours using a microwave (37°C), 36 hours at
25°C and 48 hours at 4°C. At 12 hours 15%, 40% and 65% of BV remained for the
37°C, 25°C and 4°C groups (Figure 4-7F). Complete decalcification occurred after 24
hours in the microwave group (37°C), however, in conventional (4°C & 25°C) groups
still had 20% and 15% of BV, respectively (Figure 4-7F). At approximately 25% of BV
the rate of bone loss slowed for all groups.

42 Chapter 4: Results of decalcification times determined by Micro CT analysis
In HCl complete decalcification was achieved at 8 hours, 12 hours and 15 hours for
the 4°C, 25°C and 37°C correspondingly. After 8 hours using the microwave (37°C)
rat tibia was completely decalcified, however, the conventional groups had 10% and
20% of BV remaining, respectively (Figure 4-7I). Decalcification of the remaining
bone was gradual with the 25°C group requiring 12 hours and the 4°C group
needing 15 hours (figure 4-7I).
Nitric acid decalcification of rat tibias was achieved in 2 hours using the microwave
(37°C), whereas it took 3 hours at 25°C and 4 hours at 4°C. At 1 hour the microwave
group (37°C) reached 10% of BV remaining, conversely 50% at 4°C and 45% at 25°C
of BV was present (Figure 4-7L). Complete decalcification occurred at 3 hours and 4
hours for the 25°C group and 4°C group, respectively (Figure 4-7L).
Data from Figure 4-7 was confirmed by µCT images in Figure 4-4. Broadly a trend in
all specimens was observed. In each tibia, the proximal end was the final part of the
bone to decalcify (Figure 4-4A, 4B, 4C, 4D). Interestingly in formic acid (Figure 4-4B)
a coral like appearance of bone was observed in the 25°C and 37°C groups. This was
not observed in any other rat group. Clearly the fastest decalcification times were
achieved in the microwave groups (37°C) irrespective of the solution used. Overall
nitric acid decalcified tibia in 2 – 4 hours, HCl required 8 – 15 hours, formic acid was
completed in 24 – 48 hours and EDTA achieved decalcification in 5 days – 5 weeks.
Sheep
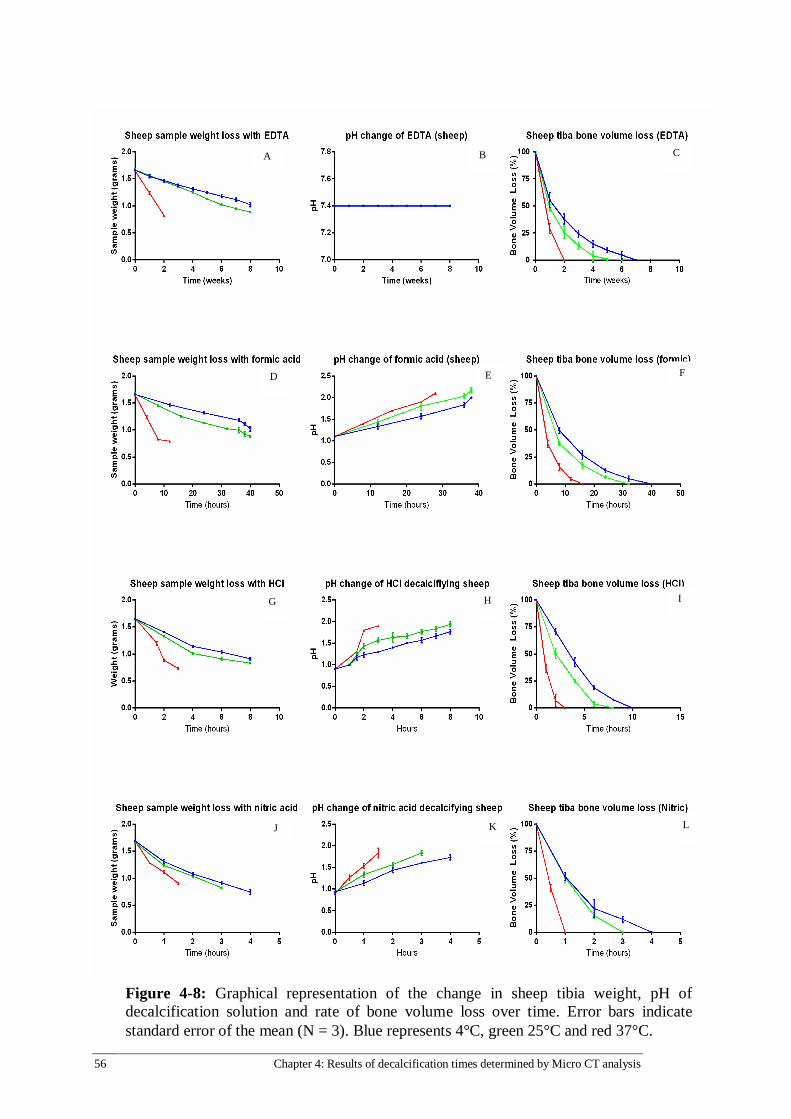
Sheep tibia in EDTA were decalcified in 2 weeks using a microwave (37°C),
comparatively the conventional groups (25°C & 4°C) required 6 and 8 weeks,
respectively. At 2 weeks the conventional groups (25°C & 4°C) 25% and 40% of BV
was remaining respectively, whereas the microwave group (37°C) was at 0% of BV
(figure 4-8C). Decalcification progressed in the conventional groups (4°C & 25°C) at
a steady rate. After 6 weeks the 25°C group was completely decalcified, however,
the 4°C group had 8% of BV remaining (figure 4-8C). Decalcification was complete in
the 4°C group at 8 weeks (Figure 4-8C).
Decalcification in formic acid was achieved at 16, 24 and 40 hours by 37°C, 25°C and
4°C groups, respectively. At 16 hours the microwave group (37°C) had completely

Chapter 4: Results of decalcification times determined by Micro CT analysis 43
lost all calcium, however, in the conventional groups (25°C & 4°C) only 22% and 30%
of BV remained, respectively (Figure 4-8 F). At approximately 50% of BV the
conventional groups experienced a steady decline of calcium loss. After 24 hours
the 25°C group had achieved decalcification, contrastingly the 4°C group still had
20% of BV remnant (Figure 4-8F). At 40 hours the 4°C group was completely
decalcified (Figure 4-8F).
In HCl decalcification was achieved in 3 hours by microwave treatment (37°C),
whereas it took 8 hours at 25°C and 10 hours at 4°C. Bone decalcification at 37°C
occurred at 3 hours, in comparison at 4 hours the conventional groups (25°C and
4°C) had 30% and 45% of BV remaining, respectively (Figure 4-8I). After 8 hours the
25°C group had achieved complete calcium loss, at this stage the 4°C had 12% of BV
remaining (Figure 4-8I). At 10 hours the 4°C group had completely decalcified
(Figure 4-8I).
Using nitric acid sheep tibia decalcified in 1, 3 and 4 hours at 37°C, 25°C and 4°C,
respectively. After 1 hour in the microwave (37°C) sheep tibia was completely
decalcified, contrastingly the conventional groups had approximately 53% of BV
remaining (Figure 4-8L). Decalcification was achieved at 3 hours for the 25°C group,
whereas the 4°C had 15% of BV remaining. At 4 hours the 4°C had completely
decalcified.
Images obtained from µCT confirmed the BV loss data (Figure 4-5A, 5B). Broadly
sheep tibia decalcification rates were found to follow a similar trend in all
decalcification conditions. Microwave groups were relatively rapid compared to
conventional groups; furthermore the BV loss curves showed that decalcification
slowed down as less BV remained. Furthermore, µCT images showed intact tibias
gradually diminishing where bone went from a thick annular shape to a thin
crescent until decalcification was complete. Interestingly Formic acid at 37°C had a
coral like surface morphology at 4 and 8 hours, this occurrence was not observed in
any other group in sheep. As expected the microwave groups managed to decalcify
bone considerably faster than the conventional conditions for each solution. To
summarise decalcification of sheep tibia was achieved in nitric acid decalcification in

44 Chapter 4: Results of decalcification times determined by Micro CT analysis
1 – 4 hours followed by HCL (3 – 10 hours), formic acid (16 - 40 hours) and EDTA (2-
8 weeks).
Chapter 4: Results of decalcification times determined by Micro CT analysis 45
FORMIC ACID EDTA
0 hrs 12 hrs 24 hrs 30hrs
0 days 1 day 2 days 3 days
0 hrs 2 hrs 4 hrs
0 hrs 4 hrs 8 hrs
4°C
25°C
37°C
Figure 4-3A: Representative 3D µCT images of mice tibia decalcified in EDTA (left) and
formic acid (right) at indicated time points. Mineralised bone matrix appears white and
decalcified bone is represented by black.

46 Chapter 4: Results of decalcification times determined by Micro CT analysis
4°C
25°C
37°C
NITRIC ACID HYDROCHLORIC ACID
0hrs 2hrs 3 hrs
0 h 1 hr 2 hrs
0 hrs 4 hrs 5 hrs
0 hrs 2 hrs 3 hrs
Figure 4-3B: Representative 3D µCT images of mice tibia decalcified in HCl (left) and
nitric acid (right) at indicated time points. Mineralised bone matrix appears white and
decalcified bone is represented by black.

Chapter 4: Results of decalcification times determined by Micro CT analysis 47
EDTA
0 weeks 1 week 2 weeks 3weeks 4weeks 5weeks
0 days 1 day 2 days 3 days 4 days 5 days
37°C
25°C
4°C
Figure 4-4A: Representative 3D µCT images of rat tibia decalcified in EDTA at indicated
time points. Mineralised bone matrix appears white and decalcified bone is represented by
black. Proximal ends of the tibia took the longest time to decalcify in each specimen.

48 Chapter 4: Results of decalcification times determined by Micro CT analysis
0 hrs 12 hrs 24 hrs 36 hrs 48 hrs
0 hrs 6 hrs 12 hrs 18 hrs 24 hrs
FORMIC ACID
37°C
25°C
4°C
Figure 4-4B: Representative 3D µCT of rat tibia decalcified in formic acid at indicated
time points. Mineralised bone matrix appears white and decalcified bone is represented
in black. Proximal ends of the tibia took the longest time to decalcify in each specimen.

Chapter 4: Results of decalcification times determined by Micro CT analysis 49
HYDROCHLORIC ACID
0 hrs 4 hrs 8 hrs 12 hrs 15hrs
0 hrs 3 hrs 6 hrs 8 hrs
37°C
25°C
4°C
Figure 4-4C: Representative 3D µCT images of rat tibia decalcified in hydrochloric acid
at indicated time points. Mineralised bone matrix appears white and decalcified bone is
represented in black. Proximal ends of the tibia took the longest time to decalcify in each
specimen.

50 Chapter 4: Results of decalcification times determined by Micro CT analysis
4°C
25°C
NITRIC ACID
37°C
25°C
4°C
0 hrs 1 hr 2 hrs 3hrs 4hrs
0 mins 1 hr 2 hrs
Figure 4-4D: Representative 3D µCT images of rat tibia decalcified in nitric acid at
indicated time points. Mineralised bone matrix appears white and decalcified bone is
represented in black. Proximal ends of the tibia took the longest time to decalcify in
each specimen.

Chapter 4: Results of decalcification times determined by Micro CT analysis 51
EDTA
4°C
25°C
37°C
0 weeks 2 weeks 4 weeks 6 weeks 8weeks
0 weeks 1 weeks 2 weeks 2.5 weeks
FORMIC ACID
0 hrs 8 hrs 16 hrs 24 hrs 32 hrs 40 hrs
0 hrs 4 hrs 8 hrs 16 hrs
37°C
25°C
4°C
Figure 4-5A: Representative 3D µCT images of sheep tibias decalcified in EDTA and formic
acid at indicated time points. Mineralised bone matrix appears white and decalcified bone is
represented in black. Proximal ends of the tibia took the longest time to decalcify in each
specimen.

52 Chapter 4: Results of decalcification times determined by Micro CT analysis
Figure 4-5B: Representative 3D µCT images of sheep tibias decalcified in HCl and nitric acid
at indicated time points. Mineralised bone matrix appears white and decalcified bone is
represented in black. Proximal ends of the tibia took the longest time to decalcify in each
specimen.
4°C
25°C
37°C
0 hrs 1 hr 2 hrs 3hrs 4hrs
0 mins 30 mins 60 mins
NITRIC ACID
HYDROCHLORIC ACID
4°C
25°C
37°C
0 hrs 1 hr 2 hrs 3hrs
0 hrs 2 hrs 4 hrs 6 hrs 8hrs 10hrs
Chapter 4: Results of decalcification times determined by Micro CT analysis 53
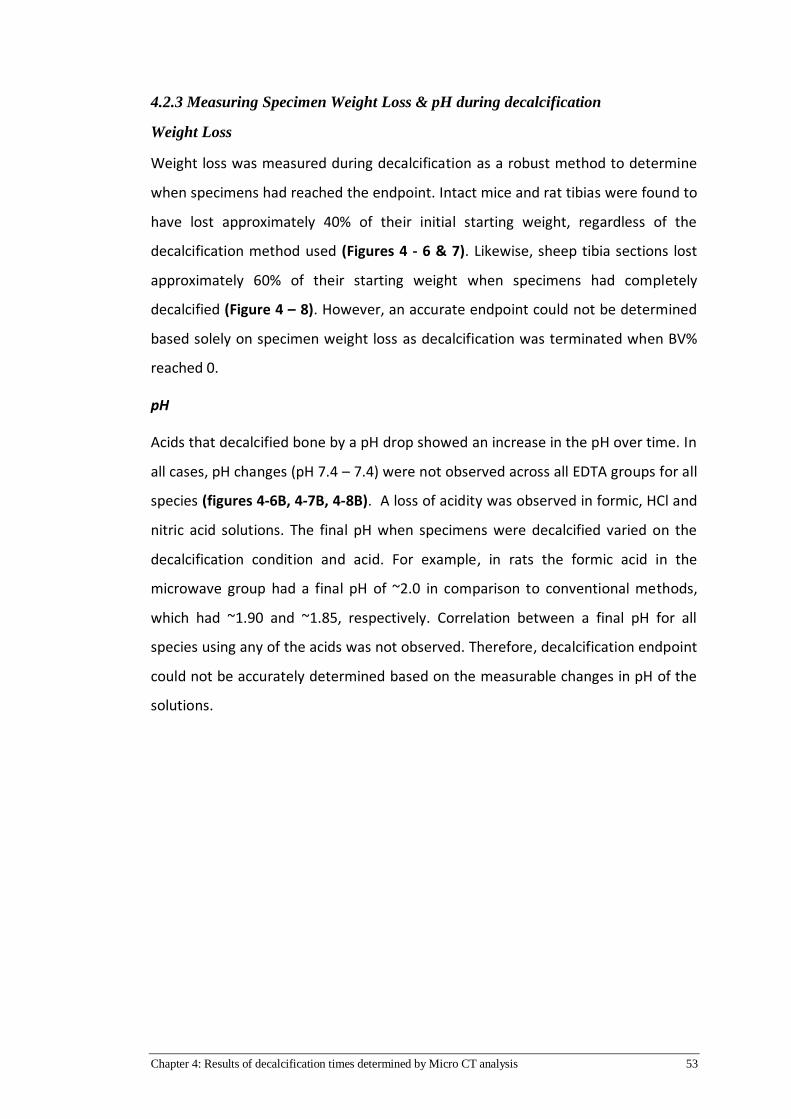
4.2.3 Measuring Specimen Weight Loss & pH during decalcification
Weight Loss
Weight loss was measured during decalcification as a robust method to determine
when specimens had reached the endpoint. Intact mice and rat tibias were found to
have lost approximately 40% of their initial starting weight, regardless of the
decalcification method used (Figures 4 - 6 & 7). Likewise, sheep tibia sections lost
approximately 60% of their starting weight when specimens had completely
decalcified (Figure 4 – 8). However, an accurate endpoint could not be determined
based solely on specimen weight loss as decalcification was terminated when BV%
reached 0.
pH
Acids that decalcified bone by a pH drop showed an increase in the pH over time. In
all cases, pH changes (pH 7.4 – 7.4) were not observed across all EDTA groups for all
species (figures 4-6B, 4-7B, 4-8B). A loss of acidity was observed in formic, HCl and
nitric acid solutions. The final pH when specimens were decalcified varied on the
decalcification condition and acid. For example, in rats the formic acid in the
microwave group had a final pH of ~2.0 in comparison to conventional methods,
which had ~1.90 and ~1.85, respectively. Correlation between a final pH for all
species using any of the acids was not observed. Therefore, decalcification endpoint
could not be accurately determined based on the measurable changes in pH of the
solutions.
54 Chapter 4: Results of decalcification times determined by Micro CT analysis
Figure 4-6: Graphical representation of the change in mice tibia weight, pH of decalcification
solution and rate of bone volume loss over time. Error bars indicate the standard error of the
mean (n=3). Blue represents 4°C, green 25°C and red 37°C
A B C
D E F
G H I
J K L

Chapter 4: Results of decalcification times determined by Micro CT analysis 55
Figure 4-7: Graphical representation of the change in rat tibia weight, pH of decalcification
solution and rate of bone volume loss over time. Error bars indicate standard error of the
mean (n=3). Blue represents 4°C, green 25°C and red 37°C.
A B C
D E F
G H I
J K L
56 Chapter 4: Results of decalcification times determined by Micro CT analysis
Figure 4-8: Graphical representation of the change in sheep tibia weight, pH of
decalcification solution and rate of bone volume loss over time. Error bars indicate
standard error of the mean (N = 3). Blue represents 4°C, green 25°C and red 37°C.
A B C
D E F
G H I
J K L

Chapter 4: Results of decalcification times determined by Micro CT analysis 57
4.3 DISCUSSION
Monitoring bone decalcification by µCT is a novel and effective approach. Based on
current literature only one other study has used µCT to analyse specimen
decalcification [52]. Gold standard methodology for examining mineral content in
bone has been reported as measuring radio opacity by x-rays or µCT scanning. In
this study it was crucial to precisely determine the exact endpoint of bone
decalcification to prevent excess damage to the specimen. The data clearly shows
the point at which the bone becomes radio-opaque and calcium is removed from
the tissue without any ambiguity at the resolution scanned. Previously reported
methods of decalcification testing have been noted for being inconclusive and
subjective [26]. In comparison to currently reported empirical methods it is evident
that µCT systems have an advantage in accurately assessing bone decalcification.
During the decalcification process bend testing was done by hand in the lab to
determine specimen softening. Prick testing with a needle was not performed as
excess tissue damage would interfere with tissue morphology analysis. Midway
through decalcification the rat and mice tibia appeared decalcified due to the ease
of bending through the diaphysis however Figures 4-4 and 4-5 demonstrate that
there is still bone present in the proximal and distal ends. Prick testing may have
detected calcified bone in the proximal and distal ends. However, the resulting
damage to the tissue would have interfered with histological analysis. Embedding of
the bone based on the empirical bending tests would have resulted in difficulty
embedding and sectioning specimens. Therefore, due to the dense bone in the
proximal and distal ends bend testing is insufficient to correctly determine
decalcification
An alternate method for determining bone decalcification was to measure the
weight of the bone during the decalcification process [19], [39]. Testing for
complete decalcification by measuring the specimen weight didn’t accurately
predict when a specimen was reaching end point. Figures 4-3, 4 – 4 & 4 -5
demonstrate this as the rate of bone loss was fairly constant throughout
decalcification. In rat and mice groups the rate of weight loss decreased as
decalcification reached completion for all acids, however as the specimen weight
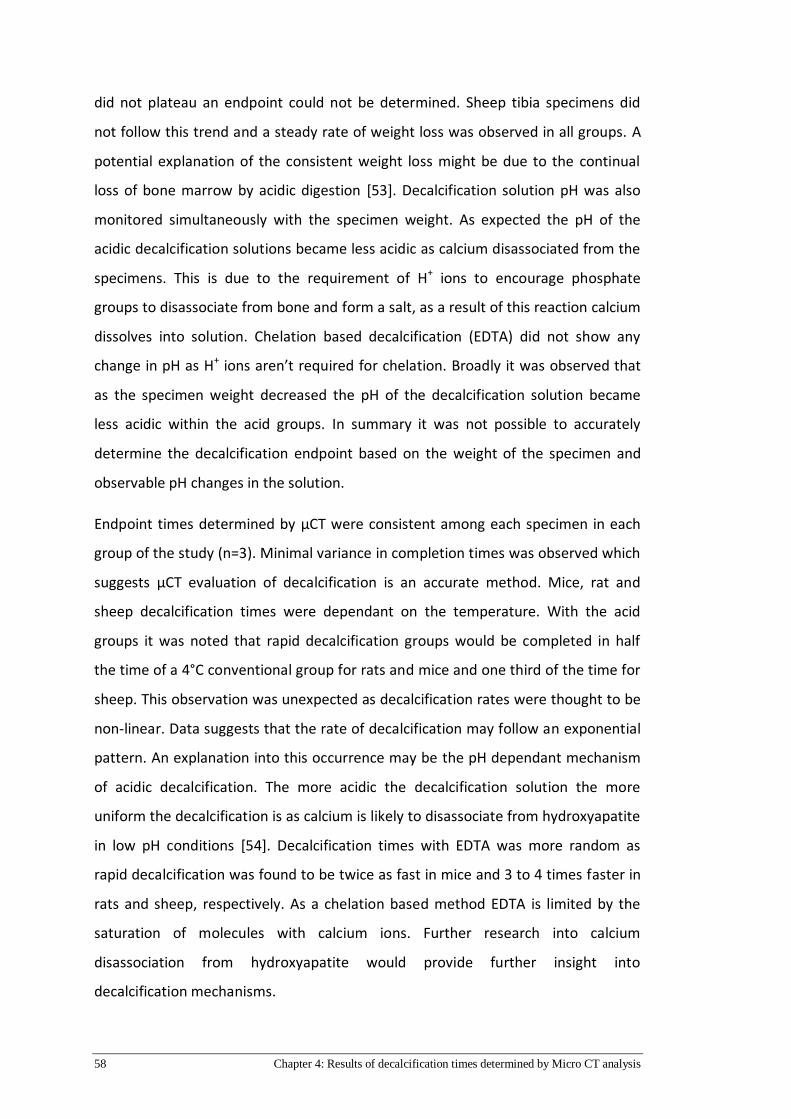
58 Chapter 4: Results of decalcification times determined by Micro CT analysis
did not plateau an endpoint could not be determined. Sheep tibia specimens did
not follow this trend and a steady rate of weight loss was observed in all groups. A
potential explanation of the consistent weight loss might be due to the continual
loss of bone marrow by acidic digestion [53]. Decalcification solution pH was also
monitored simultaneously with the specimen weight. As expected the pH of the
acidic decalcification solutions became less acidic as calcium disassociated from the
specimens. This is due to the requirement of H+ ions to encourage phosphate
groups to disassociate from bone and form a salt, as a result of this reaction calcium
dissolves into solution. Chelation based decalcification (EDTA) did not show any
change in pH as H+ ions aren’t required for chelation. Broadly it was observed that
as the specimen weight decreased the pH of the decalcification solution became
less acidic within the acid groups. In summary it was not possible to accurately
determine the decalcification endpoint based on the weight of the specimen and
observable pH changes in the solution.
Endpoint times determined by µCT were consistent among each specimen in each
group of the study (n=3). Minimal variance in completion times was observed which
suggests µCT evaluation of decalcification is an accurate method. Mice, rat and
sheep decalcification times were dependant on the temperature. With the acid
groups it was noted that rapid decalcification groups would be completed in half
the time of a 4°C conventional group for rats and mice and one third of the time for
sheep. This observation was unexpected as decalcification rates were thought to be
non-linear. Data suggests that the rate of decalcification may follow an exponential
pattern. An explanation into this occurrence may be the pH dependant mechanism
of acidic decalcification. The more acidic the decalcification solution the more
uniform the decalcification is as calcium is likely to disassociate from hydroxyapatite
in low pH conditions [54]. Decalcification times with EDTA was more random as
rapid decalcification was found to be twice as fast in mice and 3 to 4 times faster in
rats and sheep, respectively. As a chelation based method EDTA is limited by the
saturation of molecules with calcium ions. Further research into calcium
disassociation from hydroxyapatite would provide further insight into
decalcification mechanisms.

Chapter 4: Results of decalcification times determined by Micro CT analysis 59
Mice tibia decalcification times in this study were comparable to times reported in
previous studies [41][55]. Gruntz et.al found mice tibia to decalcify in EDTA and
formic acid at approximately the same time found in this study. For EDTA
decalcification times reported by Masahiko et.al are 3 days longer. Times for nitric
and hydrochloric acid aren’t reported for mice tibia [41], [55], [56]. The methods of
determining endpoint in these studies are not mentioned, however, it is likely that
bone bending and pricking was used. The decalcification times in this study are
more likely to be accurate because of µCT use to determine endpoint.
Decalcification times for rat tibias in this study were found to be faster for all acids
and EDTA reported in recent literature [15], [18], [22], [26], [30], [36], [41], [56]–
[58]. Over estimation of rat tibia decalcification was found throughout the
literature. This would suggest that one of two things is occurring with rat tibia
decalcification, endpoint determination in these studies was insufficient at
estimating an endpoint or that rat tibia decalcification is quite variable. Data from
the µCT results demonstrate consistent repeatability in decalcification times; this
suggests that endpoint determination techniques in previous studies were
insufficient. Over decalcification with acid results in deleterious effects for cell
nuclei, cytoplasm and tissue swelling if done by EDTA [20], [26]. The results from rat
tibia analysis by µCT would indicate that over decalcification of specimens is
common throughout academic literature.
Sheep tibia decalcification patterns in this study were consistent across all four acid
groups. Within each group the lower temperature (4°C) followed the same pattern
as the 25°C and 37°C but at a slower rate. Formic acid decalcification resulted in a
coral like structure of the remaining bone in each specimen. This could be due to
the less acidic pH of formic acid and the organic acid mechanism of H+ ion release.
Sheep decalcification times are under reported throughout literature as mice and
rat tibias are commonly studied due to ease of access to the animals. Bovine, canine
and porcine decalcification times are reported [26], [41], [44] however, the
comparability of these species is unknown [50]. In one study an intact sheep tibia
was used to determine the decalcification time in EDTA, this type of specimen is not
representative of specimens in research or pathology. Intact sheep tibia times were

60 Chapter 4: Results of decalcification times determined by Micro CT analysis
found to be 30 days by constant EDTA replacement decalcification [59]. Other
studies by Gruntz et.al and Callis et.al both used dog specimens for their
decalcification times. Callis et.al found dog tibias of a similar size to the sheep tibia
used in this study varied from 8-24 hours for microwaved specimens (all acids) to 10
– 20 days for conventionally decalcified specimens [26] in EDTA as determined by X-
ray. A major limitation of the Callis et.al study is the lack of specimen replicates for
each treatment group (n=1), in contrast, in this study all tested specimens (n=3)
found a similar decalcification pattern within each group. Results from Gruntz et.al
did not compare to the endpoint times determined by µCT analysis in this study.
Sheep tibia were found to decalcify faster in formic acid than dog tibia, however,
Gruntz et.al reported faster decalcification times in EDTA for canine bone then the
sheep tibia in this study. Further research on large animal bone decalcification
would prove useful to determining appropriate endpoint times for large animal
studies.
The advantage of the µCT based approach is its accurate detection of calcium in
specimens. In contrast, pin pricking, bending and weight loss measuring tests lack
this specificity [35]. Nevertheless, there are limitations to this approach, for
instance while it would be possible to scan at a higher resolution to identify cellular
detail, this study demonstrated that the resolutions used were sufficient enough to
show the decalcification process of the mineral matrix. Conversely, the main
limitations of using µCT to monitor decalcification are the time required, the
associated costs of scanning specimens, and the availability of µCT scanners in
laboratories.
In summary, the results from this study demonstrate the accuracy of µCT
determining complete decalcification and show that decalcification in literature is
potentially overestimated. The results are likely to be relevant for research and
pathology labs looking for guidelines in time required to decalcify bone for
histological studies.

Chapter 5: Histological evaluation of various decalcification conditions 61
Chapter 5: Histological evaluation of
various decalcification
conditions
5.1 HISTOLOGICAL STAINING OF BONE
5.1.1 Mice staining
Tissue morphology by H&E
Mice tibia sections were stained with H&E and examined by light microscopy. Tissue
morphology analysis revealed good tissue preservation in EDTA and formic acid
decalcified specimens for all conditions (Figure 5 – 1 A – F). Cement lines as well as
lamellar bone could be identified in the EDTA and formic acid groups. Epithelial cell
and erythrocyte staining was observed in vascular tissue. In addition, staining of cell
nuclei did not show evidence of deterioration for all conditions in EDTA or formic
acid. Damage to the tissue morphology was observed in specimens decalcified in
HCl or nitric acids for all conditions (Figure 5 -1 G – L). Cement lines and vasculature
tissue architecture staining was not observed or showed evidence of damage.
Osteocyte nuclei staining had a smudged appearance in both groups which resulted
in a loss of cellular detail. Evaluation with H&E stain revealed that tissue
morphology was well preserved when EDTA or formic acid was used.
Cartilage by Safranin O
Cartilage and bone morphology was well preserved in specimens decalcified in
EDTA and formic acid for all conditions (Figure 5 – 2 A - F). Tissue preservation of
cartilage and bone was observed for all decalcification conditions in HCL and nitric
acids, however, non-specific nucleic staining was observed in the cartilage matrix. In
the HCl and nitric acid groups nuclei appeared to stain green rather than black in
cartilage and bone (Figure 5-2 G – L). Furthermore, in the acid groups shrinkage of
chondrocytes and lacunae was observed (Figure 5-2).

62 Chapter 5: Histological evaluation of various decalcification conditions
A B C
D E F
G H I
J K L
Figure 5-1: Hematoxylin & Eosin staining in mice tibia. Bone matrix stains various shades
of pink and purple with cellular nuclei staining blue. Cement lines in the cortical bone
matrix are clearly visible in the formic acid and EDTA groups as indicated by arrows. Note
that in the HCl and nitric acid groups cement lines are either unclear or absent.
Magnification x20 scale bar = 50µm.

Chapter 5: Histological evaluation of various decalcification conditions 63
Figure 5-2: Safranin O & Fast green staining in mice tibia for cartilage and bone. Cartilage tissue
stains red and bone stains green. The chondrocytes and nuclei in EDTA are well preserved in
comparison to the acids. Magnification x20 scale bar 50µm.
A B C
D E F
G H I
J K L
64 Chapter 5: Histological evaluation of various decalcification conditions
Collagen type I in bone matrix
Tissue antigenicity was well preserved in the EDTA and formic acid decalcified
specimens for all conditions. Mice tibia in EDTA had positive staining of collagen
type I in the bone matrix (Figure 5 – 3 A – F). Tissue architecture was well preserved
and bone remodelling sites could be identified from the staining in all EDTA and
formic acid groups. In contrast, specimens decalcified by HCl showed evidence of
tissue degradation (Figure 5 – 3 G, H & I). Cement lines were stained in the
conventional groups (4°C & 25°C) and absent in the microwave group (37°C). Mice
tibia decalcified in nitric acid showed evidence of reduced antigenicity regardless of
the condition used (Figure 5 – 3 J, K & L). Cortical bone did not stain positively
throughout the matrix and positive staining was observed on the edges of the
tissue. Mice tibia specimens decalcified in EDTA with a microwave or formic acid
had similar antigenicity preservation and staining patterns compared to the
conventional 4°C EDTA condition.
vWF staining for serum proteins
Mice tibias in EDTA had well preserved vascular tissue for all decalcification
conditions (Figure 5 – 4 A, B &C). Blood vessel endothelium (epithelial lining) and
serum proteins stained positive for vWF. Vascular tissue was also well preserved in
formic acid for all conditions with positive vWF staining observed inside blood
vessels and the endothelium (Figure 5 – 4 D, E & F). Vascular tissue antigenicity was
retained in all HCl and conventional (4°C & 25°C) nitric acid groups as evidenced by
positive vWF staining. Epithelial cells in the endothelium had lost cellular detail as
nuclei and cytoplasm staining was unable to be identified (Figure 5 – 4 G – K).
Likewise, nitric acid decalcification of mice tibia in the microwave also revealed a
similar loss in vascular tissue antigenicity and cellular detail. Background (non-
specific) staining was observed in the bone matrix in all acid groups (formic, HCl &
Nitric). Differences in antigenicity and tissue morphology were noted to occur
between EDTA and the acid groups. Compared to EDTA, the acid groups showed
evidence of morphological damage and reduced antigenicity.
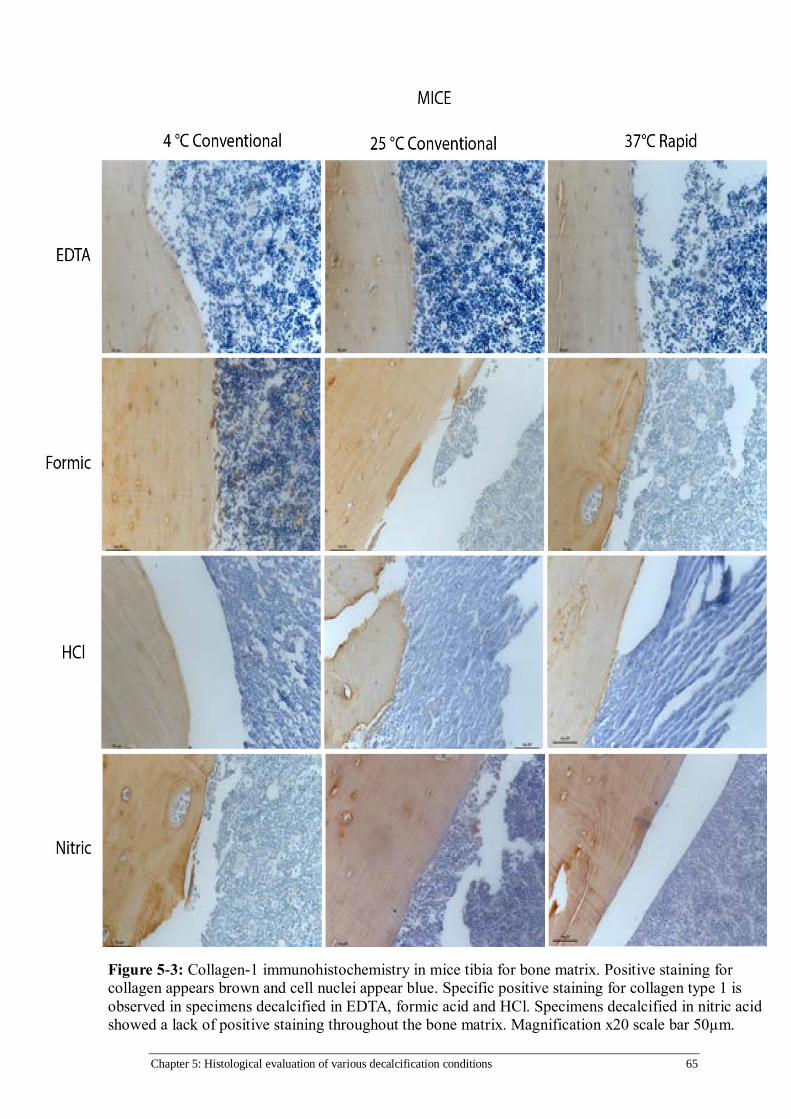
Chapter 5: Histological evaluation of various decalcification conditions 65
Figure 5-3: Collagen-1 immunohistochemistry in mice tibia for bone matrix. Positive staining for
collagen appears brown and cell nuclei appear blue. Specific positive staining for collagen type 1 is
observed in specimens decalcified in EDTA, formic acid and HCl. Specimens decalcified in nitric acid
showed a lack of positive staining throughout the bone matrix. Magnification x20 scale bar 50µm.

66 Chapter 5: Histological evaluation of various decalcification conditions
Figure 5-4: vWF immunohistochemistry in mice tibia for vasculature and serum proteins.
Positive staining for vWF appears brown in blood vessels and cell nuclei appear blue. Endothelium
lining of vasculature is well preserved and stains positive in all groups. Serum proteins within the
blood vessels are also positive. Magnification x20 scale bar 50µm.
A B C
D E F
G H I
J K L
Chapter 5: Histological evaluation of various decalcification conditions 67
5.1.2 Rat staining
Tissue morphology by H&E
Examination of the H&E stained sections revealed differences in staining for
specimens decalcified in EDTA and acid groups. Cellular morphology showed
evidence of deterioration for all conditions in HCl and nitric acid (Figure 5 – 5 G – L).
Osteocyte staining in the cortical bone was observed to be faded in all the HCL
groups. In contrast, osteocyte staining in the nitric acid groups was observed for all
conditions. Specimens decalcified in HCl and nitric acid showed evidence of
deterioration as nuclei staining was not observed in the bone marrow, regardless of
the condition. Tissue architecture was lost as cement lines were not observed in the
microwave groups, however, in conventional groups despite a smudged
appearance, they could be identified as indicated by arrowheads in Figure 5 - 5.
Cells in the bone marrow were characterised by pink staining which is indicative of
eosin uptake for all groups. Furthermore, vascular tissue architecture showed signs
of damage as epithelial cell and erythrocyte staining appeared smudged for all HCl
and nitric conditions. In contrast, specimens decalcified in formic acid and EDTA had
well preserved tissue morphology for all conditions used. Staining of cell nuclei was
observed in bone and vascular tissue (Figure 5 – 5 A – F). Furthermore, cement lines
and remodelling sites were clearly defined in bone matrix. Interestingly specimens
decalcified in EDTA using a microwave showed preservation of tissue structure and
staining patterns similar to the routine condition (EDTA 4°C).

68 Chapter 5: Histological evaluation of various decalcification conditions
Figure 5-5: Hematoxylin & Eosin staining in rat tibia. Bone matrix stains various shades of pink
and purple with cellular nuclei staining blue. Cement lines in the cortical bone matrix are clearly
visible in the formic acid and EDTA groups as indicated by arrows, however, in HCl and nitric
they were not well preserved.. Note that in the HCl and nitric acid groups cell nuclei staining is
absent and tissue matrix appears dark. Magnification x20 scale bar = 50µm.
A B C
D E F
G H I
J K L
Chapter 5: Histological evaluation of various decalcification conditions 69
Cartilage by Safranin O
Cartilage and bone morphology was well preserved in the EDTA and formic acid
decalcified specimens as evidenced by Safranin O staining. Epiphyseal cartilage and
bone tissue stained bright red and green, respectively, in specimens for all
decalcification conditions. Specimens decalcified in HCl and nitric acid showed signs
of tissue degradation and cytological damage (Figure 5 – 6 G – L). Cell nuclei were
observed to stain green instead of black in chondrocytes for the 4°C conventional
HCl and all nitric acid groups. Cell nuclei stained black in all other decalcification
conditions in rats. Chondrocyte and cartilage lacunae shrinkage appeared to occur
in the HCL and nitric acid groups, however, the shrinkage was less severe in the
microwave HCL group. Furthermore signs of shrinkage were observed in the formic
acid group, despite this the cellular morphology still appeared intact. Bone
morphology staining with fast green did not show any discernible changes between
the acid groups. Cartilage tissue morphology was well preserved when decalcified
by EDTA regardless of the condition used, formic acid revealed minor damage to
cytological structures and tissue damage was observed in HCl and nitric acid groups.
Collagen type I in bone matrix
Collagen type I antigenicity was preserved in rat specimens decalcified in EDTA and
formic acid (Figure 5 – 7 A – F). Positive immunoreactivity was observed throughout
the bone matrix as indicated by brown staining of the tissue matrix. Tissue
morphology of the formic acid and EDTA groups had specific positive staining
throughout the bone matrix. Specimens in HCl and nitric acid showed signs of tissue
matrix damaged as evidenced by the loss of tissue morphology and non-specific
collagen type I staining. Deterioration of the lamellar bone matrix was observed in
the nitric acid and HCL microwave groups (Figure 5 – 7 I – L). Furthermore, damage
was also observed in the conventional HCl groups, although it was possible to
distinguish lamellar bone morphometry (Figure 5 – 7 G, H). Staining of cell nuclei
was observed in EDTA and formic acid groups, however, in the HCL and nitric acid
groups cell nuclei staining was absent. Antigenicity of collagen type 1 in specimens
decalcified by EDTA in the microwave and all formic acid groups did not show any
differences to the routine EDTA condition (4°C).
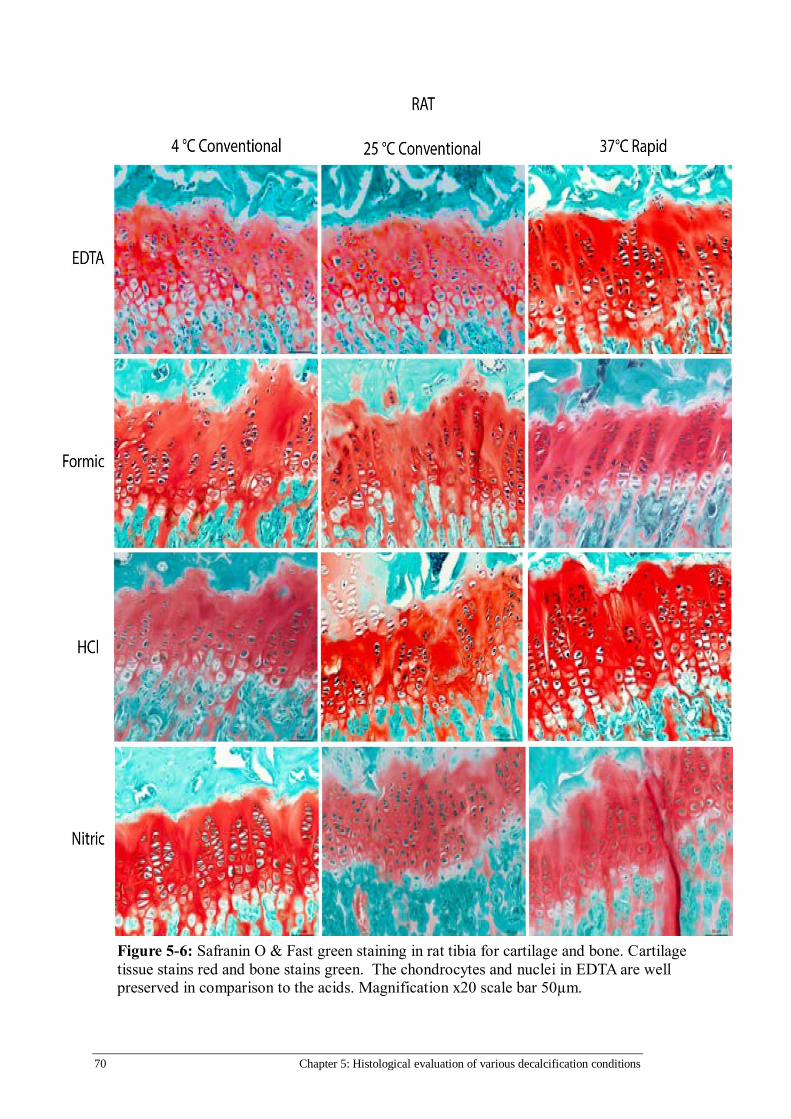
70 Chapter 5: Histological evaluation of various decalcification conditions
Figure 5-6: Safranin O & Fast green staining in rat tibia for cartilage and bone. Cartilage
tissue stains red and bone stains green. The chondrocytes and nuclei in EDTA are well
preserved in comparison to the acids. Magnification x20 scale bar 50µm.

Chapter 5: Histological evaluation of various decalcification conditions 71
Figure 5-7: Collagen-1 immunohistochemistry in rat tibia for bone matrix. Positive staining for
collagen appears brown and cell nuclei appear blue. Specific positive staining for collagen type
1 is observed in specimens in all decalcification solutions. Specimens decalcified in nitric acid
showed a lack of detail in the tissue matrix as indicated by arrows. Tissue matrix was well
preserved in EDTA and formic acid. Conventional HCl conditions (J, H) showed evidence of
tissue preservation, however, cell nuclei staining was absent. Magnification x20 scale bar 50µm.
A B C
D E F
G H I
J K L

72 Chapter 5: Histological evaluation of various decalcification conditions
vWF staining for serum proteins
Vasculature morphology and serum protein antigenicity of vWF was well preserved
in specimens decalcified by EDTA and formic acid regardless of the decalcification
conditions (Figure 5 – 8 A – F). Positive staining was localised to the blood vessels
and the surrounding endothelium. Circulating vWF within the blood vessels stained
positive indicating that serum protein antigenicity was intact for all conditions in
EDTA and formic acid. Staining for vWF in HCL decalcified specimens revealed
similar staining patterns to EDTA and formic acid, however, non-specific background
staining was seen throughout the bone matrix (Figure 5 – 8 G – I). In addition
positive staining within the vasculature was more intense, although this staining
appeared smudged which hindered identification of endothelium. While positive
staining was observed in the nitric acid group, the staining intensity appeared
diminished or was absent in blood vessels (Figure 5 – 8 J - L). Furthermore, detail in
cellular morphology was lost as nuclei staining was not observed in the
endothelium. Non-specific background staining was observed in the tissue matrix.
Decalcification of rat tibias in EDTA or formic acid demonstrated vasculature tissue
preservation, however, specimens in HCl or nitric acid showed signs of damage as
evidenced by vWF staining.

Chapter 5: Histological evaluation of various decalcification conditions 73
Figure 5-8: vWF immunohistochemistry in rat tibia for vasculature and serum proteins.
Positive staining for vWF appears brown in blood vessels and cell nuclei appear blue.
Endothelium lining of vasculature is well preserved and stains positive in all groups. Serum
proteins within the blood vessels is also positive. Magnification x20 scale bar 50µm.
A B C
D E F
G H I
J K L
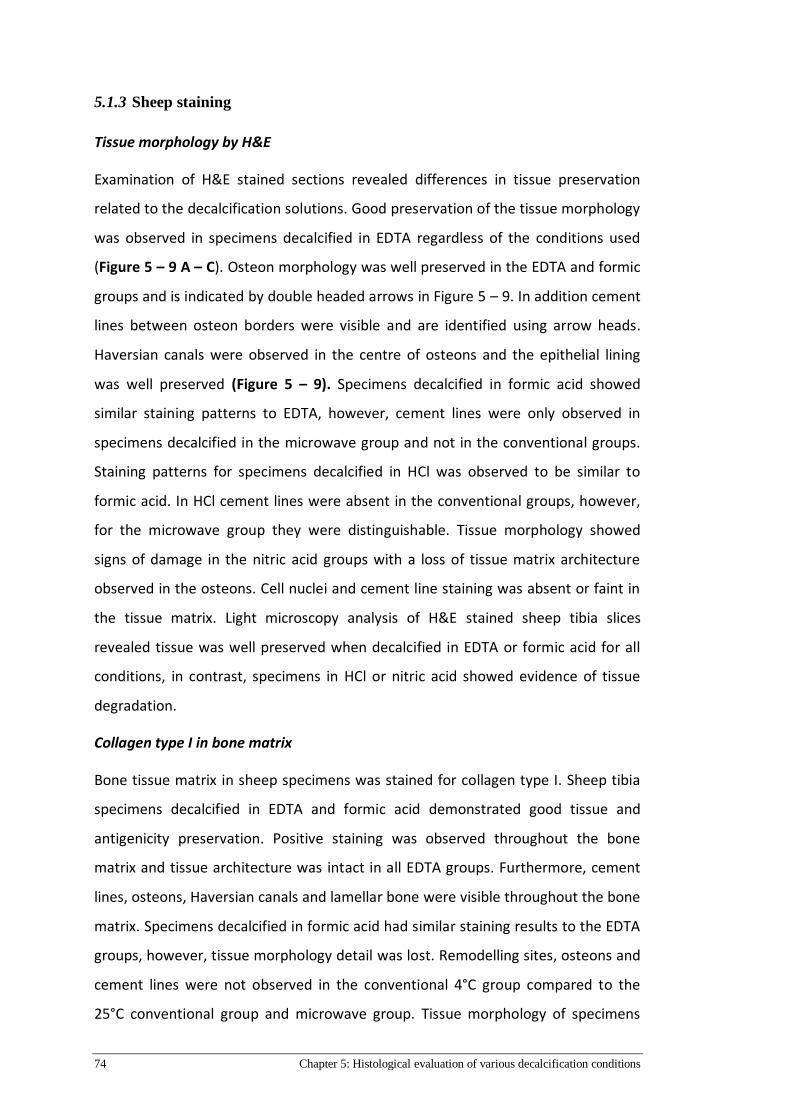
74 Chapter 5: Histological evaluation of various decalcification conditions
5.1.3 Sheep staining
Tissue morphology by H&E
Examination of H&E stained sections revealed differences in tissue preservation
related to the decalcification solutions. Good preservation of the tissue morphology
was observed in specimens decalcified in EDTA regardless of the conditions used
(Figure 5 – 9 A – C). Osteon morphology was well preserved in the EDTA and formic
groups and is indicated by double headed arrows in Figure 5 – 9. In addition cement
lines between osteon borders were visible and are identified using arrow heads.
Haversian canals were observed in the centre of osteons and the epithelial lining
was well preserved (Figure 5 – 9). Specimens decalcified in formic acid showed
similar staining patterns to EDTA, however, cement lines were only observed in
specimens decalcified in the microwave group and not in the conventional groups.
Staining patterns for specimens decalcified in HCl was observed to be similar to
formic acid. In HCl cement lines were absent in the conventional groups, however,
for the microwave group they were distinguishable. Tissue morphology showed
signs of damage in the nitric acid groups with a loss of tissue matrix architecture
observed in the osteons. Cell nuclei and cement line staining was absent or faint in
the tissue matrix. Light microscopy analysis of H&E stained sheep tibia slices
revealed tissue was well preserved when decalcified in EDTA or formic acid for all
conditions, in contrast, specimens in HCl or nitric acid showed evidence of tissue
degradation.
Collagen type I in bone matrix
Bone tissue matrix in sheep specimens was stained for collagen type I. Sheep tibia
specimens decalcified in EDTA and formic acid demonstrated good tissue and
antigenicity preservation. Positive staining was observed throughout the bone
matrix and tissue architecture was intact in all EDTA groups. Furthermore, cement
lines, osteons, Haversian canals and lamellar bone were visible throughout the bone
matrix. Specimens decalcified in formic acid had similar staining results to the EDTA
groups, however, tissue morphology detail was lost. Remodelling sites, osteons and
cement lines were not observed in the conventional 4°C group compared to the
25°C conventional group and microwave group. Tissue morphology of specimens
Chapter 5: Histological evaluation of various decalcification conditions 75
decalcified in HCl or nitric acids showed signs of deterioration. Positive staining was
observed in the bone matrix for HCl, however, tissue architecture was unable to be
identified in all groups. Likewise, in nitric acid positive staining was observed,
however it was inconsistent throughout the bone matrix with some regions
remaining unstained for all groups. Cell nuclei staining in the formic, HCl and nitric
acid groups were either diminished or absent.

76 Chapter 5: Histological evaluation of various decalcification conditions
Figure 5-9: Hematoxylin & Eosin staining in sheep tibia. Bone matrix stains various shades of
pink and purple with cellular nuclei staining blue. Cement lines in the cortical bone matrix are
clearly visible in the EDTA and formic groups as indicated by arrows, however, in HCl and
nitric they were not well preserved. Osteons are indicated by double headed arrows and were
well preserved in the EDTA groups and rapid formic and HCl groups. Note that in the HCl and
nitric acid groups cell nuclei staining is absent and tissue matrix appears dark. Magnification
x20 scale bar = 50µm.
A B C
D E F
G H I
J K L

Chapter 5: Histological evaluation of various decalcification conditions 77
Figure 5-10: Collagen-1 immunohistochemistry in sheep tibia for bone matrix. Positive staining
for collagen appears brown and cell nuclei appear blue. Specific positive staining for collagen
type 1 is observed in specimens in all decalcification solutions. Specimens decalcified in HCl and
showed a lack of detail in the tissue matrix. Nitric acid staining was patchy and inconsistent in the
bone matrix as indicated by arrows. Tissue matrix was well preserved in EDTA and formic acid
with positive staining observed throughout the bone matrix. Magnification x20 scale bar 50µm.
A B C
D E F
G H I
J K L
78 Chapter 5: Histological evaluation of various decalcification conditions
vWF staining for serum proteins
Sheep tibia specimens decalcified in EDTA had well preserved vascular tissue
irrespective of the conditions tested. Immunohistochemistry revealed intact
endothelium and circulatory proteins. Specimens decalcified in formic acid had
similar staining patterns to EDTA, however, however, some cytological detail was
lost in all decalcification conditions. Endothelium and serum proteins in blood
vessels did not stain as intensely as what was observed in the EDTA groups.
Furthermore, some endothelial tissue appears to have been lost during the
decalcification or staining process, most notably in the 4°C conventional group.
Positive staining is diminished for endothelial tissue and serum proteins in
specimens decalcified by HCl. A loss of endothelium is evident in blood vessels,
furthermore, a loss of antigenicity is observed in serum proteins as partial positive
staining is observed. This same trend is noted when HCl was used in the microwave,
although the intensity of positive staining is greater when compared to the
conventional (4°C & 25°C) groups. Tissue vasculature is partially preserved in tissue
decalcified in nitric acid. Endothelium tissue is clearly visible lining blood vessels in
all groups. However, serum protein antigenicity has been lost as indicated by partial
positive staining in the blood vessels for all groups.
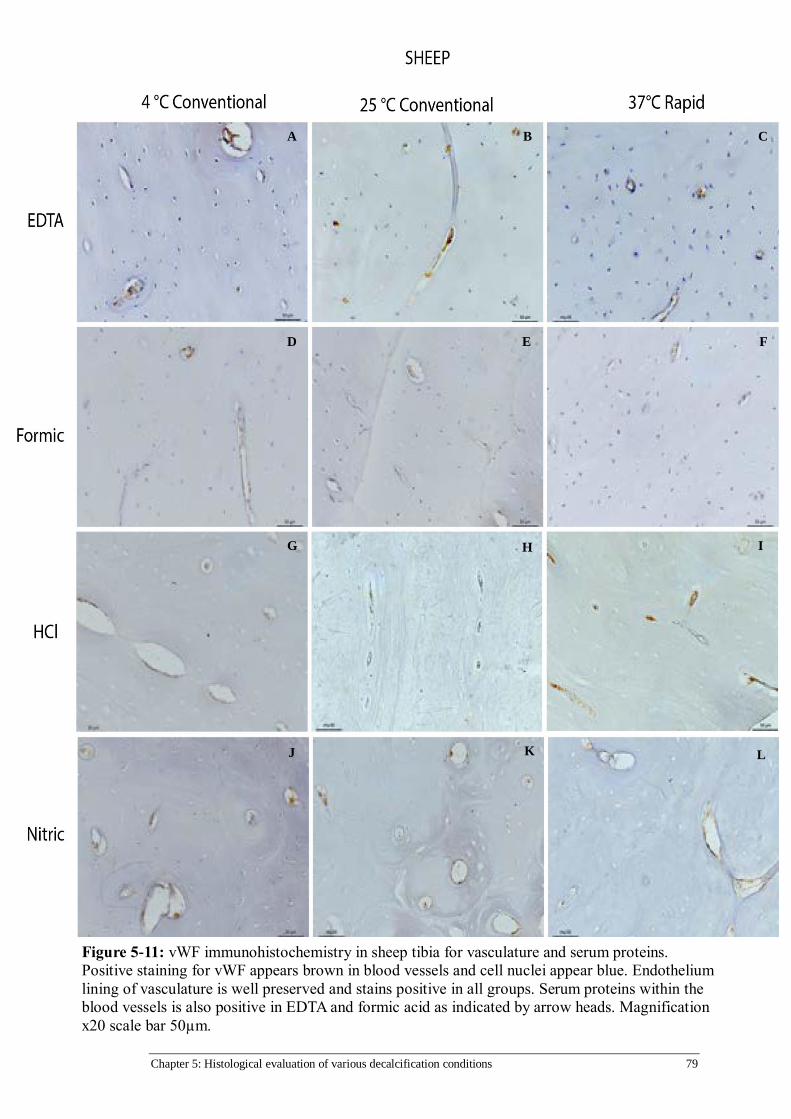
Chapter 5: Histological evaluation of various decalcification conditions 79
Figure 5-11: vWF immunohistochemistry in sheep tibia for vasculature and serum proteins.
Positive staining for vWF appears brown in blood vessels and cell nuclei appear blue. Endothelium
lining of vasculature is well preserved and stains positive in all groups. Serum proteins within the
blood vessels is also positive in EDTA and formic acid as indicated by arrow heads. Magnification
x20 scale bar 50µm.
A B C
D E F
G H I
J K L

80 Chapter 5: Histological evaluation of various decalcification conditions
5.2 HISTOLOGICAL DISCUSSION
5.2.1 Tissue morphology
Hematoxylin & Eosin
Tissues are routinely stained with H&E in diagnostic and research laboratories to
provide a histological overview of specimens. Staining with H&E in this study
demonstrated the effects decalcification had on bone in mice, rats and sheep.
Specimens that were decalcified in EDTA, both conventionally and using a
microwave had well preserved tissue morphology. In formic acid decalcified
specimens showed intact tissue and specific nuclei staining. This is in the agreement
with previous reports in the literature that formic acid is an effective decalcification
solution that does not compromise tissue morphology [15], [22], [37], [44], [58],
[60]–[62]. Results from this study demonstrate that formic acid can be used as a
decalcification solution to achieve similar results to decalcification by EDTA. In
mineral acids (HCl & Nitric) decalcified bones had deleterious effects on tissue
morphology with cell nuclei and tissue matrix staining showing signs of damage.
DNA in the cell nuclei could have been degraded because of the acidic conditions in
both the HCl and nitric acid solutions. This phenomenon has also been reported in
other studies [15], [25], [40], [48], [49], [58]. Furthermore, the bone matrix in rats
and sheep decalcified in mineral acids appeared darker than the formic and EDTA
groups. When mineral acids are used to decalcify bone, it may cause the pH of the
tissue matrix to become more acidic degrading proteins within the cytoplasm and
tissue matrix. Therefore, the increased exposure time that rat and sheep tibia had
to acid may have resulted in degradation of the tissue. As a consequence, affinity of
the tissue for eosin staining is reduced [63]. Consequently, acid decalcification may
cause a decrease in pH which may result in an increased affinity for hematoxylin
uptake in the bone matrix, although further testing would be needed to confirm this
occurrence.
Safranin O
Fracture healing and osteoarthritis studies routinely investigate cartilage tissue, this
often requires the decalcification of bone to allow for specimen processing. Staining
for bone and cartilage in the specimens decalcified in EDTA showed preservation of

Chapter 5: Histological evaluation of various decalcification conditions 81
cartilage morphology. It has been previously reported that EDTA chelation can
affect the proteoglycan structure of cartilage and, therefore compromise staining
[22], [26], [64], however this was not observed in this current study. Formic acid is
often chosen in cartilage studies as a decalcification solution, because it has fast
decalcification time as well as it is known to have minimal effect on cartilage tissue
morphology [65]. Staining results in both mice and rat tibia sections confirmed the
selection of formic acid for bone decalcification in cartilage studies. In this study,
HCl and nitric acid showed evidence of damage to the tissue morphology in
cartilage and bone. However, the observed tissue shrinkage in Figure 5.2 may have
been artefact due to dehydration caused by prolonged exposure to ethanol post-
fixation for mice specimens [5] An additional cause for chondrocyte shrinkage may
have occurred during fixation due to an osmolarity imbalance of the fixative [66].
Chondrocyte nuclei stained green instead of black this would be characteristic of
acidic degradation during decalcification, whereas, osteocyte staining was either
absent or diminished in the bone matrix. However, the overall morphology
remained intact and the staining results could still be interpreted. In contrast to this
study, Hoemann et.al advocated the use of HCl to decalcify bone as tissue
morphology and showed that osteochondral specimens were adequately preserved
[67]. Microwave decalcification did not appear to result in negative outcomes for
rat and mouse tibias when compared to their relative conventional condition using
EDTA and formic acid. This would suggest that microwaves can be used for
decalcification using EDTA or formic acid solutions for tissue undergoing cartilage
analysis by safranin-O.
5.2.2 Immunohistochemistry
Collagen type I
The goal of achieving good quality immunohistochemistry staining becomes difficult
given the special considerations bone processing requires. [58]. Staining with col-1
staining allowed for analysis of the bone matrix and the effects different
decalcification conditions had on the tissue in mice, rats and sheep. As expected,
tissue preservation was not compromised in EDTA at 4° and 25°C for all species.
Furthermore, decalcification using a microwave (37°C) showed comparable levels of

82 Chapter 5: Histological evaluation of various decalcification conditions
tissue preservation and staining specificity to the conventional decalcification
groups (4°C & 25°C). In previous work using microwave EDTA decalcification of
temporal bones by Cunningham and Madden showed that microwave
decalcification (45°) preserved and enhanced the tissue microstructure [20], [40].
Further evidence suggests that decalcification of specimens in EDTA at higher
temperatures (37 - 45°C) is possible having tissue and morphology antigenicity
comparable to conventional conditions (4°C and 25°C) [46]. Targeted chelation of
calcium by EDTA may be the reason why the effect on tissue antigenicity is minimal,
regardless of the temperature [56]. Adequate fixation of the tissue would guard the
antigens from any potential deleterious effects from heat when microwave is used
to decalcify bones [47].
Decalcification by organic (formic) and mineral acids (HCl and nitric) produced
mixed results regarding the preservation of tissue morphology and retention of
antigens in routine staining and immunohistochemistry, respectively. Formic acid
has been previously reported to be acceptable for use by pathology and research
labs as it is able to decalcify bone without causing damage to the tissue morphology
and antigenicity[14], [23], [44]. The results from this study agree with the previous
reports in the literature suggesting that formic acid is generally acceptable as a
decalcification solution when speed is prioritised over optimal staining and
morphology. Previous studies have also reported the acceptability of results
obtained from HCl and nitric acid decalcification [23], [26], [38]. In contrast, Neves
et.al found that the morphology of the tissue was poor despite observing specific
positive staining [38]. The results and conclusions drawn from this study are in
agreement with Neves et.al where they concluded that HCl acid should be avoided
for bone decalcification if preservation of bone matrix and antigenicity is desired.
Von Willebrand Factor
Staining for vWF was performed to assess if the decalcification procedures in this
study had an effect on the cells and serum proteins in the tissue. Staining in EDTA
decalcified groups clearly showed epithelial cells and circulating protein within
blood vessels. Previous studies reported the suitability of EDTA successfully
preserving vasculature antigenicity regardless of the conditions used [68], [69].

Chapter 5: Histological evaluation of various decalcification conditions 83
Microwave decalcification in EDTA in this study showed similar tissue morphology
and staining specificity when compared to the conventional groups.
Formic acid decalcification results showed specific staining for vasculature and the
tissue morphology appeared intact, however, the staining resolution was slightly
smeared. Below optimal staining resolution may be caused by formic acid
denaturing vasculature and serum proteins during decalcification, as it diffuses
throughout the sample. Hatta et.al reports that tissues decalcified by formic acid in
an ultrasonic cleaner was able to retain antigens, although a comparison against
EDTA was not conducted in this study [44]. Studies have reported that fixation was
a key factor for antigen preservation when decalcifying with formic acid [70], [71].
The hydrochloric and nitric acid groups had background staining in the bone matrix
and unclear resolution of positive staining within the vasculature for all species.
Tissue morphology and antigenicity appears to be negatively affected by the
mineral acids. In this study the time of exposure to mineral acids was shorter
compared to the reports found in the literature, which may be the reason why
positive staining and tissue preservation was observed in some HCl and nitric acid
groups. [13], [22], [26]. Athanasou et al reported that when sufficient fixation and
controlled decalcification in HCl and nitric acid was used no negative effects were
observed on diagnostic markers e.g vWF, Prostate Specific Antigen[23]. This was in
contrast to our study, which demonstrated that HCl or nitric acid decalcification,
despite being carefully controlled had caused the damage to the tissue morphology
and antigenicity. Based on the results from this study even with minimal
decalcification times and acid exposure, the deleterious effects of mineral acids on
the tissue were very evident.
84 Chapter 6: Conclusion
Chapter 6: Conclusion
6.1 GENERAL CONCLUSION
This study showed that it was possible to accurately determine an endpoint time of
bone decalcification using µCT, which was based on the BV parameter reaching 0
(%). This method is advantageous compared to weighing, chemical and mechanical
testing methods as it has a greater degree of accuracy. Furthermore, this method
does not cause any damage to the specimens.
Decalcification times for mice, rat and sheep were greatly decreased when using a
microwave (37°C) compared to conventional methods (4°C & 25°C). For EDTA, the
time required to achieve decalcification using a microwave (37°C) was 50% - 80%
shorter than conventional methods (4°C & 25°C) for all species. Comparatively,
when formic, HCl and nitric acids were used in the microwave, decalcification time
was decreased by approximately 40 – 50% compared to the respective conventional
methods.
Antigenicity and tissue morphology decalcified in EDTA were well preserved for all
conditions and in all species. Likewise, formic acid also showed preservation of
tissue morphology and antigens for all conditions in all species. Reliable results can
be obtained rapidly if specimens are decalcified in formic acid. Damage to the tissue
morphology and a loss of antigenicity was observed in specimens for all
decalcification conditions in HCl and nitric acid. Therefore, it is advisable to avoid
using HCl or nitric acid for decalcification. To conclude, decalcification in EDTA and
formic acid can be performed using laboratory microwaves with no observable
negative consequences on bone.
This study demonstrates the value a laboratory microwave has in increasing the
efficiency of histological processing. Decalcification times were greatly reduced
allowing for a more rapid processing of specimens from dissection and fixation
through to embedding, sectioning and staining. Furthermore, it was demonstrated
that when using a microwave to decalcify bone specimens in EDTA or formic acid,
Chapter 6: Conclusion 85
the standard of histology results were comparable to the respective conventional
methods.
6.2 STUDY LIMITATIONS & FUTURE WORK
While this study had taken into account routinely used stains found in literature for
bone and cartilage testing, it would be of value to determine what effect the
decalcification methods has on the tissue morphology and antigenicity of other
stains and antibodies commonly used in bone research.
For example for immunohistochemistry antigens such as Osteocalcin, Collagen – II,
Alkaline Phosphatase and CD34 and histological stains like alcain blue and toluidine
blue should be performed to assess antigenicity, cartilage morphology and bone
matrix. Furthermore, investigating the accuracy of the scout view feature of µCT to
determine the decalcification endpoint would be of benefit as well, as this would
decrease the scanning time and cost per sample. Moreover, evaluation of human
tissue would also be of interest as the decalcification times and protocols would be
directly applicable to clinical settings.

Bibliography 87
Bibliography
[1] R. Bataille, D. Chappard, C. Alexandre, P. Dessauw, and J. Sany, “Importance
of quantitative histology of bone changes in monoclonal gammopathy,” Br. J.
Cancer, vol. 53, no. 6, pp. 805–810, Jun. 1986.
[2] R. Bartl, B. Frisch, R. Burkhardt, A. Fateh-Moghadam, G. Mahl, P. Gierster,
M. Sund, and G. Kettner, “Bone Marrow Histology in Myeloma : its
Importance in Diagnosis , Prognosis , Classification and Staging,” Br. J.
Haematol., no. 51, pp. 361–375, 1982.
[3] N. Keklikoglu and S. Akinci, “Comparison of three different techniques for
histological tooth preparation,” Folia Histochem. Cytobiol., vol. 51, no. 4, pp.
286–291, 2013.
[4] M. N. Holme, G. Schulz, H. Deyhle, T. Weitkamp, F. Beckmann, J. a
Lobrinus, F. Rikhtegar, V. Kurtcuoglu, I. Zanette, T. Saxer, and B. Müller,
“Complementary X-ray tomography techniques for histology-validated 3D
imaging of soft and hard tissues using plaque-containing blood vessels as
examples.,” Nat. Protoc., vol. 9, no. 6, pp. 1401–15, Jan. 2014.
[5] R. S. V. Rastogi, N. Puri, S. Arora, G. Kaur, L. Yadav, “Artefacts : A
Diagnostic Dilemma – A Review,” J. Clin. Diagnostic Res., vol. 7, no. 10, pp.
2408 – 2413, 2013.
[6] D. L. Sterchi, “Bone,” in Bancrofts Theory and Practice of Histological
Techniques, 7th ed., J. Suvarna, Kim S, Layton C, Bancroft, Ed. Sheffield:
Elsevier, 2016, pp. 317 – 352.
[7] D. C. Brown and K. C. Gatter, “The bone marrow trephine biopsy: a review of
normal histology.,” Histopathology, vol. 22, no. 5, pp. 411–422, 1993.
[8] G. Wittenburg, C. Volkel, R. Mai, and G. Lauer, “Immunohistochemical
Comparison of Differentiation Markers on Paraffin and Plastic Embedded
Human Bone Samples,” J. Physiol. Pharmacol., vol. 60, no. 19, pp. 43–49,
2009.
[9] E. Aaron and D. Howard, “Rapid Preparation of Fresh-Frozen Undecalcified
Bone for Histological and Histochemical Analysis,” J. Histochem. Cytochem.,
vol. 35, no. 3, pp. 361–369, 1987.
[10] M. M. Bui, P. Smith, S. V Agresta, D. Cheong, and G. D. Letson, “Practical
Issues of Intraoperative Frozen Section Diagnosis of Bone and Soft Tissue
Lesions,” Cancer Control, vol. 15, no. 1, pp. 7–12, 2008.
[11] J. K. Gong, J. . . Arnold, and S. H. Cohn, “Composition of trabecular and
cortical bone,” Anat. Rec., vol. 149, pp. 325–331, 1964.
[12] B. Clarke, “Normal bone anatomy and physiology.,” Clin. J. Am. Soc.
Nephrol., vol. 3 Suppl 3, pp. S131–9, Nov. 2008.
[13] H. H. W. Verdenius and L. Alma, “A Quantative Study of Decalcification
Methods in Histology,” J. Clin. Pathol., no. 11, pp. 229 – 236, 1958.
[14] H. Mullink, S. C. Henzen-Logmans, T. M. Tadema, J. J. Mol, and C. J.
Meijer, “Influence of fixation and decalcification on the immunohistochemical
88 Bibliography
staining of cell-specific markers in paraffin-embedded human bone biopsies.,”
J. Histochem. Cytochem., vol. 33, no. 11, pp. 1103–1109, Nov. 1985.
[15] R. A. Skinner, S. G. Hickmon, K. Charles, and L. Rock, “Decalcified Bone :
Twenty Years of Successful Specimen Management,” J. Histotechnol., vol.
20, no. 3, pp. 267 – 277, 1997.
[16] P. Kramer, B; Shipley, “Decalcification of bones in acid free solutions,”
Science (80-. )., vol. 66, no. 1716, pp. 484 – 485, 1923.
[17] E. J. Coleman and S. J. Desalva, “Rapid Decalcification for Histochemistry,”
J. Dent. Res., vol. 45, no. 4, pp. 1237–1237, Jul. 1966.
[18] I. Kiviranta, M. Tammi, R. Lappalainen, T. Kuusela, and H. J. Helminen,
“The Rate of Calcium Extraction During EDTA Decalcification from Thin
Bone Slices as Assessed with Atomic Absorption Spectrophotometry,”
Histochemistry, vol. 127, no. 68, pp. 119–127, 1980.
[19] B. et al. Mawhinney W, H, “Control of rapid nitric acid decalcifcation,” J.
Clin. Pathol., vol. 37, pp. 1409–1413, 1984.
[20] V. J. Madden and M. M. Henson, “Rapid decalcification of temporal bones
with preservation of ultrastructure,” Hear. Res., vol. 111, no. 1–2, pp. 76–84,
Sep. 1997.
[21] E. M. Keithley, T. Truong, B. Chandronait, and P. B. Billings,
“Immunohistochemistry and microwave decalcification of human temporal
bones,” Hear. Res., vol. 148, pp. 192–196, 2000.
[22] S. Jimson, N. Balachander, K. M. K. Masthan, and R. Elumalai, “A
Comparative Study in Bone Decalcification Using Different Decalcifying
Agents,” Int. J. Sci. Res., vol. 3, no. 8, pp. 2012–2015, 2014.
[23] A. N. Athanasou, J. Quinn, A. Heryet, C. G. Woods, and J. O. McGee, “Effect
of decalcification agents on immunoreactivity of cellular antigens,” J. Clin.
Pathol., vol. 40, no. March, pp. 874–878, 1987.
[24] S. A. González-chávez, C. Pacheco-tena, C. E. Macías-vázquez, and E.
Luévano-flores, “Assessment of different decalcifying protocols on
Osteopontin and Osteocalcin immunostaining in whole bone specimens of
arthritis rat model by confocal immunofluorescence,” Int. J. Clin. Exp.
Pathol., vol. 6, no. 10, pp. 1972–1983, 2013.
[25] M. J. Klein and V. a. Memoli, “Orthopaedic specimen preparation: what
pathologists should know and do,” Semin. Diagn. Pathol., vol. 28, no. 1, pp.
4–12, Feb. 2011.
[26] G. Callis and D. Sterchi, “Review Decalcification of Bone : Literature Review
and Practical Study of Various Decalcifying Agents, Methods and Their
Effects on Bone Histology,” J. Histotechnol., vol. 21, no. 1, pp. 49 – 58, 2001.
[27] H. Ehrlich, P. G. Koutsoukos, K. D. Demadis, and O. S. Pokrovsky,
“Principles of demineralization: modern strategies for the isolation of organic
frameworks. Part II. Decalcification.,” Micron, vol. 40, no. 2, pp. 169–93, Feb.
2009.
[28] Y. Shibata, S. Fujita, H. Takahashi, A. Yamaguchi, and T. Koji, “Assessment
of decalcifying protocols for detection of specific RNA by non-radioactive in
situ hybridization in calcified tissues,” Histochem. Cell Biol., no. 113, pp.

Bibliography 89
153–159, 2000.
[29] G. V Guibas, S. Lakis, C. Gkimpas, M. Manda, D. Kapoukranidou, and E.
Spandou, “Efficiency of different decalcification protocols for nasal osseous
structures in a rat experimental model of allergic rhinitis, and their effects on
epithelial histology: An attempt at standardization.,” Exp. Toxicol. Pathol.,
vol. 66, no. 9–10, pp. 469–475, Sep. 2014.
[30] A. Hosoya, K. Hoshi, N. Sahara, T. Ninomiya, S. Akahane, T. Kawamoto, and
H. Ozawa, “Effects of fixation and decalcification on the
immunohistochemical localization of bone matrix proteins in fresh-frozen
bone sections.,” Histochem. Cell Biol., vol. 123, no. 6, pp. 639–46, Jun. 2005.
[31] M. Yoshioka, Y. Yoshida, S. Inoue, P. Lambrechts, G. Vanherle, Y. Nomura,
M. Okazaki, H. Shintani, and B. Van Meerbeek, “Adhesion / decalcification
mechanisms of acid interactions with human hard tissues,” J. Biomed. Mater.
Res., no. 59, pp. 56 – 62, 2002.
[32] C. Lee, S.-H. Chan, H.-Y. Lai, and S.-T. Lee, “A method to develop an in
vitro osteoporosis model of porcine vertebrae: histological and biomechanical
study.,” J. Neurosurg. Spine, vol. 14, no. 6, pp. 789–98, Jun. 2011.
[33] I. B. Dimenstein, “Bone grossing techniques: helpful hints and procedures.,”
Ann. Diagn. Pathol., vol. 12, no. 3, pp. 191–8, Jun. 2008.
[34] W. H. M. Muller, W. Breuer, “Immunohistological Demonstration of
Erythroid Cells in Canine Bone Marrow,” J. Vetrinary Med., vol. 57, pp. 51–
57, 2001.
[35] D. Rosen, “End-Point Determination in EDTA Decalcification Using
Ammonium Oxalate,” Stain Technol., vol. 56, no. 1, pp. 48–49, 1981.
[36] W. De Souza, A. N. A. C. Issy, V. A. Castania, J. O. Ao, D. L. Pitol, M. L.
Castania, A. D. Neto, E. Aparecida, D. E. L. Bel, H. Luiz, and A. Defino,
“Advantages of a Combined Method of Decalcification Compared to EDTA,”
Microsc. Res. Tech., vol. 00, no. August, pp. 1–8, 2014.
[37] G. S. Travlos, “Normal structure, function, and histology of the bone
marrow.,” Toxicol. Pathol., vol. 34, no. 5, pp. 548–565, 2006.
[38] J. D. S. Neves, N. F. Omar, E. A. O. Narvaes, J. R. Gomes, and P. D. Novaes,
“Influence of different decalcifying agents on EGF and EGFR
immunostaining.,” Acta Histochem., vol. 113, no. 4, pp. 484–8, Jul. 2011.
[39] C. Sanderson, K. Radley, and L. Mayton, “Ethylenediaminetetraacetic acid in
ammonium hydroxide for reducing decalcification time.,” Biotech.
Histochem., vol. 70, no. 1, pp. 12–8, Jan. 1995.
[40] C. D. Cunningham, B. a Schulte, L. M. Bianchi, P. C. Weber, and B. N.
Schmiedt, “Microwave decalcification of human temporal bones.,”
Laryngoscope, vol. 111, no. 2, pp. 278–82, Feb. 2001.
[41] S. L. Gruntz, H. T. Ascp, and V. English, “EXPEDITED BONE
THROUGHPUT USING MICROWAVE DECALCIFICATION,” Histologic,
vol. 44, no. 1, pp. 1–5, 2011.
[42] K. Kito, H. Kagami, and C. Kobayashi, “Effects of Cryopreservation on
Histology and Viability of Cultured Corneal Epithelial Cell Sheets in Rabbit,”
Cornea, vol. 24, no. 6, pp. 735–741, 2005.
90 Bibliography
[43] I. Louw, D. P. De Beer, and M. J. Du Plessis, “Microwave histoprocessing of
bone marrow trephine biopsies,” Histochem. J., vol. 26, no. 11, pp. 487–494,
1994.
[44] H. Hatta, K. Tsuneyama, K. Nomoto, S. Hayashi, S. Miwa, T. Nakajima, T.
Nishida, Y. Nakanishi, and J. Imura, “A simple and rapid decalcification
procedure of skeletal tissues for pathology using an ultrasonic cleaner with D-
mannitol and formic acid.,” Acta Histochem., no. 5, pp. 753 – 757, Feb. 2014.
[45] E. C. Weisberger, M. Hilburn, B. Johnson, and C. Nguyen, “Intraoperative
microwave processing of bone margins during resection of head and neck
cancer.,” Arch. Otolaryngol. Head. Neck Surg., vol. 127, no. 7, pp. 790–3, Jul.
2001.
[46] P. et al. Tinling S, “Microwave exposure increases bone demineralization
rate,” J. Microsc., vol. 215, no. October 2003, pp. 230–235, 2004.
[47] W. J. Howat and B. a Wilson, “Tissue fixation and the effect of molecular
fixatives on downstream staining procedures.,” Methods, vol. 70, no. 1, pp. 12
– 19, Feb. 2014.
[48] A. Cho, S. Suzuki, J. Hatakeyama, N. Haruyama, and A. B. Kulkarni, “A
method for rapid demineralization of teeth and bones.,” Open Dent. J., vol. 4,
pp. 223–229, 2010.
[49] M. Kaneko, T. Tomita, T. Nakase, E. Takeuchi, and M. Iwasaki, “Rapid
Decalcification Using Microwaves for in Situ Hybridization in Skeletal
Tissues,” Biotech. Histochem., vol. 74, no. 1, pp. 49–54, 1998.
[50] S. G. Pearce, A.I. Richards, R.G. Milz, S. Schneider, E. & Pearce, “Animal
Models for Implant Biomaterial Research in Bone : A Review,” Eur. Cells
Mater., vol. 13, no. 0, pp. 1–10, 2007.
[51] K. Lampropoulou-Adamidou, P. Lelovas, E. V Karadimas, C. Liakou, I. K.
Triantafillopoulos, I. Dontas, and N. a Papaioannou, “Useful animal models
for the research of osteoarthritis.,” Eur. J. Orthop. Surg. Traumatol., vol. 24,
no. 3, pp. 263–71, Apr. 2014.
[52] Y. Hua, O. Nackaerts, J. Duyck, F. Maes, and R. Jacobs, “Bone quality
assessment based on cone beam computed tomography imaging,” Clin. Oral
Implants Res., vol. 20, no. 8, pp. 767–771, 2009.
[53] R. Thorat, U. Joshi, N. Krishnamoorthy, and N. Jambhekar, “Simultaneous
fixation and decalcification protocol for bone specimens,” J. Histotechnol.,
vol. 34, no. 4, pp. 162–164, 2011.
[54] T. Buclin, M. Cosma, M. Appenzeller, a. F. Jacquet, L. a. Décosterd, J.
Biollaz, and P. Burckhardt, “Diet acids and alkalis influence calcium retention
in bone,” Osteoporos. Int., vol. 12, no. 6, pp. 493–499, 2001.
[55] F. Masahiko. M., Minoru. I. & Shoyuki., “Decalcification For Histochemical
Demonstration of Hydrolytic and Oxidative Enzymes,” Histochemistry, vol.
195, no. 5, pp. 185–195, 1965.
[56] A. L. Marr and A. Wong, “Effects of Microwave Fixation and Decalcification
on Rodent Tissue,” J. Histotechnol., vol. 32, no. 4, pp. 190–192, Dec. 2009.
[57] S. P. Tinling, R. T. Giberson, and R. S. Kullar, “Microwave exposure
increases bone demineralization rate,” J. Microsc., vol. 215, no. September
Bibliography 91
2004, pp. 230–235, 2004.
[58] Z. Hao, V. L. Kalscheur, and P. Muir, “Decalcification of Bone for
Histochemistry and Immunohistochemistry Procedures,” J. Histotechnol., vol.
25, no. 1, pp. 33 – 37, 2015.
[59] L. F. Bélanger, D. H. Copp, and M. A. Morton, “Demineralization with EDTA
by constant replacement,” Anat. Rec., vol. 153, no. 1, pp. 41–47, Sep. 1965.
[60] E. Ippolito, S. LaVelle, and V. Pedrini, “The effect of various decalcifying
agents on cartilage proteoglycans.,” Stain Technol., vol. 56, no. 6, pp. 367–
373, 1981.
[61] A. H. Vermeulen, C. Vermeer, and F. T. Bosman, “Histochemical detection of
osteocalcin in normal and pathological human bone.,” J. Histochem.
Cytochem., vol. 37, no. 10, pp. 1503–1508, Oct. 1989.
[62] S. S. Chuang, Y. C. Jung, and C. Y. Li, “von Willebrand factor is the most
reliable immunohistochemical marker for megakaryocytes of myelodysplastic
syndrome and chronic myeloproliferative disorders.,” Am. J. Clin. Pathol.,
vol. 113, no. 4, pp. 506–511, 2000.
[63] H. A. Hunter, G., Nikiforuk, “Staining Reactions Following Demineralization
of Hard Tissues and Other Decalcifying Agents,” J. Dent. Res., vol. 50, pp.
136–138, 1953.
[64] R. W. Jubb and F. M. Eggert, “Staining of demineralized cartilage,”
Histochemistry, vol. 73, no. 3, pp. 391–396, 1981.
[65] V. B. Kraus, J. L. Huebner, J. DeGroot, and a. Bendele, “The OARSI
histopathology initiative - recommendations for histological assessments of
osteoarthritis in the guinea pig,” Osteoarthr. Cartil., vol. 18, no. SUPPL. 3,
pp. S80–S92, 2010.
[66] M. Y. Loqman, P. G. Bush, C. Farquharson, and A. C. Hall, “A Cell
Shrinkage Artefact in Growth Plate Chondrocytes With Common Fixative
Solutions : Importance of Fixative Osmolarity for Maintaining Morphology,”
Eur. Cells Mater., vol. 19, no. 0, pp. 214–227, 2010.
[67] C. Hoemann, R. Kandel, S. Roberts, D. B. F. Saris, L. Creemers, P. Mainil-
Varlet, S. Methot, a. P. Hollander, and M. D. Buschmann, “International
Cartilage Repair Society (ICRS) Recommended Guidelines for Histological
Endpoints for Cartilage Repair Studies in Animal Models and Clinical Trials,”
Cartilage, vol. 2, no. 2, pp. 153–172, 2011.
[68] A. S. Leong, J. Milios, and C. G. Duncis, “Antigen Preservation in
Microwave-Irradiated Tissues: A Comparison With Formaldehyde Fixation.,”
J. Pathol., vol. 156, no. 4, pp. 275–282, 1988.
[69] G. R. Login and a M. Dvorak, “Microwave Fixation Provides Excellent
Preservation of Tissue, Cells and Antigens for Light and Electron
Microscopy.,” Histochem. J., vol. 20, no. 6–7, pp. 373–387, 1988.
[70] J. Song, J. Mizuno, Y. Hashizume, and H. Nakagawa, “Immunohistochemistry
of symptomatic hypertrophy of the posterior longitudinal ligament with
special reference to ligamentous ossification.,” Spinal cord Off. J. Int. Med.
Soc. Paraplegia, vol. 44, no. 9, pp. 576–581, 2006.
[71] H. Starklint, G. S. Lausten, and C. C. Arnoldi, “Microvascular obstruction in

92 Bibliography
avascular necrosis. Immunohistochemistry of 14 femoral heads.,” Acta
Orthop. Scand., vol. 66, no. 1, pp. 9–12, 1995.

93
Chapter 7: Appendix A
Mice Collagen type 1 negative control
Mice Collagen type 1 isotype control
Mice vWF negative control
Mice vWF isotype control
Rat Collagen type 1 negative control
Rat Collagen type 1 isotype control
Rat vWF negative control
Rat vWF isotype control
Sheep Collagen type 1 negative control
Sheep vWF negative control
Representative images of positive vWF stained blood vessels
Representative images of positive vWF stained cells in the bone marrow
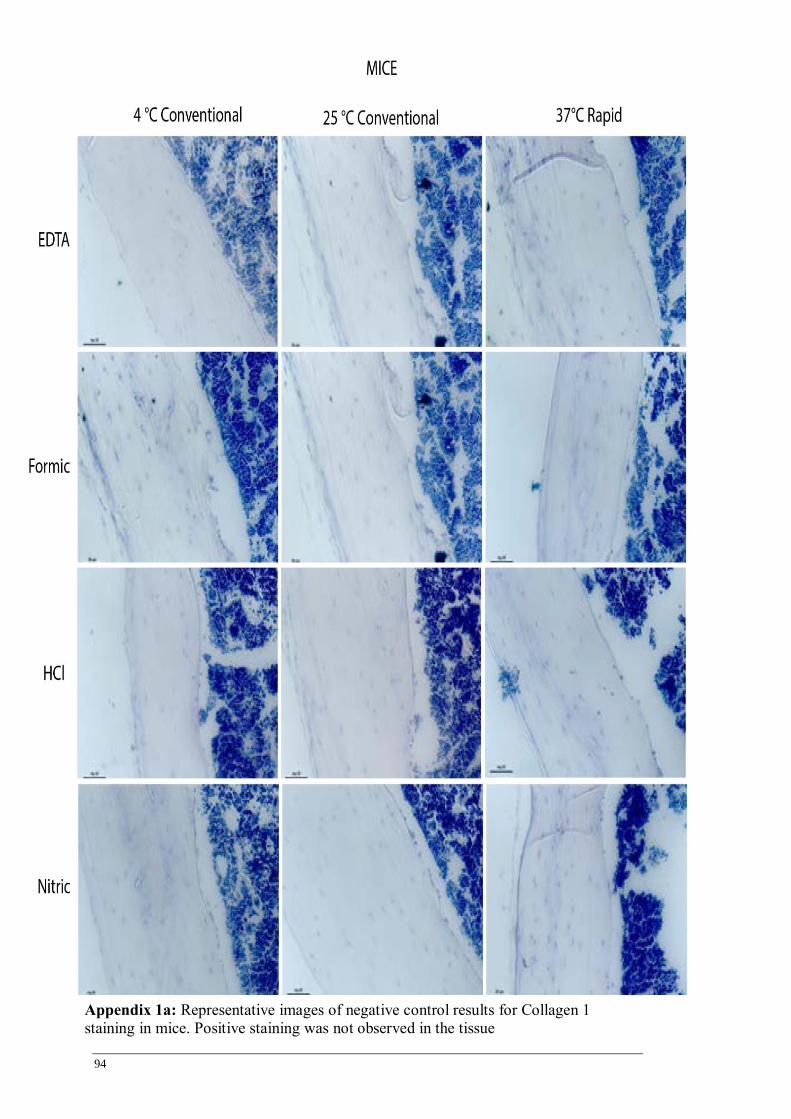
94
Appendix 1a: Representative images of negative control results for Collagen 1
staining in mice. Positive staining was not observed in the tissue

95
Appendix 1b: Representative images of isotype control results for Collagen 1 staining
in mice. Positive staining was not observed in the tissue
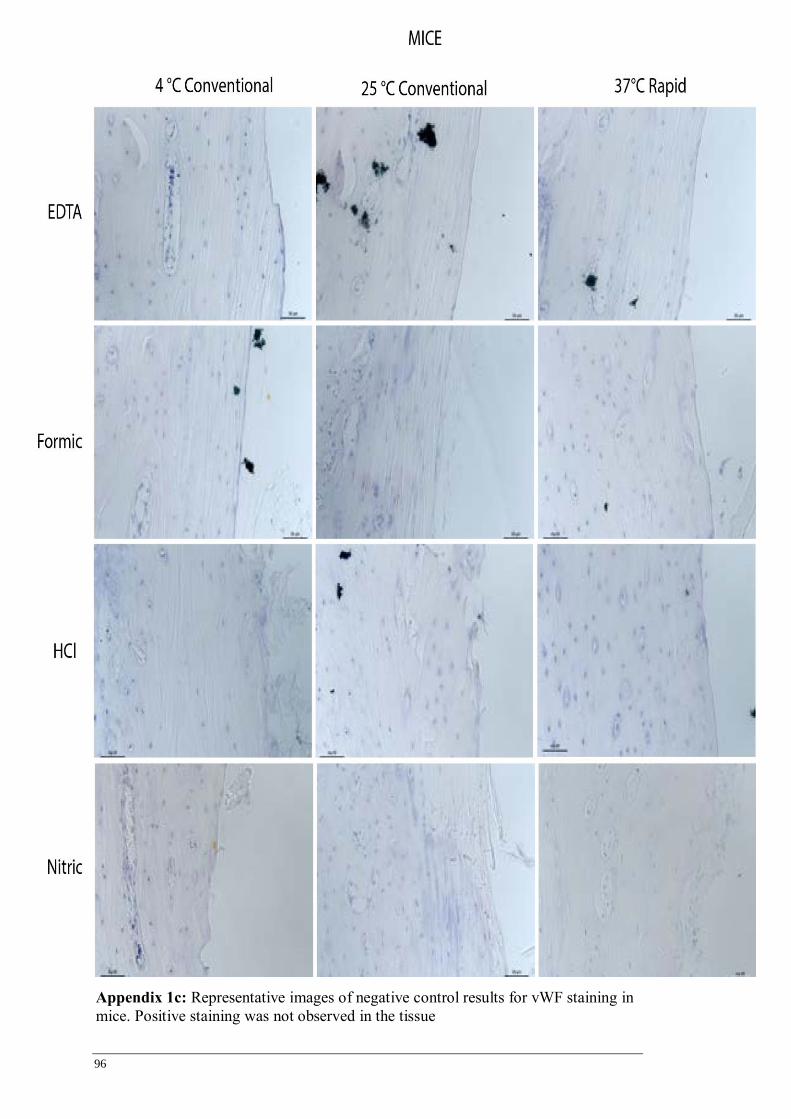
96
Appendix 1c: Representative images of negative control results for vWF staining in
mice. Positive staining was not observed in the tissue

97
Appendix 1d: Representative images of isotype control results for vWF staining in
mice. Positive staining was not observed in the tissue
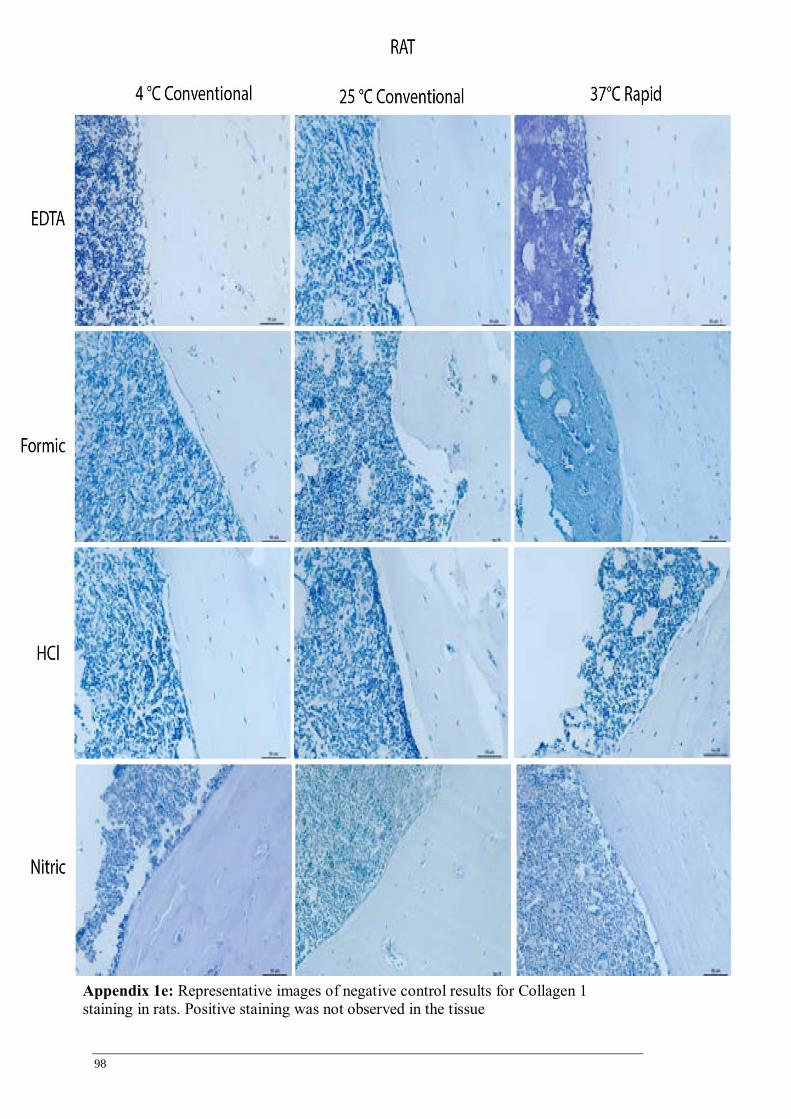
98
Appendix 1e: Representative images of negative control results for Collagen 1
staining in rats. Positive staining was not observed in the tissue
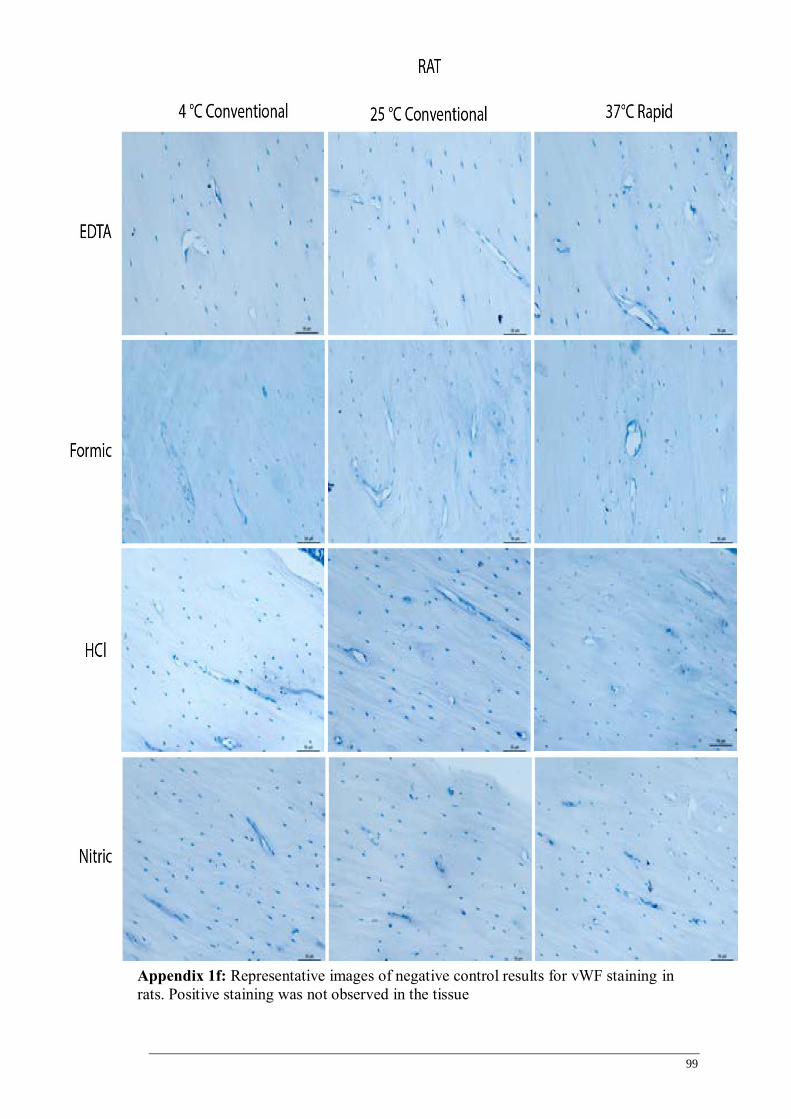
99
Appendix 1f: Representative images of negative control results for vWF staining in
rats. Positive staining was not observed in the tissue

100
Appendix 1g: Representative images of isotype control results for Collagen 1 staining
in rats. Positive staining was not observed in the tissue
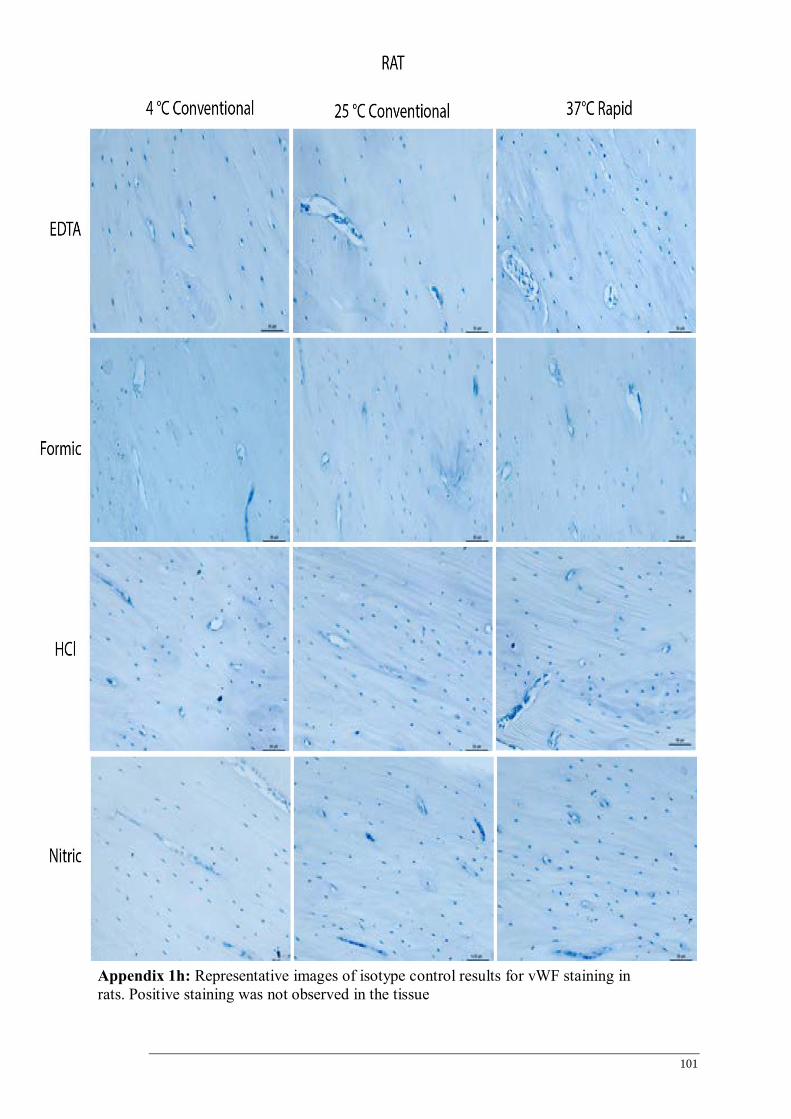
101
Appendix 1h: Representative images of isotype control results for vWF staining in
rats. Positive staining was not observed in the tissue

102
Appendix 1i: Representative images of negative control results for Collagen 1 staining
in sheep. Positive staining was not observed in the tissue

103
Appendix 1j: Representative images of negative control results for vWF staining in
sheep. Positive staining was not observed in the tissue
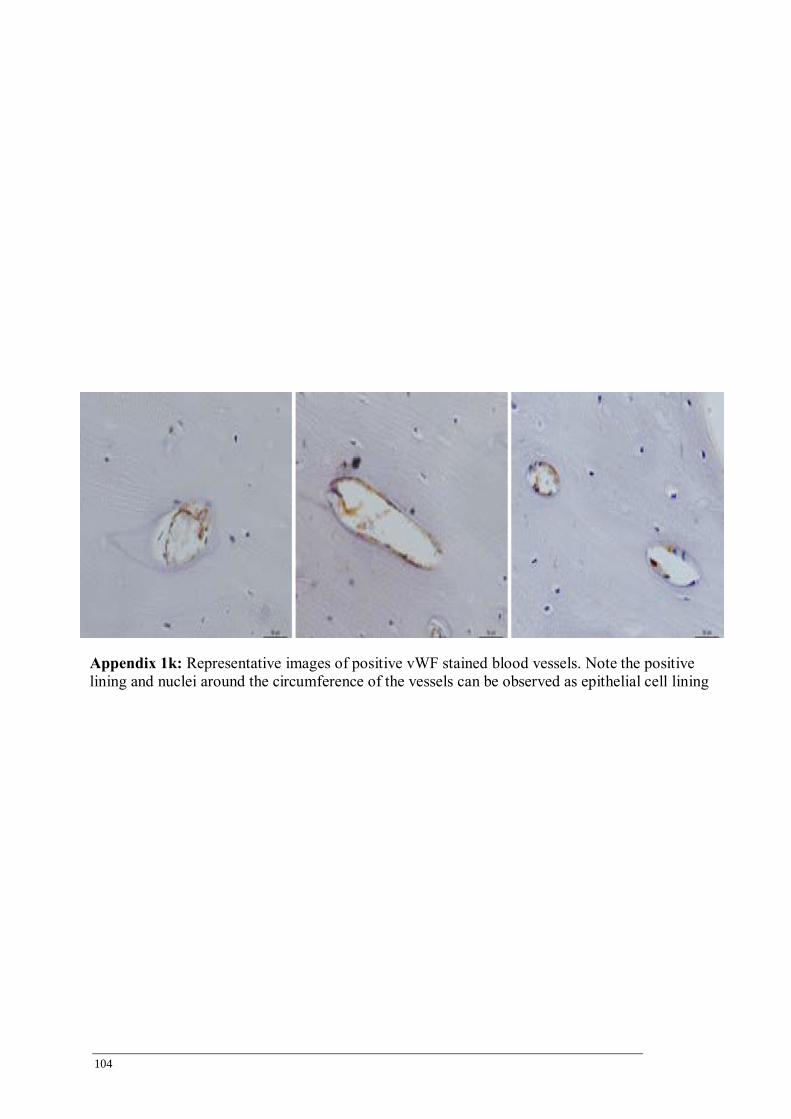
104
Appendix 1k: Representative images of positive vWF stained blood vessels. Note the positive
lining and nuclei around the circumference of the vessels can be observed as epithelial cell lining

105
Appendix 1l: Representative images of positive vWF stained cells in the bone marrow.
Megakaryocytes in the bone marrow express vWF. The staining is specific for these large
multinucleated cells.