Bollinger Bands
24
Bollinger Bands By: Reggie Mah Anne Campbell Jessica Holtrom
-
Upload
guest1d1ac3 -
Category
Business
-
view
2.546 -
download
33
description
Transcript of Bollinger Bands

Bollinger Bands
By: Reggie Mah
Anne CampbellJessica Holtrom

What is It?
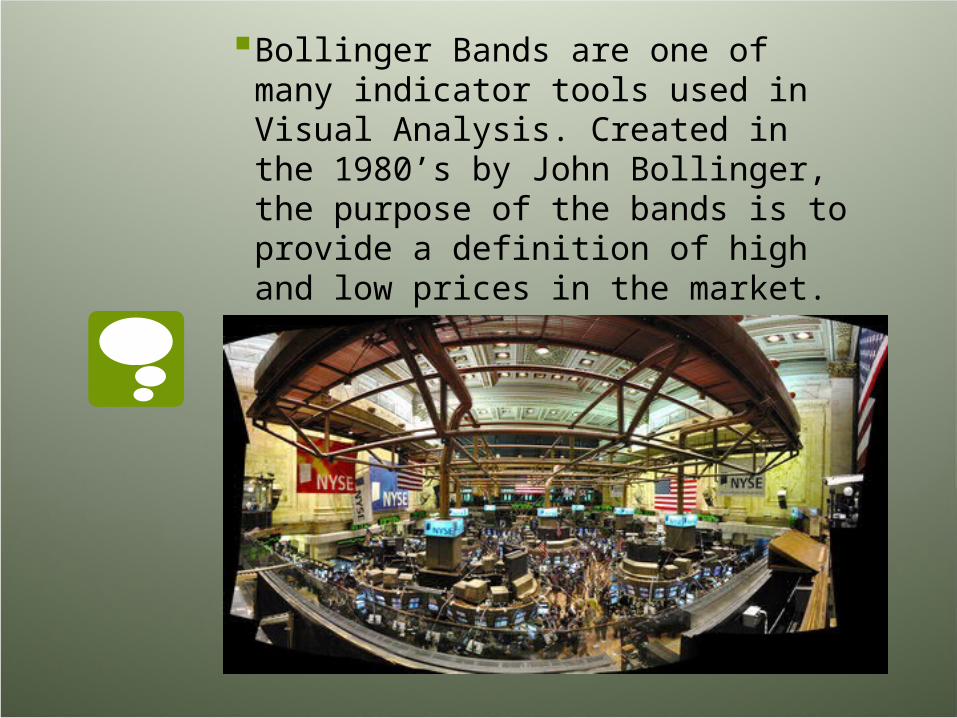
Bollinger Bands are one of many indicator tools used in Visual Analysis. Created in the 1980’s by John Bollinger, the purpose of the bands is to provide a definition of high and low prices in the market.
John Bollinger
John Bollinger was the first to acknowledge "tags of the bands are just that - tags, not signals. A tag of the upper Bollinger band is not in and of itself a sell signal. A tag of the lower Bollinger band is not in and of itself a buy signal". (Schlossberg, 2008)
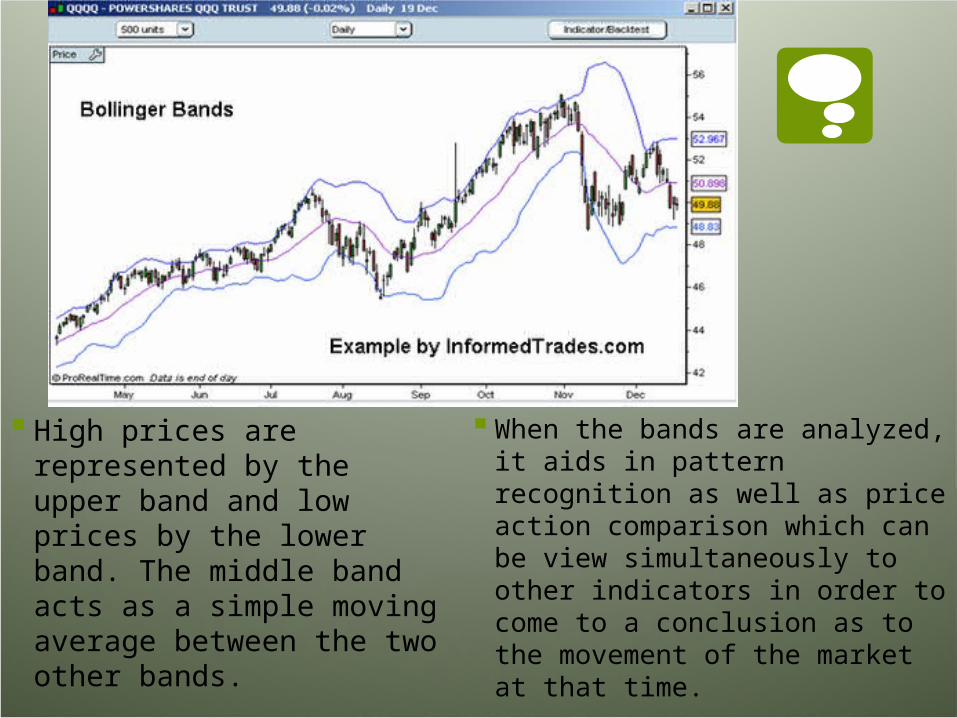
High prices are represented by the upper band and low prices by the lower band. The middle band acts as a simple moving average between the two other bands.
When the bands are analyzed, it aids in pattern recognition as well as price action comparison which can be view simultaneously to other indicators in order to come to a conclusion as to the movement of the market at that time.
Buy or Sell?
If a stock price hits the lower band, many traders usually buy and if prices tend to stick on the middle moving average band it is a sign to exit the market.
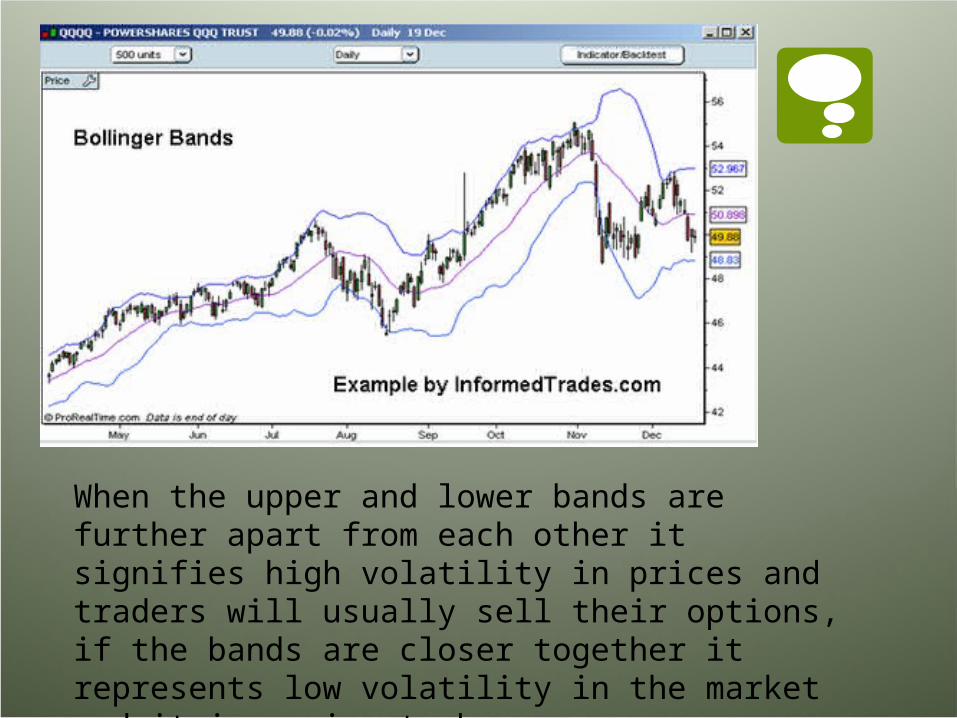
When the upper and lower bands are further apart from each other it signifies high volatility in prices and traders will usually sell their options, if the bands are closer together it represents low volatility in the market and it is a sign to buy.

ExampleGoogle Stock
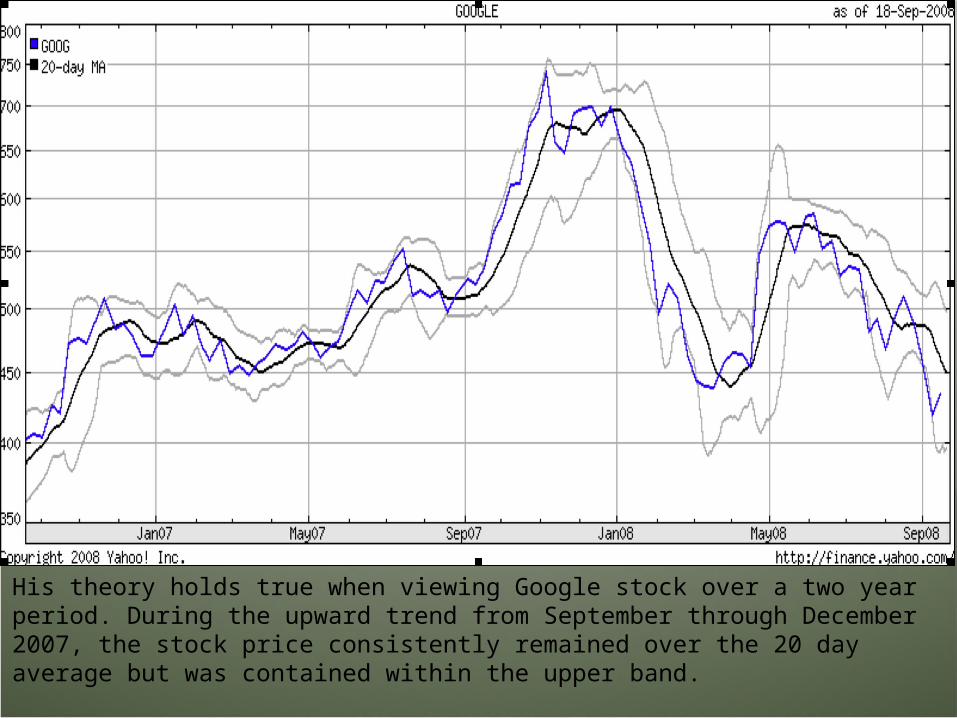
His theory holds true when viewing Google stock over a two year period. During the upward trend from September through December 2007, the stock price consistently remained over the 20 day average but was contained within the upper band.
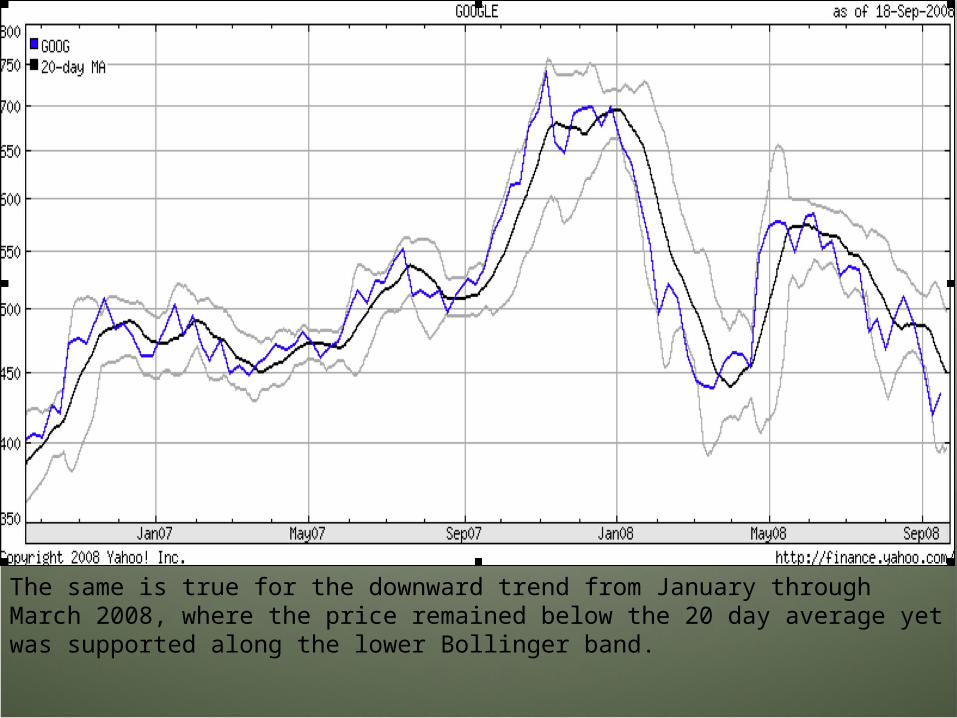
The same is true for the downward trend from January through March 2008, where the price remained below the 20 day average yet was supported along the lower Bollinger band.

ExampleStarbucks Corporation.
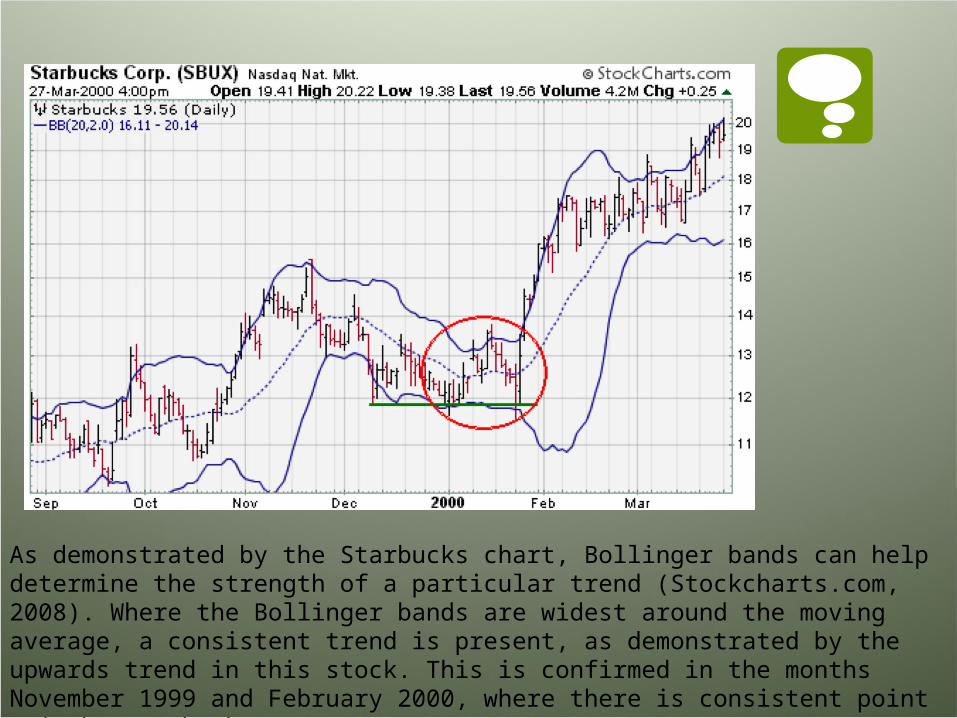
As demonstrated by the Starbucks chart, Bollinger bands can help determine the strength of a particular trend (Stockcharts.com, 2008). Where the Bollinger bands are widest around the moving average, a consistent trend is present, as demonstrated by the upwards trend in this stock. This is confirmed in the months November 1999 and February 2000, where there is consistent point gain by Starbucks.
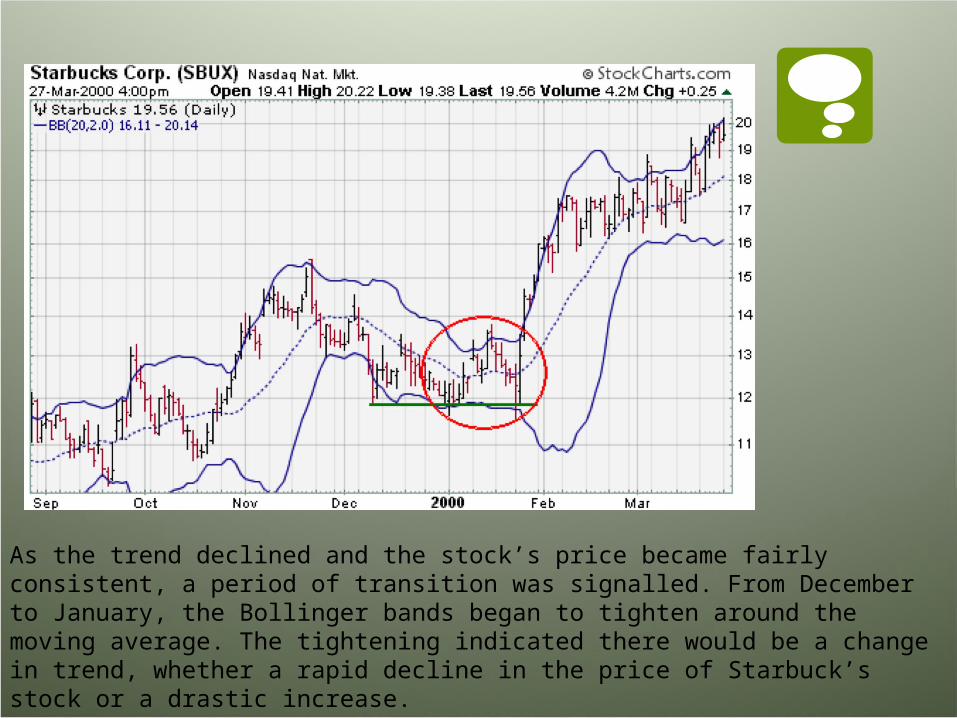
As the trend declined and the stock’s price became fairly consistent, a period of transition was signalled. From December to January, the Bollinger bands began to tighten around the moving average. The tightening indicated there would be a change in trend, whether a rapid decline in the price of Starbuck’s stock or a drastic increase.

How are They Calculated?
Usually based on a 20-day simple moving average, Bollinger Bands are calculated two standard deviations away from the 20 day trend. These points are plotted and then analyzed to see their connection to the moving average.
The average time can be lengthened in order to view a greater time portion of the market however; the standard deviation calculations must be altered in order to match the simple moving average.
If the number of periods was lengthened to 50 days then the standard deviations would be calculated to two and a tenth. If the period was decreased to only 10 days to view a smaller segment of the market, then the calculated standard deviations would be one and nine tenths.
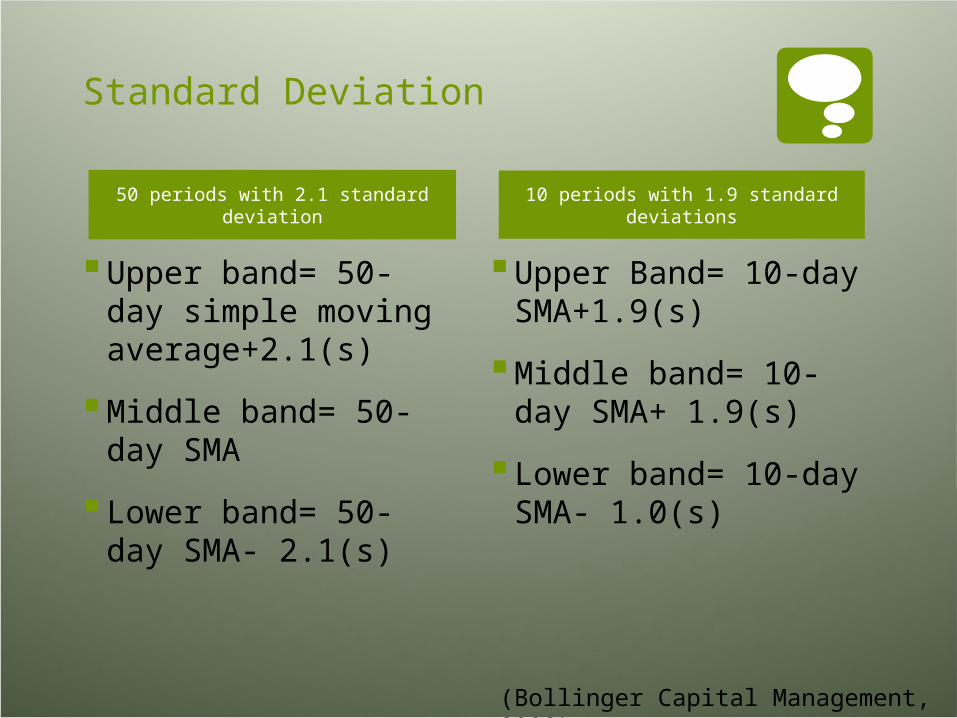
Standard Deviation
50 periods with 2.1 standard deviation
Upper band= 50- day simple moving average+2.1(s)
Middle band= 50- day SMA
Lower band= 50- day SMA- 2.1(s)
10 periods with 1.9 standard deviations
Upper Band= 10-day SMA+1.9(s)
Middle band= 10-day SMA+ 1.9(s)
Lower band= 10-day SMA- 1.0(s)
(Bollinger Capital Management, 2008)

Aftermath
The calculated standard deviations help to determine where price is channeling and what decisions should be made in order to buy or sell. If prices are located between +1 or +2 standard deviations away from the SMA (simple moving average) the channel can be seen as a buy zone, and conversely if prices fall within -1 or -2 standard deviations from the mean the channel is seen as a sell zone.
Prices can follow a variety of patterns and although the Bollinger bands are extremely efficient in calculating and analyzing prices within the market, it is important to know that prices can and will make very little movement from the simple moving average and it is important to not immediately sell or buy during these times

John MurphyHis Theory
John Murphy suggests that where the stock price stays above the 20 day average yet meets resistance from the upper band, the market tends to be bullish. The opposite is true for a bearish market, where the price is below the moving average yet has support from the lower band (Murphy, 1996)
It is important to realize that Bollinger bands cannot predict whether the trend will be upward or downward, but rather only the strength of a trend (Murphy, 1996).
The Conclusion
Overall, Bollinger bands have been proven to be a useful tool in technical analysis. By predicting the strength of trends, as well as helping in determining the volatility of the market, Bollinger bands give investors clues as to when to buy or sell a particular stock for the highest possible profit.
![[John a. Bollinger] Bollinger on Bollinger Bands](https://static.fdocuments.in/doc/165x107/56d6bd1d1a28ab30168cb4d0/john-a-bollinger-bollinger-on-bollinger-bands.jpg)


![The Bollinger Bands Swing Trading System[1]](https://static.fdocuments.in/doc/165x107/547eeaf25906b597718b47c9/the-bollinger-bands-swing-trading-system1.jpg)