
Bolin Creek Floodway Modification DESCRIPTION / BACKGROUND ... Hydraulic Analysis Summary Report...
74
Transcript of Bolin Creek Floodway Modification DESCRIPTION / BACKGROUND ... Hydraulic Analysis Summary Report...

wta
Text Box
For Review

Hydraulic Analysis Summary Report Table of Contents Pigg River Power Dam Removal Page 1 of 1 Franklin County, VA August 27, 2015
HYDRAULIC ANALYSIS SUMMARY REPORT
PIGG RIVER POWER DAM REMOVAL
FRANKLIN COUNTY, VA
AUGUST 27, 2015
Table of Contents
EXECUTIVE SUMMARY ......................................................................................... 1
PROJECT DESCRIPTION / BACKGROUND .............................................................. 2
DESCRIPTION OF PROPOSED ALTERATIONS ........................................................ 3
DEVELOPMENT OF HYDRAULIC MODEL ............................................................... 3
RESULTS OF ANALYSIS .......................................................................................... 5
CONCLUSIONS ...................................................................................................... 7
APPENDIX A PROPOSED DAM REMOVAL EXHIBIT
APPENDIX B RELEVANT HEC‐2 DATA
APPENDIX C HEC‐RAS INPUT AND OUTPUT DATA
APPENDIX C‐1 HEC‐RAS SUMMARY OUTPUT TABLE FOR EXISTING & PROPOSED
CONDITIONS MODEL
APPENDIX C‐2 HEC‐RAS PROFILE OUTPUT FOR EXISTING & PROPOSED
CONDITIONS MODEL
APPENDIX C‐3 HEC‐RAS INPUT DATA FOR EXISTING & PROPOSED CONDITIONS
MODEL

Hydraulic Analysis Summary Report Page 1 of 8 Pigg River Power Dam Removal Franklin County, VA August 27, 2015
1. EXECUTIVE SUMMARY
The Friends of the Rivers of Virginia, Inc. (FORVA) and the U.S. Fish and Wildlife Service
propose to remove the existing power dam situated on the Pigg River just upstream of
the Virginia Route 713 (Power Dam Road) Bridge in Franklin County, VA. The project site
is located within an area of the Pigg River that is determined to be within the Special
Flood Hazard Area (SFHA) and the designated Floodway as delineated on Flood
Insurance Rate Map (FIRM) Number 51067C0351C, dated December 16, 2008. As such,
the project may require approvals from Division of Federal Insurance Administration – a
division of Federal Emergency Management Agency (FEMA) and Franklin County
(Floodplain Management Ordinance) for certain impacts to the floodplain and floodway.
Mattern & Craig has been commissioned to perform a hydraulic analysis that may be
required during the permitting process for the partial removal of the dam. The
hydraulic analysis (flood study) will determine impacts of the removal of the dam on the
adopted Flood Insurance Rate Maps (FIRM). The hydraulic analysis may also be used by
others to perform a sediment transport analysis to estimate the sediment transport
modes and sediment loads downstream of the dam.
The results of the hydraulic analysis indicate that when comparing the results between
an Existing Conditions Model and a Proposed Conditions Model, the removal of the Pigg
River Dam did not result in an increase in the computed base flood elevation at the
dam, the existing bridge locate just downstream of the dam, at cross sections located
downstream of the dam and bridge, and at cross sections located immediately upstream
of the dam.
The disposition of final permitting will be determined by the Franklin County Floodplain
Manager and Zoning Administrator upon review of the finding of this report.

Hydraulic Analysis Summary Report Page 2 of 8 Pigg River Power Dam Removal Franklin County, VA August 27, 2015
2. PROJECT DESCRIPTION / BACKGROUND
a. The project involves the controlled removal of an existing power dam
(constructed in 1915) from the Pigg River with the goal of restoring
approximately 2.2 miles of the Pigg River to its natural flow condition and
regime. The project is a joint effort undertaken by the Friends of the Rivers
of Virginia, Inc. (FORVA) and the U.S. Fish and Wildlife Service. The dam is
situated on property currently owned by FORVA and is identified as Tax
Parcel No. 0630020500 by the Franklin County tax records. Mattern & Craig
has been commissioned to perform a hydraulic analysis that may be required
during the permitting process for the partial removal of the dam. The
hydraulic analysis (flood study) will determine impacts of the removal of the
dam on the adopted Flood Insurance Rate Maps (FIRM). The hydraulic
analysis may also be used by others to perform a sediment transport analysis
to estimate the sediment transport modes and sediment loads downstream
of the dam.
b. The project is located within an area of the Pigg River that is determined to
be within the Special Flood Hazard Area (SFHA) and the designated Floodway
as delineated on Flood Insurance Rate Map (FIRM) Number 51067C0351C,
dated December 16, 2008. The Franklin County Floodplain Management
Ordinance requires that “prior to any proposed alteration or relocation of
any channel or floodway of any watercourse, stream or the like within the
county, approval shall be obtained from the Division of Federal Insurance
Administration” – a division of Federal Emergency Management Agency
(FEMA). As such, it is understood that the controlled and partial removal of
the dam will constitute an “alteration or relocation of any channel or
floodway” and that a Conditional Letter of Map Revision (CLOMR) will be
required from FEMA prior to approval of the project by Franklin County. It is

Hydraulic Analysis Summary Report Page 3 of 8 Pigg River Power Dam Removal Franklin County, VA August 27, 2015
noted that most ordinances require the pursuit of a CLOMR when fill is place
in the Floodway as this will tent to result in an increase in the base flood
elevation.
c. It is also noted in the County’s Floodplain Management Ordinance that “a
permit shall be obtained from the U. S. Corps of Engineers, the Virginia
Department of Environmental Quality, and the Virginia Marine Resources
Commission.”
3. DESCRIPTION OF PROPOSED ALTERATIONS
a. Dam removal will be conducted as illustrated in Appendix A – “Proposed
Dam Removal.”
4. DEVELOPMENT OF HYDRAULIC MODEL
a. The hydraulic model used in this analysis was obtained from the Federal
Emergency Management Agency (FEMA) archives library. The original
analysis was performed in 1978 and the model was provided as a scanned /
microfiche print out of the input and output data from an original U.S. Army
Corps of Engineers HEC‐2 Model. It is noted that the effective Flood
Insurance Study (FIS) for the areas is dated January 6, 2010. The FIS and the
FIRM are both based on hydrologic and hydraulic analysis conducted in 1978.
b. Relevant sections of the HEC‐2 Model data are provided in Appendix B for
reference. Since the HEC‐2 Water Surface Profiles program is no longer used
by FEMA and other agencies involved in the development, review, and
approval of hydraulic analysis, the model was converted to Version 4.1.0 of
Hydraulic Engineering Center ‐ River Analysis System (HEC‐RAS). This

Hydraulic Analysis Summary Report Page 4 of 8 Pigg River Power Dam Removal Franklin County, VA August 27, 2015
involved manually extracting relevant data from the print‐outs and then
entering the data into the HEC‐RAS Model.
c. Duplicate Model ‐ Once the data was entered into HEC‐RAS the “Duplicate
Model” was created. The Duplicate Model is simply a one‐to‐one replication
of the data from the original HEC‐2 model imported into HEC‐RAS. Since
HEC‐2 and HEC‐RAS model bridges in different manners, the HEC‐RAS model
was updated in the area of bridges. This mostly affected the area adjacent
current Virginia Route 713 Bridge (located immediately downstream of the
dam). The area of interest for this analysis was defined as beginning at the
downstream terminus of the HEC‐2 model at cross section 278800 and
extending upstream to cross section 307538, just downstream of the US 220
Bypass Bridge. Model cross sections outside this range were deleted from
the model and the model was truncated. All channel geometry, manning’s n
values, and encroachment stations were also duplicated from the HEC‐2
model. Ineffective flow areas in the vicinity of the Route 713 Bridge were
placed in accordance with standard HEC‐RAS practice at a 1:1 ratio from the
bridge opening. The existing power dam is represented as river cross
sections 292695, 292700, 292715, 292730 and 292745.
d. Existing Conditions Model ‐ Upon completion of the Duplicate Model, the
“Existing Conditions” Model was developed. The Existing Conditions Model
is created by updating the Duplicate Model with more accurate
information at the vicinity of the dam, the Virginia Route 713 Bridge, and
relevant upstream and downstream cross sections. A review of the HEC‐2
model in the area of the Route 713 Bridge indicated it was based on a
previous bridge and highway alignment. The Existing Conditions Model
was updated to include the current Route 713 Bridge. The modeled bridge
and highway geometry used in the Existing Conditions model is based on

Hydraulic Analysis Summary Report Page 5 of 8 Pigg River Power Dam Removal Franklin County, VA August 27, 2015
bridge “as‐built plans” (dated September 5, 1989) provided by VDOT, and
available aerial survey / photography. Ineffective areas associated with the
bridge were placed at a 1:1 ratio from the bridge opening in accordance
with standard HEC‐RAS modeling procedures. Since the bridge as‐built
plans were not prepared on the same vertical datum as the HEC‐2 model
data and neither the HEC‐2 data nor the bridge plans were georeferenced,
the bridge geometry was interpreted in the context of the available aerial
survey topography and photography, and entered as a best‐fit
representation. This should not pose a concern for purposes of
comparison between the Existing Conditions and Proposed Conditions
Models as the bridge opening and geometry will be unchanged between
the two models.
e. Proposed Conditions Model ‐ The Existing Conditions Model was then
modified to create the “Proposed Conditions” Model by incorporating the
proposed removal of the power dam. The cross sections affected in the
vicinity of the power dam included: cross sections 292695, 292700, 292715,
292730 and 292745.
f. Flow Data ‐ The effective 2010 FIS includes peak discharge data for the area
considered by this analysis. The data in the FIS varied slightly from the
values used in the HEC‐2 model analysis (i.e., 12,825 CFS reported in the FIS
versus 12,824 CFS utilized in the HEC‐2 model). For consistency with the
HEC‐2 model, the values from the HEC‐2 model were utilized in the HEC‐
RAS analysis.
5. RESULTS OF ANALYSIS

Hydraulic Analysis Summary Report Page 6 of 8 Pigg River Power Dam Removal Franklin County, VA August 27, 2015
a. General – the main purpose of this section is to present the results of the
analysis, compare the results between the different models (i.e., Duplicate
Condition, Existing Condition, Proposed Condition), and provide narrative on
the results. The primary objective of this section is to demonstrate that the
removal of the dam will not have negative impacts on upstream or
downstream properties by increasing the base flood elevation.
b. Comparing Results to Base Flood Elevations in FIS ‐ As anticipated, when
comparing the original HEC‐2 analysis, with HEC‐RAS analysis, with the
elevations published in the FIS there are notable differences in calculated
water surface elevations (WSEL). These differences are attributable to the
differences in vertical datum between the original HEC‐2 Model and the FIS,
as well as differences in computational methods between HEC‐2 and HEC‐
RAS. When comparing the published WSEL from the published FIS to the
HEC‐RAS Duplicated Model at key cross sections the WSEL vary as shown in
Table 1 below.
Cross Section
Published WSEL (FIS)
Duplicate Model WSEL
Difference
295500 967.2 967.76 0.56
286850 945.8 946.43 0.63
280620 938.1 938.71 0.61
TABLE 1 – Base Flood Water Surface Elevation (WSEL) from FIS vs. Computed
WSEL from Duplicate Model (HEC‐RAS)
c. Existing Conditions Model – The results of the Existing Conditions Model are
compared to the Duplicate Model in Table 2 below. As shown, there are no
changes in the WSEL when comparing the Duplicate Model with the Existing
Conditions Model at key cross section. The Existing Conditions Model will be

Hydraulic Analysis Summary Report Page 7 of 8 Pigg River Power Dam Removal Franklin County, VA August 27, 2015
used as the comparison model against the Proposed Conditions Model. The
results for other intermediate cross sections are provided in Appendix C.
Cross Section
Duplicate Model WSEL
Existing Conditions
WSEL
Difference
295500 967.76 967.76 0.00
286850 946.43 946.43 0.00
280620 938.71 938.71 0.00
TABLE 2 – Computed Base Flood Water Surface Elevation (WSEL) Duplicate
Model vs. Existing Conditions Model
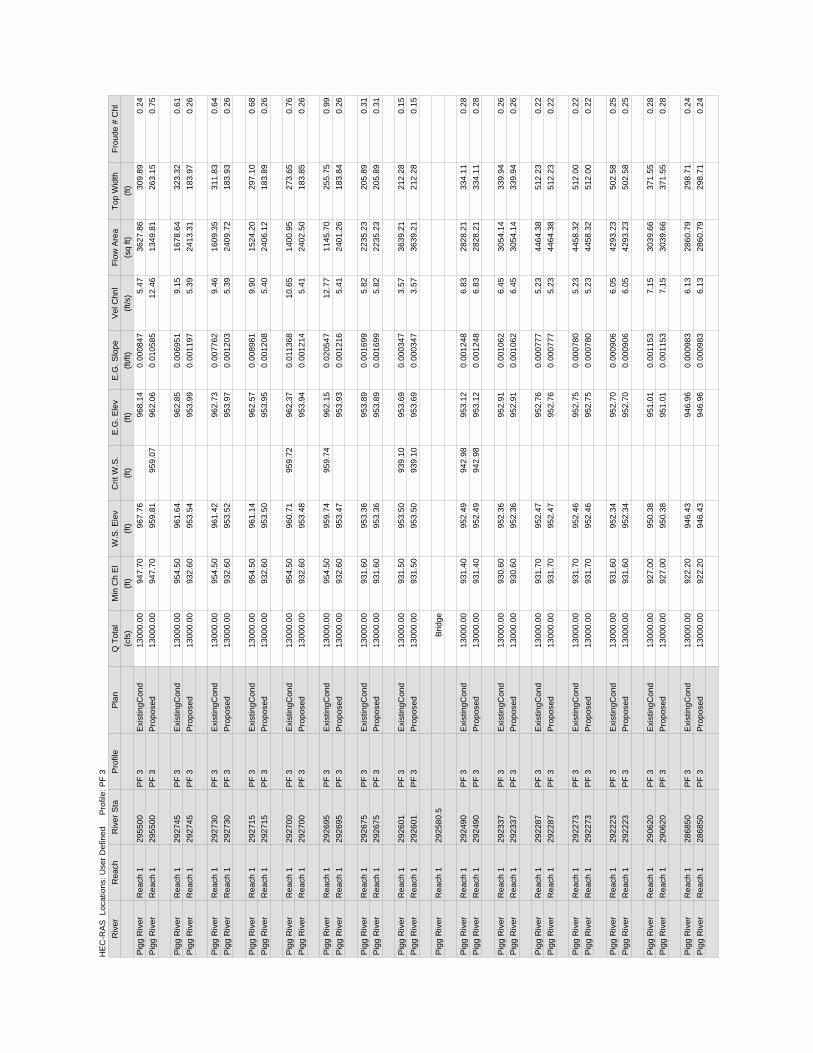
d. Proposed Conditions Model ‐ The results of the Proposed Conditions Model
are compared to the Existing Conditions Model in Table 3 below. As shown,
there are significant reductions in the computed water surface elevation at
cross sections upstream of the removed dam (295500) and no increase in the
computed water surface elevation at key cross sections downstream of the
removed dam (280620 and 286850). The results for other intermediate cross
sections are provided in Appendix C.
Cross Section
Existing Conditions
WSEL
Proposed Conditions
WSEL
Difference
295500 967.76 959.81 ‐7.95
286850 946.43 946.43 0.00
280620 938.71 938.71 0.00
TABLE 3 – Computed Base Flood Water Surface Elevation (WSEL) for Existing
Conditions Model vs. Proposed Conditions Model

Hydraulic Analysis Summary Report Page 8 of 8 Pigg River Power Dam Removal Franklin County, VA August 27, 2015
6. CONCLUSIONS
a. Using standard hydraulic modeling procedures to develop and compare the
results between an Existing Conditions Model and a Proposed Conditions
Model, it was determined that the removal of the Pigg River Dam did not
result in an increase in the computed base flood elevation at the dam, the
existing bridge locate just downstream of the dam, at cross sections located
downstream of the dam and bridge, and at cross sections located
immediately upstream of the dam.
Hydraulic Analysis Summary Report Appendix A Pigg River Power Dam Removal Proposed Dam Removal Franklin County, VA August 27, 2015
Appendix A
Proposed Dam Removal Exhibit

Appendix A – Proposed Dam Removal
Hydraulic Analysis Summary Report Appendix A Pigg River Power Dam Removal Proposed Dam Removal Franklin County, VA August 27, 2015

Hydraulic Analysis Summary Report Appendix B Pigg River Power Dam Removal HEC-2 Data Franklin County, VA August 27, 2015
Appendix B
Relevant HEC-2 Data


Hydraulic Analysis Summary Report Appendix C Pigg River Power Dam Removal HEC-RAS Input and Output Data Franklin County, VA August 27, 2015
Appendix C
HEC-RAS Input and Output Data

Hydraulic Analysis Summary Report Appendix C Pigg River Power Dam Removal HEC-RAS Input and Output Data Franklin County, VA August 27, 2015
Appendix C-1
HEC-RAS Summary Output Table for
Existing & Proposed Conditions Model
HE
C-R
AS
Loc
atio
ns: U
ser D
efin
ed
Pro
file:
PF
3R
iver
Rea
chR
iver
Sta
Pro
file
Pla
nQ
Tot
alM
in C
h E
lW
.S. E
lev
Crit
W.S
.E
.G. E
lev
E.G
. Slo
peV
el C
hnl
Flow
Are
aTo
p W
idth
Frou
de #
Chl
(cfs
)(ft
)(ft
)(ft
)(ft
)(ft
/ft)
(ft/s
)(s
q ft)
(ft)
P
igg
Riv
erR
each
129
5500
P
F 3
Exi
stin
gCon
d13
000.
0094
7.70
967.
7696
8.14
0.00
0847
5.47
3627
.86
309.
890.
24P
igg
Riv
erR
each
129
5500
P
F 3
Pro
pose
d13
000.
0094
7.70
959.
8195
9.07
962.
060.
0105
8512
.46
1349
.81
263.
150.
75
Pig
g R
iver
Rea
ch 1
2927
45
PF
3E
xist
ingC
ond
1300
0.00
954.
5096
1.64
962.
850.
0069
519.
1516
78.6
432
3.32
0.61
Pig
g R
iver
Rea
ch 1
2927
45
PF
3P
ropo
sed
1300
0.00
932.
6095
3.54
953.
990.
0011
975.
3924
13.3
118
3.97
0.26
Pig
g R
iver
Rea
ch 1
2927
30
PF
3E
xist
ingC
ond
1300
0.00
954.
5096
1.42
962.
730.
0077
629.
4616
09.3
531
1.83
0.64
Pig
g R
iver
Rea
ch 1
2927
30
PF
3P
ropo
sed
1300
0.00
932.
6095
3.52
953.
970.
0012
035.
3924
09.7
218
3.93
0.26
Pig
g R
iver
Rea
ch 1
2927
15
PF
3E
xist
ingC
ond
1300
0.00
954.
5096
1.14
962.
570.
0089
819.
9015
24.2
029
7.10
0.68
Pig
g R
iver
Rea
ch 1
2927
15
PF
3P
ropo
sed
1300
0.00
932.
6095
3.50
953.
950.
0012
085.
4024
06.1
218
3.89
0.26
Pig
g R
iver
Rea
ch 1
2927
00
PF
3E
xist
ingC
ond
1300
0.00
954.
5096
0.71
959.
7296
2.37
0.01
1368
10.6
514
00.9
527
3.65
0.76
Pig
g R
iver
Rea
ch 1
2927
00
PF
3P
ropo
sed
1300
0.00
932.
6095
3.48
953.
940.
0012
145.
4124
02.5
018
3.85
0.26
Pig
g R
iver
Rea
ch 1
2926
95
PF
3E
xist
ingC
ond
1300
0.00
954.
5095
9.74
959.
7496
2.15
0.02
0547
12.7
711
45.7
025
5.75
0.99
Pig
g R
iver
Rea
ch 1
2926
95
PF
3P
ropo
sed
1300
0.00
932.
6095
3.47
953.
930.
0012
165.
4124
01.2
618
3.84
0.26
Pig
g R
iver
Rea
ch 1
2926
75
PF
3E
xist
ingC
ond
1300
0.00
931.
6095
3.36
953.
890.
0016
995.
8222
35.2
320
5.89
0.31
Pig
g R
iver
Rea
ch 1
2926
75
PF
3P
ropo
sed
1300
0.00
931.
6095
3.36
953.
890.
0016
995.
8222
35.2
320
5.89
0.31
Pig
g R
iver
Rea
ch 1
2926
01
PF
3E
xist
ingC
ond
1300
0.00
931.
5095
3.50
939.
1095
3.69
0.00
0347
3.57
3639
.21
212.
280.
15P
igg
Riv
erR
each
129
2601
P
F 3
Pro
pose
d13
000.
0093
1.50
953.
5093
9.10
953.
690.
0003
473.
5736
39.2
121
2.28
0.15
Pig
g R
iver
Rea
ch 1
2925
80.5
Brid
ge
Pig
g R
iver
Rea
ch 1
2924
90
PF
3E
xist
ingC
ond
1300
0.00
931.
4095
2.49
942.
9895
3.12
0.00
1248
6.83
2828
.21
334.
110.
28P
igg
Riv
erR
each
129
2490
P
F 3
Pro
pose
d13
000.
0093
1.40
952.
4994
2.98
953.
120.
0012
486.
8328
28.2
133
4.11
0.28
Pig
g R
iver
Rea
ch 1
2923
37
PF
3E
xist
ingC
ond
1300
0.00
930.
6095
2.36
952.
910.
0010
626.
4530
54.1
433
9.94
0.26
Pig
g R
iver
Rea
ch 1
2923
37
PF
3P
ropo
sed
1300
0.00
930.
6095
2.36
952.
910.
0010
626.
4530
54.1
433
9.94
0.26
Pig
g R
iver
Rea
ch 1
2922
87
PF
3E
xist
ingC
ond
1300
0.00
931.
7095
2.47
952.
760.
0007
775.
2344
64.3
851
2.23
0.22
Pig
g R
iver
Rea
ch 1
2922
87
PF
3P
ropo
sed
1300
0.00
931.
7095
2.47
952.
760.
0007
775.
2344
64.3
851
2.23
0.22
Pig
g R
iver
Rea
ch 1
2922
73
PF
3E
xist
ingC
ond
1300
0.00
931.
7095
2.46
952.
750.
0007
805.
2344
58.3
251
2.00
0.22
Pig
g R
iver
Rea
ch 1
2922
73
PF
3P
ropo
sed
1300
0.00
931.
7095
2.46
952.
750.
0007
805.
2344
58.3
251
2.00
0.22
Pig
g R
iver
Rea
ch 1
2922
23
PF
3E
xist
ingC
ond
1300
0.00
931.
6095
2.34
952.
700.
0009
066.
0542
93.2
350
2.58
0.25
Pig
g R
iver
Rea
ch 1
2922
23
PF
3P
ropo
sed
1300
0.00
931.
6095
2.34
952.
700.
0009
066.
0542
93.2
350
2.58
0.25
Pig
g R
iver
Rea
ch 1
2906
20
PF
3E
xist
ingC
ond
1300
0.00
927.
0095
0.38
951.
010.
0011
537.
1530
39.6
637
1.55
0.28
Pig
g R
iver
Rea
ch 1
2906
20
PF
3P
ropo
sed
1300
0.00
927.
0095
0.38
951.
010.
0011
537.
1530
39.6
637
1.55
0.28
Pig
g R
iver
Rea
ch 1
2868
50
PF
3E
xist
ingC
ond
1300
0.00
922.
2094
6.43
946.
960.
0009
836.
1328
60.7
929
8.71
0.24
Pig
g R
iver
Rea
ch 1
2868
50
PF
3P
ropo
sed
1300
0.00
922.
2094
6.43
946.
960.
0009
836.
1328
60.7
929
8.71
0.24

HE
C-R
AS
Loc
atio
ns: U
ser D
efin
ed
Pro
file:
PF
3 (C
ontin
ued)
Riv
erR
each
Riv
er S
taP
rofil
eP
lan
Q T
otal
Min
Ch
El
W.S
. Ele
vC
rit W
.S.
E.G
. Ele
vE
.G. S
lope
Vel
Chn
lFl
ow A
rea
Top
Wid
thFr
oude
# C
hl(c
fs)
(ft)
(ft)
(ft)
(ft)
(ft/ft
)(ft
/s)
(sq
ft)(ft
)
Pig
g R
iver
Rea
ch 1
2828
90
PF
3E
xist
ingC
ond
1300
0.00
916.
6094
1.42
942.
270.
0014
147.
9123
13.9
019
9.52
0.30
Pig
g R
iver
Rea
ch 1
2828
90
PF
3P
ropo
sed
1300
0.00
916.
6094
1.42
942.
270.
0014
147.
9123
13.9
019
9.52
0.30
Pig
g R
iver
Rea
ch 1
2802
60
PF
3E
xist
ingC
ond
1300
0.00
913.
4093
8.71
939.
230.
0008
886.
3029
29.9
824
1.24
0.24
Pig
g R
iver
Rea
ch 1
2802
60
PF
3P
ropo
sed
1300
0.00
913.
4093
8.71
939.
230.
0008
886.
3029
29.9
824
1.24
0.24
Pig
g R
iver
Rea
ch 1
2788
30
PF
3E
xist
ingC
ond
1300
0.00
911.
6093
7.53
938.
010.
0008
016.
1036
37.5
146
5.90
0.23
Pig
g R
iver
Rea
ch 1
2788
30
PF
3P
ropo
sed
1300
0.00
911.
6093
7.53
938.
010.
0008
016.
1036
37.5
146
5.90
0.23
Pig
g R
iver
Rea
ch 1
2788
17
PF
3E
xist
ingC
ond
1300
0.00
911.
6093
7.52
938.
000.
0008
036.
1036
32.1
446
5.42
0.23
Pig
g R
iver
Rea
ch 1
2788
17
PF
3P
ropo
sed
1300
0.00
911.
6093
7.52
938.
000.
0008
036.
1036
32.1
446
5.42
0.23
Pig
g R
iver
Rea
ch 1
2788
07
PF
3E
xist
ingC
ond
1300
0.00
911.
6093
7.51
938.
000.
0008
046.
1136
27.9
946
5.04
0.23
Pig
g R
iver
Rea
ch 1
2788
07
PF
3P
ropo
sed
1300
0.00
911.
6093
7.51
938.
000.
0008
046.
1136
27.9
946
5.04
0.23
Pig
g R
iver
Rea
ch 1
2788
02
PF
3E
xist
ingC
ond
1300
0.00
911.
6093
7.50
937.
990.
0008
056.
1136
25.9
246
4.86
0.23
Pig
g R
iver
Rea
ch 1
2788
02
PF
3P
ropo
sed
1300
0.00
911.
6093
7.50
937.
990.
0008
056.
1136
25.9
246
4.86
0.23
Pig
g R
iver
Rea
ch 1
2788
01
PF
3E
xist
ingC
ond
1300
0.00
911.
6093
7.50
937.
990.
0008
056.
1136
25.5
246
4.82
0.23
Pig
g R
iver
Rea
ch 1
2788
01
PF
3P
ropo
sed
1300
0.00
911.
6093
7.50
937.
990.
0008
056.
1136
25.5
246
4.82
0.23
Pig
g R
iver
Rea
ch 1
2788
00
PF
3E
xist
ingC
ond
1300
0.00
911.
6093
7.50
924.
5793
7.99
0.00
0805
6.11
3625
.13
464.
780.
23P
igg
Riv
erR
each
127
8800
P
F 3
Pro
pose
d13
000.
0091
1.60
937.
5092
4.57
937.
990.
0008
056.
1136
25.1
346
4.78
0.23

Hydraulic Analysis Summary Report Appendix C Pigg River Power Dam Removal HEC-RAS Input and Output Data Franklin County, VA August 27, 2015
Appendix C-2
HEC-RAS Profile Output for
Existing & Proposed Conditions Model

050
0010
000
1500
020
000
2500
030
000
910
920
930
940
950
960
970
980
Pig
g R
iver
Pla
n:
1) E
xist
ingC
ond
8/
30/2
015
2
) Pro
pose
d
8/30
/201
5
Mai
n C
hann
el D
ista
nce
(ft)
Elevation (ft)
Lege
nd
WS
PF
3 - E
xist
ingC
ond
WS
PF
3 - P
ropo
sed
Gro
und
Pig
g R
iver
Rea
ch 1

Hydraulic Analysis Summary Report Appendix C Pigg River Power Dam Removal HEC-RAS Input and Output Data Franklin County, VA August 27, 2015
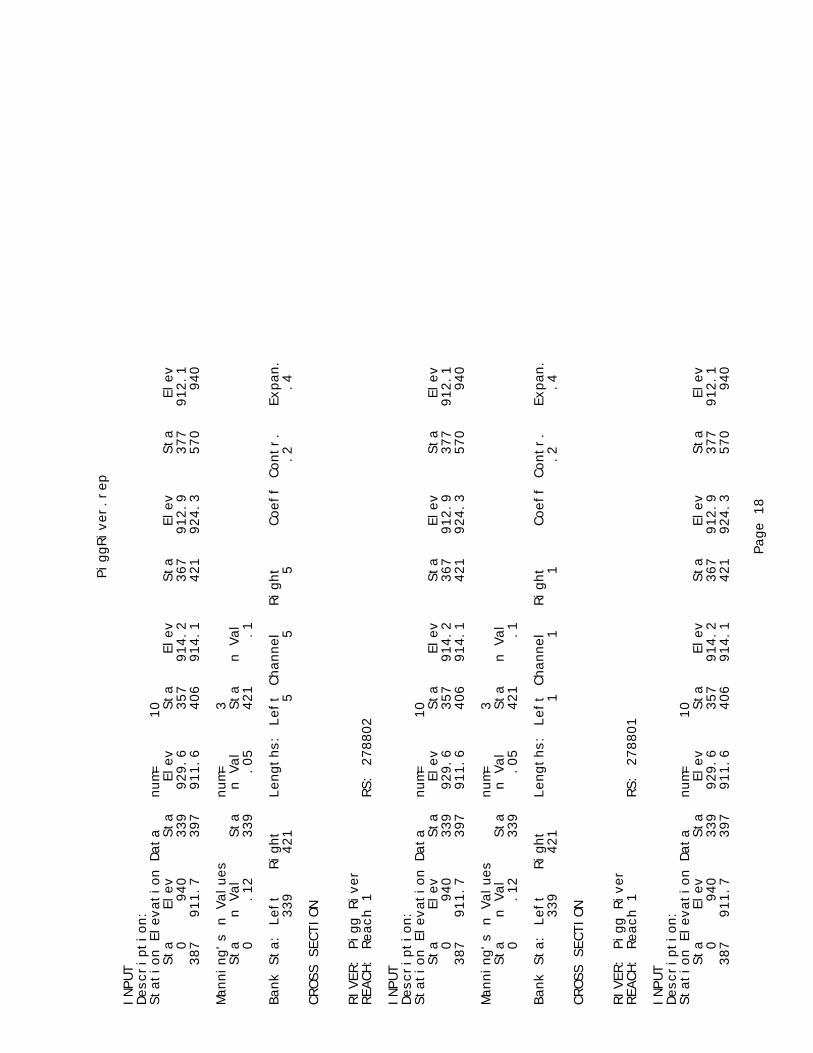
Appendix C-3
HEC-RAS Input Data
For
Existing & Proposed Conditions Model

PiggRiver.rep
HEC-RAS Version 4.1.0 Jan 2010
U.S. Army Corps of Engineers
Hydrologic Engineering Center
609 Second Street
Davis, California
X X XXXXXX XXXX XXXX XX XXXX
X X X X X X X X X X
X X X X X X X X X
XXXXXXX XXXX X XXX XXXX XXXXXX XXXX
X X X X X X X X X
X X X X X X X X X X
X X XXXXXX XXXX X X X X XXXXX
PROJECT DATA
Project Title: Pigg River
Project File : PiggRiver.prj
Run Date and Time: 8/30/2015 7:18:41 PM
Project in English units
Project Description:
PLAN DATA
Plan Title: Existing Conditions
Plan File : C:\Users\wta\Desktop\3505\HEC-RAS Model\Pigg River\PiggRiver.p02
Geometry Title: Existing Conditions
Geometry File : C:\Users\wta\Desktop\3505\HEC-RAS Model\Pigg River\PiggRiver.g02
Flow Title : Pigg Rvr HEC-2 Flows
Flow File : C:\Users\wta\Desktop\3505\HEC-RAS Model\Pigg River\PiggRiver.f01
Plan Summary Information:
Number of: Cross Sections = 26 Multiple Openings = 0
Culverts = 0 Inline Structures = 0
Bridges = 1 Lateral Structures = 0
Page 1

PiggRiver.rep
Computational Information
Water surface calculation tolerance = 0.01
Critical depth calculation tolerance = 0.01
Maximum number of iterations = 20
Maximum difference tolerance = 0.3
Flow tolerance factor = 0.001
Computation Options
Critical depth computed only where necessary
Conveyance Calculation Method: At breaks in n values only
Friction Slope Method: Average Conveyance
Computational Flow Regime: Subcritical Flow
Encroachment Data
Equal Conveyance = True
Left Offset = 0
Right Offset = 0
River = Pigg River Reach = Reach 1
RS Profile Method Value1 Value2
307538 PF 2 0
304870 PF 2 0
300110 PF 2 0
295500 PF 2 0
292745 PF 2 0
292730 PF 2 0
292715 PF 2 0
292700 PF 2 0
292695 PF 2 0
292675 PF 2 0
292490 PF 2 0
292337 PF 2 0
292287 PF 2 0
292273 PF 2 0
292223 PF 2 0
290620 PF 2 0
286850 PF 2 0
282890 PF 2 0
280260 PF 2 0
278830 PF 2 0
278817 PF 2 0
278807 PF 2 0
278802 PF 2 0
278801 PF 2 0
River = Pigg River Reach = Reach 1
RS Profile Method Value1 Value2
307538 PF 3 0
Page 2

PiggRiver.rep
304870 PF 3 0
300110 PF 3 0
295500 PF 3 0
292745 PF 3 0
292730 PF 3 0
292715 PF 3 0
292700 PF 3 0
292695 PF 3 0
292675 PF 3 0
292490 PF 3 0
292337 PF 3 0
292287 PF 3 0
292273 PF 3 0
292223 PF 3 0
290620 PF 3 0
286850 PF 3 0
282890 PF 3 0
280260 PF 3 0
278830 PF 3 0
278817 PF 3 0
278807 PF 3 0
278802 PF 3 0
278801 PF 3 0
River = Pigg River Reach = Reach 1
RS Profile Method Value1 Value2
307538 PF 4 0 0 0
304870 PF 4 0 0 0
300110 PF 4 0 0 0
295500 PF 4 0 0 0
292745 PF 4 0 0 0
292730 PF 4 0 0 0
292715 PF 4 0 0 0
292700 PF 4 0 0 0
292695 PF 4 0 0 0
292675 PF 4 0 0 0
292490 PF 4 0 0 0
292337 PF 4 0 0 0
292287 PF 4 0 0 0
292273 PF 4 0 0 0
292223 PF 4 0 0 0
290620 PF 4 0 0 0
286850 PF 4 0 0 0
282890 PF 4 0 0 0
280260 PF 4 0 0 0
278830 PF 4 0 0 0
278817 PF 4 0 0 0
278807 PF 4 0 0 0
Page 3

PiggRiver.rep
278802 PF 4 0 0 0
278801 PF 4 0 0 0
River = Pigg River Reach = Reach 1
RS Profile Method Value1 Value2
307538 PF 5 1 1168 1368
304870 PF 5 1 1025 1230
300110 PF 5 1 56 241
295500 PF 5 1 13 238
292745 PF 5 1 225 485
292730 PF 5 1 225 485
292715 PF 5 1 225 485
292700 PF 5 1 228 484
292695 PF 5 1 228 484
292675 PF 5 1 230 480
292490 PF 5 1 67 285
292337 PF 5 1 72 277
292287 PF 5 1 101 301
292273 PF 5 1 101 301
292223 PF 5 1 100 308
290620 PF 5 1 1082 1272
286850 PF 5 1 1034 1196
282890 PF 5 1 50 216
280260 PF 5 1 990 1140
278830 PF 5 1 313 464
278817 PF 5 1 313 464
278807 PF 5 1 313 464
278802 PF 5 1 313 464
278801 PF 5 1 313 464
FLOW DATA
Flow Title: Pigg Rvr HEC-2 Flows
Flow File : C:\Users\wta\Desktop\3505\HEC-RAS Model\Pigg River\PiggRiver.f01
Flow Data (cfs)
River Reach RS PF 1 PF 2 PF 3 PF 4
PF 5
Pigg River Reach 1 307538 5375 10174 12824 19848
12824
Pigg River Reach 1 295500 5450 10400 13000 20100
13000
Page 4

PiggRiver.rep
Boundary Conditions
River Reach Profile Upstream Downstream
Pigg River Reach 1 PF 1 Known WS = 928.32
Pigg River Reach 1 PF 2 Known WS = 935.93
Pigg River Reach 1 PF 3 Known WS = 937.5
Pigg River Reach 1 PF 4 Known WS = 940.39
GEOMETRY DATA
Geometry Title: Existing Conditions
Geometry File : C:\Users\wta\Desktop\3505\HEC-RAS Model\Pigg River\PiggRiver.g02
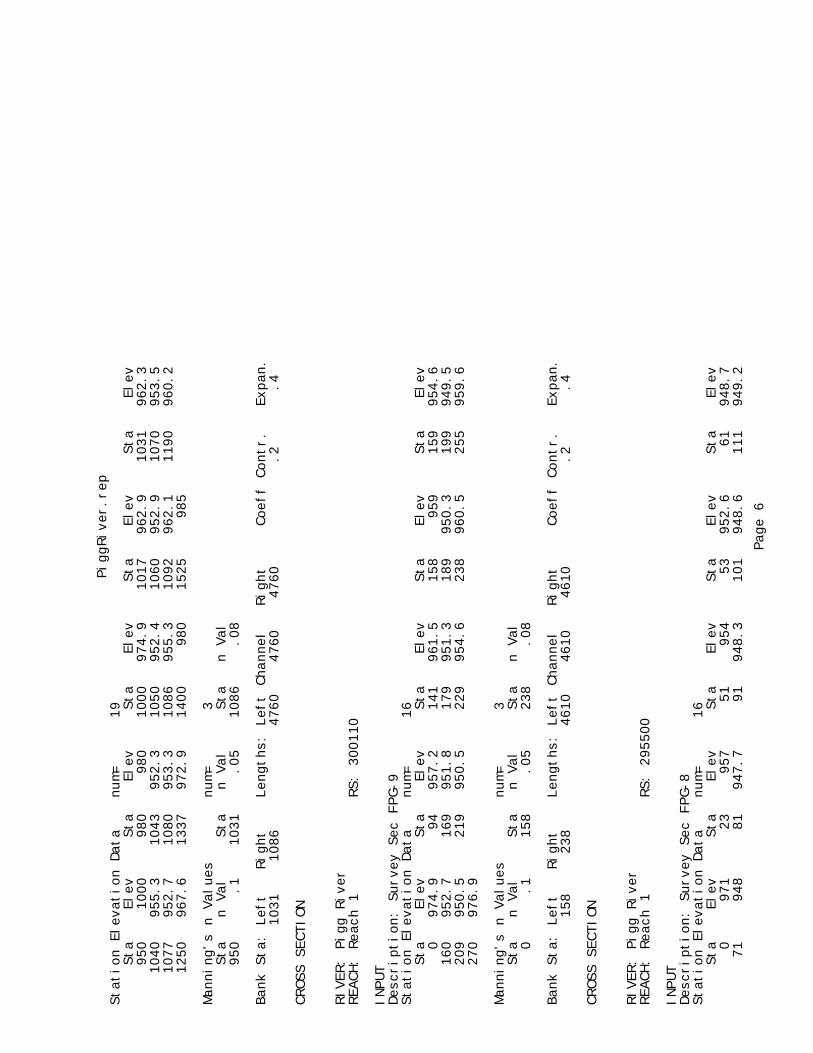
CROSS SECTION
RIVER: Pigg River
REACH: Reach 1 RS: 307538
INPUT
Description:
Station Elevation Data num= 15
Sta Elev Sta Elev Sta Elev Sta Elev Sta Elev
1050 1000 1100 980 1145 967.4 1188 964.8 1193 955.8
1203 955.1 1213 955.5 1223 954.7 1231 953.8 1233 955.5
1234 955.7 1243 964.8 1378 964.6 1434 978.9 1520 998.5
Manning's n Values num= 3
Sta n Val Sta n Val Sta n Val
1050 .1 1188 .05 1243 .08
Bank Sta: Left Right Lengths: Left Channel Right Coeff Contr. Expan.
1188 1243 2668 2668 2668 .2 .4
CROSS SECTION
RIVER: Pigg River
REACH: Reach 1 RS: 304870
INPUT
Description: Survey Sec FPG-10
Page 5

PiggRiver.rep
Station Elevation Data num= 19
Sta Elev Sta Elev Sta Elev Sta Elev Sta Elev
950 1000 980 980 1000 974.9 1017 962.9 1031 962.3
1040 955.3 1043 952.3 1050 952.4 1060 952.9 1070 953.5
1077 952.7 1080 953.3 1086 955.3 1092 962.1 1190 960.2
1250 967.6 1337 972.9 1400 980 1525 985
Manning's n Values num= 3
Sta n Val Sta n Val Sta n Val
950 .1 1031 .05 1086 .08
Bank Sta: Left Right Lengths: Left Channel Right Coeff Contr. Expan.
1031 1086 4760 4760 4760 .2 .4
CROSS SECTION
RIVER: Pigg River
REACH: Reach 1 RS: 300110
INPUT
Description: Survey Sec FPG-9
Station Elevation Data num= 16
Sta Elev Sta Elev Sta Elev Sta Elev Sta Elev
0 974.9 94 957.2 141 961.5 158 959 159 954.6
160 952.7 169 951.8 179 951.3 189 950.3 199 949.5
209 950.5 219 950.5 229 954.6 238 960.5 255 959.6
270 976.9
Manning's n Values num= 3
Sta n Val Sta n Val Sta n Val
0 .1 158 .05 238 .08
Bank Sta: Left Right Lengths: Left Channel Right Coeff Contr. Expan.
158 238 4610 4610 4610 .2 .4
CROSS SECTION
RIVER: Pigg River
REACH: Reach 1 RS: 295500
INPUT
Description: Survey Sec FPG-8
Station Elevation Data num= 16
Sta Elev Sta Elev Sta Elev Sta Elev Sta Elev
0 971 23 957 51 954 53 952.6 61 948.7
71 948 81 947.7 91 948.3 101 948.6 111 949.2
Page 6

PiggRiver.rep
121 952.1 135 954.6 137 958 195 956.4 273 957.8
334 972.2
Manning's n Values num= 3
Sta n Val Sta n Val Sta n Val
0 .1 23 .05 137 .12
Bank Sta: Left Right Lengths: Left Channel Right Coeff Contr. Expan.
23 137 3200 2744 2680 .2 .4
CROSS SECTION
RIVER: Pigg River
REACH: Reach 1 RS: 292745
INPUT
Description:
Station Elevation Data num= 12
Sta Elev Sta Elev Sta Elev Sta Elev Sta Elev
0 976.1 27 960.6 31 961.8 58 963.1 106 960.6
196 965.4 218 960.9 273 954.6 459 954.5 544 972.4
588 973.1 596 977.2
Manning's n Values num= 3
Sta n Val Sta n Val Sta n Val
0 .1 273 .05 459 .12
Bank Sta: Left Right Lengths: Left Channel Right Coeff Contr. Expan.
273 459 15 15 15 .2 .4
CROSS SECTION
RIVER: Pigg River
REACH: Reach 1 RS: 292730
INPUT
Description:
Station Elevation Data num= 12
Sta Elev Sta Elev Sta Elev Sta Elev Sta Elev
0 976.1 27 960.6 31 961.8 58 963.1 106 960.6
196 965.4 218 960.9 273 954.6 459 954.5 544 972.4
588 973.1 596 977.2
Manning's n Values num= 3
Sta n Val Sta n Val Sta n Val
0 .1 273 .05 459 .12
Page 7

PiggRiver.rep
Bank Sta: Left Right Lengths: Left Channel Right Coeff Contr. Expan.
273 459 15 15 15 .2 .4
CROSS SECTION
RIVER: Pigg River
REACH: Reach 1 RS: 292715
INPUT
Description:
Station Elevation Data num= 12
Sta Elev Sta Elev Sta Elev Sta Elev Sta Elev
0 976.1 27 960.6 31 961.8 58 963.1 106 960.6
196 965.4 218 960.9 273 954.6 459 954.5 544 972.4
588 973.1 596 977.2
Manning's n Values num= 3
Sta n Val Sta n Val Sta n Val
0 .1 273 .05 459 .12
Bank Sta: Left Right Lengths: Left Channel Right Coeff Contr. Expan.
273 459 15 15 15 .2 .4
CROSS SECTION
RIVER: Pigg River
REACH: Reach 1 RS: 292700
INPUT
Description:
Station Elevation Data num= 12
Sta Elev Sta Elev Sta Elev Sta Elev Sta Elev
0 976.1 27 960.6 31 961.8 58 963.1 106 960.6
196 965.4 218 960.9 273 954.6 459 954.5 544 972.4
588 973.1 596 977.2
Manning's n Values num= 3
Sta n Val Sta n Val Sta n Val
0 .1 273 .05 459 .12
Bank Sta: Left Right Lengths: Left Channel Right Coeff Contr. Expan.
273 459 5 5 5 .2 .4
CROSS SECTION
Page 8

PiggRiver.rep
RIVER: Pigg River
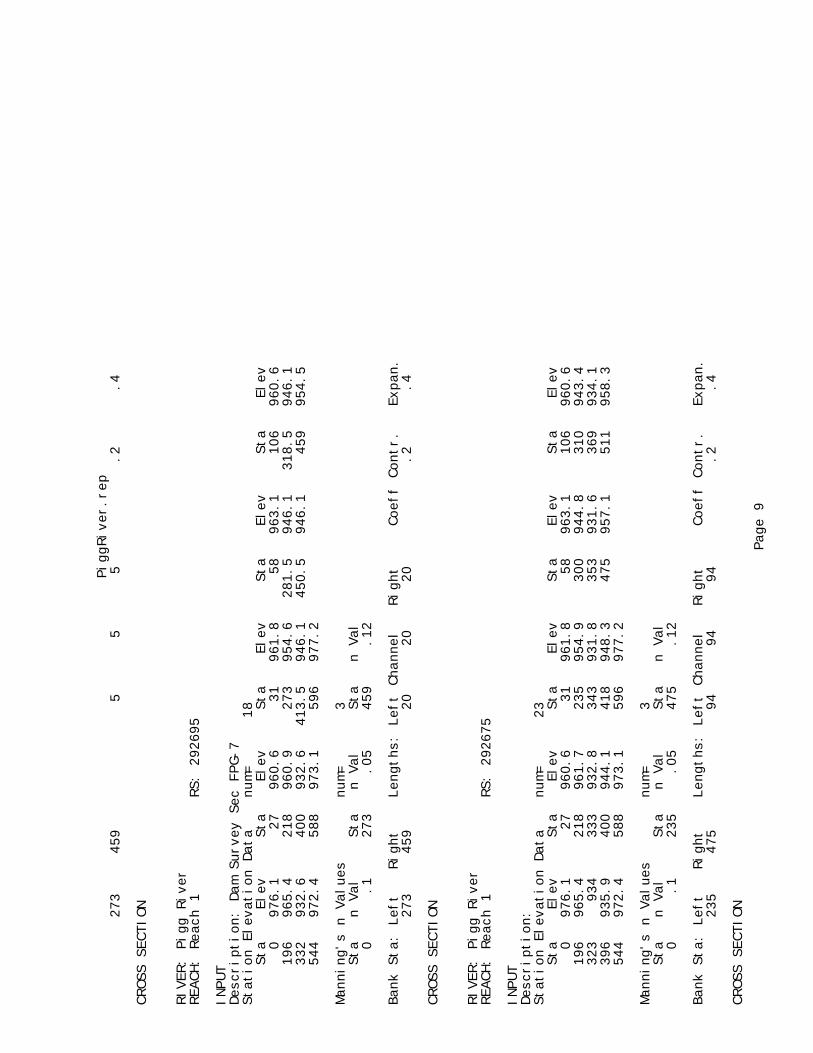
REACH: Reach 1 RS: 292695
INPUT
Description: Dam Survey Sec FPG-7
Station Elevation Data num= 12
Sta Elev Sta Elev Sta Elev Sta Elev Sta Elev
0 976.1 27 960.6 31 961.8 58 963.1 106 960.6
196 965.4 218 960.9 273 954.6 459 954.5 544 972.4
588 973.1 596 977.2
Manning's n Values num= 3
Sta n Val Sta n Val Sta n Val
0 .1 273 .05 459 .12
Bank Sta: Left Right Lengths: Left Channel Right Coeff Contr. Expan.
273 459 20 20 20 .2 .4
CROSS SECTION
RIVER: Pigg River
REACH: Reach 1 RS: 292675
INPUT
Description:
Station Elevation Data num= 23
Sta Elev Sta Elev Sta Elev Sta Elev Sta Elev
0 976.1 27 960.6 31 961.8 58 963.1 106 960.6
196 965.4 218 961.7 235 954.9 300 944.8 310 943.4
323 934 333 932.8 343 931.8 353 931.6 369 934.1
396 935.9 400 944.1 418 948.3 475 957.1 511 958.3
544 972.4 588 973.1 596 977.2
Manning's n Values num= 3
Sta n Val Sta n Val Sta n Val
0 .1 235 .05 475 .12
Bank Sta: Left Right Lengths: Left Channel Right Coeff Contr. Expan.
235 475 94 94 94 .2 .4
CROSS SECTION
RIVER: Pigg River
REACH: Reach 1 RS: 292601
Page 9

PiggRiver.rep
INPUT
Description:
Station Elevation Data num= 17
Sta Elev Sta Elev Sta Elev Sta Elev Sta Elev
0 959 60 957 75 948 100 936 125 932
150 931.5 175 932 200 932 225 934 250 936
275 952 300 964 312 970 325 971 350 972
375 973 400 980
Manning's n Values num= 3
Sta n Val Sta n Val Sta n Val
0 .1 60 .05 300 .12
Bank Sta: Left Right Lengths: Left Channel Right Coeff Contr. Expan.
60 300 41.83 41.83 41.83 .2 .4
Ineffective Flow num= 2
Sta L Sta R Elev Permanent
0 55.5 957.12 F
316.5 400 970 F
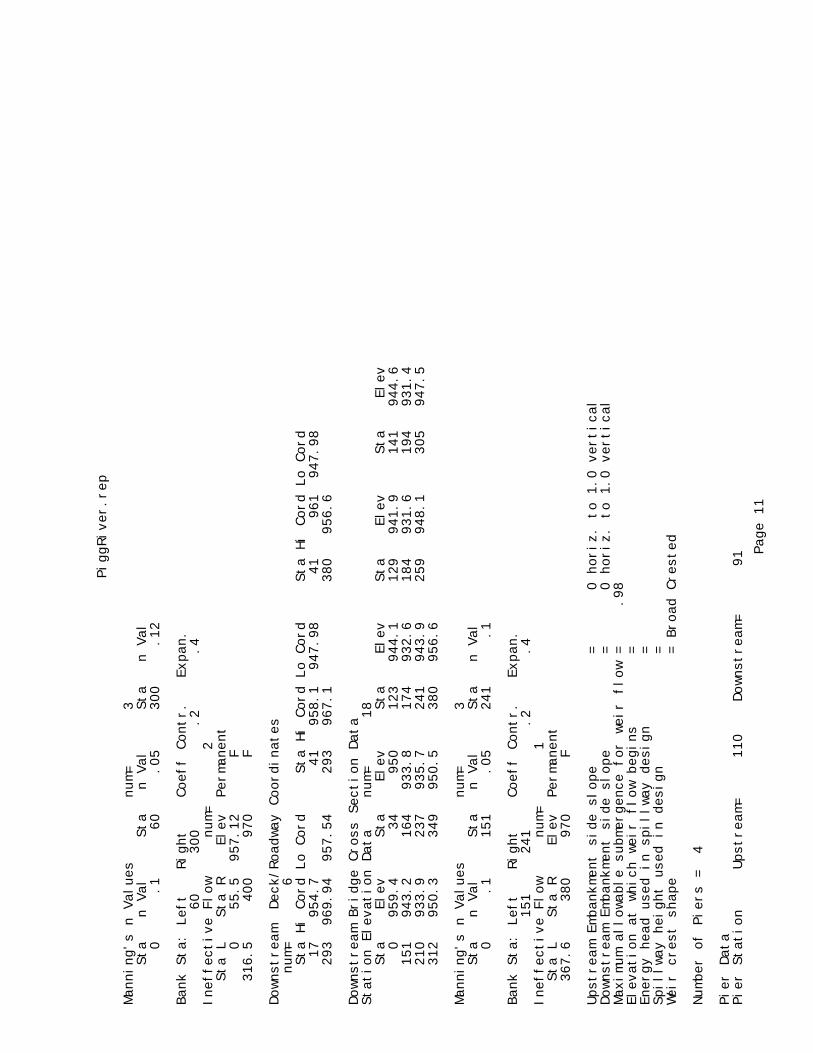
BRIDGE
RIVER: Pigg River
REACH: Reach 1 RS: 292580.5
INPUT
Description:
Distance from Upstream XS = 5
Deck/Roadway Width = 31.83
Weir Coefficient = 2.6
Upstream Deck/Roadway Coordinates
num= 2
Sta Hi Cord Lo Cord Sta Hi Cord Lo Cord
60 961 947.98 312 969.94 957.54
Upstream Bridge Cross Section Data
Station Elevation Data num= 17
Sta Elev Sta Elev Sta Elev Sta Elev Sta Elev
0 959 60 957 75 948 100 936 125 932
150 931.5 175 932 200 932 225 934 250 936
275 952 300 964 312 970 325 971 350 972
375 973 400 980
Manning's n Values num= 3
Sta n Val Sta n Val Sta n Val
0 .1 60 .05 300 .12
Page 10

PiggRiver.rep
Bank Sta: Left Right Coeff Contr. Expan.
60 300 .2 .4
Ineffective Flow num= 2
Sta L Sta R Elev Permanent
0 55.5 957.12 F
316.5 400 970 F
Downstream Deck/Roadway Coordinates
num= 6
Sta Hi Cord Lo Cord Sta Hi Cord Lo Cord Sta Hi Cord Lo Cord
17 954.7 41 958.1 947.98 41 961 947.98
293 969.94 957.54 293 967.1 380 956.6
Downstream Bridge Cross Section Data
Station Elevation Data num= 18
Sta Elev Sta Elev Sta Elev Sta Elev Sta Elev
0 959.4 34 950 123 944.1 129 941.9 141 944.6
151 943.2 164 933.8 174 932.6 184 931.6 194 931.4
210 933.9 237 935.7 241 943.9 259 948.1 305 947.5
312 950.3 349 950.5 380 956.6
Manning's n Values num= 3
Sta n Val Sta n Val Sta n Val
0 .1 151 .05 241 .1
Bank Sta: Left Right Coeff Contr. Expan.
151 241 .2 .4
Ineffective Flow num= 1
Sta L Sta R Elev Permanent
367.6 380 970 F
Upstream Embankment side slope = 0 horiz. to 1.0 vertical
Downstream Embankment side slope = 0 horiz. to 1.0 vertical
Maximum allowable submergence for weir flow = .98
Elevation at which weir flow begins =
Energy head used in spillway design =
Spillway height used in design =
Weir crest shape = Broad Crested
Number of Piers = 4
Pier Data
Pier Station Upstream= 110 Downstream= 91
Upstream num= 2
Width Elev Width Elev
12 940 12 955
Downstream num= 2
Width Elev Width Elev
Page 11

PiggRiver.rep
12 940 12 955
Pier Data
Pier Station Upstream= 160 Downstream= 141
Upstream num= 2
Width Elev Width Elev
12 940 12 955
Downstream num= 2
Width Elev Width Elev
12 940 12 955
Pier Data
Pier Station Upstream= 210 Downstream= 191
Upstream num= 2
Width Elev Width Elev
12 940 12 955
Downstream num= 2
Width Elev Width Elev
12 940 12 955
Pier Data
Pier Station Upstream= 260 Downstream= 241
Upstream num= 2
Width Elev Width Elev
12 940 12 960
Downstream num= 2
Width Elev Width Elev
12 940 12 960
Number of Bridge Coefficient Sets = 1
Low Flow Methods and Data
Energy
Selected Low Flow Methods = Highest Energy Answer
High Flow Method
Energy Only
Additional Bridge Parameters
Add Friction component to Momentum
Do not add Weight component to Momentum
Class B flow critical depth computations use critical depth
inside the bridge at the upstream end
Criteria to check for pressure flow = Upstream energy grade line
CROSS SECTION
Page 12

PiggRiver.rep
RIVER: Pigg River
REACH: Reach 1 RS: 292490
INPUT
Description: Survey Sec FPG-6
Station Elevation Data num= 18
Sta Elev Sta Elev Sta Elev Sta Elev Sta Elev
0 959.4 34 950 123 944.1 129 941.9 141 944.6
151 943.2 164 933.8 174 932.6 184 931.6 194 931.4
210 933.9 237 935.7 241 943.9 259 948.1 305 947.5
312 950.3 349 950.5 380 956.6
Manning's n Values num= 3
Sta n Val Sta n Val Sta n Val
0 .1 151 .05 241 .1
Bank Sta: Left Right Lengths: Left Channel Right Coeff Contr. Expan.
151 241 153 153 153 .2 .4
Ineffective Flow num= 1
Sta L Sta R Elev Permanent
367.6 380 970 F
CROSS SECTION
RIVER: Pigg River
REACH: Reach 1 RS: 292337
INPUT
Description:
Station Elevation Data num= 18
Sta Elev Sta Elev Sta Elev Sta Elev Sta Elev
0 958.6 34 949.2 123 943.3 129 941.1 141 943.8
151 942.4 164 933 174 931.8 184 930.8 194 930.6
210 933.1 237 934.9 241 943.1 259 947.3 305 946.7
312 949.5 349 949.7 380 955.8
Manning's n Values num= 3
Sta n Val Sta n Val Sta n Val
0 .1 151 .05 241 .1
Bank Sta: Left Right Lengths: Left Channel Right Coeff Contr. Expan.
151 241 50 50 50 .2 .4
CROSS SECTION
RIVER: Pigg River
Page 13

PiggRiver.rep
REACH: Reach 1 RS: 292287
INPUT
Description: Copied XS 292273
Station Elevation Data num= 16
Sta Elev Sta Elev Sta Elev Sta Elev Sta Elev
0 960 20 955.6 26 951.9 28 953.4 34 953.2
75 945.2 101.2 942.8 121.2 941.3 136.2 931.7 181.2 931.7
186.2 938.3 198.8 939 220 940 408 947.2 508 948.8
597 956.9
Manning's n Values num= 3
Sta n Val Sta n Val Sta n Val
0 .07 101.2 .05 198.8 .1
Bank Sta: Left Right Lengths: Left Channel Right Coeff Contr. Expan.
101.2 198.8 14 14 14 .2 .4
CROSS SECTION
RIVER: Pigg River
REACH: Reach 1 RS: 292273
INPUT
Description: VA 713 Survey Sec FPG-5
Station Elevation Data num= 16
Sta Elev Sta Elev Sta Elev Sta Elev Sta Elev
0 960 20 955.6 26 951.9 28 953.4 34 953.2
75 945.2 101.2 942.8 121.2 941.3 136.2 931.7 181.2 931.7
186.2 938.3 198.8 939 220 940 408 947.2 508 948.8
597 956.9
Manning's n Values num= 3
Sta n Val Sta n Val Sta n Val
0 .07 101.2 .05 198.8 .1
Bank Sta: Left Right Lengths: Left Channel Right Coeff Contr. Expan.
101.2 198.8 50 50 50 .2 .4
CROSS SECTION
RIVER: Pigg River
REACH: Reach 1 RS: 292223
INPUT
Description: Topo Sec FPG-4A
Page 14

PiggRiver.rep
Station Elevation Data num= 13
Sta Elev Sta Elev Sta Elev Sta Elev Sta Elev
0 960 100 940 116 938.4 121 934.1 131 932.1
141 931.6 151 932.9 161 933.4 165 934.2 177 937.7
185 938.1 220 940 740 960
Manning's n Values num= 3
Sta n Val Sta n Val Sta n Val
0 .07 116 .05 185 .1
Bank Sta: Left Right Lengths: Left Channel Right Coeff Contr. Expan.
116 185 1603 1603 1603 .2 .4
CROSS SECTION
RIVER: Pigg River
REACH: Reach 1 RS: 290620
INPUT
Description: Survey Sec FPG-4
Station Elevation Data num= 16
Sta Elev Sta Elev Sta Elev Sta Elev Sta Elev
820 960 1000 949.5 1077 939.7 1082 935.4 1087 933.8
1092 929.5 1102 927.6 1112 927 1122 928.3 1132 928.8
1136 929.6 1148 933.1 1156 940.9 1167 943.2 1341 947
1368 952.9
Manning's n Values num= 3
Sta n Val Sta n Val Sta n Val
820 .07 1087 .05 1156 .1
Bank Sta: Left Right Lengths: Left Channel Right Coeff Contr. Expan.
1087 1156 3770 3770 3770 .2 .4
CROSS SECTION
RIVER: Pigg River
REACH: Reach 1 RS: 286850
INPUT
Description: Survey Sec FPG-3
Station Elevation Data num= 15
Sta Elev Sta Elev Sta Elev Sta Elev Sta Elev
780 950 1000 943.3 1087 935.2 1099 936.5 1111 933.8
1117 924 1127 923.1 1137 923 1147 922.2 1157 922.7
1167 922.4 1173 924 1186 924 1194 944.7 1260 1000
Page 15

PiggRiver.rep
Manning's n Values num= 3
Sta n Val Sta n Val Sta n Val
780 .11 1099 .05 1194 .07
Bank Sta: Left Right Lengths: Left Channel Right Coeff Contr. Expan.
1099 1194 3960 3960 3960 .2 .4
CROSS SECTION
RIVER: Pigg River
REACH: Reach 1 RS: 282890
INPUT
Description: Survey Sec FPG-2
Station Elevation Data num= 11
Sta Elev Sta Elev Sta Elev Sta Elev Sta Elev
0 945.6 38 937.5 144 930.3 154 919.7 164 918.2
174 917.2 184 916.6 194 918 202 919.7 210 929.7
224 947.7
Manning's n Values num= 3
Sta n Val Sta n Val Sta n Val
0 .1 144 .05 210 .1
Bank Sta: Left Right Lengths: Left Channel Right Coeff Contr. Expan.
144 210 2630 2630 2630 .2 .4
CROSS SECTION
RIVER: Pigg River
REACH: Reach 1 RS: 280260
INPUT
Description: Survey Sec FPG-1 Lower Study Limit
Station Elevation Data num= 18
Sta Elev Sta Elev Sta Elev Sta Elev Sta Elev
830 1020 860 1000 910 980 940 960 960 940
1000 931.4 1018 916 1028 914.7 1038 913.9 1048 913.5
1058 913.4 1067 915.9 1082 926.1 1097 928.4 1110 926.7
1197 933.9 1210 940 1570 960
Manning's n Values num= 3
Sta n Val Sta n Val Sta n Val
830 .12 1000 .05 1082 .1
Page 16

PiggRiver.rep
Bank Sta: Left Right Lengths: Left Channel Right Coeff Contr. Expan.
1000 1082 1430 1430 1430 .2 .4
CROSS SECTION
RIVER: Pigg River
REACH: Reach 1 RS: 278830
INPUT
Description:
Station Elevation Data num= 10
Sta Elev Sta Elev Sta Elev Sta Elev Sta Elev
0 940 339 929.6 357 914.2 367 912.9 377 912.1
387 911.7 397 911.6 406 914.1 421 924.3 570 940
Manning's n Values num= 3
Sta n Val Sta n Val Sta n Val
0 .12 339 .05 421 .1
Bank Sta: Left Right Lengths: Left Channel Right Coeff Contr. Expan.
339 421 13 13 13 .2 .4
CROSS SECTION
RIVER: Pigg River
REACH: Reach 1 RS: 278817
INPUT
Description:
Station Elevation Data num= 10
Sta Elev Sta Elev Sta Elev Sta Elev Sta Elev
0 940 339 929.6 357 914.2 367 912.9 377 912.1
387 911.7 397 911.6 406 914.1 421 924.3 570 940
Manning's n Values num= 3
Sta n Val Sta n Val Sta n Val
0 .12 339 .05 421 .1
Bank Sta: Left Right Lengths: Left Channel Right Coeff Contr. Expan.
339 421 10 10 10 .2 .4
CROSS SECTION
RIVER: Pigg River
REACH: Reach 1 RS: 278807
Page 17
PiggRiver.rep
INPUT
Description:
Station Elevation Data num= 10
Sta Elev Sta Elev Sta Elev Sta Elev Sta Elev
0 940 339 929.6 357 914.2 367 912.9 377 912.1
387 911.7 397 911.6 406 914.1 421 924.3 570 940
Manning's n Values num= 3
Sta n Val Sta n Val Sta n Val
0 .12 339 .05 421 .1
Bank Sta: Left Right Lengths: Left Channel Right Coeff Contr. Expan.
339 421 5 5 5 .2 .4
CROSS SECTION
RIVER: Pigg River
REACH: Reach 1 RS: 278802
INPUT
Description:
Station Elevation Data num= 10
Sta Elev Sta Elev Sta Elev Sta Elev Sta Elev
0 940 339 929.6 357 914.2 367 912.9 377 912.1
387 911.7 397 911.6 406 914.1 421 924.3 570 940
Manning's n Values num= 3
Sta n Val Sta n Val Sta n Val
0 .12 339 .05 421 .1
Bank Sta: Left Right Lengths: Left Channel Right Coeff Contr. Expan.
339 421 1 1 1 .2 .4
CROSS SECTION
RIVER: Pigg River
REACH: Reach 1 RS: 278801
INPUT
Description:
Station Elevation Data num= 10
Sta Elev Sta Elev Sta Elev Sta Elev Sta Elev
0 940 339 929.6 357 914.2 367 912.9 377 912.1
387 911.7 397 911.6 406 914.1 421 924.3 570 940
Page 18
PiggRiver.rep
Manning's n Values num= 3
Sta n Val Sta n Val Sta n Val
0 .12 339 .05 421 .1
Bank Sta: Left Right Lengths: Left Channel Right Coeff Contr. Expan.
339 421 1 1 1 .2 .4
CROSS SECTION
RIVER: Pigg River
REACH: Reach 1 RS: 278800
INPUT
Description:
Station Elevation Data num= 10
Sta Elev Sta Elev Sta Elev Sta Elev Sta Elev
0 940 339 929.6 357 914.2 367 912.9 377 912.1
387 911.7 397 911.6 406 914.1 421 924.3 570 940
Manning's n Values num= 3
Sta n Val Sta n Val Sta n Val
0 .12 339 .05 421 .1
Bank Sta: Left Right Lengths: Left Channel Right Coeff Contr. Expan.
339 421 0 0 0 .2 .4
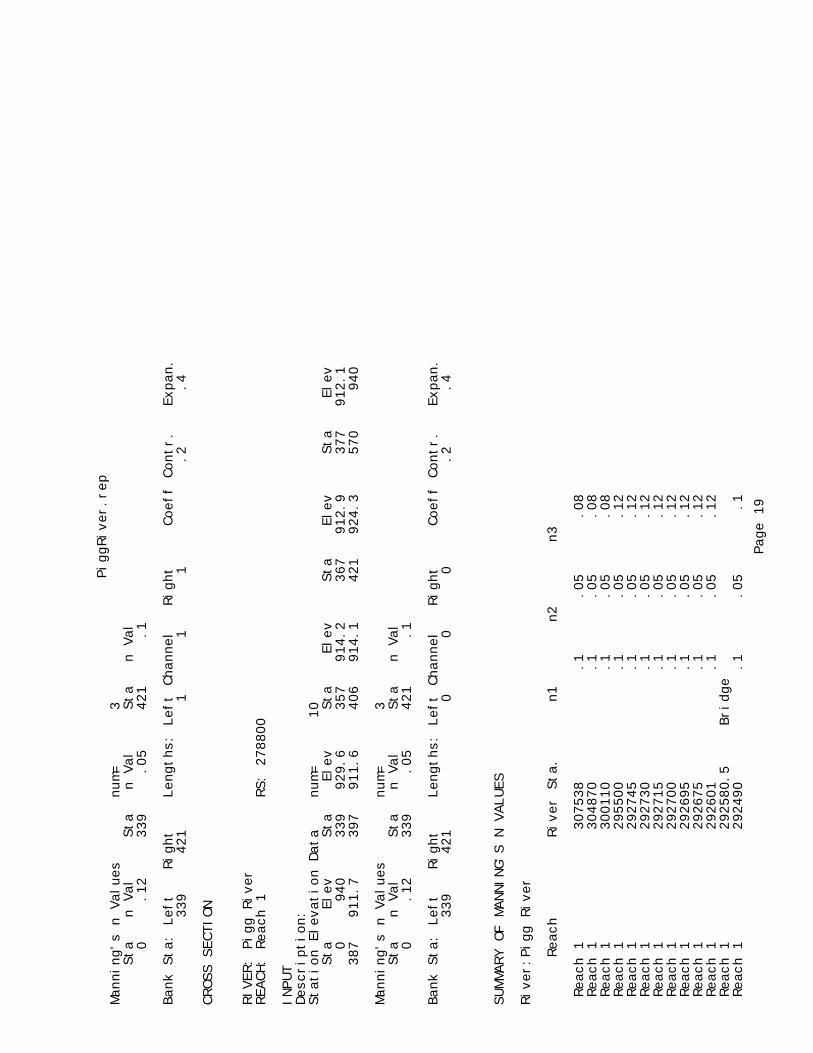
SUMMARY OF MANNING'S N VALUES
River:Pigg River
Reach River Sta. n1 n2 n3
Reach 1 307538 .1 .05 .08
Reach 1 304870 .1 .05 .08
Reach 1 300110 .1 .05 .08
Reach 1 295500 .1 .05 .12
Reach 1 292745 .1 .05 .12
Reach 1 292730 .1 .05 .12
Reach 1 292715 .1 .05 .12
Reach 1 292700 .1 .05 .12
Reach 1 292695 .1 .05 .12
Reach 1 292675 .1 .05 .12
Reach 1 292601 .1 .05 .12
Reach 1 292580.5 Bridge
Reach 1 292490 .1 .05 .1
Page 19

PiggRiver.rep
Reach 1 292337 .1 .05 .1
Reach 1 292287 .07 .05 .1
Reach 1 292273 .07 .05 .1
Reach 1 292223 .07 .05 .1
Reach 1 290620 .07 .05 .1
Reach 1 286850 .11 .05 .07
Reach 1 282890 .1 .05 .1
Reach 1 280260 .12 .05 .1
Reach 1 278830 .12 .05 .1
Reach 1 278817 .12 .05 .1
Reach 1 278807 .12 .05 .1
Reach 1 278802 .12 .05 .1
Reach 1 278801 .12 .05 .1
Reach 1 278800 .12 .05 .1
SUMMARY OF REACH LENGTHS
River: Pigg River
Reach River Sta. Left Channel Right
Reach 1 307538 2668 2668 2668
Reach 1 304870 4760 4760 4760
Reach 1 300110 4610 4610 4610
Reach 1 295500 3200 2744 2680
Reach 1 292745 15 15 15
Reach 1 292730 15 15 15
Reach 1 292715 15 15 15
Reach 1 292700 5 5 5
Reach 1 292695 20 20 20
Reach 1 292675 94 94 94
Reach 1 292601 41.83 41.83 41.83
Reach 1 292580.5 Bridge
Reach 1 292490 153 153 153
Reach 1 292337 50 50 50
Reach 1 292287 14 14 14
Reach 1 292273 50 50 50
Reach 1 292223 1603 1603 1603
Reach 1 290620 3770 3770 3770
Reach 1 286850 3960 3960 3960
Reach 1 282890 2630 2630 2630
Reach 1 280260 1430 1430 1430
Reach 1 278830 13 13 13
Reach 1 278817 10 10 10
Reach 1 278807 5 5 5
Page 20

PiggRiver.rep
Reach 1 278802 1 1 1
Reach 1 278801 1 1 1
Reach 1 278800 0 0 0
SUMMARY OF CONTRACTION AND EXPANSION COEFFICIENTS
River: Pigg River
Reach River Sta. Contr. Expan.
Reach 1 307538 .2 .4
Reach 1 304870 .2 .4
Reach 1 300110 .2 .4
Reach 1 295500 .2 .4
Reach 1 292745 .2 .4
Reach 1 292730 .2 .4
Reach 1 292715 .2 .4
Reach 1 292700 .2 .4
Reach 1 292695 .2 .4
Reach 1 292675 .2 .4
Reach 1 292601 .2 .4
Reach 1 292580.5 Bridge
Reach 1 292490 .2 .4
Reach 1 292337 .2 .4
Reach 1 292287 .2 .4
Reach 1 292273 .2 .4
Reach 1 292223 .2 .4
Reach 1 290620 .2 .4
Reach 1 286850 .2 .4
Reach 1 282890 .2 .4
Reach 1 280260 .2 .4
Reach 1 278830 .2 .4
Reach 1 278817 .2 .4
Reach 1 278807 .2 .4
Reach 1 278802 .2 .4
Reach 1 278801 .2 .4
Reach 1 278800 .2 .4
Page 21

PiggRiver.rep
HEC-RAS Version 4.1.0 Jan 2010
U.S. Army Corps of Engineers
Hydrologic Engineering Center
609 Second Street
Davis, California
X X XXXXXX XXXX XXXX XX XXXX
X X X X X X X X X X
X X X X X X X X X
XXXXXXX XXXX X XXX XXXX XXXXXX XXXX
X X X X X X X X X
X X X X X X X X X X
X X XXXXXX XXXX X X X X XXXXX
PROJECT DATA
Project Title: Pigg River
Project File : PiggRiver.prj
Run Date and Time: 8/30/2015 7:18:40 PM
Project in English units
Project Description:
PLAN DATA
Plan Title: Proposed Condition
Plan File : C:\Users\wta\Desktop\3505\HEC-RAS Model\Pigg River\PiggRiver.p03
Geometry Title: Proposed Condition
Geometry File : C:\Users\wta\Desktop\3505\HEC-RAS Model\Pigg River\PiggRiver.g03
Flow Title : Pigg Rvr HEC-2 Flows
Flow File : C:\Users\wta\Desktop\3505\HEC-RAS Model\Pigg River\PiggRiver.f01
Plan Summary Information:
Number of: Cross Sections = 26 Multiple Openings = 0
Culverts = 0 Inline Structures = 0
Bridges = 1 Lateral Structures = 0
Page 1

PiggRiver.rep
Computational Information
Water surface calculation tolerance = 0.01
Critical depth calculation tolerance = 0.01
Maximum number of iterations = 20
Maximum difference tolerance = 0.3
Flow tolerance factor = 0.001
Computation Options
Critical depth computed only where necessary
Conveyance Calculation Method: At breaks in n values only
Friction Slope Method: Average Conveyance
Computational Flow Regime: Subcritical Flow
Encroachment Data
Equal Conveyance = True
Left Offset = 0
Right Offset = 0
River = Pigg River Reach = Reach 1
RS Profile Method Value1 Value2
307538 PF 2 0
304870 PF 2 0
300110 PF 2 0
295500 PF 2 0
292745 PF 2 0
292730 PF 2 0
292715 PF 2 0
292700 PF 2 0
292695 PF 2 0
292675 PF 2 0
292490 PF 2 0
292337 PF 2 0
292287 PF 2 0
292273 PF 2 0
292223 PF 2 0
290620 PF 2 0
286850 PF 2 0
282890 PF 2 0
280260 PF 2 0
278830 PF 2 0
278817 PF 2 0
278807 PF 2 0
278802 PF 2 0
278801 PF 2 0
River = Pigg River Reach = Reach 1
RS Profile Method Value1 Value2
307538 PF 3 0
Page 2

PiggRiver.rep
304870 PF 3 0
300110 PF 3 0
295500 PF 3 0
292745 PF 3 0
292730 PF 3 0
292715 PF 3 0
292700 PF 3 0
292695 PF 3 0
292675 PF 3 0
292490 PF 3 0
292337 PF 3 0
292287 PF 3 0
292273 PF 3 0
292223 PF 3 0
290620 PF 3 0
286850 PF 3 0
282890 PF 3 0
280260 PF 3 0
278830 PF 3 0
278817 PF 3 0
278807 PF 3 0
278802 PF 3 0
278801 PF 3 0
River = Pigg River Reach = Reach 1
RS Profile Method Value1 Value2
307538 PF 4 0 0 0
304870 PF 4 0 0 0
300110 PF 4 0 0 0
295500 PF 4 0 0 0
292745 PF 4 0 0 0
292730 PF 4 0 0 0
292715 PF 4 0 0 0
292700 PF 4 0 0 0
292695 PF 4 0 0 0
292675 PF 4 0 0 0
292490 PF 4 0 0 0
292337 PF 4 0 0 0
292287 PF 4 0 0 0
292273 PF 4 0 0 0
292223 PF 4 0 0 0
290620 PF 4 0 0 0
286850 PF 4 0 0 0
282890 PF 4 0 0 0
280260 PF 4 0 0 0
278830 PF 4 0 0 0
278817 PF 4 0 0 0
278807 PF 4 0 0 0
Page 3

PiggRiver.rep
278802 PF 4 0 0 0
278801 PF 4 0 0 0
River = Pigg River Reach = Reach 1
RS Profile Method Value1 Value2
307538 PF 5 1 1168 1368
304870 PF 5 1 1025 1230
300110 PF 5 1 56 241
295500 PF 5 1 13 238
292745 PF 5 1 225 485
292730 PF 5 1 225 485
292715 PF 5 1 225 485
292700 PF 5 1 228 484
292695 PF 5 1 228 484
292675 PF 5 1 230 480
292490 PF 5 1 67 285
292337 PF 5 1 72 277
292287 PF 5 1 101 301
292273 PF 5 1 101 301
292223 PF 5 1 100 308
290620 PF 5 1 1082 1272
286850 PF 5 1 1034 1196
282890 PF 5 1 50 216
280260 PF 5 1 990 1140
278830 PF 5 1 313 464
278817 PF 5 1 313 464
278807 PF 5 1 313 464
278802 PF 5 1 313 464
278801 PF 5 1 313 464
FLOW DATA
Flow Title: Pigg Rvr HEC-2 Flows
Flow File : C:\Users\wta\Desktop\3505\HEC-RAS Model\Pigg River\PiggRiver.f01
Flow Data (cfs)
River Reach RS PF 1 PF 2 PF 3 PF 4
PF 5
Pigg River Reach 1 307538 5375 10174 12824 19848
12824
Pigg River Reach 1 295500 5450 10400 13000 20100
13000
Page 4

PiggRiver.rep
Boundary Conditions
River Reach Profile Upstream Downstream
Pigg River Reach 1 PF 1 Known WS = 928.32
Pigg River Reach 1 PF 2 Known WS = 935.93
Pigg River Reach 1 PF 3 Known WS = 937.5
Pigg River Reach 1 PF 4 Known WS = 940.39
GEOMETRY DATA
Geometry Title: Proposed Condition
Geometry File : C:\Users\wta\Desktop\3505\HEC-RAS Model\Pigg River\PiggRiver.g03
CROSS SECTION
RIVER: Pigg River
REACH: Reach 1 RS: 307538
INPUT
Description:
Station Elevation Data num= 15
Sta Elev Sta Elev Sta Elev Sta Elev Sta Elev
1050 1000 1100 980 1145 967.4 1188 964.8 1193 955.8
1203 955.1 1213 955.5 1223 954.7 1231 953.8 1233 955.5
1234 955.7 1243 964.8 1378 964.6 1434 978.9 1520 998.5
Manning's n Values num= 3
Sta n Val Sta n Val Sta n Val
1050 .1 1188 .05 1243 .08
Bank Sta: Left Right Lengths: Left Channel Right Coeff Contr. Expan.
1188 1243 2668 2668 2668 .2 .4
CROSS SECTION
RIVER: Pigg River
REACH: Reach 1 RS: 304870
INPUT
Description: Survey Sec FPG-10
Page 5
PiggRiver.rep
Station Elevation Data num= 19
Sta Elev Sta Elev Sta Elev Sta Elev Sta Elev
950 1000 980 980 1000 974.9 1017 962.9 1031 962.3
1040 955.3 1043 952.3 1050 952.4 1060 952.9 1070 953.5
1077 952.7 1080 953.3 1086 955.3 1092 962.1 1190 960.2
1250 967.6 1337 972.9 1400 980 1525 985
Manning's n Values num= 3
Sta n Val Sta n Val Sta n Val
950 .1 1031 .05 1086 .08
Bank Sta: Left Right Lengths: Left Channel Right Coeff Contr. Expan.
1031 1086 4760 4760 4760 .2 .4
CROSS SECTION
RIVER: Pigg River
REACH: Reach 1 RS: 300110
INPUT
Description: Survey Sec FPG-9
Station Elevation Data num= 16
Sta Elev Sta Elev Sta Elev Sta Elev Sta Elev
0 974.9 94 957.2 141 961.5 158 959 159 954.6
160 952.7 169 951.8 179 951.3 189 950.3 199 949.5
209 950.5 219 950.5 229 954.6 238 960.5 255 959.6
270 976.9
Manning's n Values num= 3
Sta n Val Sta n Val Sta n Val
0 .1 158 .05 238 .08
Bank Sta: Left Right Lengths: Left Channel Right Coeff Contr. Expan.
158 238 4610 4610 4610 .2 .4
CROSS SECTION
RIVER: Pigg River
REACH: Reach 1 RS: 295500
INPUT
Description: Survey Sec FPG-8
Station Elevation Data num= 16
Sta Elev Sta Elev Sta Elev Sta Elev Sta Elev
0 971 23 957 51 954 53 952.6 61 948.7
71 948 81 947.7 91 948.3 101 948.6 111 949.2
Page 6

PiggRiver.rep
121 952.1 135 954.6 137 958 195 956.4 273 957.8
334 972.2
Manning's n Values num= 3
Sta n Val Sta n Val Sta n Val
0 .1 23 .05 137 .12
Bank Sta: Left Right Lengths: Left Channel Right Coeff Contr. Expan.
23 137 3200 2744 2680 .2 .4
CROSS SECTION
RIVER: Pigg River
REACH: Reach 1 RS: 292745
INPUT
Description:
Station Elevation Data num= 18
Sta Elev Sta Elev Sta Elev Sta Elev Sta Elev
0 976.1 27 960.6 31 961.8 58 963.1 106 960.6
196 965.4 218 960.9 273 954.6 281.5 946.1 318.5 946.1
332 932.6 400 932.6 413.5 946.1 450.5 946.1 459 954.5
544 972.4 588 973.1 596 977.2
Manning's n Values num= 3
Sta n Val Sta n Val Sta n Val
0 .1 273 .05 459 .12
Bank Sta: Left Right Lengths: Left Channel Right Coeff Contr. Expan.
273 459 15 15 15 .2 .4
CROSS SECTION
RIVER: Pigg River
REACH: Reach 1 RS: 292730
INPUT
Description:
Station Elevation Data num= 18
Sta Elev Sta Elev Sta Elev Sta Elev Sta Elev
0 976.1 27 960.6 31 961.8 58 963.1 106 960.6
196 965.4 218 960.9 273 954.6 281.5 946.1 318.5 946.1
332 932.6 400 932.6 413.5 946.1 450.5 946.1 459 954.5
544 972.4 588 973.1 596 977.2
Manning's n Values num= 3
Page 7

PiggRiver.rep
Sta n Val Sta n Val Sta n Val
0 .1 273 .05 459 .12
Bank Sta: Left Right Lengths: Left Channel Right Coeff Contr. Expan.
273 459 15 15 15 .2 .4
CROSS SECTION
RIVER: Pigg River
REACH: Reach 1 RS: 292715
INPUT
Description:
Station Elevation Data num= 18
Sta Elev Sta Elev Sta Elev Sta Elev Sta Elev
0 976.1 27 960.6 31 961.8 58 963.1 106 960.6
196 965.4 218 960.9 273 954.6 281.5 946.1 318.5 946.1
332 932.6 400 932.6 413.5 946.1 450.5 946.1 459 954.5
544 972.4 588 973.1 596 977.2
Manning's n Values num= 3
Sta n Val Sta n Val Sta n Val
0 .1 273 .05 459 .12
Bank Sta: Left Right Lengths: Left Channel Right Coeff Contr. Expan.
273 459 15 15 15 .2 .4
CROSS SECTION
RIVER: Pigg River
REACH: Reach 1 RS: 292700
INPUT
Description:
Station Elevation Data num= 18
Sta Elev Sta Elev Sta Elev Sta Elev Sta Elev
0 976.1 27 960.6 31 961.8 58 963.1 106 960.6
196 965.4 218 960.9 273 954.6 281.5 946.1 318.5 946.1
332 932.6 400 932.6 413.5 946.1 450.5 946.1 459 954.5
544 972.4 588 973.1 596 977.2
Manning's n Values num= 3
Sta n Val Sta n Val Sta n Val
0 .1 273 .05 459 .12
Bank Sta: Left Right Lengths: Left Channel Right Coeff Contr. Expan.
Page 8
PiggRiver.rep
273 459 5 5 5 .2 .4
CROSS SECTION
RIVER: Pigg River
REACH: Reach 1 RS: 292695
INPUT
Description: Dam Survey Sec FPG-7
Station Elevation Data num= 18
Sta Elev Sta Elev Sta Elev Sta Elev Sta Elev
0 976.1 27 960.6 31 961.8 58 963.1 106 960.6
196 965.4 218 960.9 273 954.6 281.5 946.1 318.5 946.1
332 932.6 400 932.6 413.5 946.1 450.5 946.1 459 954.5
544 972.4 588 973.1 596 977.2
Manning's n Values num= 3
Sta n Val Sta n Val Sta n Val
0 .1 273 .05 459 .12
Bank Sta: Left Right Lengths: Left Channel Right Coeff Contr. Expan.
273 459 20 20 20 .2 .4
CROSS SECTION
RIVER: Pigg River
REACH: Reach 1 RS: 292675
INPUT
Description:
Station Elevation Data num= 23
Sta Elev Sta Elev Sta Elev Sta Elev Sta Elev
0 976.1 27 960.6 31 961.8 58 963.1 106 960.6
196 965.4 218 961.7 235 954.9 300 944.8 310 943.4
323 934 333 932.8 343 931.8 353 931.6 369 934.1
396 935.9 400 944.1 418 948.3 475 957.1 511 958.3
544 972.4 588 973.1 596 977.2
Manning's n Values num= 3
Sta n Val Sta n Val Sta n Val
0 .1 235 .05 475 .12
Bank Sta: Left Right Lengths: Left Channel Right Coeff Contr. Expan.
235 475 94 94 94 .2 .4
CROSS SECTION
Page 9

PiggRiver.rep
RIVER: Pigg River
REACH: Reach 1 RS: 292601
INPUT
Description:
Station Elevation Data num= 17
Sta Elev Sta Elev Sta Elev Sta Elev Sta Elev
0 959 60 957 75 948 100 936 125 932
150 931.5 175 932 200 932 225 934 250 936
275 952 300 964 312 970 325 971 350 972
375 973 400 980
Manning's n Values num= 3
Sta n Val Sta n Val Sta n Val
0 .1 60 .05 300 .12
Bank Sta: Left Right Lengths: Left Channel Right Coeff Contr. Expan.
60 300 41.83 41.83 41.83 .2 .4
Ineffective Flow num= 2
Sta L Sta R Elev Permanent
0 55.5 957.12 F
316.5 400 970 F
BRIDGE
RIVER: Pigg River
REACH: Reach 1 RS: 292580.5
INPUT
Description:
Distance from Upstream XS = 5
Deck/Roadway Width = 31.83
Weir Coefficient = 2.6
Upstream Deck/Roadway Coordinates
num= 2
Sta Hi Cord Lo Cord Sta Hi Cord Lo Cord
60 961 947.98 312 969.94 957.54
Upstream Bridge Cross Section Data
Station Elevation Data num= 17
Sta Elev Sta Elev Sta Elev Sta Elev Sta Elev
0 959 60 957 75 948 100 936 125 932
150 931.5 175 932 200 932 225 934 250 936
275 952 300 964 312 970 325 971 350 972
375 973 400 980
Page 10
PiggRiver.rep
Manning's n Values num= 3
Sta n Val Sta n Val Sta n Val
0 .1 60 .05 300 .12
Bank Sta: Left Right Coeff Contr. Expan.
60 300 .2 .4
Ineffective Flow num= 2
Sta L Sta R Elev Permanent
0 55.5 957.12 F
316.5 400 970 F
Downstream Deck/Roadway Coordinates
num= 6
Sta Hi Cord Lo Cord Sta Hi Cord Lo Cord Sta Hi Cord Lo Cord
17 954.7 41 958.1 947.98 41 961 947.98
293 969.94 957.54 293 967.1 380 956.6
Downstream Bridge Cross Section Data
Station Elevation Data num= 18
Sta Elev Sta Elev Sta Elev Sta Elev Sta Elev
0 959.4 34 950 123 944.1 129 941.9 141 944.6
151 943.2 164 933.8 174 932.6 184 931.6 194 931.4
210 933.9 237 935.7 241 943.9 259 948.1 305 947.5
312 950.3 349 950.5 380 956.6
Manning's n Values num= 3
Sta n Val Sta n Val Sta n Val
0 .1 151 .05 241 .1
Bank Sta: Left Right Coeff Contr. Expan.
151 241 .2 .4
Ineffective Flow num= 1
Sta L Sta R Elev Permanent
367.6 380 970 F
Upstream Embankment side slope = 0 horiz. to 1.0 vertical
Downstream Embankment side slope = 0 horiz. to 1.0 vertical
Maximum allowable submergence for weir flow = .98
Elevation at which weir flow begins =
Energy head used in spillway design =
Spillway height used in design =
Weir crest shape = Broad Crested
Number of Piers = 4
Pier Data
Pier Station Upstream= 110 Downstream= 91 Page 11

PiggRiver.rep
Upstream num= 2
Width Elev Width Elev
12 940 12 955
Downstream num= 2
Width Elev Width Elev
12 940 12 955
Pier Data
Pier Station Upstream= 160 Downstream= 141
Upstream num= 2
Width Elev Width Elev
12 940 12 955
Downstream num= 2
Width Elev Width Elev
12 940 12 955
Pier Data
Pier Station Upstream= 210 Downstream= 191
Upstream num= 2
Width Elev Width Elev
12 940 12 955
Downstream num= 2
Width Elev Width Elev
12 940 12 955
Pier Data
Pier Station Upstream= 260 Downstream= 241
Upstream num= 2
Width Elev Width Elev
12 940 12 960
Downstream num= 2
Width Elev Width Elev
12 940 12 960
Number of Bridge Coefficient Sets = 1
Low Flow Methods and Data
Energy
Selected Low Flow Methods = Highest Energy Answer
High Flow Method
Energy Only
Additional Bridge Parameters
Add Friction component to Momentum
Do not add Weight component to Momentum
Class B flow critical depth computations use critical depth
inside the bridge at the upstream end
Page 12

PiggRiver.rep
Criteria to check for pressure flow = Upstream energy grade line
CROSS SECTION
RIVER: Pigg River
REACH: Reach 1 RS: 292490
INPUT
Description: Survey Sec FPG-6
Station Elevation Data num= 18
Sta Elev Sta Elev Sta Elev Sta Elev Sta Elev
0 959.4 34 950 123 944.1 129 941.9 141 944.6
151 943.2 164 933.8 174 932.6 184 931.6 194 931.4
210 933.9 237 935.7 241 943.9 259 948.1 305 947.5
312 950.3 349 950.5 380 956.6
Manning's n Values num= 3
Sta n Val Sta n Val Sta n Val
0 .1 151 .05 241 .1
Bank Sta: Left Right Lengths: Left Channel Right Coeff Contr. Expan.
151 241 153 153 153 .2 .4
Ineffective Flow num= 1
Sta L Sta R Elev Permanent
367.6 380 970 F
CROSS SECTION
RIVER: Pigg River
REACH: Reach 1 RS: 292337
INPUT
Description:
Station Elevation Data num= 18
Sta Elev Sta Elev Sta Elev Sta Elev Sta Elev
0 958.6 34 949.2 123 943.3 129 941.1 141 943.8
151 942.4 164 933 174 931.8 184 930.8 194 930.6
210 933.1 237 934.9 241 943.1 259 947.3 305 946.7
312 949.5 349 949.7 380 955.8
Manning's n Values num= 3
Sta n Val Sta n Val Sta n Val
0 .1 151 .05 241 .1
Bank Sta: Left Right Lengths: Left Channel Right Coeff Contr. Expan.
151 241 50 50 50 .2 .4
Page 13

PiggRiver.rep
CROSS SECTION
RIVER: Pigg River
REACH: Reach 1 RS: 292287
INPUT
Description: Copied XS 292273
Station Elevation Data num= 16
Sta Elev Sta Elev Sta Elev Sta Elev Sta Elev
0 960 20 955.6 26 951.9 28 953.4 34 953.2
75 945.2 101.2 942.8 121.2 941.3 136.2 931.7 181.2 931.7
186.2 938.3 198.8 939 220 940 408 947.2 508 948.8
597 956.9
Manning's n Values num= 3
Sta n Val Sta n Val Sta n Val
0 .07 101.2 .05 198.8 .1
Bank Sta: Left Right Lengths: Left Channel Right Coeff Contr. Expan.
101.2 198.8 14 14 14 .2 .4
CROSS SECTION
RIVER: Pigg River
REACH: Reach 1 RS: 292273
INPUT
Description: VA 713 Survey Sec FPG-5
Station Elevation Data num= 16
Sta Elev Sta Elev Sta Elev Sta Elev Sta Elev
0 960 20 955.6 26 951.9 28 953.4 34 953.2
75 945.2 101.2 942.8 121.2 941.3 136.2 931.7 181.2 931.7
186.2 938.3 198.8 939 220 940 408 947.2 508 948.8
597 956.9
Manning's n Values num= 3
Sta n Val Sta n Val Sta n Val
0 .07 101.2 .05 198.8 .1
Bank Sta: Left Right Lengths: Left Channel Right Coeff Contr. Expan.
101.2 198.8 50 50 50 .2 .4
CROSS SECTION
Page 14

PiggRiver.rep
RIVER: Pigg River
REACH: Reach 1 RS: 292223
INPUT
Description: Topo Sec FPG-4A
Station Elevation Data num= 13
Sta Elev Sta Elev Sta Elev Sta Elev Sta Elev
0 960 100 940 116 938.4 121 934.1 131 932.1
141 931.6 151 932.9 161 933.4 165 934.2 177 937.7
185 938.1 220 940 740 960
Manning's n Values num= 3
Sta n Val Sta n Val Sta n Val
0 .07 116 .05 185 .1
Bank Sta: Left Right Lengths: Left Channel Right Coeff Contr. Expan.
116 185 1603 1603 1603 .2 .4
CROSS SECTION
RIVER: Pigg River
REACH: Reach 1 RS: 290620
INPUT
Description: Survey Sec FPG-4
Station Elevation Data num= 16
Sta Elev Sta Elev Sta Elev Sta Elev Sta Elev
820 960 1000 949.5 1077 939.7 1082 935.4 1087 933.8
1092 929.5 1102 927.6 1112 927 1122 928.3 1132 928.8
1136 929.6 1148 933.1 1156 940.9 1167 943.2 1341 947
1368 952.9
Manning's n Values num= 3
Sta n Val Sta n Val Sta n Val
820 .07 1087 .05 1156 .1
Bank Sta: Left Right Lengths: Left Channel Right Coeff Contr. Expan.
1087 1156 3770 3770 3770 .2 .4
CROSS SECTION
RIVER: Pigg River
REACH: Reach 1 RS: 286850
INPUT
Description: Survey Sec FPG-3
Page 15

PiggRiver.rep
Station Elevation Data num= 15
Sta Elev Sta Elev Sta Elev Sta Elev Sta Elev
780 950 1000 943.3 1087 935.2 1099 936.5 1111 933.8
1117 924 1127 923.1 1137 923 1147 922.2 1157 922.7
1167 922.4 1173 924 1186 924 1194 944.7 1260 1000
Manning's n Values num= 3
Sta n Val Sta n Val Sta n Val
780 .11 1099 .05 1194 .07
Bank Sta: Left Right Lengths: Left Channel Right Coeff Contr. Expan.
1099 1194 3960 3960 3960 .2 .4
CROSS SECTION
RIVER: Pigg River
REACH: Reach 1 RS: 282890
INPUT
Description: Survey Sec FPG-2
Station Elevation Data num= 11
Sta Elev Sta Elev Sta Elev Sta Elev Sta Elev
0 945.6 38 937.5 144 930.3 154 919.7 164 918.2
174 917.2 184 916.6 194 918 202 919.7 210 929.7
224 947.7
Manning's n Values num= 3
Sta n Val Sta n Val Sta n Val
0 .1 144 .05 210 .1
Bank Sta: Left Right Lengths: Left Channel Right Coeff Contr. Expan.
144 210 2630 2630 2630 .2 .4
CROSS SECTION
RIVER: Pigg River
REACH: Reach 1 RS: 280260
INPUT
Description: Survey Sec FPG-1 Lower Study Limit
Station Elevation Data num= 18
Sta Elev Sta Elev Sta Elev Sta Elev Sta Elev
830 1020 860 1000 910 980 940 960 960 940
1000 931.4 1018 916 1028 914.7 1038 913.9 1048 913.5
1058 913.4 1067 915.9 1082 926.1 1097 928.4 1110 926.7
1197 933.9 1210 940 1570 960
Page 16
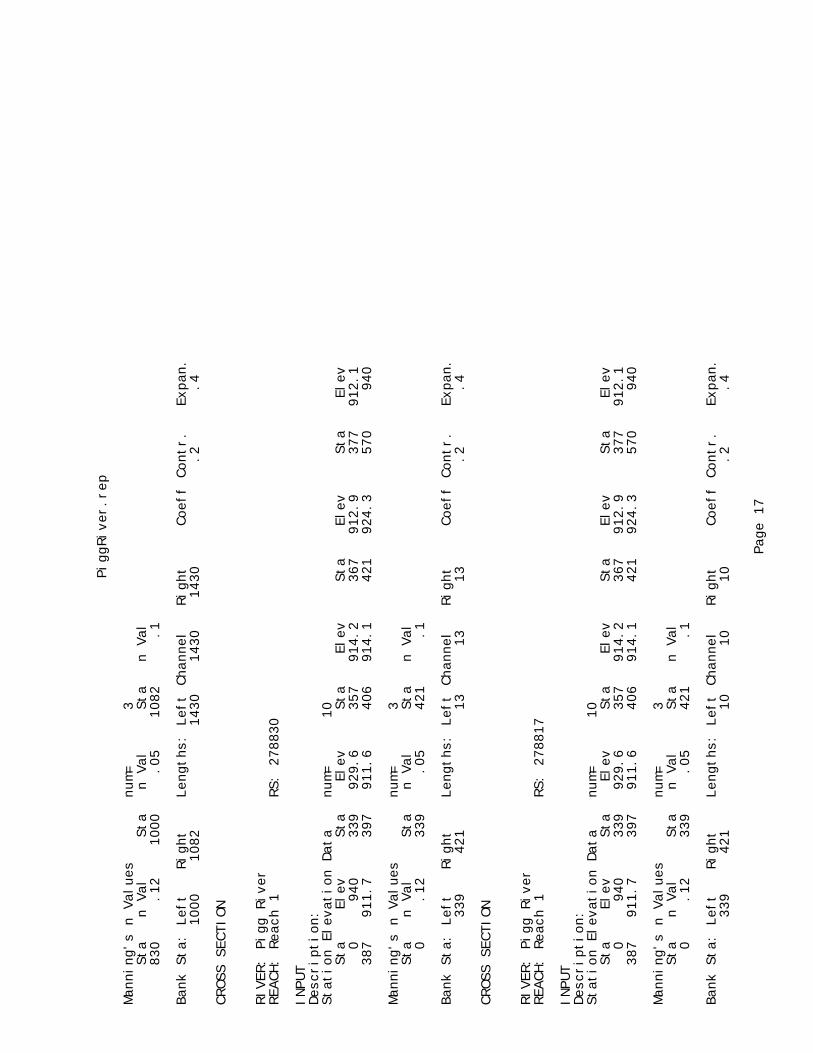
PiggRiver.rep
Manning's n Values num= 3
Sta n Val Sta n Val Sta n Val
830 .12 1000 .05 1082 .1
Bank Sta: Left Right Lengths: Left Channel Right Coeff Contr. Expan.
1000 1082 1430 1430 1430 .2 .4
CROSS SECTION
RIVER: Pigg River
REACH: Reach 1 RS: 278830
INPUT
Description:
Station Elevation Data num= 10
Sta Elev Sta Elev Sta Elev Sta Elev Sta Elev
0 940 339 929.6 357 914.2 367 912.9 377 912.1
387 911.7 397 911.6 406 914.1 421 924.3 570 940
Manning's n Values num= 3
Sta n Val Sta n Val Sta n Val
0 .12 339 .05 421 .1
Bank Sta: Left Right Lengths: Left Channel Right Coeff Contr. Expan.
339 421 13 13 13 .2 .4
CROSS SECTION
RIVER: Pigg River
REACH: Reach 1 RS: 278817
INPUT
Description:
Station Elevation Data num= 10
Sta Elev Sta Elev Sta Elev Sta Elev Sta Elev
0 940 339 929.6 357 914.2 367 912.9 377 912.1
387 911.7 397 911.6 406 914.1 421 924.3 570 940
Manning's n Values num= 3
Sta n Val Sta n Val Sta n Val
0 .12 339 .05 421 .1
Bank Sta: Left Right Lengths: Left Channel Right Coeff Contr. Expan.
339 421 10 10 10 .2 .4
Page 17

PiggRiver.rep
CROSS SECTION
RIVER: Pigg River
REACH: Reach 1 RS: 278807
INPUT
Description:
Station Elevation Data num= 10
Sta Elev Sta Elev Sta Elev Sta Elev Sta Elev
0 940 339 929.6 357 914.2 367 912.9 377 912.1
387 911.7 397 911.6 406 914.1 421 924.3 570 940
Manning's n Values num= 3
Sta n Val Sta n Val Sta n Val
0 .12 339 .05 421 .1
Bank Sta: Left Right Lengths: Left Channel Right Coeff Contr. Expan.
339 421 5 5 5 .2 .4
CROSS SECTION
RIVER: Pigg River
REACH: Reach 1 RS: 278802
INPUT
Description:
Station Elevation Data num= 10
Sta Elev Sta Elev Sta Elev Sta Elev Sta Elev
0 940 339 929.6 357 914.2 367 912.9 377 912.1
387 911.7 397 911.6 406 914.1 421 924.3 570 940
Manning's n Values num= 3
Sta n Val Sta n Val Sta n Val
0 .12 339 .05 421 .1
Bank Sta: Left Right Lengths: Left Channel Right Coeff Contr. Expan.
339 421 1 1 1 .2 .4
CROSS SECTION
RIVER: Pigg River
REACH: Reach 1 RS: 278801
INPUT
Description:
Page 18

PiggRiver.rep
Station Elevation Data num= 10
Sta Elev Sta Elev Sta Elev Sta Elev Sta Elev
0 940 339 929.6 357 914.2 367 912.9 377 912.1
387 911.7 397 911.6 406 914.1 421 924.3 570 940
Manning's n Values num= 3
Sta n Val Sta n Val Sta n Val
0 .12 339 .05 421 .1
Bank Sta: Left Right Lengths: Left Channel Right Coeff Contr. Expan.
339 421 1 1 1 .2 .4
CROSS SECTION
RIVER: Pigg River
REACH: Reach 1 RS: 278800
INPUT
Description:
Station Elevation Data num= 10
Sta Elev Sta Elev Sta Elev Sta Elev Sta Elev
0 940 339 929.6 357 914.2 367 912.9 377 912.1
387 911.7 397 911.6 406 914.1 421 924.3 570 940
Manning's n Values num= 3
Sta n Val Sta n Val Sta n Val
0 .12 339 .05 421 .1
Bank Sta: Left Right Lengths: Left Channel Right Coeff Contr. Expan.
339 421 0 0 0 .2 .4
SUMMARY OF MANNING'S N VALUES
River:Pigg River
Reach River Sta. n1 n2 n3
Reach 1 307538 .1 .05 .08
Reach 1 304870 .1 .05 .08
Reach 1 300110 .1 .05 .08
Reach 1 295500 .1 .05 .12
Reach 1 292745 .1 .05 .12
Reach 1 292730 .1 .05 .12
Reach 1 292715 .1 .05 .12
Reach 1 292700 .1 .05 .12
Page 19
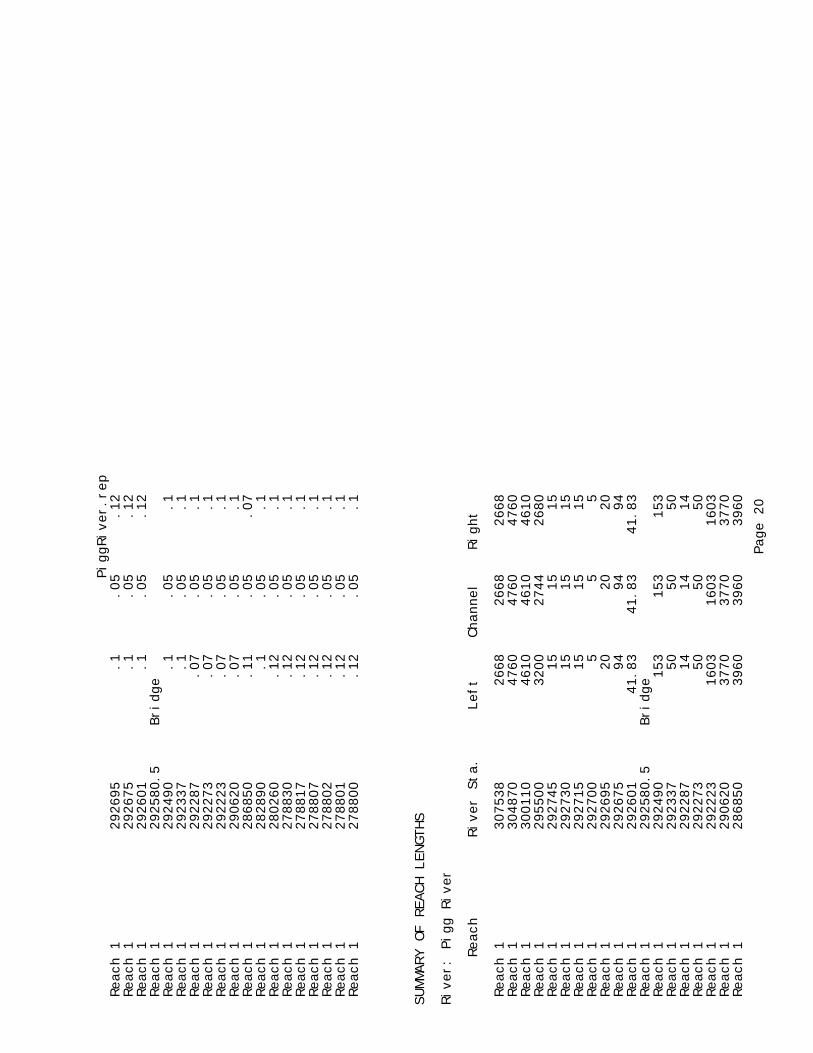
PiggRiver.rep
Reach 1 292695 .1 .05 .12
Reach 1 292675 .1 .05 .12
Reach 1 292601 .1 .05 .12
Reach 1 292580.5 Bridge
Reach 1 292490 .1 .05 .1
Reach 1 292337 .1 .05 .1
Reach 1 292287 .07 .05 .1
Reach 1 292273 .07 .05 .1
Reach 1 292223 .07 .05 .1
Reach 1 290620 .07 .05 .1
Reach 1 286850 .11 .05 .07
Reach 1 282890 .1 .05 .1
Reach 1 280260 .12 .05 .1
Reach 1 278830 .12 .05 .1
Reach 1 278817 .12 .05 .1
Reach 1 278807 .12 .05 .1
Reach 1 278802 .12 .05 .1
Reach 1 278801 .12 .05 .1
Reach 1 278800 .12 .05 .1
SUMMARY OF REACH LENGTHS
River: Pigg River
Reach River Sta. Left Channel Right
Reach 1 307538 2668 2668 2668
Reach 1 304870 4760 4760 4760
Reach 1 300110 4610 4610 4610
Reach 1 295500 3200 2744 2680
Reach 1 292745 15 15 15
Reach 1 292730 15 15 15
Reach 1 292715 15 15 15
Reach 1 292700 5 5 5
Reach 1 292695 20 20 20
Reach 1 292675 94 94 94
Reach 1 292601 41.83 41.83 41.83
Reach 1 292580.5 Bridge
Reach 1 292490 153 153 153
Reach 1 292337 50 50 50
Reach 1 292287 14 14 14
Reach 1 292273 50 50 50
Reach 1 292223 1603 1603 1603
Reach 1 290620 3770 3770 3770
Reach 1 286850 3960 3960 3960
Page 20

PiggRiver.rep
Reach 1 282890 2630 2630 2630
Reach 1 280260 1430 1430 1430
Reach 1 278830 13 13 13
Reach 1 278817 10 10 10
Reach 1 278807 5 5 5
Reach 1 278802 1 1 1
Reach 1 278801 1 1 1
Reach 1 278800 0 0 0
SUMMARY OF CONTRACTION AND EXPANSION COEFFICIENTS
River: Pigg River
Reach River Sta. Contr. Expan.
Reach 1 307538 .2 .4
Reach 1 304870 .2 .4
Reach 1 300110 .2 .4
Reach 1 295500 .2 .4
Reach 1 292745 .2 .4
Reach 1 292730 .2 .4
Reach 1 292715 .2 .4
Reach 1 292700 .2 .4
Reach 1 292695 .2 .4
Reach 1 292675 .2 .4
Reach 1 292601 .2 .4
Reach 1 292580.5 Bridge
Reach 1 292490 .2 .4
Reach 1 292337 .2 .4
Reach 1 292287 .2 .4
Reach 1 292273 .2 .4
Reach 1 292223 .2 .4
Reach 1 290620 .2 .4
Reach 1 286850 .2 .4
Reach 1 282890 .2 .4
Reach 1 280260 .2 .4
Reach 1 278830 .2 .4
Reach 1 278817 .2 .4
Reach 1 278807 .2 .4
Reach 1 278802 .2 .4
Reach 1 278801 .2 .4
Reach 1 278800 .2 .4
Page 21