Boliden Annual Report 2016...zinc ingots, copper cathodes, gold and silver bars, and by-products,...
124
METALS & FOR THE FUTURE INNOVATION ANNUAL REPORT 2016
Transcript of Boliden Annual Report 2016...zinc ingots, copper cathodes, gold and silver bars, and by-products,...

METALS &
FOR THE FUTUREINNOVATION
ANNUAL REPORT 2016

Introduction
The year in brief bAbout Boliden 2President’s Statement 4Strategy 6Target fulfilment 8Value creation 10
Market
Market trends 12Market position 14Competitiveness 15Price trends 16Income model 20
Boliden’s operations
Boliden’s mines and smelters 22The Group’s performance 25Business Area Mines 28Business Area Smelters 34Sustainable development 40Employees 41Environment 44Society 48Partners and purchasing 50The Boliden share 52Risk management 54
Corporate Governance
Corporate Governance Report 58The Board of Directors 64The Group management 66Internal Control Report 67
Financial reports
The Group 68The Parent Company 73Notes to the accounts 74Proposed allocation of profits 99Audit report 100Auditor’s Limited Assurance Report on Boliden AB’s Sustainability Report 104Mineral Reserves and Mineral Resources 105Ten-year overviews 110Definitions and industry concepts 117Annual General Meeting 119Addresses 120
Contents
The year in brief
Several of the mines are developing worldleading automation technology that improves both safety and productivity. September, for example, saw the world premiere of driverless trucks, 1,000 m underground.
Boliden acquired the Finnish copper and nickel mine, Kevitsa, during the year. Kevitsa is a high quality mine with a good operational fit.
Important events
Boliden – metals for modern life
Boliden produces metals that make modern society
work. Our operations are characterised by concern
for people, the environment and society, and we
are one of the best companies in the world when it
comes to sustainable mining and metal production.
Boliden also enjoys a leading position in metal recy-
cling. The combination of in-depth experience and
development of best available technology means that
our mines and smelters are well-positioned to handle
global competition. Boliden has 5,500 employees
in Sweden, Norway, Finland and Ireland and has an
annual turnover of SEK 40 billion.
) page ) page
Boliden Annual Report 2016
THE YEAR IN BRIEF

The world’s first electric road for heavy trucks on public roads was opened in June. Boliden is involved in this project, which aims to identify more economic, climate-friendly forms of transport.
• Revenues were stable and totalled SEK 40,316 m (40,242).
• Adjusted for the acquisition of Kevitsa, the operating profit, excl. revaluation of process inventory, in-creased by SEK 985 m due to increased production, primarily within Mines, and improved market terms, mainly in the form of higher metal prices.
• The free cash flow, excl. the consideration for Kevitsa, was SEK 3,124 m (2,565). The year on year increase was due to the improvement in profits.
• The number of accidents leading to absence from work (LTI) fell to 7.9 (8.9) per one million hours worked.
• An estimated 612 GWh of surplus heat was utilised internally and 877 GWh was delivered to other com-panies or used to heat homes.
• Boliden’s share price rose during the year by 66 per cent and consequently outperformed the Stockholm Stock Exchange.
The year in brief
Wireless networks and positioning systems have been installed in the mines to enable both personnel and machines to be located. High-speed networks have been expanded, enabling increased automation.
Key data 2016 2015
Revenues, SEK m 40,316 40,242 Operating profit before depreciation, SEK m 9,881 7,112Operating profit, excl. revaluation of process inventory, SEK m 5,094 4,010
Operating profit, SEK m 5,682 3,590
Earnings per share, SEK 15,49 9,65
Free cash flow, SEK m –2,801 2,565
Investments, SEK m 4,127 3,650
Acquisitions, SEK m 5,961 –
Capital employed, SEK m 42,457 35,131
Return on capital employed, % 15 10
Return on shareholders’ equity, % 16 11
Number of employees, FTE 5,477 4,878
Net debt/equity ratio, % 32 23
Dividend per share, SEK 5.25 3.25
Accidents (LTI frequency) 7.9 8.9
Sick leave, % 4.4 4.6
Metals to water, tonnes, Me-eq 13 18
Metals to air, tonnes, Me-eq 100 88
Carbon dioxide intensity, tonnes/tonne 0.69 0.65
Sulphur dioxide emissions, ktonnes 7.1 7.2
Number of environmental incidents 17 14
Nickel operations at the Harjavalta smelter were reorganised and devel-oped, and the acquisition of the Kevitsa mine has ensured a stable supply of raw materials.
) page ) page
) page
Introduction Market Operations Corporate governance Financial reports
Boliden Annual Report 2016 | 1
THE YEAR IN BRIEF

ExplorationExploration – the search for new mineral deposits – is conducted to ensure the operations’ future and to supply society’s need for high quality metals. Boliden’s explo-ration work employs advanced technology and tried and trusted methods to locate deposits that contain zinc, copper, nickel and precious metals.
MiningBoliden has both open-pit and underground mines. The work involves drilling, blasting, loading, and crushing the ore. Boliden’s mines are amongst the most effi-cient in the world, thanks to high-tech methods such as positioning, remote controlled machines, and premium level care for the natural environment.
ConcentrationThe crushed ore is transported to concentrators, which are usually located in the immediate vicinity of the mine, where it is processed into concentrates with a high metal grade. The process is highly automated and based on chemical and mechanical separation and, in some cases, leaching. The majority of the mines’ zinc and copper con-centrate is sold to Boliden’s smelt-ers for refining into pure metall.
Boliden’s business model takes responsibility for the entire value chain – from exploration and mining to the recycling and production of metals.
From deposit to customer in a circular economy
Mines
Exploration Mining Concentration
2 | Boliden Annual Report 2016
ABOUT BOLIDEN

Raw materials feedThe smelters’ raw materials com-prise concentrates from Boliden’s own mines, external mines, and recycling material suppliers. Investments in recycling technol-ogy have made Boliden a leading player in the metal recycling field, principally for electronics and automotive batteries.
Metal productionThe smelters primarily produce zinc ingots, copper cathodes, gold and silver bars, and by-products, together with smaller quantities of several other metals. Process development improves the smelt-ers’ ability to increase the degree of metal extraction and thereby reduce the amount of waste generated.
SalesBoliden strives to supply the high-est quality metals with the level of purity that customers require. The majority of the products are sold to industrial customers in Europe who refine them to produce cop-per wire and galvanized products, for example. The automotive and construction industries are the most important end-consumers.
Smelting
Feed Metal production
Sales
External concentrate suppliers
Metals are used everywhere in society, e.g. in buildings, vehicles, telecoms, and energy transfer.
Refinement within industrial
production
Collection and recycling of used metals
Find out more at boliden.com
Introduction Market Operations Corporate governance Financial reports
Boliden Annual Report 2016 | 3
ABOUT BOLIDEN

Stable production, investments in organic growth, and selected acquisitions form the basis for Boliden’s value creation. In 2016, every one of these bases helped generate a strong profit, despite low metal prices at the beginning of the year.
Changes take time in our capital-intensive industry and strategy puts the conditions in place for long-term success. Boliden’s strategy focuses on, amongst other things, process stability, investments and acquisitions. We are building a position of strong competitiveness in each unit, with stable and efficient operations, at the same time we exploit advantages from the combination of mines and smelters. Persistence in this work has yielded results.
We invest in organic growth. The massive invest-ments in Aitik and Garpenberg yielded world class productivity at our most important mines, coupled with the investments in Rönnskär, Kokkola and Harjavalta that improved our ability to extract metals from complex materials, are examples of this ap-proach. 2016 also saw the acquisition of Finland’s big-gest mine, the Kevitsa nickel and copper mine in the northern part of the country. The acquisition was part of our new focus on nickel. We started by building up a nickel supplier and customer base for Harjavalta, and then acquired the mine, which offers substantial synergies with Boliden and provides materials ideally suited to Harjavalta.
ProfitsThe operating profit, excluding the revaluation of pro-cess inventory, totalled SEK 5.1 billion, in comparison with SEK 4 billion for the previous year. The year be-gan with pressured metal prices, but global market im-proved after the second quarter, and prices rose. These factors, coupled with strong production levels, made the latter half of the year one of the best in Boliden’s history. I particularly would like to highlight the posi-tive trend at Garpenberg, where the massive expansion and rationalisation project between 2011 and 2014 at a cost of SEK 3.9 billion resulted in an operating profit of SEK 2.1 billion for 2016. Tara, the Boliden Area and Kevitsa also posted strong production figures and impressive profits. Smelters’ strategy over the years has strengthened the ability to optimise operations and created healthy profitability. The action programme at Rönnskär running since 2014 has improved competi-tiveness, while Odda, whose competitiveness was poor four years ago, has implemented several improvement programmes in the last few years. A lot of things went
very well during the year, but there is still scope for improvement in several areas: production at Aitik con-tinued to be affected by low reliability in critical equip-ment, and we have implemented a powerful programme that will have full impact in 2018. Exploration work in the Outokumpu field has not yielded desired results, but we will continue working in this geologically interesting area and our ambitions remain high. Smelters enjoys good profitability, but at the same time, are suffering from too many production disruptions.
Acquisitions, projects and explorationKevitsa and Harjavalta are a strong combination, not just when it comes to nickel, but for copper and precious metals too. The acquisition enables Boliden to make use of its expertise in grinding and mining in cold climates and to optimise the delivery chain from mining to metal production. The investment also strengthens Boliden’s position in Finland, which we now regard as Boliden’s second home. Operations at Odda saw an in-creased focus on core operations through the sale of the aluminium fluoride unit. Odda is also approaching the end of the expansion project, P200, that will see capacity increase from 170,000 to 200,000 tonnes per year.
Boliden’s exploration has been successful. The big-gest success in 2016 was the increase in Garpenberg’s Mineral Reserves that doubles the reserve’s lifespan to almost 30 years. Our traditional exploration methods in larger areas were unsuccessful in the vicinity of the Tara mine in Ireland, why we tried using seismology, which is commonly used in oil exploration work. The technique produced initial indications in 2012 and subsequent drilling has successfully identified 10 Mtonnes of Mineral Resources. Our knowledge of the mineralisation is still at the lowest level, but we are enthusiastic about its potential.
SustainabilityA strong Balance Sheet and competitiveness, coupled with a long-term approach, produce the economic sustainability that enables us to take responsibility for our employees, the environment, and society. Our op-erations entail exposure to risk, and Boliden therefor works intensively on a shared safety culture based on the conviction that all accidents can be prevented.
2016 – a challenging start and a strong finish
SEK 5.1 billion (4.0) – 2016 operating profit, excluding revaluation of pro-cess inventory
5.1
4 | Boliden Annual Report 2016
PRESIDENT’S STATEMENT

As part of our efforts to develop this culture, we fo-cus on participation and involvement by all employees – an approach that is yielding results in the majority of units. In 2016, for example, Boliden’s mines reported their lowest ever accident frequency, but there is still room for improvement. Concerns are sometimes expressed that mines and smelters have a negative environmental impact, but I would like to stress the positive effects. The majority of Boliden’s products are needed in a sustainable society. Renewable energy sources increase society’s need for copper, first and foremost, but also for zinc. Supporters of wind and solar power should, therefore, be equally supportive of both copper mines and smelters. Systems for fluctuat-ing, renewable energy require substantial expansions of the electricity transmission grid, and this requires large amounts of copper. One of the biggest challenges faced by renewable energy is, furthermore, how to store energy in order to handle electricity consump-tion that are equally variable. Interest in batteries of all types is growing – and hence in nickel and lead, which are critical components of batteries. Tellurium, platinum and palladium are used in solar cells and in the catalysers and are also vital to environmental improvements.
Boliden’s contribution to sustainable development not only takes the form of the metals used in energy systems and infrastructure, but of the way in which we share experience in environmental technology. Boliden, along with other world-leading companies, has been responsible for many technological advanc-es and we encourage suppliers and partners to use Boliden’s facilities as references when selling envi-ronmental technology all over the world. The global leverage effect of our environmental improvements is, therefore, considerable, and makes a real contribution to positive environmental effects.
Advanced deep storage facilities are another area where Boliden is to the fore. We have had an under-ground storage facility for waste products at Odda for many years now, and are currently building a similar one at Rönnskär for waste products from copper pro-duction. Underground storage facilities are expensive and it is consequently vital that we continue to process
products in order both to maximise the amount of materials extracted for a variety of applications and to minimise the amount of waste that needs to be stored. This approach creates circular flows and minimizes society’s resource usage.
There is considerable public support for mines and smelters and we work hard to act as role models in the field of sustainability. We welcome the stringent de-mands made on our operations, and see our impact on air, soil and water as an ongoing challenge. This is why we set our own priorities that define how we achieve the maximum environmental effect from investments. Official requirements sometimes yield only minor environmental improvement relative to the investment, resulting in a waste of resources that is contrary to our sustainability ethos. Boliden will, therefore, continue to work to influence society to create predictable regu-lations and efficient licensing processes that ensure a sustainable and competitive industry in the countries in which we operate.
InnovationTechnological development and digitalization boost Boliden’s productivity and we have developed a dynamic and highly innovative organisation. We are working with start-up innovation companies and several of Sweden’s biggest companies to develop new solutions that not only strengthen us, but can also contribute to these companies’ success. Volvo unveiled fully autonomous trucks in underground traffic to the world press at the Kristineberg mine and Ericsson is developing 5G in partnership with Boliden in the Kankberg mine. Another example of this approach is the start-up company, Mobilaris, which develops posi-tioning systems for places where GPS does not work – a system developed in partnership with, amongst others, Boliden. Long-term partners such as Atlas Copco, Sandvik and ABB have also contributed to this technological development, and ABB uses Boliden as a leading reference for its digitalisation work.
Ongoing development to boost competitivenessBoliden is undergoing a major cultural change with technology, productivity, and safety in focus. Dele-gation, clear leadership, and the great commitment shown by all of our employees mean that we now enjoy a leading position in several areas. Our development will continue, taking our values as its beacon, in order to ensure that we continue to be an industry leader when it comes to development, productivity and responsibility. It is with great pride that I can say that despite the weak market at the beginning of the year, Boliden has posted one of its strongest years ever.
Lennart EvrellPresident & CEO
Our develop-ment will continue, taking our values as its lodestar, in order to ensure that we continue to be an industry leader when it comes to development, productivity and responsibility.
Introduction Market Operations Corporate governance Financial reports
Boliden Annual Report 2016 | 5
PRESIDENT’S STATEMENT

Metals for modern life
We focus on sustainable metal production and our vision is to be one of the leading companies in the industry in terms of development, productivity and responsibility.
Passion for improvementsWe work systematically with continuous development of our products, processes and relationships.
Value chain responsibilityEvery employee is responsible for the ongoing improvement and standardisation of methodologies in their links in the value chain.
Personal commitmentOur employees are encouraged to take responsibility and to exceed the demands and expectations placed on us.
By providing, refining, and recycling the base and precious metals that society needs, Boliden acts as an important component of the circu-lar economy. We work to ensure optimum resource and materials processing at every stage of the val-ue chain and strive to ensure sus-tainable development in the fields of safety, environmental performance and business ethics.
V A L U E SB U S I N E S S C O N C E P TV I S I O N
6 | Boliden Annual Report 2016

Develop stable and efficient operations based on strong responsibility
Boliden works continuously to improve productivity by means of, amongst other things, stable processes and a focus on a strong safety culture. The expansion of Odda to an annual production capacity of 200 ktonnes of zinc has, for example, continued during the year, and a decision was taken to invest in a new crusher station at the Aitik mine in order to improve availability.
Invest in competitiveness and organic growth
Boliden invests substantial resourc-es in both exploration and expan-sion investments at existing mines and smelters. Garpenberg achieved a milled volume of 2.6 Mtonnes this year, exceeding the goal of the expansion project. Large parts of Garpenberg’s Mineral Resources have, furthermore, been upgraded to Mineral Reserves, and a new inferred mineral resource was announced at Tara, extending the mine’s lifespan.
Acquire projects and producing operations
Boliden is constantly evaluating potential acquisition objects in terms both of operational mines and new mine projects. 2016 saw the acquisition of the Finnish copper-nickel mine, Kevitsa, which offers substantial synergies with Boliden’s operations. Kevitsa also ensures a stable nickel supply for the Harjavalta smelter.
S T R A T E G Y
Metals such as copper, nickel and zinc are used in buildings, energy systems, and many other settings in modern society. There are extensive opportunities for metal recycling, and demand is increasing, not least in developing economies.
1 2 3
Boliden Annual Report 2016 | 7

Targets that drive development
AccidentsBoliden shall have zero accidents resulting in absence from work (LTI) per month at all units by 2018
Net debt/equity ratioThe net debt/equity ratio in an economic upturn shall be no higher than 20%
Sick leaveThe sick leave rate shall not exceed 3.0% by 2018
DividendThe dividend shall correspond to one third of the net profit
Gender equalityWomen shall comprise at least 20% of the workforce by 2018
The return on capital employed totalled 15% (10). The average per annum return during the period from 2012 to 2016 has been 10%. Any investments made shall demonstrate a high return and shall be made in line with both Boliden’s strategy and available returns. The projects’ in-ternal interest rates shall be higher than Boliden’s weighted capital cost (WACC), adjusted for a risk premium.1)
1) The WACC before tax is currently nominally set at 12%, which corresponds to 10% in real terms. Calculations for major and long-term projects are normally conducted in real terms. They are based on forecast interest rates, metal prices, exchange rates, inflation and other relevant assumptions drawn from internal analyses and external assessments.
The number of accidents leading to absence from work (LTI) decreased in 2016 from 8.9 to 7.9 per million hours worked. The proactive safety work has intensified during the year. The accident fre-quency has also decreased substantially amongst Boliden’s contractors.
The net debt/equity ratio at the end of 2016 was 32% (23). The increase since 2015 was due to the acquisition of Kevitsa.
The sick leave rate decreased from 4.6% to4.4% in 2016. The focus has been on increasingmanagers’ involvement in the prevention andrehabilitation of ill health during the year.
The proposed dividend is SEK 5.25 (3.25) per share, corresponding to 33.9% (33.7) of the net profit for the year. The dividend share during the period from 2012 to 2016 was 33.8% of the aggregate net profit for the period.
The number of female Boliden employees (FTE)was 976 (867), resulting in an unchanged shareof 17.8% (17.8) of employees. Women accountedfor 17% (22) of new recruits during the year.
Financial targets
Social targets by 2018
Return on investmentsThe return on investments shall be a minimum of 10% (NPV)
SEK m
0
10,000
20,000
30,000
40,000
12 13 14 15 160
5
10
15
20%
●Capital employed
Return on capital employed
Target
SEK/Share
0
1
2
3
4
5
6
12 13 14 15 16
%
0
10
20
30
40
50
60
●Dividend
Dividend share
Target
●Net debt
Net debt/equity ratio
Target
12 13 14 15 16
SEK m
0
2,000
4,000
6,000
8,000
10,000
0
10
20
30
40
50%
●LTI frequency including contractors
● LTI frequency for Boliden’s own personnel
● Target for 2018
LTI frequency
0
2
4
6
8
10
12 13 14 15 16 18
Target
●Sick leave
● Target for 2018
%
0
1
2
3
4
5
12 13 14 15 16 18
Target
●Percentage of female employees
● Target for 2018
%
0
4
8
12
16
20
12 13 14 15 16 18
Target
● ● ●
8 | Boliden Annual Report 2016
TARGET FULFILMENT

Metal discharges to waterDischarges of metals to water shall decrease by 25% between 2012 and 2018
Carbon dioxide emissionsThe carbon dioxide intensity shall not exceed 0.77 tonnes of CO2 per tonne of metal produced by 2018
Sulphur dioxide emissionsSulphur dioxide emissions to air shall decrease by 10% between 2012 and 2018
Environmental incidentsBoliden’s target for 2018 is zero environmental incidents per month
Metal emissions to airEmissions of metals to air shall decrease by 10% between 2012 and 2018
The environmental impact from discharges ofmetals to water (metal equivalents) has declinedby 40% since the base year of 2012. The discharges of metals with high toxicity (mercury, cadmium and arsenic) decreased in 2016. Rönn-skär’s new water treatment plant enables reduceddischarges of metals, e.g. zinc and lead.
The carbon dioxide intensity has increased from0.65 to 0.69 as a result of Kevitsa beingintegrated in the Boliden Group. The increase isdue to production, including concentration, beingmore energy-intensive in an open pit mine and toindirect carbon dioxide emissions being higherfor Finnish electricity production than for theaverage of Boliden’s other units.
Emissions of sulphur dioxide to air have declinedby 14% in comparison with the base year of2012. The year on year decrease is mainly dueto Boliden’s investment in a new converter at theKokkola smelter.
The number of environmental incidents hasincreased to 1.4 (1.2) per month. 17 (14) environ-mental incidents occurred in 2016. Nine of theevents involved discharges to water, five involvedprohibited air pollution, and two involved wastehandling. None of the above incidents are adjudgedto have caused lasting damage or significantenvironmental impact. One incident involved aviolation of the Cultural Environment Act. See GRI appendix for further information.
The environmental impact from emissions ofmetals (metal equivalents) to air has increasedby 9% since the base year of 2012. Emissions ofcopper, mercury and cadmium have decreased,while emissions of lead increased during the year.
Environmental targets for 2018
●Me-eq
● Target for 2018
tonnes Me-eq
0
5
10
15
20
25
12 13 14 15 16 18
Target
●Me-eq
● Target for 2018
tonnes Me-eq
0
25
50
75
100
125
12 13 14 15 16 18
Target
●Carbon dioxide intensity
● Target for 2018
tonnes CO2/tonne metal
0.0
0.2
0.4
0.6
0.8
1.0
12 13 14 15 16 18
Target
●Emissions of sulphur dioxide to air
● Target for 2018
tonnes
0
2,000
4,000
6,000
8,000
10,000
12 13 14 15 16 18
Target
●Environmental incidents per month
● Target for 2018
number/month
0.0
0.25
0.50
0.75
1.00
1.25
1.50
12 13 14 15 16 18
Target
Find out more at www.reports.boliden.com
Boliden has a vision of zero environ-mental accidents or incidents. The environmental permits held by Boliden’s units vary somewhat, but if any of the permits’ limit values are exceeded, a report is submitted to the relevant authorities. Reported environmental in-cidents indicate an event that requires attention, irrespective of whether any damage has been caused to the environment.Boliden has changed the title of the key performanceindicator in 2016, from environmentalaccidents to environmental incidents, because the majority of the incidents do not result in any significant environ-mental impact. Reducing the number of environmental incidents demands efficient systems at every stage of the value chain, but also requires a focused way of working with routines, risk assessments, action plans andadvanced technology.
Group-wide targets have been set in line with Boliden’s strategy, with the aim of creating long-term value for its shareholders. This depend on eco-nomic, social and environmental sustainability. Technical innovation that enables high levels of profitability, safe workplaces, and a good environ-mental performance are important factors for success.
Introduction Market Operations Corporate governance Financial reports
Boliden Annual Report 2016 | 9
TARGET FULFILMENT

Boliden creates stable and long-term value for its shareholders, employees, customers, suppliers and local communities. By providing resources and the efficient refining of the base and precious metals that society needs, and which are recycled after use, Boliden is an important component of the circular economy.
1) Excluding acquisitions: Kevitsa 2016 (SEK 5,961 m).2) Mineral Resources include measured and indicated resources, while Mineral Reserves include proven and probable reserves.
For full details of Boliden’s Mineral Reserves and Resources, see pages 105–109.
How we create value
Operations• 6 mining areas• 5 smelters
Intellectual capital• Patents, e.g. for electronic recycling,
exploration techniques, automation• Exploration rights• Environmental permits• Reclamation expertise• The New Boliden Way philosophy• R&D partnerships with universities, colleges, and suppliers
Human capital• Number of employees [FTE]: 5,477 (4,878) • Contractors• Partners
Social/Relationship capital• Cooperation and dialogues with prioritised stakeholder groups• Long-term development partnerships with business partners• Involvement in industry organisations
Input Business model
Zn
Cu
3–7%
0.2–1.6%
Metal grade
Zn
Cu
55%
25%
Metal grade
Exploration Mining Concentration
Natural resources
2016 2015
Mineral Resources2), Mtonnes 2,260 2,177
Mineral Reserves2), Mtonnes 1,450 1,312
Forests and land, ha 22,600 20,900
Energy, TWh 6.2 5.6
Water, Mm3 140 150
Mined concentrate feed (primary feed), ktonnes 2,372 2,357
Recycled materials (secondary feed), ktonnes 299 297
2016 2015
Investments1), SEK m 4,127 3,650
Capital employed, SEK m 42,457 35,131
Net debt/equity ratio, % 32 23
) page 45
Environmental impact of mines
2016 2015
Waste rock, Mtonnes 52 32
Tailings, Mtonnes 47 42
Emissions to air:
CO², ktonnes 313 227
Discharges to water:
Metals, tonnes, Me-eq 2.1 2.5
Nitrogen, tonnes 256 216
Waste:
Non-hazardous, ktonnes 12 11
Hazardous, ktonnes 4 4
Financial capital
10 | Boliden Annual Report 2016
VALUE CREATION

The model is based on the framework issued by the International Integrated Reporting Council (IIRC). The primary purpose of the model is to explain how the Group creates long-term value.
1) Refers to metals in concentrate.2) Included as of 1 June 2016.3) Included as of 1 July 2015.4) For further information and explanations, see the separate GRI report (section EC1).
Metals can be found virtually everywhere in society – in buildings, in vehicles, in power stations, in electronic products, and in tele- and data communication systems. Demand for two of Boliden’s most important metals – zinc and copper – has doubled in the last 25 years as more and more developing countries progress towards a high standard of living.
Economic effects4) (SEK m)• Purchases: 30,340 (33,304)• Salaries paid to employees: 3,925 (3,480)• Dividend paid to shareholders: 1,436 (889)• Interest paid to lenders: 311 (238)• Taxes and charges: 1,135 (715)• Retained within Boliden: 1,688 (1,677)
Social effects• Direct and indirect job opportunities in Swe-
den, Finland, Norway and Ireland: 25,300• Involvement and value creation in local
communities • Functioning social structure • Increased diversity and gender equality• Involvement in upper secondary school
and higher education • Geographical barriers that disrupt
reindeer herding • Frequency of occupational accidents leading
to absence from work (LTI): 7.9 (8.9)• Sick leave from work: 4.4% (4.6)
Result
Zn
Cu
55%
25%
Metal grade
Zn
Cu
Metal grade
99.995%
99.9975%
Feed Metal productionSales
External concentrate suppliers
The use of metals in society
Industrial production
Collection and recycling of metals
Products
Production, Mines1) 2016 2015
Zinc, ktonnes 329 299
Copper, ktonnes 103 85
Lead, ktonnes 63 62
Nickel2), ktonnes 7 –
Gold, kg 5,766 4,922
Silver, kg 446,826 418,489
Tellurium, kg 38,680 33,000
Production, Smelters 2016 2015
Zinc, ktonnes 461 469
Copper, ktonnes 336 332
Lead and lead alloys, ktonnes 74 71
Nickel in matte3), ktonnes 31 17
Gold, kg 17,638 17,608
Silver, kg 609,151 664,521
Aluminium fluoride, ktonnes 32 31
Sulphuric acid, ktonnes 1,642 1,665
) page 45
Environmental impact of smelters
2016 2015
Emissions to air:
Metals, tonnes, Me-eq 100 88
SO², ktonnes 7 7
CO², ktonnes 685 662
Discharges to water:
Metals, tonnes, Me-eq 11 15
Nitrogen, tonnes 44 45
Waste:
Non-hazardous, ktonnes 240 228
Hazardous, ktonnes 822 821
Introduction Market Operations Corporate governance Financial reports
Boliden Annual Report 2016 | 11
VALUE CREATION

Metal prices rose during the year and exchange rate trends were favourable. Zinc prices rose to high levels, and the price of copper increased, but was held back by increases in supply. High stock levels held back nickel prices, healthy demand notwithstanding.
Favourable price trend for base metals
Market trends, 2016Global demand for zinc, copper and nickel rose and growth levels were higher than in 2015. Copper supply exceeded demand, holding back the price of copper until the beginning of the fourth quarter. Supply from the world’s zinc mines was limited by temporary closures, by the closure of large mines in 2015, and by the fall in smelter production, all of which resulted in the price of zinc rising steeply from low levels.
Global demand for nickel increased when Chinese production, in particular, of stainless steel picked up speed at the same time as the availability of nickel in China was limited, global production capacity underwent temporary shutdowns, and the availability of nickel in scrap fell from the previous year’s levels. The shortage of metal notwithstanding, the price of nickel was low due to stocks of nickel remaining high.
Global
14,600
Developing countries
5,000
USA
52,100
Mature economies
42,900
EU
33,600
China
14,000
All values have been rounded off in USD (PPP) constant prices. Source: Oxford Economics
Precious metal prices rose until the middle of the year and then fell in response to a stronger dollar and market sentiment.
Global economic growthThe demand for metals grows most rapidly in coun-tries where the GDP per capita rises in the interval from USD 5,000 to USD 15,000 as societies develop from agricultural to industrial economies. A large proportion of the world’s population still have per capita GDPs of less than USD 5,000 and hence offer potential for high levels of metal demand long into the future. Mature economies still account for a signif-icant percentage of global metal demand, but growth in these economies is low. Mature economies’ metal demand can also be more easily met by recycled metal than is the case in developing countries.
GDP/capita 2016
INVESTMENTS IN INFRASTRUCTURE
URBANISATION
INDUSTRIAL ACTIVITY LEVELS
POPULATION GROWTH
ECONOMIC GROWTH IN DEVELOPING
COUNTRIES
AUTOMOTIVE MARKET TRENDS
Driving forces
INCREASED PRO-SPERITY IN EMER-GING ECONOMIES
Factors that drive demand for metals
and which con-sequently impact
pricing
Find out more about price trends in 2016 ) page 16–19
12 | Boliden Annual Report 2016
MARKET TRENDS

Economic trendsAll mines have a limited lifespan and supply declines if new mines are not brought on line. Justifying investments in new mines requires assumptions that future prices will be sufficiently high to ensure project profitability. When metal prices are low, high cost mines are mothballed or closed permanently.
Several copper smelters have been built in the past ten years, particularly in China, and as a result overcapacity has arisen and treatment charges were consequently low for an extended period of time. Treatment charges did, however, improve a few years ago when numerous copper mines were opened and others expanded, since when copper mines and smelt-ers have posted reduced and increased profitability,
Demand for Boliden’s main metals is primarily driven by global industrial activity levels, and by trends in infrastructure, the construction market (construction market investments), and the automotive market.
SUBSIDIARY MARKET GLOBAL CHINA USA EUROPE
Industrial activity levels
Declining growth rate
Growth rate unchanged
Declining growth rate
Declining growth rate
The construction sector’s investments
Growth rate unchanged
High but declining
growth rate
Declining growth rate
Rising from low level
Automotive production
Higher growth rate
Higher and very strong growth rate
Declining growth rate
Lower but good growth rate
Development in subsidiary markets, 2016
Global
3.1 %
Developing countries
4.1 %
USA
1.6 %
Mature economies
1.6 %
EU
1.9 %
China
6.7 %
Source: The International Monetary Fund
Growth in GDP, 2016
respectively. Zinc smelters have expanded rapidly in China, but there have been few mining projects, other than expansions of existing mines. The market has fluctuated between a surplus and a shortage of metal and concentrate in recent years, and treatment charges have varied. Large zinc mines were permanently closed down in 2015, and a number have also made temporary cuts in production. A number of mining projects are scheduled to start in a few years’ time, but the net contribution to mine capacity will be limited.
There has been substantial investment in nickel mines and smelters in recent years and there has been a surplus of metal. Demand rose in 2016, and there was a shortage of metal, but the metal’s stock levels are overly high and prices are, as a result, being held back.
MetalsCopper, zinc and lead prices are set daily on the London Metal Exchange (LME). Premiums, which comprise sur-charges whose levels are determined by the local balance between metal demand and smelter capacity, are normally added to the price, along with shipping costs and payment terms. Gold and silver prices are similarly set by the London Bullion Market Association (LBMA).
ConcentratesThe price of concentrate is the LME-price minus the so-called treatment charge (TC), and is calculated on that part of the concentrate’s metal content that is of a payable level, which is specified in the form of terms between the mines and the smelters. The metals that the smelters can extract, over and above the payable level, are called free metals. The balance between the supply of concentrates from the world’s mines and the smelters’ demand for mined concentrates deter-mines the prices and terms between mines and smelters.
A B O U T P R I C I N G
Introduction Market Operations Corporate Governance Financial reports
Boliden Annual Report 2016 | 13
MARKET TRENDS

Boliden is one of the world’s biggest zinc mining and smelt-ing companies and a smaller player in copper, but has successfully built up a position in nickel in a short space of time. Boliden also enjoys a market-leading position in the field of electronic scrap recycling and is a prominent player in the European lead recycling sector.
Market position
Mining companies − zincBoliden is the fifth largest zinc mining company in the world. Tara and Garpenberg are both large zinc mines by international standards. The Garpenberg and Boliden Area mines in Sweden receive revenues from a number of other metals, such as silver, gold, lead, and copper, while Tara in Ireland receives limited revenues from by-product metals.
0 500 1,000 1,500 2,000Boliden
ValeFirst Quantum Minerals
Antofagasta plcRio Tinto
KGHM Polska MiedzSouthern Copper (ex SPCC)
BHP BillitonGlencore
Freeport-McMoRanCodelco
ktonnes metal, 2016
The ten largest copper mining operators
SOURCE: WOOD MACKENZIE, DEC. 2016
0 200 400 600 800 1,000 1,200Boliden
Mitsubishi MaterialsKGHM Polska MiedzFreeport-McMoRan
Sumitomo Metal MiningJX Holdings
AurubisTonglingCodelco
GlencoreJiangxi Copper Company
The ten largest copper smelting operators
ktonnes metal, 2016
0 300 600 900 1,200 1,500Yuguang Gold and Lead Co
TeckHuludao Zinc
Shaanxi Nonferrous MetalsBoliden
VotorantimHindustan Zinc
GlencoreNyrstar
Korea Zinc Group
The ten largest zinc smelting operators
ktonnes metal, 2016
Mining and smelting companies – nickelBoliden has been producing nickel for many years in partnership with one of the world’s biggest nickel companies. This partnership was wound up in 2015 and Boliden has built up its own network of concentrate suppliers and custom-ers for Boliden’s nickel product, which is known as nickel matte. The purchase of the Kevitsa mine in Finland means that Boliden now has the same structure for nickel as for copper and zinc – an integrated business model including both mines and smelters and where our own mines account for a substantial share of the concentrate requirement.
Mining companies − copperBoliden is a minor operator in the global copper mining industry, but a significant one in Europe. The Aitik mine is a large mine with low grades, world-leading productivity and additional revenues from gold and silver. The Kylylahti mine is a small mine with high grades. Kevitsa is a mine with good productivity and where the primary metals are nickel and copper.
Smelting companies − zincBoliden is the sixth largest zinc smelting company in the world. The Kokkola smelter is a major zinc producer, while the Odda smelter will, after completion of the ongoing expansion project, be a medium-sized producer.
Smelting companies − copperThe Rönnskär smelter is a major copper producer and a world leader in electronic scrap recycling. The Harjavalta smelter is a minor copper smelter by western European standards, but is the largest nickel smelter in the region.
Mining and smelting companies − leadBoliden is a significant global mining company when it comes to lead and a medium-sized smelting company for primary lead. The Bergsöe smelter also gives Boliden a significant position in the European lead recycling sector.
0 200 400 600 800 1,000Western Mining Company
Industrias PenolesChina State Enterprise
SumitomoMinera Volcan
BolidenVotorantim
Hindustan ZincTeck
Glencore
ktonnes metal, 2016
The ten largest zinc mining operators
14 | Boliden Annual Report 2016
MARKET POSITION

Metals are traded and priced on global exchanges. Competitive costs and sustainable processes are critical to long-term success in that the metals are largely produced and traded in their pure forms without distinguishing properties.
Competitiveness
Unlike pure metals, mined concentrates are not traded on exchanges, but are priced by leading operators who announce their terms in the form of annual contracts known as benchmark contracts. The competitiveness of mines – the cost per tonne of metal – is well-known to the market’s operators due to the information on cost levels, known as cash cost, regularly compiled by independent analysis companies. Strongly competitive
mines often have high grades, substantial revenues from by-product metals, advantageous infrastructure, and low costs. Smelters’ competitiveness is usually compared using the cash margin metric, which is a more compara-ble metric, in that smelters extract multiple metals and by-products. Smelters’ competitiveness depends on cost levels, stable processes, and the extraction of metals and by-products in addition to their primary metal.
SO
UR
CE:
WO
OD
MA
CK
ENZIE
, JA
N. 2
01
7SO
UR
CE:
WO
OD
MA
CK
ENZIE
, JA
N. 2
01
7
The graphs are based on estimates and assumptions by the analysis company, Wood Mackenzie, and may differ from Boliden’s own cash cost per mine data due to differences in the underlying data. There are a number of different definitions of cash cost: composite costing is used in Mine’s graph, whereby mines are reported using either pro rata or normal costing. Pro rata costing divides the costs between the different metals, while normal costing reduces the costs by the net revenues from by-metals.
Cash cost in the mining industry Cash margin for smelters
0
30
60
90
150
120
%
US Cents/lb
0 10025 50 75
Percentage of the industry’s production of zinc metal in concentrate, %
Zinc – cash cost C1 composite costing Zinc – cash margin for smelters
Percentage of the industry’s production of zinc metal, %
0
10
20
40
60
70
0 100%
US Cents/lb
25 50 75
50
30
0
100
400
300
200
%250 50 75 100
US Cents/lb
Copper – cash cost C1 composite costing
Percentage of the industry’s production of copper metal in concentrate, %
Copper – cash margin for smelters
Percentage of the industry’s production of copper metal, %
0
10
20
30
40
50
60
%0 100
US Cents/lb
25 50 75
Garpenberg and the Boliden Area have substantial revenues from several metals and cast costs are calculated using pro rata costing. Tara calculates cash costs using normal costing. According to Wood Mackenzie, Garpenberg’s productivity is amongst the best in the world and Tara’s productivity is high.
Kokkola and Odda are at the centre of the cash margin curve for the world’s zinc smelters.
Aitik has a low cash cost as a result of having the world’s highest productivity. Kylylahti’s cash cost, as shown in the graph, is based on Boliden’s own calcu-lations. Kevitsa is a nickel and copper mine with subsidiary metals. Kevitsa is located in the better half of the industry’s cost curve for nickel, and Boliden’s own calculations show that Kevitsa is close to the 70th percentile on the cash cost curve for copper mines.
Rönnskär has a substantial supply of recycling materials. Harjavalta has substantial revenues from nickel.
For concept definitions ) page 117
Aitik Boliden areaKylylahti Rönnskär Harjavalta
Garpenberg TaraBoliden area Odda Kokkola
Introduction Market Operations Corporate Governance Financial reports
Boliden Annual Report 2016 | 15
MARKET POSITION

The zinc market, 2016
Global demand
MTONNES (+2.3%)Demand increased in China by just over 3% and accounted for approximately 47% (47) of global demand. Demand increased in the rest of the world by approximately 1.5%. Demand exceeded metal production.
Average price
USD/TONNE (+9 %) The price had fallen to cash cost level for high-cost mines at the beginning of the year, at around USD 1,500 per tonne, but began to rise during the spring, and by the end of the year, had risen to USD 2,558 (1,600) per tonne, corresponding to an increase of approximately 60% since the beginning of the year.
Spot metal premiums in Europe
USD/TONNE (–4 %)European metal premiums fell slightly dur-ing the year, and according to the analysis company, CRU, European zinc premiums fell by an average of 4%, year on year. Metal availability in Europe was good during the year, despite early signs of a global short-age of mined concentrate.
Realised contract treatment charges (TC)
USD/TONNE OF CONCENTRATE (-12 %) Contract treatment charges fell, year on year, and treatment charges including price sharing of metal price changes were, on av-erage, around 12% lower. Spot treatment charges for concentrate imported to China began to fall already in late 2015 and fell further in 2016 to a low level.
In weaker economic markets, metal prices have often reached a low point when they equate to the cash cost level for high-cost mines. The price of zinc has, on occasional trading days under challenging econom-ic conditions, fallen towards the 60th percentile, where 40% of production has a negative cash flow. As a yearly average,
Global mined production
MTONNES (–6.9%) Mined production of zinc in concentrate fell sharply from last year due to the permanent and temporary closure of large mines in 2015. Production in China increased by just under 4%, but fell in all other regions with the exception of Africa. Production fell by 45% in Australia due to the closure of a large mine.
Global smelter production
MTONNES (-2.2%) Production in China increased by 1% and the Chinese smelters’ terms deteriorated continuously throughout the year. China’s share of global production increased to 45% (43). Production elsewhere in the world fell by approximately 4%. Smelter production fell short of metal demand.
11.6
2,095
136
21713.4
Price and global demand
Cash cost and price
Treatment charges (TC)
Spot metal premiums in Europe
zinc prices in a weak economic climate have been close to the 90th percentile. The USD strengthened against several other currencies in 2016, resulting in local costs measured in USD falling, and the cash cost in the 90th percentile is estimated to have fallen to around USD 1,600 (1,670) per tonne.
0
4,000
8,000
12,000
16,000
0
1,000
2,000
3,000
4,000
ktonnes of metal
07 08 09 10 11 12 13 14 15 16
USD/tonne
0
100
200
300
400
USD/tonne of metal
07 08 09 10 11 12 13 14 15 16
0
50
100
150
200
250
350
300
USD/tonne of concentrate
07 08 09 10 11 12 13 14 15 16
0
1,000
2,000
3,000
4,000
5,000
USD/tonne
07 08 09 10 11 12 13 1514 16
13.6
SO
UR
CE:
CR
U J
AN
. 2
01
7SO
UR
CE:
CR
U J
AN
. 2
01
7
SO
UR
CE:
CR
U J
AN
. 2
01
7SO
UR
CE:
WO
OD
MA
CK
ENZIE
, R
EUTER
S J
AN
20
17 Cash cost, zinc
Global demand Price
Spot price in Europe
Realised treatment charge
50th percentile Minimum price
75th percentile
Average price
90th percentile
Maximum price
16 | Boliden Annual Report 2016
PRICE TRENDS

The copper market, 2016
Global Demand Price
Spot price in Europe
Contract Treatment Charge
Global demand
MTONNES (+2,2 %)Demand in China increased by approximate-ly 4.5% and accounted for 48% (47) of global demand. Demand elsewhere in the world remained unchanged. Demand fell in several mature economies, but increased in Europe by around 1%. Demand fell slightly short of metal production.
Average price
USD/TONNE (–12%)The price was low and falling for the majority of the year, but rose during the fourth quar-ter in conjunction with news of disruptions to mined production and strong signals of demand in China. The price at the end of the year was USD 5,523 (4,702) per tonne, corresponding to a rise of 17% since the end of 2015.
Spot metal premiums in Europe
USD/TONNE (+3%)Metal supply in Europe continued to be good and spot premiums remained low.
Contract treatment charges (TC)
USD/TONNE OF CONCENTRATE (-9 %) Contract treatment charges fell but remained historically high. Supply from mines slightly exceeded expectations and spot treatment charges remained high until the end of the year when mine disruptions increased, after which they fell.
Global mined production (concentrate)
MTONNES (+5.7%) Production in South America increased by approximately 9%. Production also increased elsewhere in the world with the exception of Africa, where mines have been temporarily closed due to the low price of copper. Disruptions for the year as a whole were less extensive than in recent years, but increased in the fourth quarter.
Global smelter production
MTONNE (+1,9 %) Smelter production in China increased by around 8% and corresponded to 35% (33) of global production. Production in the rest of the world fell by approximately 1%. Pro-duction slightly exceeded metal demand.
4,863
15.9
22.6
45
97.35
In weaker economic markets, metal prices have often reached a low point when they equate to the cash cost level for high-cost mines. The price of copper has, in isolated instances, fallen towards the 80th percen-tile, where 20% of production has a negative cash flow. As a yearly average, copper prices
in a weak economic climate have been above the 90th percentile. The USD strengthened against several other currencies in 2016, resulting in local costs measured in USD fall-ing, and the cash cost in the 90th percentile is estimated to have fallen to around USD 4,100 (4,490) per tonne.
Price and global demand
Global smelter production
Spot, metallpremie i Europa
0
5,000
10,000
15,000
20,000
25,000
0
2,000
4,000
6,000
8,000
10,000
ktonnes of metall
07 08 09 10 11 12 13 14 15 16
USD/tonne
0
50
100
150
USD/tonnes of metal
07 08 09 10 11 12 13 14 15 16
0
20
40
60
80
100
120
07 08 09 10 11 12 13 14 15 16
USD/tonne of concentrate
22.2
Cash cost and price
0
2,000
4,000
6,000
8,000
10,000
12,000
USD/tonne
07 08 09 10 11 12 13 14 15 16
SO
UR
CE:
CR
U J
AN
. 2
01
7SO
UR
CE:
CR
U J
AN
. 2
01
7SO
UR
CE:
CR
U J
AN
. 2
01
7SO
UR
CE:
WO
OD
MA
CK
ENZIE
, R
EUTER
S, JA
N. 2
01
7 Cash cost, copper
50th percentile Minimum price
75th percentile
Average price
90th percentile
Maximum price
Introduction Market Operations Corporate Governance Financial reports
Boliden Annual Report 2016 | 17
PRICE TRENDS

The nickel market, 2016
Global Demand Price
Global demand
MTONNE (+6,9%)Global demand for nickel rose by around 7% when production of stainless steel increased sharply in China and secondary nickel supplies fell from last year’s levels. Nickel demand rose by around 10% in China and by approximately 4% in the rest of the world.
Average price
USD/TONNES (–19%)The price remained low throughout the year, pressured by high stock levels, but did rise slightly in the latter half of the year. The price at the end of the year was USD 9,964 (8,780) per tonne, corresponding to a 13% increase on the price at the end of 2015.
Global mined production
MTONNES (0%) Mined production remained unchanged, year on year. Mining capacity experienced temporary closures due to the low price of nickel and poor profitability.
Global smelter production
MTONNE (0 %) Smelter production remained unchanged, year on year. Production fell by around 3% in China, but increased in the rest of the world by approximately 1%. There was a shortage of metal for the first time since 2011, but there were large stocks of nickel in the marketplace.
9,609
2.0 1.9
In weaker economic markets, metal prices have often reached a low point when they equate to the cash cost level for high-cost producers. The price of nickel has seldom fallen below the cash cost in the 75th per-centile, but high stock levels have pushed the price of nickel even lower in 2016. The
USD strengthened against several other currencies in 2016, resulting in local costs measured in USD falling, and the cash cost in the 75th percentile is estimated to have fallen to around USD 10,100 (12,300) per tonne. In the 90th percentile, the cash cost was USD 11,900 (15,000) per tonne.
Price and global demand
0
500
1,000
1,500
2,000
2,500
0
8,000
16,000
24,000
32,000
40,000
ktonnes of metall
07 08 09 10 11 12 13 14 15 16
USD/tonne 2.0
Cash cost and price
USD/tonne
07 08 09 10 11 12 13 1514 160
10,000
20,000
30,000
40,000
50,000
60,000
SO
UR
CE:
CR
U J
AN
. 2
01
7SO
UR
CE:
WO
OD
MA
CK
ENZIE
, R
EUTER
S, JA
N. 2
01
7 Cash cost, nickel
The lead market, 2016
Average price Lead
Global demand for lead totalled 11.5 Mtonnes, corresponding to an increase of some 3% in 2016. Demand for batteries for the new vehicle market increased more rapidly than demand for the replace-ment market. Lead demand in China increased by approximately 2%, year on year. Production was on a par with metal demand.
LEAD USD/TONNE (+5 %)
1, 872
SO
UR
CE:
REU
TER
S, JA
N. 2
01
7
0500
1,0001,5002,0002,5003,0003,5004,000
USD/tonne
07 08 09 10 11 12 13 14 15 16
Lead price
Lead price
50th percentile Minimum price
75th percentile
Average price
90th percentile
Maximum price
18 | Boliden Annual Report 2016
PRICE TRENDS

Average price
Average price Sulphuric acid
Gold and silver
Gold and silver prices are controlled by expectations with regard to the global economic climate and they have often been sought-after metals in situations of widespread uncertainty and economic weakness. The last ten years have seen the metals become an increasingly popular component of financial investors’ portfolios. Prices were, on average, higher year on year after an upturn in the spring. Prices fell in the autumn and winter as the USD continued to strengthen.
Demand for sulphuric acid fell slightly short of supply in northern Europe. Contract prices in northern Europe fell somewhat after the first quarter. Supply increased on the spot market for exports and prices fell.
GOLD USD/TROZ (+8%)
SILVER USD/TROZ (+9%)
EUR/TONNE (-13%)
1,250
17.1
60
Sulphuric acid price
Gold price Silver price
0
20
40
60
80
0
500
1,000
1,500
2,000
USD/Troy Oz USD/Troy Oz
07 08 09 10 11 12 13 14 15 16
0
50
100
150
200
EUR/tonne
07 08 09 10 11 12 13 14 15 16
SO
UR
CE:
REU
TER
S, JA
N. 2
01
7SO
UR
CE:
CR
U J
AN
. 2
01
7
The markets for precious metals and sulphuric acid, 2016
Gold price Silver price
Sulphuric acid CFR NW Europe, 6 months contract
The USD continued to strengthen against the majority of the world’s curren-cies in 2016, largely due to an expectation of a rise in market interest rates happening first in the USA, in that the country is ahead of other western countries in terms of economic recovery. The average USD/SEK exchange rate was 8.56 (8.44) and rose by the end of the year to 9.10 (8.35). The SEK was also slightly weaker against the EUR with an average rate of 9.47 (9.36). The EUR/SEK exchange rate at the end of the year was 9.57 (9.14).
Exchange rates
2
4
6
8
10
12
2
4
6
8
10
12
USD/SEK EUR/SEK
07 08 09 10 11 12 13 14 15 16
SO
UR
CE:
REU
TER
S J
AN
. 2
01
7
USD/SEK EUR/SEK
Exchange rate trends, 2016
The graph to the left shows the exchange rate trends for currencies against the USD for countries with significant levels of mined production for copper and zinc. The bars illustrate the change over one year and three years. A high percentage of mines’ costs are in local currencies, while revenues are in USD.
Exchange rate trends have benefited Boliden, as has been true for many of our competitors, for the past three years. The SEK fell further against the USD in 2016 but there are important mining nations where the currency has strengthened against the USD during the year, such as Chile and Peru, which are important countries for copper. Russia’s currency has weakened substantially over the past three years, but strengthened again in 2016.
Exchange rate trend – USD vs. currencies for major base metal mining countries – up to 31 Dec. 2016
-25%
0
25%
50%
75%
100%
Aust
ralia
Braz
il
Chile
Chin
a
Indo
nesi
a
Russ
ia
Pola
nd
Peru
Mex
ico
Cana
da
Swed
en
SO
UR
CE:
REU
TER
S J
AN
. 2
01
7
● 1 year ● 3 years Average 3 years
USD
Str
onge
rU
SD
wea
ker
Introduction Market Operations Corporate Governance Financial reports
Boliden Annual Report 2016 | 19
PRICE TRENDS

Income model
The metals market comprises two subsidiary markets, the market for raw materials sold from mines to smelters, and the market for metals, which are primarily sold to industrial customers. Boliden’s smelters have the capacity to handle considerably larger volumes than those produced by Boliden’s mines and substantial volumes of concentrate are bought in from external mines. Boliden’s integrated business model generates synergies in raw materials planning and the ability to evaluate external raw materials suppliers. The model also ensures more stable revenues for the Group as the income cycles of mines and smelters often differ.
MinesBoliden’s Business Area Mines produces metal con-centrate. Revenues are affected by ore tonnage, metal grades, recovery during the concentration process, the price of concentrates in USD, and exchange rate fluctuations.
The gross profit and revenues are normally the same as Mines has no input raw materials. Concen-trate prices are an effect of the global market price of the pure metal and the payable metal content (the quantity of metal in concentrates for which the mines can take payment), less treatment and refining charges (TC and RC) and deductions for impurities in the concentrate (penalties). The levels of TC/RC and pen-alty charges are determined in negotiations between mines and smelters.
The operating profit is the gross profit less operating costs, the most important of which are personnel, consumables, spare parts, external services, energy and depreciation.
An individual mine has natural variations in grades, waste rock dilution, energy requirements at different depths, equipment maintenance and other factors that result in the profit varying over time. These variations are often known well in advance and are clearly defined in so-called life of mine plans. Boliden provides guidance on major changes in grades and volume in the larger mines.
SmeltersBoliden’s Business Area Smelters produces pure met-als. The gross profit is the difference between revenues (the LME price plus local premiums) and the price of the raw material.
The gross profit comprises the income from treatment and refining charges (from concentrates and secondary raw materials), penalties (remunera-tion for impurities), metal premiums, income from so-called free metals, and income from by-products. The metal premium is determined by regional supply and demand and constitutes a local adjustment of the LME price, including such factors as transportation, customised alloys, and payment terms. Free metals arise when the quantity of the metal extracted during concentration exceeds the payable metal content of the concentrates purchased by the smelter. By-prod-ucts extracted during the processing, such as sulphuric acid, also generate important revenues.
The operating profit comprises the gross profit less operating costs for personnel, consumables, external services, energy, and depreciation. The operating prof-it is reported excluding revaluation of the smelters’ process inventory (PIR) in order to provide a better picture of the underlying trend.
Unlike mines, smelters have a similar production situation over time with the exception of maintenance shutdowns of varying lengths. An individual smelter has minor shutdowns every year and conducts major main-tenance work at 3-10 year intervals. Boliden provides guidance on maintenance shutdowns for the year ahead.
20 | Boliden Annual Report 2016
INCOME MODEL

The metal market’s income components
• Global market price in USD set on the LME and LMBA (Price)
• Metal premium, which constitutes a local adjustment to the LME price (Premium)
• The concentrates’ payable metal con-tent, negotiated individually in line with established standards (Payable)
• Treatment charges published by the major operators (TC)
• Refining charges (RC)• Discount for impurities in the metal
(Penalties)• Metal extracted as a percentage of the
metal content, which depends on the quality of the process and the material (Recovery)
• Income from by-products (By-products)
S M E L T E R S
Important costs• Personnel• Consumables• External services• Energy• Depreciation
Revenues Raw materials
Metal concentrate
Gross profit excl. PIR
Operating costs
Operating profit
excl. PIR
The smelters’ gross profit =Treatment and refining charges and penalties (TC + RC + Penalties)+ Metal premiums (Recovery x Premium)+ Free metals ((Recovery – Payable) × Price)+ By-products
TC+RC+PENAL-
TIES
PREMIUMS
FREE METALS
BY-PROD-UCTS
M I N E S
TC+RC+ PENAL-
TIESImportant costs• Personnel• Consumables• Spare parts• External services• Energy• Depreciation
Revenues and gross profit
Operating costs
Operating profit
The mines’ gross profit =The value of metal concentrate (Price x Payable)– Deductions for treatment and refining charges and penalties (TC + RC + Penalties)
ALL SALES OF METAL
CONCENTRATES BETWEEN
BOLIDEN’S MINES AND
SMELTERS ARE MADE ON
MARKET TERMS
THE BARS IN THE ILLUSTRA-
TIONS ARE NOT ACCORDING
TO SCALE
Introduction Market Operations Corporate Governance Financial reports
Boliden Annual Report 2016 | 21
INCOME MODEL

M I N E S
Competitive mines and smelters
Boliden has 90 years’ experience of exploration, mining and metal production. With its own mines and smelters, Boliden is able to secure quality throughout the length of the value chain. This breadth yields synergy effects such as more reliable deliveries and more stable earnings, ensuring that Boliden is well-positioned in a changing metals market. Safety and environmental issues are important to the industry – high quality mines and smelters offer safe workplaces and have a minimal impact on the surrounding environment.
Aitik
World class productivityAitik is a large copper mine where the ore also contains gold and silver. All of the mine’s copper concentrate is delivered to Boliden’s Rönnskär smelter. Large volumes, rational methods, and a high degree of automation make Aitik the most productive open-pit copper mine in the world.
M 36,051 (36,361) ktonnes
O SEK 222 m (183)
A 698 (647) FTE
The Boliden Area
Mineral-rich mines on historic landThe Boliden Area comprises the Ren-ström, Kristineberg and Kankberg under-ground mines and the Maurliden open-pit mine. All of the mines, with the exception of Kankberg, produce ores containing zinc, copper, lead, gold and silver. Kankberg produces gold ore with tellurium as a by-product. The concentrates are mainly delivered to Boliden’s smelters.
M 2,138 (1,879) ktonnes
O SEK 548 m (108)
A 611 (580) FTE
Kylylahti
Copper mine in a geologically interesting areaThe Kylylahti underground mine, which was acquired in 2014, produces copper, gold and zinc. The geological conditions offer synergies with the Boliden Area in the fields of exploration, mining, and metallurgy. The metal concentrates are mainly delivered to Boliden’s Harjavalta smelter.
M 797 (733) ktonnes
O SEK -28 m (74)
A 121 (114) FTE
Tara
Europe’s largest zinc mineTara is Europe’s largest zinc mine and the eighth largest in the world, and accounts for half of Boliden’s zinc concentrate pro-duction. A new inferred mineral resource has, furthermore, been announced, and will extend the mine’s lifespan. The zinc concentrate is mainly delivered to Boliden’s smelters, while the lead concentrate is delivered to European lead smelters.
M 2,603 (2,197) ktonnes
O SEK 476 m (95)
A 585 (586) FTE
Garpenberg
One of the world’s most modern minesGarpenberg is the most productive under-ground zinc mine in the world. Garpenberg produces complex sulphide ores that contain zinc and silver, along with lead, copper and gold as by-products. The metal concentrates are mainly delivered to Boliden’s Kokkola and Rönnskär smelters and to European lead smelters.
M 2,622 (2,367) ktonnes
O SEK 2,063 m (1,452)
A 424 (420) FTE
Kevitsa
Boliden’s latest acquisitionIn 2016, Boliden acquired the Kevitsa open-pit mine in northern Finland. The mine opened in 2012 and is still in a ramping up phase. Kevitsa produces concentrate containing nickel, copper, gold, platinum, and palladium. The concen-trate is delivered to Boliden’s Harjavalta and Rönnskär smelters and to external customers.
M 4,518 (-) ktonnes1)
O SEK166 m (-)1)
A 398 (-) FTE
M Milled tonnage
P Production
O Operating profit*
A Average number of employees
*) excl. revaluation of process inventory
1) Included from 1 June 2016.
22 | Boliden Annual Report 2016
BOLIDEN’S MINES AND SMELTERS

S M E L T E R S
S M E L T E R S
● TARA
GARPENBERG ●
STOCKHOLM ●
BOLIDEN AREA ●
AITIK ● ● KEVITSA
RÖNNSKÄR ●
KYLYLAHTI ●
ODDA ●
BERGSÖE ●
● KOKKOLA
● HARJAVALTA
● MINES
● SMELTERS
● HEADQUARTER
Rönnskär
Copper smelter with electronic scrap recyclingRönnskär produces copper, gold, silver and lead, along with sulphuric acid, zinc clinker, and several other metals as by-products. The raw materials mainly comprise concentrates from Boliden’s mines and electronic scrap for recycling. The smelter has an e-scrap recycling capacity of 120 ktonnes per year, making it one of the biggest in the world.
P Copper 207 (206) ktonnes
O SEK 852 m (727)
A 775 (800) FTE
Kokkola
One of the world’s biggest zinc smeltersKokkola produces zinc and zinc alloys, sulphuric acid, and silver in concentrate. The majority of the zinc concentrate comes from Boliden’s mines in Sweden, Ireland and Finland. Kokkola is the eighth largest zinc smelter and the second largest in Europe.
P Zinc 291 (306) ktonnes
P Silver in concentrate 17 (16) tonnes
O SEK 572 m (739)
A 539 (534) FTE
Harjavalta
Copper, nickel and precious metals Harjavalta produces copper, nickel matte, gold, silver and sulphuric acid. The raw ma-terials comprise copper concentrate from the Kylylahti mine and nickel concentrate from the Kevitsa mine and external mines.
P Copper 129 (126) ktonnes
P Nickel in matte 31 (17) ktonnes
O SEK 704 m (736)
A 495 (387) FTE
Odda
Zinc and zinc alloys for Europe’s steel industry Odda produces pure zinc, zinc alloys, and sulphuric acid. The zinc production is primarily exported to the European steel industry. A number of alloys have been developed in partnership with leading steel companies for the European automotive industry. The aluminium fluoride producing unit of Odda was divested in 2016.
P Zinc 171 (163) ktonnes
O SEK 314 m (390)
A 285 (289) FTE
Bergsöe
Contributing to the lead metal ecocycle Bergsöe is one of Europe’s biggest recycling facilities for lead batteries and the only secondary lead smelter in the Nordic region. The main products are lead and lead alloys. The majority of the lead production is sold to the European battery industry, with a smaller percentage used for lead sheet, amongst other things. Bergsöe works closely with Rönnskär and Odda to handle certain materials.
P Lead alloys 46 (45) ktonnes
O SEK 109 m (18)
A 71 (71) FTE
Introduction Market Operations Corporate Governance Financial reports
Boliden Annual Report 2016 | 23
BOLIDEN’S MINES AND SMELTERS

4.5 41 37
On 10 March, Boliden entered into an agreement with First Quantum to acquire the Kevitsa copper and nickel mine in northern Finland. The acquisition, which was completed on 1 June, is consistent with Boliden’s strat-egy and gives the Group a high quality mine with a good operational fit. Boliden and Kevitsa have synergies in the fields of mining, concentration, smelting, regional exploration, and the supply of suitable materials for Boliden’s Harjavalta and Rönnskär smelters.
The acquisition ensures a stable supply of high qual-ity nickel concentrate for the Harjavalta smelter and of copper concentrate for Harjavalta and Rönnskär.
The acquisition expands Boliden’s platform in Finland – a geologically attractive region – and gives Boliden a second home market. The total consideration for the transaction was SEK 5,961 million and was paid in cash, financed with a new syndicated loan.
Kevitsa, which is an open-pit mine, came on line in 2012 and is currently in a developmental phase. The operations comprise a mine and a concentrator, together with associated facilities. Kevitsa produces two metal concentrates containing copper, nickel, gold, platinum and palladium. The deposit was discovered in 1987 and is one of the biggest ore finds ever in Finland.
Mtonnes, milled tonnage in 20161)
Number of employ-ees at the year end
Copper’s share of sales in 20161)
Nickel’s share of sales in 20161)
Mine acquisition in strategically important area boosts nickel operations
T H E K E V I T S A A C Q U I S I T I O N
1) Refers to June-December 2016
398% %
24 | Boliden Annual Report 2016

Group performance during the year
Revenues and operating profitBoliden’s revenues totalled SEK 40,316 m (40,242).
The operating profit totalled SEK 5,682 m (3,590) and the operating profit excluding the revaluation of process inventory was SEK 5,094 m (4,010).
The operating profit for Mines totalled SEK 2,804 m (1,429), while for Smelters, the operating profit excluding revaluation of process inventory was SEK 2,759 m (2,692).
Adjusted for the acquisition of Kevitsa, the operating profit excluding the revaluation of process inventory in-creased by SEK 985 m as a result of higher production levels, primarily within Mines, and improved market terms. Deteriorations in treatment charge terms and metal premiums, coupled with the lower price for sul-phuric acid, had a negative effect on the profit. Planned maintenance shutdowns for Smelters were charged to the profit in the sum of approximately SEK 260 m (290) in the form of lower production and higher costs.
The Group’s operating costs before depreciation totalled SEK 12,757 m (11,581), corresponding to an increase of 12% in local currencies. Adjusted for Kevitsa, costs increased by 4% in local currencies, with the increase largely due to higher levels of mined production and higher staff overheads. Purchasing prices fell slightly overall for the Group in 2016, despite a sharply rising USD.
Depreciation increased, mainly due to the acqui-sition of Kevitsa, higher levels of mined production and to the fact that production at Aitik took place in capital-intensive areas.
The Group’s operating profit includes items affect-ing comparability with a net of SEK 256 m (–45), comprising the transformation of Tara’s defined benefit pension plan to a defined contribution plan (SEK 248 m), acquisition costs related to Kevitsa (SEK –39 m), and capital gains on the divestment of the aluminium flu-oride operations at Odda (SEK 47 m). Last year, this item comprised the cost of energy tax on diesel at Aitik (SEK –212 m), changes to pension terms at Tara (SEK 227 m), and the correction of Smelters’ internal profit calculation (SEK –60 m).
Net financial items for the year totalled SEK –308 m (–234) and the profit after financial items was
SEK 5,375 m (3,356). The reported tax for the year totalled SEK –1,135 m (–715), corresponding to an average tax rate of 21% (21).
The net profit for the year was SEK 4,239 m (2,641), corresponding to earnings per share of SEK 15.49 (9.65).
The focus during the year was on increased production stability, improved safety work, and the integration of the Kevitsa copper-nickel mine acquired. Market terms improved substantially during the latter half of the year.
Operating profit
SEK m 2016 2015
Revenues 40,316 40,242
Operating costs before depreciation 12,757 11,581
Depreciation 4,199 3,522
Operating profit excl. revaluation of process inventory 5,094 4,010
Operating profit 5,682 3,590
Pro forma profit analysis1)
SEK m 2016 2015
Operating profit 5,682 3,590
Revaluation of process inventory 588 –420
Operating profit excl. revaluation of process inventory 5,094 4,010
Operating profit excl. revaluation of process inventory – pro forma1) 4,946 3,961
Change 985
Analysis of change
Volume effect 1,207
Prices and terms 579
Metal prices and terms 730
By-products, prices and terms –198
Realised metal price and currency hedging –49
TC/RC terms –49
Metal premiums –113
Exchange rate effects 257
Costs (local currencies) –658
Depreciation (local currencies) –393
Items affecting comparability 301
Other –50
Change 985
1) Pro forma includes Kevitsa for the whole years of 2015 and 2016.
Introduction Market Operations Corporate Governance Financial reports
Boliden Annual Report 2016 | 25
GROUP PERFORMANCE

InvestmentsInvestments for the year totalled SEK 4,127 m (3,650) and primarily comprised investments in maintenance. In addition, the consideration for Kevitsa totalled SEK 5,961 m. Important projects during the year included the investment in a deep storage facility at Rönnskär, the expansion of Odda to a production level of 200 ktonnes per year, and the initial work on both a new sulphuric acid plant at Harjavalta and a new crusher station at Aitik.
Investments
SEK m 2016 2015
Mines1) 2,755 2,394
Smelters 1,372 1,248
Other – 8
Total investments1) 4,127 3,650
1) Excluding acquisitions: Kevitsa in 2016 (SEK 5,961 m)
Acquisition of the Kevitsa mineOn 1 June 2016, Boliden acquired the Kevitsa copper and nickel mine in northern Finland. The operations acquired have been integrated into Business Area Mines as a sixth mining area. The consideration paid totalled SEK 5,961 m on a debt-free basis. For further information, see Note 11.
Increase in future reclamation costsThe reclamation provision and fixed assets have been increased by SEK 930 m and SEK 594 m, respective-ly, due to the acquisition of Kevitsa, a new environ-mental permit at Aitik, and the customary review of reclamation requirements. For further information, see Note 24.
Cash flowThe cash flow from operating activities before changes in working capital totalled SEK 7,918 m (6,963) in 2016. Tax paid for the year totalled SEK 709 m (272). The increase in working capital reduced the cash flow by SEK –923 m (–728).
The free cash flow totalled SEK –2,801 m (2,565). Excluding the consideration for Kevitsa, the free cash flow was SEK 3,124 m. The improvement was due to improved profits.
Cash flow
SEK m 2016 2015
Cash flow from operating activities before changes in working capital 7,918 6,963
Changes in working capital –923 –728
Cash flow from operating activities 6,995 6,235
Cash flow from investment activities –9,795 –3,670
Free cash flow (before financing) –2,801 2,565
● Personnel, 24 (24) %
● Energy, 14 (16) %
● Consumables & spare parts, 19 (19) %
● Transport costs, 4 (4) %
● External services, 18 (17) %
● Depreciation & other, 21 (20) %
Breakdown of operating costsRevenues and operating profit Earnings per share and dividend share
Operating costs, including depreciation, increased by 13% in local currencies. Adjusted for Kevitsa, the increase was 6%.
Earnings per share totalled SEK 15.49 (9.65) and a dividend of SEK 5.25 (3.25) is proposed, corre-sponding to a dividend share of 33.9% (33.7).
SEK %
12 13 14 15 160
5
10
15
20
0
10
20
30
40SEK m SEK m
12 13 14 15 160
10,000
20,000
30,000
40,000
50,000
60,000
0
1,000
2,000
3,000
4,000
5,000
6,000
The operating profit excluding revaluation of pro-cess inventory increased due to higher production levels, primarily within Mines, and to improve-ments in market terms.
● Revenues
Operating profit
Operating profit excl. revaluation of process inventory
● Earnings per share
Dividend share
● ●
26 | Boliden Annual Report 2016
GROUP PERFORMANCE

Financial position On 31 December 2016, Boliden’s net debt totalled SEK 9,339 m (5,827). Shareholders’ equity totalled SEK 29,394 m (25,807), including net market valua-tion of currency, interest, and raw materials derivatives totalling SEK –2 m (68) after fiscal effects. The net debt/equity ratio increased to 32% (23) at the end of 2016 due to the acquisition of Kevitsa.
The average term of Boliden’s total granted loan facili-ties was 3.3 years (2.4) at the end of the year. The average interest level in the debt portfolio on 31 December 2016 was 1.3% (1.3) and the fixed interest term was 0.2 years (0.5). At the end of the year, Boliden’s current liquidity totalled SEK 6,968 m (6,514), comprising liquid assets and unutilised binding credit facilities with terms of over one year. For further information on Boliden’s debt portfolio, see Note 26.
Capital structure and return
2016 2015
Balance Sheet total, SEK m 53,877 43,022
Capital employed, SEK m 42,457 35,131
Shareholders’ equity, SEK m 29,394 25,807
Net debt, SEK m 9,339 5,827
Return on capital employed, % 15 10
Return on shareholders’ equity, % 16 11
Equity/assets ratio, % 55 60
Net debt/equity ratio, % 32 23
The Parent CompanyThe Parent Company conducts limited operations and is, fiscally, on commission with Boliden Mineral AB and has no employees. The Income Statements, Balance Sheets and Statements of Cash Flow for the Parent Company are shown on page 73.
Principles for remuneration to the President and other senior executives The remuneration paid by Boliden to senior execu-tives shall comprise a fixed salary, variable remunera-tion, pension benefits and other benefits. Remunera-tion to senior executives is described in Note 3.
The variable remuneration component shall be linked to the Group’s profitability and to the individual in question’s sphere of responsibility and shall primar-ily comprise one or more financial parameters. The maximum variable remuneration shall be 60% of the fixed annual salary for the President and 40−50% of the same for other senior executives. A certain percentage of this shall be conditional upon Boliden shares being pur-chased for the gross sum before tax. Senior executives are, in common with all Boliden Group employees, also part of the profit-sharing system. Senior executives have a defined contribution pension solution and a retire-ment age of 65. The Board does not intend to propose any changes to these guidelines to the Annual General Meeting to be held in April 2017.
Investments and cash flow from operating activities
Free cash flow
SEK m
12 13 14 15 160
1,000
2,000
3,000
4,000
5,000
6,000
7,000SEK m
12 13 14 15 16-3,000
-2,000
-1,000
0
1,000
2,000
3,000
● Investments1)
Cash flow from operating activities
Cash flow from operating activities and investments, respectively. The cash flow from operating activities before investments increased due to increased profits.
Free cash flow. The free cash flow totalled SEK –2,801 m (2,565). Excluding the considera-tion for Kevitsa, the free cash flow was SEK 3,124 m.
Kevitsa, which was acquired during the year, is a high quality mine that is a good fit for Boliden, both strategically and geographically.
1) Excluding acquisitions: Kylylahti in 2014 (SEK 718 m) and Kevitsa in 2016 (SEK 5,961 m)
Introduction Market Operations Corporate Governance Financial reports
Boliden Annual Report 2016 | 27
GROUP PERFORMANCE

High-level expertise in developing and operating mines based on cutting-edge technology make Boliden’s mines highly competitive. Investments in automation and remote control are yielding increased productivity and improved safety, and a number of new measures were implemented during the past year.
World class mine productivity through technological development
Boliden aims to boost competitiveness and to meet the world’s demand for metals in a sustainable way by working to improve its productivity and envi-ronmental performance, and to engage in successful exploration and commercial development. In-house expertise and partnerships with several leading suppliers are progressing development in the field of mine automation, for example, resulting in Boliden’s biggest mines, Garpenberg and Aitik achieving world class productivity. Efforts to create an improved safety culture over the past year have resulted in increased employee commitment to safety and an increase in the number of risks reported.
Boliden also invests heavily in the reclamation of mining areas once they are wound up in order to minimise any future impact on the air, soil or water. Boliden’s ambition at all times is to use the optimum technology, e.g. for covering, monitoring, sampling, and inspection work. The work is carried out in paral-
lel with operations and the reclamation of Aitik is, for example, already being prepared although the mining operations there are expected to continue for at least another 25 years. Boliden is open to visitors from other mining companies with a view to environmen-tal technology knowledge sharing and in an effort to contribute to a global reduction in the environmental impact of our industry.
Investments Boliden’s mines have focused not only on devel-opment work in new mining stopes, but also on main-tenance investments designed to increase availability and utilisation levels. The substantial ongoing invest-ment in a new crusher station at Aitik will improve stability and enable higher production levels.
The concentrators’ focus is primarily on measures designed to improve processing and thereby increase metal recovery.
Boliden’s mines are trialling and refining new automation technology to create tomorrow’s mining technology. Remote controlled and automatic machines can increase productivity by 40% due to, for example, their ability to work when people cannot be underground, e.g. in conjunction with blasting and during shift changes. At the Kristineberg mine in the Boliden Area, the Volvo Group is developing technical systems for autonomous trucks – the first in the world to be tested in real life situations underground. The pilot project is part of Boliden’s efforts to develop automation underground and thereby make improvements in competitiveness, safety and environmental performance.
Automation increases safety and productivity
28 | Boliden Annual Report 2016
BUSINESS AREA MINES

The substantial investment in the construction of a new crusher station at Aitik will improve stability and enable higher production levels.
40%
ADSOX
Remote-controlled and automated machines can boost productivity by 40%.
In 2014, Boliden was granted a permit to increase produc- tion at the Aitik mine. During the permit hearings, Boliden made a voluntary undertaking to carry out ecological compensation in two adjacent nature sites. Ecological compensation involves a company delivering new environmental resources or enhancing existing ones and securing them for the future. This may, for example, involve the relocation of protected species of trees, controlled burns, or the promotion of birdlife and outdoor activities. The compensation plan was approved by the County Council in 2016 and Boliden has begun a five-year implementation period. The measures taken will be followed up as part of a comprehensive research partnership with the Swedish University of Agricultural Sciences.
All of Boliden’s Swedish mines now have wireless net-works, known as WLAN. The next step is now being taken at the Kankberg mine in the Boliden Area with underground trials of tomorrow’s mobile network. The network being evaluated is the fifth generation mobile network, 5G, putting Boliden at the absolute forefront of in-mine connections. The technology offers short response times, which is vital for remote controlled operations. A successful implementation of 5G would mean taking another step towards mine automation, enhancing both competitiveness and the safety of the working environment. Boliden is
cooperating in the pilot project with a number of leading suppliers, including Erics-son, Telia, ABB and Volvo.
Ecological compensation plan
The world’s most modern mobile network
The employees at Boliden’s technology department have invented and patented a method of treating water to remove nitrous compounds and so-called thiosalts that may be present in the process water from the mines. The method is called ADSOX (Autogenous Denitrification with Sulphur Oxidizers) and is bacterial, and consequently more eco-friend-ly as it does not require any chemicals classified as hazardous. ADSOX differs from traditional
technology and results in lower investment and operating costs. ADSOX has been evaluated at Aitik and a larger scale trial is now being conducted in the Boliden Area.
Eco-friendly water treatment technology
Introduction Market Operations Corporate Governance Financial reports
Boliden Annual Report 2016 | 29
BUSINESS AREA MINES

E X P L O R A T I O N U N D E R G R O U N D
How Boliden’s mines work
Find out more at boliden.com
Refuge chambers
All of Boliden’s mines are equipped with refuge chambers where people can seek safety for up to six hours. Each chamber contains supplies of air, water and communication equipment.
Tailings pond
30 | Boliden Annual Report 2016
BUSINESS AREA MINES
Positioning
Boliden uses positioning systems that enable the exact position of individuals and vehi-cles equipped with a tag to be located underground in real time. The technology offers similar functionality to GPS, which is even more important underground in order to pro-vide visual flows in production. The technology improves the safety of the working environment and increases productivity by allowing the operations centre to plan dif-ferent transportation routes and control production.
Exploration
Long-term and systematic exploration work is carried out with the aim of identifying new minable deposits. Flight inspections, rock surface finds, geophysical and seismic methods make up the initial phases, while core drilling is the final stage in confirming a mineralisation. Boliden uses a range of different techniques and some of the instruments used were developed in-house by Boliden’s instrument laboratory.
Remote control
The journey down to workplac-es in the mines, which may lie several hundred metres underground, can take up to an hour. Operators can now increasingly control loading and drilling machines from control rooms. Some of the loading machines drive themselves (autonomously) to the shaft and tip the ore, and then drive back so that more ore can be loaded.
Environmental expertise
Boliden’s environmental ex-perts progress the company’s development in such areas as water management, water treatment, and reclamation of former mining areas. Their combined expertise is used in the important and wide-rang-ing licensing processes that are led by Boliden’s experi-enced Project Managers. This approach has resulted in high environmental performance.

O P E N - P I T C O N C E N T R A T O R
In-depth experience and technological development have ensured world class productivity levels at several of Boliden’s mines. Boliden has both open-pit and underground mines, depending on the conditions. After drilling, blasting and crushing, the ore is transported to concentrators where the metal content is separated out from waste rock.
Crushed ore
Grinding
The metal is separated from the ore by flotation
Dewatering and filtering
1
2
3
Metal concentrateSand
Waste rock tip
Introduction Market Operations Corporate Governance Financial reports
Boliden Annual Report 2016 | 31
BUSINESS AREA MINES
Optimal mine design
The Aitik open-pit mine’s productivity is amongst the highest in the world when it comes to copper mines, due to its cutting edge technology and logistics and to the way in which the mine is designed. Crusher stations down in the mine mean short routes, leading to fewer trucks. After crushing, the ore is transported to the concen-trator on conveyor belts, resulting in low costs and high productivity.
Autogenous grinding
Boliden’s concentrators main-ly use a technology known as autogenous grinding, whereby the ore grinds itself. The tech-nique cuts costs but requires more advanced control than conventional technologies. Autogenous grinding also re-sults in less wear and reduced maintenance costs.
Concentration of complex ores
Boliden has developed concentrating techniques for complex ores. Miner-alogical studies are used systematically to optimise the concentration process. Boliden has a pilot concentra-tor that is used to evaluate processes with new minerals or to enhance performance in the concentrators.
Mobile control rooms
The concentrators’ control rooms are connected to mo-bile units, giving the operators access to processing data in real time. The operators steer and control the processes via mobile phones or tablets, increasing understanding and communication between individuals, departments and suppliers. This, in turn, ena-bles faster intervention, for example, when adjustments to processes are required.

Financial informationThe majority of Mines’ sales are made to Boliden’s smelters on market terms. Revenues increased to SEK 12,659 m (9,808), with external sales accounting for SEK 1,776 m (1,208) of this total.
Mines’ operating profit increased to SEK 2,804 m (1,429). Adjusted for the acquisition of Kevitsa, the operating profit for the year as a whole improved by SEK 1,277 m due to higher volumes in all mining areas and improvements in metal prices. The higher level of mined production also resulted in increases in both costs and depreciation.
Aitik’s operating profit, adjusted for last year’s diesel energy tax cost of SEK −212 m, fell during the year due to a deterioration in copper prices and disruptions to production. The Boliden Area’s higher profit is pri-marily due to a higher milled volume resulting from systematic improvement work in the concentrator. Improved metal prices also had a positive effect on the
profit. At Garpenberg, 2016 was the first year of oper-ating at full production capacity in the new facilities. The substantial improvement in the profit was due to higher milled volume and improvements in the zinc price. Kevitsa, which was acquired during the year, was consolidated on 1 June 2016. Kylylahti’s increase in milled volume was unable to compensate for lower copper prices, higher operating costs, and deprecia-tion. Tara’s operating profit increased, mainly due to improvements in metal prices but also as a result of a higher milled volume. The profit was affected by items affecting comparability in relation to the adjustment of pensions and totalling SEK 248 m (227).
Mines’ operating costs before depreciation totalled SEK 6,833 m (5,842), corresponding to an increase in local currencies of 20%. Adjusted for Kevitsa, costs increased by 7% in local currencies with the increase primarily due to higher levels of mined production.
Depreciation increased to SEK 3,172 m (2,520)
Key data Operating profit
2016 2015
Revenues, SEK m 12,659 9,808
Operating costs excl. depreciation, SEK m 6,833 5,842
Depreciation, SEK m 3,172 2,520
Operating profit, SEK m 2,804 1,429
Investments, SEK m 2,755 2,394
Acquisitions, SEK m 5,961 -
Capital employed, SEK m 24,972 19,275
Return on capital employed, % 13 7
Number of employees, FTE 3,106 2,603
SEK m 2016 2015
Aitik 222 183
The Boliden Area 548 108
Garpenberg 2,063 1,452
Kevitsa3) 166 -
Kylylahti −28 74
Tara 476 95
● Zinc, 32 (29) %
● Copper, 28 (33) %
● Nickel, 4 (-) %
● Lead, 6 (7) %
● Gold, 13 (14) %
● Silver, 15 (16) %
● Other, 2 (1) %
Revenues and operating profit Breakdown of revenue by metal
SEK m SEK m
12 13 14 15 160
3,000
6,000
9,000
12,000
15,000
0
1,000
2,000
3,000
4,000
5,000
● Revenues
Operating profit
Breakdown of operating costs
● Personnel, 22 (23) %
● Energy, 10 (11) %
● Consumables & spare parts, 20 (21) %
● Transport, 3 (3) %
● External services, 20 (17) %
● Depreciation & other, 25 (25) %
Comments
Revenues and operating profit. The year on year increase in the operating profit was due to higher volumes in all mining areas and improvements in metal prices.Breakdown of revenues by metal. Nickel, which is a new metal for Mines, and zinc increased their respective shares of revenues.Breakdown of operating costs. Operating costs excluding depreciation increased in local currencies by 20%. The increase, adjusted for Kevitsa, was 7%.
●
SEK m 2016 2015
Operating profit 2,804 1,429
Operating profit – pro forma1) 2,656 1,379
Change 1,277
Analysis of change
Volume effect 1,078
Prices and terms 903
Exchange rate effects 193
Costs (local currencies) −485
Depreciation (local currencies) −370
Items affecting comparability2) 194
Other −43
Change 1,277
1) Pro forma includes Kevitsa for the full years of 2015 and 2016.
2) 2016: SEK 209 m comprising changes to pension terms for Tara (SEK 248 m) and acquisition costs in connection with Kevitsa (SEK −39 m). 2015: SEK 15 m comprising the cost of energy tax at Aitik (SEK −212 m) and changes to pension terms at Tara (SEK 227 m).
3) Kevitsa was acquired on 1 June 2016 and the operating profit for 2016 consequently refers solely to the period from June to December 2016.
Pro forma profit analysis1)
32 | Boliden Annual Report 2016
BUSINESS AREA MINES

due to the Kevitsa acquisition, to higher mined pro-duction levels, and to the fact that production at Aitik took place in capital-intensive areas.
Investments, excluding acquisitions, increased to SEK 2,755 m (2,394).
ProductionMilled volume and production of metal in concen-trate increased due to the acquisition of Kevitsa and to higher levels of production in several mining areas.
Aitik’s production continued to be negatively affect-ed by low crusher availability, and the milled volume totalled 36 Mtonnes (36). Production of copper in concentrate increased, however, due to a higher copper grade, 0.22% (0.21). Construction of the new crusher station, which is scheduled to come on line in 2018, is continuing.
Milled volume in the Boliden Area increased to 2,138 ktonnes (1,879), primarily due to systematic
improvement work in the concentrator. The higher milled volume resulted in increases in the production of all metals in concentrate.
Garpenberg’s expansion resulted in an increase in milled volume to 2,622 ktonnes (2,367), compen-sating for lower grades. High levels of stability in the concentrator resulted in a high zinc recovery level.
Kevitsa was acquired on 1 June 2016 and produc-tion developed well.
Kylylahti’s milled volume achieved record high levels due to systematic improvement work, totalling 797 ktonnes (733). The higher milled volume resulted in increased production of both copper and gold in concentrate.
The action programme at Tara launched in 2014 has yielded the desired results and the milled volume increased to 2,603 ktonnes (2,197). Production of zinc and lead in concentrate consequently also increased.
Comments Copper production Zinc production
Copper. The acquisition of Kevitsa, together, primarily, with higher production at Aitik, result-ed in an increase in the production of copper in concentrate.Zinc. Production of zinc in concentrate increased due to the higher milled volume at Tara and to an increase in milled volume and grade in the Boliden Area. Nickel. The Kevitsa acquisition added nickel to Mines’ metals. Gold. The increase in the production of gold in concentrate was mainly due to the acquisition of Kevitsa and to increased production in the Boliden Area.Silver. The increase in the production of silver in concentrate was due to higher milled volumes in the Boliden Area and at Garpenberg.Lead. Production of lead in concentrate remained on a par with last year.
● Milled ore
● Milled ore
● Milled ore Metal in concentrate
Metal in concentrate
Metal in concentrate
ktonnes ktonnes
12 13 14 15 160
10,000
20,000
30,000
40,000
0
25
50
75
100ktonnes ktonnes
12 13 14 15 160
1,500
3,000
4,500
6,000
7,500
0
100
200
300
400
Gold and silver production Lead productionNickel production1)
Metal in concentrate
0
20,000
40,000
60,000
80,000tonnes
12 13 14 15 16
● ●
ktonnes tonnes
12 13 14 15 160
1,500
3,000
4,500
6,000
0
2,000
4,000
6,000
8,000
●
kg kg
12 13 14 15 160
2,000
4,000
6,000
8,000
10,000
0
100,000
200,000
300,000
400,000
500,000
Metal in concentrate, gold
Metal in concentrate, silver1) 2016: refers to June-December.
Introduction Market Operations Corporate Governance Financial reports
Boliden Annual Report 2016 | 33
BUSINESS AREA MINES

Boliden’s smelters enjoy strong market positions due to advanced technical know-how, flexible smelting processes, and the ability to produce high quality metals from complex metal concentrates and recycled raw materials.
Smelters’ flexibility ensures competitiveness
Boliden’s smelters are working to enhance their effi-ciency and growth on the basis of sustainability and responsibility with regard to safety, the environment, and health. The Business Area has three strategic focus areas and has launched a number of related develop-ment projects during the year.
Improved operational efficiency will be achieved through increased process stability, higher recovery levels, and lower costs. Efficient maintenance work, longer inter-vals between maintenance shutdowns, and increased zinc capacity at Odda are all examples of this approach.
The smelters are also working to increase their flexibility by developing the ability to process complex materials and compounds, and by identifying long-term solutions to waste management issues. Rönnskär and Odda are also investing in underground storage facilities for environmentally hazardous waste.
Maximised production of metals and by-products is enabled through diversification and a broader product portfolio, with the new business model for nickel at Harjavalta and silver extraction at Kokkola providing two examples of this approach.
Investments Business Area Smelters invests in enhanced environ-mental performance and improvements to efficien-cy and flexibility in order to ensure its long-term competitiveness. A number of investments have been made in reducing the operations’ environmental impact during the year, and the construction of a new sulphuric acid plant at Harjavalta, for example, will reduce sulphur dioxide emissions and enable future increases in production. The facility will come on line in 2019.
Boliden reached an agreement to sell the independent Noralf operations at Odda to Fluorsid − an Italian company that is the market leader in aluminium fluoride − last autumn. The operations sold comprise the manufacture and sale of aluminium fluoride, which is used in the production of aluminium. The manufacturing process requires large amounts of sulphuric acid, which is a by-product of the smelter’s zinc process. A long-term agreement was signed at the same time for the sale of sulphuric acid. The sale supports Boliden’s strategy of streamlining the zinc operations at Odda and expanding production to 200 ktonnes per year by the second quarter of 2017.
Streamlining Odda’s zinc operations
34 | Boliden Annual Report 2016
BUSINESS AREA SMELTERS

Boliden’s acquisition of the Kevitsa mine in northern Finland means that Harjavalta now has a stable base supply of nickel concentrate.
80%The new granulation water treatment plant at Rönnskär is expected to reduce metal discharges by up to 80%.
In 2015, Boliden changed its business model for Harjavalta’s nickel smelting. 2016 saw the desired results in the form of increased profitability and an expanded product portfolio thanks to the new business model whereby Boliden buys its own nick-el concentrate and produces nickel matte for sale to external customers, rather than smelting nickel concentrate on behalf of customers.
Boliden’s acquisition of the Kevitsa mine in
northern Finland means that Harjavalta has now secured a stable base supply of nickel concen-trate, enabling improved long-term planning of the smelter’s raw material mix and production. Harjavalta’s nickel operations are strongly positioned, with logistical advantages such as greater proximity to ports than many other nickel smelters. The nickel smelter also has low sulphur dioxide emissions per tonne produced.
Further development of the nickel operations
The automation of heavy, manual jobs has contin-ued in 2016 with the aim of improving the work environment and enhancing both safety and efficiency. The cooling elements used in Odda’s and Bergsöe’s casting of lead ingots are now cleaned completely automatically with the help of robots. Weighing, labelling, and shrink-wrap-ping equipment have now also been automated.
A new treatment plant for granulation water at Rönnskär came into operation in the summer. The treatment plant is equipped with the best possible technology and is an important environmental in-vestment that will substantially reduce the smelt-er’s discharges. The treatment process captures the particles in a ceramic filter with an extremely high filtration capacity, and zinc discharges are consequently expected to be reduced by approx. 80%, while copper and nickel discharges will be reduced by 75%, and lead and arsenic discharges will be halved. A new gas treatment system with dioxin filters will come on line in 2017.
Automation ensures safety and efficiency
Treatment project reduces discharges
%
Introduction Market Operations Corporate Governance Financial reports
Boliden Annual Report 2016 | 35
BUSINESS AREA SMELTERS

How Boliden’s smelters work
C O P P E R S M E L T E R S
Find out more at boliden.com
SmeltingAn upper layer of slag and a lower one of copper matte form in the furnace.
Anode furnaceThe blister copper is further processed to reduce the oxygen content.
ConvertingThe matte is tapped into a converter furnace where iron, sulphur, and other impurities are separated out.
Electrolytic refiningThe copper is extracted with the aid of elec-trolysis.
Precious metals plantGold, silver, palladium and platinum are extracted from the elec-trolytic refining sludge.
Metal concentrate
Metal recycling Copper
Slag
Sulphuric acid plantProcess gases are duct-ed to the sulphuric acid plant for the production of sulphuric acid and other sulphur products.
Efficiency
The prices of Boliden’s metal products are set on global metal exchanges. Therefore Boliden’s competitiveness depends on having stable and efficient processes, high recovery levels and low costs. Boliden is, for example, working to enhance the efficiency of its maintenance work and to increase its efficiency by means of Boliden’s lean-based improvement programme, New Boliden Way.
Recycling
Unique, energy-efficient technology have made the Rönnskär smelter one of the world’s leading operators in the field of recycling copper and precious metals from electronic scrap. The Bergsöe lead smelter is one of Europe’s biggest lead recyclers. Synergies between Boliden’s smelters and mines also enables metals to be recycled from waste products from in-house processes, enabling Boliden to maximise the value of incoming raw materials.
Flexibility
Boliden’s smelters have the ability to pro-cess complex raw materials, which offers competitive advantages and increases revenues while simultaneously increasing freedom of choice when it comes to the raw materials available in the market at any given time. The smelters have continued to develop their processes and technical competence during the year in order to enable further increases in flexibility. At the end of the year, for example, an investment that will increase Harjavalta’s capacity to process nickel in copper concentrate was approved. Boliden is also investing large sums in waste management in order to be able to handle increasingly complex raw materi-als containing impurities.
36 | Boliden Annual Report 2016
BUSINESS AREA SMELTERS

Z I N C S M E L T E R S
Boliden’s smelters process complex raw materials and refine them to produce pure metals. The metal content of the concentrates and recycled material is extracted with the aid of high temperature reactions or by means of leaching.
Underground storage
Metal concentrate
Metal recycling Zinc
RoastingThe concentrate is roasted in a furnace in order to remove the sulphur.
LeachingThe calcine is leached with sul-phuric acid in order to precipitate out iron and extract precious metals.
PurificationThe zinc sulphate solution is puri-fied to remove any copper, cobalt, nickel, and cadmium.
ElectrowinningThe zinc is precipitated out by means of electrowinning.
CastingThe zinc is cast to form zinc ingots with a purity of 99.995%.
Customised products
Boliden’s product portfolio comprises the base metals, zinc, copper and nickel, together with lead, gold, silver and a number of by-products. Boliden also offers a number of different zinc alloys customised in line with different customers’ requirements. The alloys enable the customers to create specific end product properties, cut costs, and increase productivity.
Metals and by-products
Boliden has smelters with dif-ferent processes for different metals, and can consequently maximise the production of metals and by-products from a wide variety of raw mate-rials. An investment in new technology at the Bergsöe lead smelter was approved and will enable plastic com-ponents to be separated out from automotive batteries and sold on the European market.
Treatment
The smelters’ treatment processes are being developed to reduce Boliden’s environmental impact. Stable processes with few stoppages are important in minimising emissions and discharges from production and. Rönnskär is building a new treatment plant for granulation water and a filter for dioxin treatment, while Kokkola is investing in expanding its water treatment capacity. The biggest single ongoing environmental investment is at Harjavalta, where a new sulphuric acid plant is being built.
Underground storage
Underground storage enables sustainable, permanent storage of certain types of waste, thereby enhancing the smelters’ ability to optimise the raw material mix to make use of complex raw materials. At Odda, waste is deposited in rock caverns, while at Rönnskär, construction work is in progress on a storage facility 350m underground which will be in operation in 2020.
Slag
Sulphuric acid plantProcess gases are ducted to the sulphuric acid plant for the production of sulphuric acid and other sulphur products.
Introduction Market Operations Corporate Governance Financial reports
Boliden Annual Report 2016 | 37
BUSINESS AREA SMELTERS

Financial informationRevenues totalled SEK 38,516 m (38,948) and the gross profit excluding revaluation of process inventory was SEK 9,376 m (9,167).
The operating profit, excluding revaluation of process inventory, increased to SEK 2,759 m (2,692). Adjusted for items affecting comparability totalling SEK 107 m, the operating profit excluding revalua-tion of process inventory was slightly lower. Increases in feed volumes and slight improvements in market terms were, however, unable to compensate for increases in costs and depreciation.
Including the inventory revaluation effect of SEK 588 m (−420), the operating profit totalled SEK 3,347 m (2,272). The operating profit was impacted by maintenance shutdowns to the tune of approx. SEK −260 m (−290), due to reduced production and higher costs.
Rönnskär’s improved profit was due to improve-ments in market terms and to increased sales of by-products. The action programme that has been running since 2014 was wound up during the year and yielded the intended effects on the profit at the end of the year. The lower profits at Harjavalta, Kokkola, and Odda were mainly due to a deterioration in market terms. The profit was negatively affected not only by a fall in the price of sulphuric acid, but by a deterioration in treatment charge terms, mainly for the zinc smelt-ers. Bergsöe’s profit increased due to an increase in the price of lead and higher production levels.
The smelters’ operating costs, excluding deprecia-tion, totalled SEK 5,696 m (5,536). Costs increased in local currencies by 3% due, largely, to higher staff overheads and to costs caused by operational disrup-tions. The expansion investment at Odda contributed to the increase in depreciation.
Revenues and operating profit excl. revaluation of process inventory
Key data Operating profitProfit analysis
SEK m 2016 2015
Operating profit 3,347 2,272
Revaluation of process inventory 588 –420
Operating profit excl. revalua-tion of process inventory 2,759 2,692
Change 67
Analysis of change
Volume effect 108
Prices and terms 28
Exchange rate effects 67
Costs (local currencies) –147
Depreciation (local currencies) –22
Items affecting comparability1) 107
Other –6
Change 67
● TC/RC, 46 (47) %
● Free metals, 34 (33) %
● Metal premiums, 12 (14) %
● By-products, 8 (10) %
Breakdown of gross profit excl. revaluation of process inventory
● Energy, 21 (23) %
● Personnel, 24 (23) %
● External services, 15 (16) %
● Consumables and spare parts, 19 (16) %
● Transport, 5 (5) %
● Depreciation & other, 16 (17) %
Breakdown of operating costs
2016 2015
Revenues, SEK m 38,516 38,948
Gross profit excl. revaluation of process inventory, SEK m 9,376 9,167
Operating costs, excl. depreciation, SEK m 5,696 5,536
Depreciation, SEK m 1,026 1,002
Operating profit excl. revaluation of process inventory, SEK m 2,759 2,692
Operating profit, SEK m 3,347 2,272
Investments, SEK m 1,372 1,248
Capital employed, SEK m 17,838 15,878
Return on capital employed, % 20 14
Number of employees, FTE 2,208 2,146
SEK m 2016 2015
Rönnskär 852 727
Harjavalta 704 736
Kokkola 572 739
Odda 314 390
Bergsöe 109 18
1) 2016: Capital gain on the divestment of the alumini-um fluoride operations at Odda (SEK 47 m). 2015: Correction of internal profit calculations within Business Area Smelters (SEK −60 m).
SEK m SEK m
12 13 14 15 160
10,000
20,000
30,000
40,000
0
1,000
2,000
3,000
4,000
● Revenues
Operating profit excl. revaluation of process inventory
Comments
Revenues and operating profit excl. revaluation of process inventory. Adjusted for items affecting comparability totalling SEK 107 m, the operating profit excluding revaluation of process inventory was slightly lower.Breakdown of gross profit. Treatment charges and free metals accounted for 80% of the gross profit excluding revalu-ation of process inventory. Breakdown of operating costs. Operating costs excluding depreciation in local currencies increased by 3%.
●
38 | Boliden Annual Report 2016
BUSINESS AREA SMELTERS

The Business Area’s investments for the year totalled SEK 1,372 m (1,248).
ProductionThe smelters’ copper and lead production increased while gold production remained on par with levels of last year. Zinc and silver production fell.
Rönnskär’s process stability improved and copper production increased slightly. A higher gold metal content in the raw materials resulted in increased gold production, while silver production fell due to changes in the raw material mix.
Harjavalta’s copper and nickel processes were stable, resulting in high feed volumes and healthy produc-tion levels. A more comprehensive maintenance shutdown was conducted in 2015, which partially explains the increase in copper production. 2016 was the first full year of the new business model for nickel
introduced at the end of Q2 2015, and production of nickel matte consequently increased substantially in comparison with last year. The new business model has improved Harjavalta’s position. Changes to the raw material mix resulted in a fall in the production of precious metals.
Kokkola’s zinc production declined as a result of production disruptions in the latter half of the year and lower recovery levels. Silver extraction did, how-ever, increase year on year.
Odda’s zinc production in 2016 was the highest in the smelter’s history and resulted from Odda’s expansion to 200 ktonnes/year. The expansion project is proceeding according to plan.
Bergsöe’s production of lead alloys reached record levels and was largely due to improvements in process stability.
Gold and silverproduction1)
Comments
Production of lead and lead alloysNickel production
Copper production Zinc production
ktonnes ktonnes
12 13 14 15 160
300
600
900
1,200
1,500
0
100
200
300
400
500ktonnes ktonnes
12 13 14 15 160
200
400
600
800
1,000
0
100
200
300
400
500
1) Silver in concentrate at Kokkola is included in the production figures shown as of 2014.
ktonnes ktonnes
12 13 14 15 160
100
200
300
400
0
25
50
75
100kg kg
12 13 14 15 160
5,000
10,000
15,000
20,000
25,000
0
150,000
300,000
450,000
600,000
750,000
0
10,000
20,000
30,000
40,000
50,000tonnes
12 13 14 15 16
Copper. Concentrate feed and copper pro-duction increased at Harjavalta. Concentrate feed decreased at Rönnskär while copper production increased slightly. Zinc. Concentrate feed and zinc production increased at Odda but fell at Kokkola. Nickel matte. Harjavalta’s nickel matte production increased sharply in 2016, which was the first full year with the new nickel business model introduced at the end of Q2 2015.Gold. Gold production increased at Rönnskär and fell at Harjavalta.Silver. Silver production fell at both Rönnskär and Harjavalta. Production of silver in concentrate increased slightly, however, at Kokkola.Lead. Both Rönnskär’s lead production and Bergsöe’s production of lead alloys increased.
● Concentrate feed ● Concentrate feed Metal production Metal production
Metal production, silver
Metal production, gold Lead production
Lead alloys
●●
● Concentrate feed Nickel in matte
●
Introduction Market Operations Corporate Governance Financial reports
Boliden Annual Report 2016 | 39
BUSINESS AREA SMELTERS

Boliden partners with the UN’s Agenda 2030 for the development of new sustainability goals for the future. The sustainability goals are set for both the short and the long term in order to face up to the challenges affecting mines and smelters.
Focus on sustainability
Boliden’s sustainability work is based on its own norms and values and on the UN’s Global Compact. Dialogues with internal and external stakeholders have been used for some years now to ensure that different perspectives are taken into account. Boliden’s stakeholder dialogues in 2016 have been based on the new sustainability goals formulated by the UN and which came into force at the beginning of the year. The responses from employees confirm that health and safety is the most important issue for them, followed by the ability to create value by maximis-
ing metal recovery levels and to promote technical development.
External stakeholders also expect Boliden to focus on our energy efficiency and carbon footprint. The common denominator for all stakeholders is an expectation that Boliden’s innovation and techno-logical development capabilities will benefit both the company and society at large.
In 2017, when many of our existing Group goals are about to expire, Boliden will formulate a new strategic orientation for its sustainability work over the next ten to twelve years.
SUSTAINABLE DEVELOPMENT
Find out more in our GRI Report at www.reports.boliden.com
How Boliden is developing a sustainability strategy for 2018–2030
· Automation· Eco-efficiency· Recycling
· Passion for · improvements· Value chain responsibility· Personal commitment
· Business partners· Investors/owners· Authorities· Neighbours/locals· Landowners· Universities/research· Opinion formers· Consumers
· Employees· Leaders· Group-wide networks
· Gender equality· Clean water· Sustainable energy· Sustainable consumption and production· Ecosystems and biological diversity· Etc.
GLO
BAL
GOALS
Economic impact
Environmental impact
Social impact
External trends Boliden’s values
External stakeholders
Internal stakeholders
UN’s Agenda 2030
40 | Boliden Annual Report 2016

Boliden works to secure tomorrow’s talent pool by offering a safe work environment and conditions that promote good health and career development for every employee. We are also working hard to improve both diversity and gender distribution within the Group.
A safe and secure workplace
Safety is a top priority within Boliden and the Group has an explicit zero tolerance for accidents. A strong safety culture, coupled with proactive risk prevention, will help ensure Boliden’s success.
The number of serious accidents has decreased in most units during the year. The most common forms of incidents or accidents involve people stumbling, falling, or injuring their fingers when working with hand held tools.
In the majority of cases, the person returns to work within a day or so. The accident frequency (LTI) in 2016 was 7.9 (8.9) for Boliden employees, including contractors, corresponding to a year on year improve-ment of 12%.
Increasing the safety of contractors who work in and
around Boliden’s facilities is a high priority issue. Semi-nars and training courses were held in 2016 to improve contractor integration and control, but in December, a fatal accident unfortunately occurred in conjunction with the transportation by a contractor of sulphuric acid between Harjavalta and Kokkola.
Work on behavioural-based safety training courses, increased involvement in safety work by managers, risk analyses, and expanded health and safety inspec-tions, and proactive metrics for the control and fol-lowing up of operations have begun yielding results in some areas of the operations. Boliden’s efforts to create safe workplaces are increasingly focusing on proactive work to prevent accidents before they happen.
EMPLOYEES
The accident frequency has improved.
Boliden’s underground mines have been equipped with wireless positioning systems that can localise machines and employees precisely. This facilitates maintenance work, and increases safety in conjunction with fires and other emergency situations.
Introduction Market Operations Corporate Governance Financial reports
Boliden Annual Report 2016 | 41

Healthy employees Good healt is not just positive for the individual in question, it also promotes Boliden’s success. The increasing sick leave trend was reversed in 2016, and the sick leave rate fell to 4.4% (4.6). Boliden’s health work programme is based on continuous improvement and development. Local conditions will determine the nature of the work, but health-promoting activities such as sponsored exercise in employees’ free time, spinal training, staff canteens that specialise in healthy food, and recurring smoking cessation campaigns are examples on what can be provided. Good health is also about effective rehabilitation measures designed to reduce long-term sick leave.
Securing tomorrow’s talent pool Boliden’s ability to attract, develop and retain employees with the right skill sets and commitment levels is vital for our competitiveness and is conse-quently a top priority.
Our competence development and recruitment work is based on both Boliden’s needs and the Group’s strategic goals of promoting diversity and equal opportunities. The challenges we face include the fact that this is a male-dominated industry that operates in regions with a limited recruitment base, coupled with the stiff competition for engineers with specialist training. Boliden’s operational units consequently all have their own strategic recruitment plans.
Efforts to improve awareness of Boliden amongst students at universities and colleges of further educa-tion continued during the year in order to help grow the recruitment base. In 2016, Boliden advanced to 33rd place in the “Nordic’s Most Attractive Employ-ers” survey of engineering students by the employer branding company, Universum. Boliden’s efforts to clarify its Employer Value Proposition also continued, and largely involved clarifying what we have to offer, such as sustainable development, a life-work balance, technical innovation, and personal learning and devel-opment in the workplace.
Employee developmentBoliden’s staff turnover rate during the year was 5.9% (4.3). Low staff turnover rates help create stability but, at the same time, demands internal career and skill development in order to ensure that employees will stay with Boliden and enjoy job satisfaction. Boliden has a number of internal programmes designed to create the preconditions for career and skill develop-ment. Encouraging mobility within the Group and prioritising internal recruitment for the talent and managerial pool also generates career opportunities for existing employees. Meetings with management, known as Talent Forums – designed to identify talents and offer skill development with a view to improving leadership ability – are held every year.
Diversity and equal opportunities Diversity leads to dynamism, creativity and, ultimate-ly, to greater profitability. Boliden endeavours to en-sure its workforce is made up of people with different backgrounds, ages, and experiences. During the year Boliden continued to work with the Swedish Public Employment Service to identify solutions for refugees with academic backgrounds. Attracting female employees to a traditionally male-dominated industry is a challenge for Boliden, but our target is for at least 20% of the workforce to be made up of women by the end of 2018. By the end of 2016, the percentage was 17.8% (17.8). It is worth noting that amongst Boliden’s so-called top 100 managers, the percentage of female employees is higher, at 26%.
My Opinion Boliden offers a work environment that ensures a work-life balance as a prerequisite for successfully attracting and retaining talented employees. It is im-portant to create an organisation in which employees have the skills, the will, and the ability to develop. The My Opinion employee survey is carried out every other year and measures Boliden’s performance. The results from 2016 showed that the work situation, expressed in parameters such as job content and job satisfaction, had improved slightly since the previous survey in 2014. The dialogue between managers and employees has also improved, as well as management’s involvement in safety at the workplace.
Boliden’s offering
InnovationSustainability
A work-life balance
Learning
Number of employ-ees (FTE) 2016. An increase from last year’s 4,878.
5,477
What Boliden offers its employees
42 | Boliden Annual Report 2016
EMPLOYEES

Boliden’s goal is for the sick leave rate to be 3% or less by 2018. The Odda smelter in Norway saw the sick leave rate increase in 2015 and the smelter decided that focused efforts aimed at bringing about an improve-ment was required.
“We started by following up on every employee who had more than 10 days of sick leave,” says Odda’s Administrative Manager, Ranveig Capjon. “The First Line Managers and HR meet every month to review all of the cases and put measures in place. These measures are then followed up at the subse-quent meeting.”
Boliden has a toolbox of measures avail-able for use in this field: preventative safety work is very important, and Boliden also provides both safety equipment and training in safety issues.
“We try to create job satisfaction and en-courage good management, close coopera-tion on important issues, and a good work-life balance, in order to reduce stress-related illnesses. We also encourage exercise and are trialling the use of a diet and exercise coach within the Group,” says Ranveig.
If an employee falls ill, Boliden can make adjustments to shift times, duties, and equipment.
“The First Line Managers have an impor-tant part to play and we support them by pro-viding training in psychology, communication, regulations, etc.,” continues Ranveig.
And thanks to these focused efforts, Odda has managed to halve its sick leave rate over the course of just one year.
“We are delighted by the results and would like to thank our committed employees who have made this possible,” says Ranveig.
Boliden is in the middle of a generation shift and has a growing need for skilled employees. Our ambition is to have employees with diverse backgrounds, experiences, ages and gender.
Boliden’s exploration department is a con-crete expression of this aim, with some 130 geologists, geophysicists, field technicians, development engineers, geodata technicians, etc., all working together to secure the availa-bility of new deposits. These employees come from 13 different countries, have an average age of 40, and 29% of the workforce is made up of women.
“The diversity helps ensure a real breadth of knowledge and experience when it comes to bedrock, Mineral Resources, and methodol-ogies. Diversity also creates an inspirational work environment and a more pleasant working climate,” says Jonas Wiik, Boliden’s Exploration Manager.
Boliden attracts skilled employees by partic-ipating in a variety of trade fairs worldwide and in labour market days at universities and high schools.
“We want to show both students and indus-try people that Boliden is a company at the leading edge of development, and that with us, they will get both a good working environment and a good work-life balance,” says Jonas.
Shawn Dempsey from Canada is a good example of this. Shawn had previously worked as a geophysicist in Canada, but was keen to work abroad in order to expand his experi-ence of base metal exploration with a major mining company. He has now been working for Boliden for 3.5 years and is responsible for geophysics in the Boliden Area and Ireland.
Focused efforts have cut the sick leave rate at Odda
A whole world together in the exploration department
Find out more in our GRI Report at www.reports.boliden.com
82% (82%)
18% (18%)
Percentage of male and female employees in 2016
R A N V E I G C A P J O N J O N A S W I I K
Introduction Market Operations Corporate Governance Financial reports
Boliden Annual Report 2016 | 43
EMPLOYEES

Boliden’s operations make use of land, consume large amounts of energy, and can have an impact on the surrounding area. Boliden consequently has a far-reaching responsibility to limit its environmental impact at every stage in the value chain, including reclamation work when a mine is decommissioned.
Active environmental work
Boliden’s environmental agenda Environmental sustainability is a prerequisite for successful mines and smelters. Boliden endeavours to use the best available environmental technology deve-loped both in-house and in partnership with leading technology suppliers. We allow equipment suppliers to use Boliden as a reference when rolling out technical solutions to others in the industry. Environmental improvement measures account for a comparatively large share of Boliden’s capital investments, and the Group always evaluates the environmental benefit in relation to the economic input in order to prioritise the best projects. Boliden makes investments that yield substantial environmental benefits relative to the input, irrespective of external requirements, as part of our efforts to be an industry leader in this field.
Boliden’s environmental impact The operations require energy and this gives rise to direct or indirect carbon dioxide emissions. Boliden’s metals are, however, crucial in terms of the switch to tomorrow’s energy systems that are based on renew-able energy. Solar and wind power both demand major upgrades to electricity transmission and energy storage, driving the need for copper and zinc. Electric vehicles and other forms of transition away from fossil fuels to renewable energy also require large amounts of copper. The manufacture of metals for these types of use leads, in many cases, to net savings in green-house gas emissions. Mines can have a negative impact on the surroundings in the form of discharges to water, dust, noise and changes in the landscape. The effects of mines and smelters are most pronounced in
the immediate vicinity of the operations, but some effects are felt across wider regions in the form of, for example, acidification and increased eutrophication. Boliden places considerable emphasis on the treat-ment and control of discharges, energy saving, waste management and recycling issues. Value generation from our own by-products and waste products, and those of other companies, help create a more circular economy. Waste and spillage are always minimised in order to ensure optimum resource utilisation.
Water management and dam safetyBoliden’s operations require large amounts of water. The primary environmental impact of discharges to water lies in the risk that the affected bodies of water and their beds are contaminated by foreign substances that may disturb their natural balance. By reusing the water and returning it to the processes, Boliden is able to reduce both its water withdrawal and its discharges.
Boliden is responsible for around 40 dam facilities that were either previously used, or are currently being used, to store tailings sand or other waste and for water processing. Boliden endeavours to minimise the impact it has on the surrounding area, both when developing dams, and during and after the dams’ operating lives. Boliden complies with the mining industry’s dam safety guidelines (GruvRIDAS) and supports the dam safety policy of the Swedish mining industry organisation, SveMin.
Forestry and land management Access to land is fundamental in terms of Boliden’s ability to carry out exploration and conduct mining operations. In order to promote environmentally responsible and economically sustainable use of its 20,000 hectares of forest, Boliden’s forestry is FSC (Forest Stewardship Council) certified which ensures that economic, environmental and social responsibili-ty is applied to all aspects of the forestry operations.
Boliden aims in conjunction with all forestry-re-lated activities, transportation and other activities in conjunction with it, to use input goods and consum-ables that are environmentally friendly and recycla-ble. Boliden has, on its own initiative, designated about 10% of its productive forested land as nature conservation areas, which is more than required for certification.
Boliden’s carbon dioxide intensity is shown in tonnes CO2 per tonne of metal produced at each production unit. The carbon dioxide intensity is lower today than five years ago.
0.69
44 | Boliden Annual Report 2016
ENVIRONMENT

Boliden processes numerous waste products in order to create saleable products and to minimise the amount of waste sent to landfill. Mines and smelters generate waste comprising waste rock, tailings sand, slag, sludge and dust. Mine waste is normally handled within the producing unit, while smelter waste is either sent to internal or external landfills or for recycling.
Waste
Description of the environmental impact
Events during the year
• Construction of a deep storage facility for hazardous waste under Rönnskär continued in 2016. Construction work will be completed in 2020. • A landfill facility for waste is being built at Harjavalta.• The Skåne County Council decided to limit Bergsöe’s storage and processing of large quantities of waste products. These quantities have been reduced, and the prohibition was lifted by a court ruling, although this has since been appealed. • Local authorities have classified Rönnskär’s slag product, iron sand, as waste, which has clearly reduced its market. Boliden has contested this ruling and is now seeking a solution whereby slag products can be used in society to reduce the need for rock quarrying in conjunction with building and road construction, for example.
Find out more in our GRI Report at www.reports.boliden.com
Energy and Greenhouse gases
Other emissions to air
Discharges to water
Land use and biological diversity
Boliden’s most significant emissions to air comprise dust and sulphur dioxide from the smelters’ process gases. Some diffuse emis-sions of dust arising from open materials hand-ling, for example, are also generated. Boliden tracks emissions of metals to air particularly closely and aims to reduce them over time. Sulphur dioxide contributes to acidification and reducing these emissions is an important goal for Boliden.
Mining and smelting processes consume large amounts of energy. Boliden shall reduce its dependence on fossil fuels by using renewable and/or recycled energy wherever possible. Boliden’s carbon dioxide intensity shall be re-duced through increases in process efficiency and increased electrification.
The establishment of new mines and expansion of existing operations requires land utilisation. The physical impact on areas of land is often substantial, but Boliden’s goal is to reduce the impact on biological diversity.
Boliden’s discharges to water primarily com-prise metals and nitrogen. 84% (86) of the discharges of metal come from the smelters, while the mining operations account for 85% (83) of Boliden’s nitrogen discharges. Retur-ning water to the processes reduces both water withdrawal and discharges.
• Rönnskär is investing in dioxin treatment in order to reduce emissions. • Kokkola has installed a new converter in order to reduce SO2 emissions. • Kokkola has begun installing an electrofilter that will reduce dust emissions.• Investment in a new sulphuric acid plant that will reduce SO2 emissions has begun at Harjavalta.
• Surplus heat at the smelters is used to reduce carbon dioxi-de emissions. It is estimated that 612 GWh (588) were used internally in 2016, with a further 877 GWh (898) supplied to external providers. • Renewable fuels are increasingly used in road transports, reducing the need for fossil fuels. • Bergsöe is building a facility for separating plastics out from raw materials and reducing carbon dioxide emissions.
• As of 31 December 2016, Boliden owns and/or controls 22,600 hectares of land in the vicinity of existing or previous operations and in areas of interest for exploration.• Boliden works with ecological compensation, e.g. at Aitik.
• Discharges of metals at Rönnskär have been reduced in 2016 through the use of new treatment techniques for granulation water. • Clearer quality goals for water discharged to recipients are being drawn up in order to control water management and reduce the risk of unplanned discharges.
Introduction Market Operations Corporate Governance Financial reports
Boliden Annual Report 2016 | 45
ENVIRONMENT

Recycling metals
Boliden is one of the leading companies in the world when it comes to recycling electronics from scrap telephones and computers and is one of Europe’s big-gest recyclers of automotive batteries and the Group also processes a number of intermediate and waste products from the smelters in order to maximise me-
ZINC SMELTER
ODDA
LEAD SMELTER
BERGSÖE
ZINC SMELTER
KOKKOLA
COPPER AND NICKEL SMELTER
HARJAVALTA
SOCIETY’S ELECTRONICS USERS
WASTE PRODUCTS FROM OTHER INDUSTRIES
SOCIETY’S LEAD BATTERY USERS
COPPER AND LEAD SMELTER
RÖNNSKÄR
Metal-bearing slag
Zinc clinker
Antimony slag
Matte, slag
Blister copper
Electronic scrap from mobile phones,
computers, electronic goods, etc.
Metal scrap, ashes, filters, dust
Lead scrap and plastic from car batteries, etc.
Lead-bearing filter dust
Zinc-bearing filter dust
THE BOLIDEN AREA
ODDA
ODDA
KOKKOLA
BERGSÖE
RÖNNSKÄR
RÖNNSKÄR
BERGSÖE
RÖNNSKÄR
RÖNNSKÄR
Increased metal recovery levels through slag concentration
Zinc production
Final storage in mountain caverns
Lead sludge RÖNNSKÄR Lead production
Copper-bearing waste products
HARJAVALTA Copper production
Zinc production
Antimony-lead alloy production
Lead production
Used as cooling scrap in copper production
The metal content is recycled and new lead products produced. As of 2017, plastic will also be recycled.
The metal content is recycled and new metal products produced
The metal content is recycled and new metal products produced
tal recovery levels. Synergies are achieved by directing materials to the facilities with the best technology for handling them. Any waste products sent to other countries are subject to legislation governing exports for landfill or recycling purposes. See also page 50.
O P E R A T I O N S I N T E R M E D I A T E P R O D U C T S R E S U L T S
46 | Boliden Annual Report 2016
ENVIRONMENT

Reclamation of land
For Boliden, reclamation of mining areas that are approaching the end of their lifespan is an ongoing process that is constantly under development. Boliden is collaborating with several research projects regarding the reclamation of sulphide-bearing materials and different types of ground and water covering. Ecological compensation and the preservation of biological diversity are high priorities. The goal is to use the best available technology and to document and follow up on the work carried out.
Boliden has a reclamation responsibility for some 30 active and decommissioned mines and conducts systematic monitoring and risk assessments for every object. Reclamation work has been carried out during the year at Gillervattnet (the Boliden Area) and in Laver (decommissioned operation), amongst others. At the end of 2016, a total of SEK 2,873 m (1,943) had been allocated for the reclamation of mining areas and smelters.
Permits and operations: Boliden provides the authorities with financial security, guarantee-ing reclamation, in conjunction with the licensing process for a mine, and makes provisions throughout the lifespan of the mine. Boliden conducts its operations in a way that facilitates reclamation and, where possible, initiates reclamation work while the mine is still operational.
Reclamation planning: Boliden evaluates reclamation methods to determine those most suit-able, both in conjunction with the mine’s licensing process and while the mine is operational, produces environmental impact assessments, and draws up reclamation plans. The goal is for the reclamation work to last for a very long period of time indeed – over 1,000 years.
Reclamation: Waste from mining operations comprises waste rock and tailings sand, which contain elevated levels of sulphides. The challenge, during reclamation, is to prevent oxygen from the air from reaching the waste rock and the tailings sand and thereby prevent weathering and the formation of acidic water. The reclamation work is carried out using a variety of methods, depending on local conditions, as illustrated below.
Monitoring: Boliden monitors and follows up on the area over an extended period of time, at least 30 years, after reclamation work was completed, in order to be sure that the reclamation is working and to be able to react quickly if problems arise. Once Boliden has demonstrated that the reclamation has achieved its objective, the financial security is refunded to the company.
1.
2.
3.
4.
E N H A N C E D C O V E R A G E E L E V A T E D G R O U N D W A T E R L E V E L W A T E R C O V E R A G E
Natural area
Waste rock and contaminated substances
Covering layer
Protective layer
Wetlands Lake
Waste rock and contaminated substances
Waste rock and contaminated substances
Groundwater
Moraine/peat, etc.
Protective layer Water
Introduction Market Operations Corporate Governance Financial reports
Boliden Annual Report 2016 | 47
ENVIRONMENT

Boliden plays an important role in the communities and regions in which the Group’s mines and smelters are located. Good relationships and mutu-al understanding are important components of our ability to conduct and develop our operations.
A significant player in society
Boliden is a stable business enterprise in a volatile market.
Around four indirect job opportunities are created for every one Boliden employee.
Boliden employee
Job opportunities
I N D I R E C T J O B C R E A T I O ND I R E C T J O B C R E A T I O N
0
1,000
2,000
3,000
4,000
5,000
6,000
0
1,000
2,000
3,000
4,000
5,000
6,000SEK m FTE
0807 1009 11 12 13 161514
1) Calculations of job creation exclude Kevitsa and its suppliers which were only included as of the latter half of 2016.
Operating profitNumber of employees (FTE)
Boliden’s job creationBoliden is the biggest employer in many of the com-munities in which we operate. Boliden has a total of 5,500 employees in eight countries, who are directly employed by the Group. The cyclic sensitivity of the industry notwithstanding, Boliden has enjoyed stable employment rates over several economic cycles.
Many of Boliden’s employees live in the vicinity of the workplace and the company consequently has a considerable impact on local employment levels and local trade and industry by generating increased pur-chasing power and providing a critical base for impor-tant social services. Boliden contributes to the creation of more than 25,300 job opportunities1), either directly or indirectly, through its subcontractors, suppliers, or the effect of its employees’ expenditure. This means that for every one Boliden employee, an estimated four other jobs are created as a result of our operations. For additional details of job creation and other indirect economic impact, see Boliden’s GRI Report.
Promoting the interests of local communities and maintaining good relationships with employees, neighbours, authorities and business partners is an important part of what it means to be a responsible
company and also facilitates our efforts to attract a skilled workforce and to develop our operations.
Contributing to tax revenuesBoliden also contributes to tax revenues in the regions in which the Group operates. The tax cost in 2016 totalled SEK 1,135 m, corresponding to a tax rate of 21.1%, but Boliden’s direct tax expenditure also in-cludes social security contributions, property tax, fuel tax, and VAT. Boliden’s total contribution to public finances through taxes (direct, indirect, and induced) is estimated at SEK 11.5 billion.
Local sponsorships and partnershipsLocal involvement in the form of support for and partnerships with voluntary organisations and associa-tions are other ways in which Boliden can make a pos-itive contribution in the areas in which the company operates. Boliden’s support focuses primarily on local sporting and cultural events, schools and hospitals, of-ten with links to children and young people. In 2016, Boliden’s units sponsored local activities to the tune of approximately SEK 7 million.
48 | Boliden Annual Report 2016
SOCIETY

The world’s first electric road for heavy trucks on public roads was opened in June 2016. A 2 km long stretch of the E16 highway outside Sandviken is the subject of the trial, which will run over a two year period.
Transporting freight to and from the Garpenberg mine will be possible via the electric road during the trial period. Boliden regards reducing its fuel con-sumption as a priority, in order to reduce its carbon footprint. One way of doing this is by increasing the degree of electrification of transports, both those inside Boliden’s mining and industrial park areas, and
those that use public roads to ports and terminals. The electric road project outside Sandviken will pro-vide valuable knowledge for Boliden’s future ventures in this field.
Operators responsible for road upkeep, equipment suppliers, haulage firms, companies who transport goods by road, and authorities are all involved in the electric road project, which is being coordinated by Region Gävleborg. The principal financiers are the Swedish Transport Administration, the Swedish Energy Agency, Vinnova, Scania and Siemens.
km of road have been electrified
companies, authorities and organisations are working in partnership on the project
is the date by which the Swedish vehicular fleet shall be independent of fossil fuels
Boliden on the world’s first electric road
Introduction Market Operations Corporate Governance Financial reports
Boliden Annual Report 2016 | 49

Boliden’s ambition is to be a responsible and credible business partner. Boliden buys raw materials, energy, services and equipment and since 2010, has a process designed to improve control of our supply chain and to increase transparency in the value chain.
Responsible business
Evaluation of business partnersBoliden’s business partners are evaluated with regard to commercial and sustainability aspects based on the 10 principles of the UN’s Global Compact and on ILO and ISO standards. Our Code of Conduct lays down principles and norms for responsible business. The same principles apply to all commercial relation-ships, whether Boliden is the buyer or the seller of raw materials, products and services.
Boliden’s suppliers comprise both those who supply raw materials, and those who supply other goods and services. The majority of Boliden’s copper is sold to industrial customers in Europe, primarily to manufacturers of copper wire, copper rods, and cop-per alloys. Boliden’s zinc is mainly sold to producers of galvanised sheet and other galvanised products, and to the alloys industry. Boliden also, in addition to its base metals, sells a range of by-products in bulk to industrial customers.
Trading in materials and wasteBoliden complies with national legislation and international guidelines such as the OECD guidelines
for trade in materials, waste and hazardous waste. For some years now, Boliden has, in order to avoid the risk of dumping hazardous waste, been implementing a strict internal policy regarding such transactions whereby payment is not made until the waste process-ing operator produces documentation demonstrating that the material has been processed.
No conflict mineralsBoliden’s policy is that no concentrates or secondary raw materials shall be acquired from areas of armed conflict. The secondary raw materials are, however, more difficult to control, as metals may have been recycled multiple times and may have been passed through several links in the supply chain before reach-ing Boliden’s smelters.
Boliden’s smelters are included in the “The London Good Delivery list of Acceptable Refiners”. Boliden must, in order to ensure its continued inclusion in the London Bullion Market Association’s (LBMA) list of recommended gold producers, ensure that the raw materials chain complies with a number of ethical criteria and with stringent transparency requirements. Boliden’s reporting to the LBMA is verified by KPMG.
2016In 2016, Boliden’s purchasing and sales staff have completed training courses in business ethics, social justice, and environmental issues that affect our supply chain. An improved methodology and system support mechanism have been introduced in order to further enhance the efficiency of the supplier evaluation process. Just over 100 business partners completed a self-evaluation process, which is a tool used to evaluate the work in areas that Boliden has identified as being of particular importance. The aim is to develop and improve the sustainability work of all parties.
On-site visits and audits are carried out in special cases and any deviations and measures implemented are followed up. A total of 11 (19) such visits were carried out during the year, 5 (3) of which were audits. Business partners that fail to live up to our require-ments are expected to draw up an action plan showing how these requirements will be met in future.
50 | Boliden Annual Report 2016
BUSINESS PARTNERS AND PURCHASING

Category Description and market trends
Boliden’s price trend, 2016
Services The market development for services follows the inflation in the countries in question.
Continued consolidation and focus on improved contractor safety, increased competition and contract compliance.
Bulk goods & chemicals
The category is largely steered by market indices. Prices have fallen for chemicals, explosives, and input goods, but petrochemical product prices rose once more towards the end of the year.
Boliden has benefited from long-term contracts in areas experiencing upturns. Good competition for lime and explosives, for example, has resulted in considerable reductions in costs.
Electricity The price of electricity is driven by electricity consumption, availability of hydroelectric and nuclear power, the price of coal, emissions trading, transfer capacity, and taxes and political decisions.
Higher network tariffs and taxes have contributed a negative cost trend, but at the same time, renewable electricity production has been subsidised. Overall, the price of electricity has fallen.
Logistics The price of transport services has generally fallen due to lower fuel prices and excess capacity. Railways have opened up to competition in Finland, but the full effect of this has not been noticed in 2016.
Road and maritime transport costs have fallen as a result of lower fuel prices. An imbalance in the road transportation sector in Europe, coupled with the increase in intermodal transports (road/rail) have resulted in falling costs and a reduced environme-ntal footprint for Boliden’s transports.
Indirect materials & services
Manpower, travel, cleaning/decon-tamination, and consultancy services are affected by wage trends in the respective countries. Unchanged market prices and good competition.
Procurement of temporary person-nel, security services, and corporate health care schemes have generated a lower cost level overall within the category.
IT & Telecoms Costs are driven by technological de-velopment and competition. The price trend for hardware is falling, but the cost of services is relatively stable.
Costs have been affected by Boliden’s technology decisions and the conso-lidation of IT systems. There was a clear downwards price trend in 2016, driven by good specifications and market trends.
Fixed equipment
Orders received by suppliers, prima-rily in the mine-related equipment sector, at low but stable level. Conti-nued improvement regarding supplier consolidation.
Slightly lower costs and advantageous lead times during the year. Extensive focus on long-term agreements to increase quality and availability.
Mobile equipment
Orders received by suppliers at low level. This has resulted in increased competi-tion and advantageous pricing.
Low raw material prices and good competition resulted in an unchanged price level for Boliden.
Tools & consumables
Regional supplier base. Unchanged price trend driven by low raw material prices.
Group-wide contracts for the range in this category contribute to competitive purchasing prices.
Electrical installations & equipment
Long-term supplier relationships with installed base. The market is balanced.
Pricing picture unchanged. Suppliers who have failed to meet Boliden’s work environment and CSR requirements have been shed during the year.
Boliden has, after the integration of the Finnish mines, a total of 7,300 suppliers, 200 of which account for 80% of the purchasing volume. The purchasing volume, excluding concentrate purchases, totalled SEK 12.3 billion, with Mines accounting for 56% (55) of the total purchasing volume and Smelters for 44% (45). Purchasing prices fell slightly overall for the Group in 2016, despite a sharply rising USD. The effects of the fall in the price of petrochemical products is now being noticed, and the efforts to increase competition and consolidation have had a substantial impact.
Boliden’s purchasing volume is divided into strategic categories. Efficient work on contracting as much of the purchases as possible and on securing valid agreements made 2016 a peak year in terms of purchase volume addressed. The Finnish mines’ suppliers have been integrated into Boliden’s overall supplier base, resulting in significant synergies. Other focus areas inclu-ded shortened lead times, delivery performance, and the development of supply operations.
P U R C H A S I N G C A T E G O R I E S
Introduction Market Operations Corporate Governance Financial reports
Boliden Annual Report 2016 | 51
BUSINESS PARTNERS AND PURCHASING
● SEK, 49 (50)%
● EUR, 43 (41)%
● NOK, 5 (4)%
● USD, 2 (4)%
● Other, 1 (1)%
Purchasing volume by currency
Purchasing volume by category
● Services, 25 (23)%
● Bulk goods & chemicals, 15 (16)%
● Electricity, 14 (16)%
● Logistics, 13 (13)%
● IM&S, IT and other, 9 (6)%
● Fixed equipment,9 (9)%
● Mobile equipment, 7 (11)%
● Tools and consumables, 4 (4)%
● Electrical installations & equipment, 3 (2)%

The Boliden share is listed on Nasdaq Stockholm in the Large Cap segment. The share price rose by 66% during the year and consequently outperformed the Stockholm Stock Exchange.
Share trend
Trading in the Boliden share A total of 1.5 b Boliden shares with a total value of SEK 240 b were traded in all marketplaces in 2016.
Nasdaq accounted for 42% of the trading in the Boliden shares. A total of 621 m (690) Boliden shares at a value of SEK 100 b (107) were traded at Nasdaq Stockholm during the year. An average of 2.5 m (2.7) shares were traded per trading day on Nasdaq Stockholm. The Boliden share accounted for 2.6% (2.5) of the total volume of shares traded on Nasdaq Stockholm.
The largest marketplace after Nasdaq was Bats Europe, which accounted for 26% of the trading in the share.
Price trend and dividendThe price of the Boliden share rose by 66%, in contrast to the OMX Stockholm 30 index and the Euromoney Global Mining Index in SEK, which rose by 5% and 72%, respectively. Healthy production, coupled with a favourable metal price and exchange rate trend, con-tributed to the share’s performance in 2016.
At the end of 2016, the Boliden share was quoted at
SEK 237.90 (142.90) on Nasdaq Stockholm, corre-sponding to a market capitalisation of SEK 65.1 b (39.1). In common with other raw materials compa-nies, the variation in the value of the Boliden share is, on average, greater than for the broad stock market indices. The beta value of the Boliden share over the last five years against OMXSPI is 1.43.
The Board of Directors proposes to the Annual General Meeting that a dividend of SEK 5.25 (3.25) per share be paid for 2016, which is in line with Boliden’s dividend policy. The proposed dividend cor-responds to 33.9% (33.7) of the net earnings per share and a dividend yield of 2.2% (2.3), calculated on the basis of the share price at the end of the year.
The Boliden share’s total return (the sum of the div-idend paid and the price trend) over the most recent 10-year period was, on average, 7% per annum.
Share capitalThere are a total of 273,511,169 Boliden shares. Every share has a nominal value of SEK 2.12 and the share capital totals SEK 578,914,338. Boliden’s share capital comprises a single class of share in which
THE BOLIDEN SHARE
Share price, sector index, and Nasdaq Stockholm The price of the Boliden share rose by 66%, in contrast to the OMX Stockholm 30 index and the Euromoney Global Mining Index in SEK, which rose by 5% and 72%, respectively.
SOURCE: THOMSON REUTERS DATASTREAM
Share price, sector index, and Nasdaq Stockholm
2007 2008 2009 2010 2011 2012 2013 2014 2015 20160
100
50
150
200
250
300index number of shares, million
0
100
50
150
200
250
300
BolidenEuromoney Global Mining, SEKOMX Stockholm 30 (OMXS30)Number of shares traded per month
52 | Boliden Annual Report 2016

THE BOLIDEN SHARE
every share has the same voting power and grants the same entitlement to dividends. The Boliden Articles of Association contain no provisions restricting the right to transfer shares or any limitations with regard to the number of votes that a shareholder can exercise at General Meetings of the company’s shareholders. Boliden does not hold any of its own shares, nor has it issued any shares in 2016.
Boliden is unaware of any agreement between shareholders that may entail restrictions on the right to transfer shares in the company. Boliden is not party to any significant agreement affected by any public buyout offer. Boliden has no shareholders who have declared that they, either directly or indirectly, repre-sent at least one tenth of the total number of votes for all shares.
Ownership structureBoliden had 69,048 (71,337) shareholders on 31 December 2016.
Approximately 67% (70) of the shares were owned by foreign shareholders. The ten biggest single share-holders represent 27.7% of the share capital.
Boliden’s employees hold shares, via profit sharing foundations, for which voting rights cannot be direct-ly exercised. The foundations held 249,792 (376,062) shares at the end of the year.
● Foreign owners, 67 %
● Swedish fund management companies, 13 %
● Other Swedish legal entity owners, 10 %
● Swedish natural person owners, 10 %
● Sweden, 33 %
● USA, 28 %
● UK, 15 %
● Norway, 6 %
● Other, 18 %
Trading in different market-places. The Boliden share is traded in a number of market-places. 42% (46) was traded on the Nasdaq exchange.
Ownership per country . The percentage of foreign-owned shares decreased slightly during the year and totalled approxi-mately 67% (70) at the end of the year.
Ownership by country Ownership by category
● Nasdaq, 42 %
● Bats Europe, 26 %
● LSE Group, 13 %
● BOTC, 9 %
● Other, 10 %
Trading in different marketplaces
SO
UR
CE:
MO
NIT
OR
, M
OD
ULA
R F
INA
NC
E A
B
Distribution of Boliden shares on 31 December 2016
ShareholdingNumber of
shareholdersNumber of
shares Holding, % Votes, %
1 – 100 33,664 1,397,308 0.5 0.5
101 – 500 22,131 6,612,632 2.4 2.4
501 – 1,000 6,874 5,792,006 2.1 2.1
1,001 – 10,000 5,509 14,984,656 5.5 5.5
10,001 – 50,000 511 11,451,196 4.2 4.2
50,001 – 359 233,273,371 85.3 85.3
Total 69,048 273,511,169 100.0 100.0
Boliden’s biggest owners on 31 December 2016
Percentage of capital and votes, %
Norges Bank 5.1
BlackRock 5.0
Vanguard 3.3
AMF Försäkring & Fonder 2.8
Swedbank Robur Fonder 2.8
SEB Fonder incl. Lux 2.0
JP Morgan Asset Management 1.8
Söderbloms Factoringtjänst AB 1.7
Invesco 1.7
TIAA – Teachers Advisors 1.5
Total 27.7
The share in brief, 2016
Marketplace Nasdaq Stockholm
Short name BOL
ISIN code SE 0000869646
ICB code 1700
Highest price paid SEK 258.20
Lowest price paid SEK 100.00
Closing price SEK 237.90
Market capitalisa-tion, 31 Dec. SEK 65.1 b
Turnover rate 213%
Number of shares 273,511,169
Beta value (5 years) 1.43
Annual total shareholder return on 31 December 2016 1 year 3 years 5 years 10 years
Boliden 70% 37% 22% 7%
OMX Stockholm 30 9% 8% 13% 7%
Euromoney Global Mining, SEK 75% 4% –4% 1%
The average total shareholder return on the Boliden share over the past 10 years was 7% per annum and 99% for the period as a whole. Boliden’s annual total shareholder re-turn has outperformed the OMX Stockholm 30 in the one-, three-, and five-year periods. The annual total shareholder return has, furthermore, outperformed the international mining index in all of the three-, five-, and ten-year periods, but underperformed it in the one-year period. SOURCE: THOMSON REUTERS DATASTREAM
SOURCE: MONITOR, MODULAR FINANCE AB HOLDINGS
SOURCE: MONITOR, MODULAR FINANCE AB. THE VERIFICATION
DATE MAY VARY FOR CERTAIN SHAREHOLDERS.
SOURCE: NASDAQ
Shareholder information on the website Boliden’s website, www.boliden.com, provides information on Boliden, the performance of the Boliden share, metal prices and currencies, financial reports, a list of the analysts who cover Boliden, and details of how to contact Boliden. Presentations of Interim Reports and capital market days are also available on the website.
Introduction Market Operations Corporate Governance Financial reports
Boliden Annual Report 2016 | 53
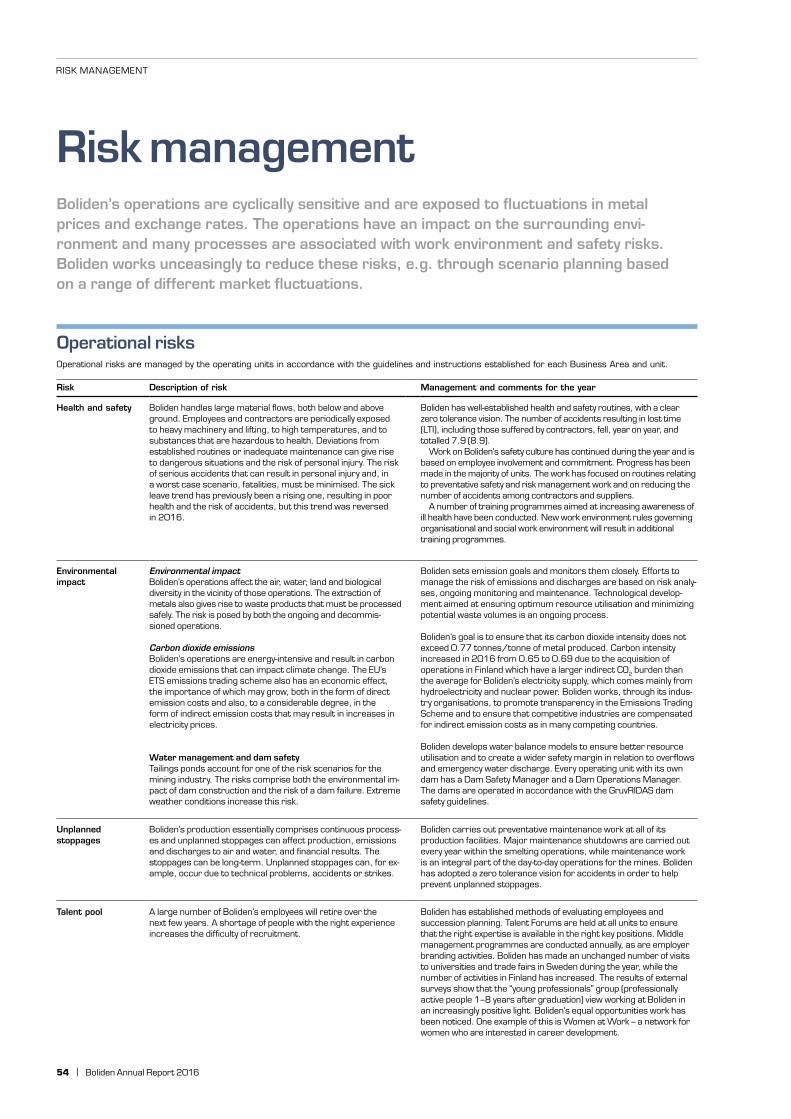
Boliden’s operations are cyclically sensitive and are exposed to fluctuations in metal prices and exchange rates. The operations have an impact on the surrounding envi-ronment and many processes are associated with work environment and safety risks. Boliden works unceasingly to reduce these risks, e.g. through scenario planning based on a range of different market fluctuations.
Risk management
Operational risks are managed by the operating units in accordance with the guidelines and instructions established for each Business Area and unit.
Risk Description of risk Management and comments for the year
Health and safety Boliden handles large material flows, both below and above ground. Employees and contractors are periodically exposed to heavy machinery and lifting, to high temperatures, and to substances that are hazardous to health. Deviations from established routines or inadequate maintenance can give rise to dangerous situations and the risk of personal injury. The risk of serious accidents that can result in personal injury and, in a worst case scenario, fatalities, must be minimised. The sick leave trend has previously been a rising one, resulting in poor health and the risk of accidents, but this trend was reversed in 2016.
Boliden has well-established health and safety routines, with a clear zero tolerance vision. The number of accidents resulting in lost time (LTI), including those suffered by contractors, fell, year on year, and totalled 7.9 (8.9).
Work on Boliden’s safety culture has continued during the year and is based on employee involvement and commitment. Progress has been made in the majority of units. The work has focused on routines relating to preventative safety and risk management work and on reducing the number of accidents among contractors and suppliers.
A number of training programmes aimed at increasing awareness of ill health have been conducted. New work environment rules governing organisational and social work environment will result in additional training programmes.
Environmental impact
Environmental impactBoliden’s operations affect the air, water, land and biological diversity in the vicinity of those operations. The extraction of metals also gives rise to waste products that must be processed safely. The risk is posed by both the ongoing and decommis-sioned operations.
Carbon dioxide emissionsBoliden’s operations are energy-intensive and result in carbon dioxide emissions that can impact climate change. The EU’s ETS emissions trading scheme also has an economic effect, the importance of which may grow, both in the form of direct emission costs and also, to a considerable degree, in the form of indirect emission costs that may result in increases in electricity prices.
Water management and dam safetyTailings ponds account for one of the risk scenarios for the mining industry. The risks comprise both the environmental im-pact of dam construction and the risk of a dam failure. Extreme weather conditions increase this risk.
Boliden sets emission goals and monitors them closely. Efforts to manage the risk of emissions and discharges are based on risk analy-ses, ongoing monitoring and maintenance. Technological develop-ment aimed at ensuring optimum resource utilisation and minimizing potential waste volumes is an ongoing process.
Boliden’s goal is to ensure that its carbon dioxide intensity does not exceed 0.77 tonnes/tonne of metal produced. Carbon intensity increased in 2016 from 0.65 to 0.69 due to the acquisition of operations in Finland which have a larger indirect CO2 burden than the average for Boliden’s electricity supply, which comes mainly from hydroelectricity and nuclear power. Boliden works, through its indus-try organisations, to promote transparency in the Emissions Trading Scheme and to ensure that competitive industries are compensated for indirect emission costs as in many competing countries.
Boliden develops water balance models to ensure better resource utilisation and to create a wider safety margin in relation to overflows and emergency water discharge. Every operating unit with its own dam has a Dam Safety Manager and a Dam Operations Manager. The dams are operated in accordance with the GruvRIDAS dam safety guidelines.
Unplanned stoppages
Boliden’s production essentially comprises continuous process-es and unplanned stoppages can affect production, emissions and discharges to air and water, and financial results. The stoppages can be long-term. Unplanned stoppages can, for ex-ample, occur due to technical problems, accidents or strikes.
Boliden carries out preventative maintenance work at all of its production facilities. Major maintenance shutdowns are carried out every year within the smelting operations, while maintenance work is an integral part of the day-to-day operations for the mines. Boliden has adopted a zero tolerance vision for accidents in order to help prevent unplanned stoppages.
Talent pool A large number of Boliden’s employees will retire over the next few years. A shortage of people with the right experience increases the difficulty of recruitment.
Boliden has established methods of evaluating employees and succession planning. Talent Forums are held at all units to ensure that the right expertise is available in the right key positions. Middle management programmes are conducted annually, as are employer branding activities. Boliden has made an unchanged number of visits to universities and trade fairs in Sweden during the year, while the number of activities in Finland has increased. The results of external surveys show that the “young professionals” group (professionally active people 1−8 years after graduation) view working at Boliden in an increasingly positive light. Boliden’s equal opportunities work has been noticed. One example of this is Women at Work – a network for women who are interested in career development.
RISK MANAGEMENT
Operational risks
54 | Boliden Annual Report 2016

Boliden’s market and commercial risks are primarily managed within the individual Business Areas and at Group level.
Risk Description of risk Management and comments for the year
Metal prices Changes to metal prices have a significant impact on Boliden’s profits and cash flow.
Boliden’s policy is not to hedge metal prices, but rather to allow changes to be reflected in the result. There are some exceptions to this, e.g. when mining ore bodies with short residual lifespans or in conjunction with major investment projects. See also under the “Financial risks” section. Boliden also continuously hedges Smelters’ metal price and currency exposure during the period between the purchase of materials and the sale of corre-sponding metals (with the exception of process inventory) in what is known as transaction exposure. See also under the “Financial risks” section.
Treatment and refining charges
Treatment and refining charges make up a large part of the smelters’ gross profit and are determined by the supply/ demand of metal concentrates.
The terms are negotiated annually by the major players in the mining and smelting industries. Boliden generally applies these terms internally and the majority of external contracts are based on these terms.
Customers Boliden has a reliance on a small number of large copper customers. Reduced sales to industrial customers in Europe increase the risk of sales via the London Metal Exchange (LME), with slightly lower margins as a result.
Boliden endeavours to reduce the risks by expanding the customer portfolio through its own northern European sales organisation. Boliden has a diversi-fied customer portfolio and a few new customers have also been added dur-ing the year. Boliden also has plans in place that would enable the production to be reorganised to produce LME-quality products that can be sold via LME.
Raw materials supply
A stable and reliable raw materials supply is important in enabling the smelters to produce at high levels of capacity utilisation and consistent quality.
Boliden endeavours to conclude long-term agreements and partner-ships with reliable external metal concentrate and recycling materials suppliers.
Energy prices Energy accounts for approximately 14% of operating costs and changes in energy prices can have a significant effect on profitability.
Boliden’s electricity policy entails a combination of spot prices and fu-tures. Norway and Sweden have longer pricing agreements than Finland and Ireland. At the same time, Boliden monitors the potential for entering into longer term pricing agreements if favourable terms are offered. The EU’s climate vision is giving rise to substantial investments in renewable and subsidised power generation, which can be expected to result in increased pricing volatility.
Boliden has a centralised treasury function that is responsible for managing financial risks with the exception of credit risks in accounts receivable. The treasury function is tasked with supporting the management and operating units at Parent Company and Group level. This structure ensures good internal risk monitoring and offers both financial and administrative economies of scale. The treasury function is responsible for identifying and limiting the Group’s financial risks in line with the financial policy adopted by the Board of Directors.
Risk Description of risk Exchange rate and metal price risk
Exchange rate and metal price risks
The pricing terms for Boliden’s products are primarily deter-mined on raw materials exchanges such as the London Metal Exchange (LME) for base metals, the London Bullion Market Association (LBMA) for precious metals, and the currency and money market. Boliden’s products are largely priced in USD and fluctuations in the USD/SEK/EUR exchange rates hence have a significant impact on Boliden’s profits and cash flow. The Group’s exchange rate and metal price exposure covers transaction exposure and translation exposure:
Transaction exposureBoliden’s transaction exposure comprises both binding undertakings and forecast cash flows.
Exposure in connection with binding undertakingsThis exposure arises when Boliden undertakes to par-ticipate in a transaction at a fixed value and which is not compensated for by a simultaneous opposite transaction of a corresponding size and nature. The Group buys metals in the form of raw materials which it processes into refined metals, and where the acquisition value of the raw materials as well as the exchange rates may differ from the final sales value. Such differences arise as a result of variations in size, purchasing date, processing and selling. Furthermore, some customers receive fixed prices in different currencies that are sometimes set well in advance of delivery.
Exposure in connection with forecast cash flowsThis exposure arises due to the fact that a substantial per-centage of the Group’s future income – primarily that relating to extracted metals and to treatment and refining charges – is affected by fluctuations in metal prices and exchange rates.
The Group’s total sensitivity to the factors listed (see sensitivity analysis table below) is calculated on the basis of the quarterly reports detailing the Group companies’ planned exposure resulting from metal production, exchange rates and interest. The effects of different market scenarios can be quan-tified on the basis of the information on sensitivity to market changes, and can then act as source data for the management of financial risks and be reported to the Board of Directors, management, and the market.
Transaction exposure in conjunction with binding undertakings is hedged with the exception of the smelters’ process inventory. Exposure in conjunc-tion with forecast cash flows is normally not hedged in line with Boliden’s policy. See also the “Market and commercial risks” section above.
Boliden’s policy stipulates that risks from exposure in conjunction with binding undertakings shall be hedged in full, with the exception of the smelters’ process inventory. See also the “Market and commercial risks” section above. The Group uses futures contracts to ensure that the sale price and exchange rate correspond to those applicable in conjunction with the purchase of the raw material in question or with the signing of a sales agreement at a fixed price. Hedge accounting is applied to the futures contracts, thereby hedging the fair value in the Income Statement.
Boliden continuously calculates the way in which changes in metal and exchange rate markets will affect the Group’s future financial position. See the sensitivity analysis of the operating profit table below. Boliden’s policy is not to hedge metal prices and exchange rates in relation to the Group’s future income under normal commercial conditions. Boliden can, however, in order to limit the risk in certain situations, hedge part of the forecast cash flows. There may be special justification in conjunction with, for example, major investments or investments in mines with a short lifespan for limiting the financial risks. The Group can use futures and options contracts to hedge metal prices and/or exchange rates for the cash flows from forecast metal sales. The derivatives are hedge accounted as cash flow hedging under Other comprehensive income. See page 56 for a sensi-tivity analysis of how the Other comprehensive income result is affected by a change in the value of financial derivatives (cash flow hedging).
RISK MANAGEMENT
Market and commercial risks
Financial risks
Introduction Market Operations Corporate Governance Financial reports
Boliden Annual Report 2016 | 55

Operating profit, excluding outstanding derivatives: the table below contains an estimation of the effect on the Group’s operating profit of changes in market terms for the following year. The calculation is based on closing day prices on 31 December 2016 and on Boliden’s planned production volumes. The sensitivity analysis does not take into account the effects of metal price hedging, exchange rate hedging, contracted treatment and refining charges, or the revaluation of smelters’ process inventory.
Risk Description of risk Management and comments for the year
Exchange rate risk Translation exposureA translation difference arises when converting net invest-ments in overseas operations into Swedish kronor, in con-junction with exchange rate fluctuations, which affects Other comprehensive income within the Group.
The effect of translation exposure is, in accordance with Boliden’s financial policy, not eliminated (“equity hedging”). If external borrowing requirements within the Group exceed internal loans, the excess share of the borrowing currency is steered such that the currencies in the assets match. The main borrowing currencies are EUR, SEK and NOK.
Interest rate risk Changes in market interest rates affect the Group’s profits and cash flows. The rapidity with which a change in interest rate levels affects the Group’s net financial items depends on the fixed interest term of the loans.
Boliden’s financial policy provides the scope for an average fixed interest term of up to 3 years. The Group’s loan portfolio had, on 31 December 2016, an average fixed interest term of 0.1 years (0.5). Interest swaps are used to extend the fixed interest term.
SEK m 2016 2015
Change in metal prices, +10 % 1)
Operating profit
Net financial
items Taxes
Share- holders’
equityOperating
profit
Net financial
items Taxes
Share- holders’
equity
Copper 630 8 –140 497 410 5 –91 324
Zinc 910 11 –203 718 500 7 –111 395
Lead 115 1 –26 91 105 1 –23 83
Gold 285 4 –63 225 210 3 –47 166
Silver 195 2 –43 154 160 2 –36 126
Nickel 100 1 –22 79 – – – –
Change in exchange rates, +10 %
USD/SEK 1,465 18 –326 1,156 1,035 13 –231 818
EUR/USD 870 11 –194 687 520 7 –116 411
USD/NOK 160 2 –36 126 115 1 –26 91
Change in TC/RC, +10 %
TC/RC copper 95 1 –21 75 120 2 –27 95
TC zinc 55 1 –12 43 55 1 –12 43
TC lead –10 0 2 -8 –15 0 3 –12
Change in market rate, +1 % 2) –101 22 –79 –57 12 –44
Translation exposure, net investments in overseas operations, exchange rate, +10%)3)
NOK/SEK 168 156
EUR/SEK 600 572
Effect of interest +1%, gold + 10%, USD/SEK, +10%)4)
Interest derivatives, interest swaps 5 15
Metal derivatives, gold futures 31 –67
Currency derivatives, USD/SEK –3 –55
1) Based on forecast sales for the coming twelve months.2) Based on closing day debt portfolio excluding interest swaps (31/12).3) Based on closing day balances (31/12).4) Based on outstanding derivatives (31/12).
Other comprehensive income, taking into account outstanding derivatives: the table below contains an estimation of the effect on the Other comprehen-sive income (income and cost items including reclassification adjustments not reported under the profit), before tax, of changes in the value of outstanding derivatives based on the closing day prices on 31 December 2016. Changes in the value of financial derivatives in respect of binding undertakings and translation exposure have a very limited or no effect net on the profit or Other comprehensive income. The table below hence contains the effect of changes in the value of derivatives intended to counter the Group’s forecast exposure.
FINANCIAL RISKS, CONT.
Sensitivity analysis
RISK MANAGEMENT
56 | Boliden Annual Report 2016

Risk Description of risk Management and comments for the year
Refinancing and liquidity risk
The risk that Boliden will be unable to obtain the requisite financing or to meet its payment undertakings due to insufficient liquidity.
Boliden limits the refinancing risk by ensuring that its loan liability has a good spread in terms of counterparties, financing sources and durations. Boliden works actively to ensure satisfactory current liquidity by making appropriate use of unutilised credit facilities with market- and operations-adjusted loan durations. The refinancing requirement is reviewed regularly by Boliden’s treasury function. The refinancing requirement is dependent, first and foremost, on market trends and investment plans. The loan agreements carry loan covenants which oblige Boliden to comply with certain defined key ratio conditions in order to avoid early repayment. A deterioration in the global economic climate may entail increased risks in respect of profit performance and financial position, and the risk of Boliden coming into conflict with loan terms and conditions. Boliden has complied with all loan covenants in 2016.
The average term of total loan facilities was 3.3 years (2.4) at the end of the year, which is in accord-ance with established Group policy. On 31 December 2016, Boliden’s payment capacity totalled SEK 6,968 m (6,514) in liquid assets and unutilised binding credit facilities with a term in excess of one year. Boliden has a cash pool structure that enables it to maintain a central overview of liquidity flows and ensures efficient management of the Group’s liquidity.
Credit and counterparty risk
Credit risks in financial operations The term, credit and counter-party risk, refers to the risk that a counterparty in a transaction may fail to fulfil their obligation, thus causing the Group to incur a loss. Boliden’s financial exposure to counterparty risk mainly occurs when trading in derivative instruments.
Credit risks in accounts receiv-able The risk of the Group’s customers failing to fulfil their obligations constitutes a credit risk.
Boliden’s financial policy mandates a Standard & Poor’s credit rating of A when entering into a transaction, and a maximum investment of liquid assets per counterparty. The credit quality and counterparty spread for derivatives is adjudged to have been good in 2016. One of Boliden’s financial counterparties had a BBB+ credit rating and hence failed to comply with the financial policy’s limit guidelines, which has been addressed by the Board. On 31 December 2016, the credit risk in deriv-ative instruments corresponded to a market value of SEK 298 m (264), which relates to Boliden’s receivables from external counterparties.
Offsetting of financial assets and liabilities is regulated under ISDA agreements (International Swaps and Derivatives Association) which handle both offsetting between contracted counterparties during day-to-day operations and in conjunction with special circumstances, such as failure to pay. Boliden, during the course of its day-to-day operations, net reports market values in the same currency with a single counterparty that mature at the same time and the excess sum is paid by the party with the biggest liability. In the event of a breach of contract, all outstanding obligations covered by ISDA agreements are terminated. The outstanding sum in the majority of ISDA agreements is paid by the counterparty with the biggest liability.
Credit risks are managed through an established credit rating process, active credit monitoring, short credit periods, and daily routines for monitoring payments. The requisite provisions for bad debts are also monitored continuously. The quality of accounts receivable is deemed to be good. Write-downs of outstanding accounts receivable on 31 December 2016 have only been effected in very limited amounts and have also, historically speaking, been insignificant. See also Note 19, Accounts receivable. Credit insurance is also used from time to time.
Risk management and insurance
The risk of damage or injuries that give rise to financial losses.
The objective of the Risk Management function at Boliden is to minimise the total cost of the Group’s damage and injury risks. This is achieved both by continuously enhancing the damage and injury prevention and control work conducted within the operations, and by introducing and developing Group-wide insurance solutions.
Financial reporting The risk of inaccurate financial and operational reporting.
Boliden has an efficient internal control structure. Control functions exist both locally, in indivi-dual units, and within Business Areas and at the Head Office. All of the functions work within a Group-wide internal control framework for financial reporting that is based on COSO. The framework’s controls are tested annually, both internally and by external auditors. The operational reporting is followed up and controlled by the Group’s Controller function, which works closely with the local units and Business Areas.
Risk Description of risk Management and comments for the year
Legal risks Boliden’s various operations are widely subject to licensing require-ments and to wide-ranging envi-ronmental and other regulations. Boliden may become involved in disputes and legal proceedings.
The continuation of Boliden’s operations is, to a large degree, dependent on the retention/renewal of existing licences and the acquisition of new ones. Boliden continuously monitors legal developments in relevant spheres and implements, follows up on and ensures compliance with applicable laws and reg-ulations. Boliden is active in the environmental law sphere, amongst others, through its membership of industry and trade associations, in the form of lobbying activities, and by means of presentations and educational measures for decision-makers and other stakeholder groups.
Information on legal proceedings and disputes is provided in Note 30.
Political risks Political decisions can have an effect in Sweden and the countries in which Boliden and Boliden’s commercial partners operate.
Boliden and industry organisations are often an expert body to which reports are referred for com-ment ahead of impending political decisions that impact Boliden’s operations.
Risks to confidence Boliden may suffer incidents that adversely affect confidence in the company, when, for example, suppliers, customers and/or employees fail to live up to the environmental, quality, ethical etc. requirements adhered to by Boliden.
Boliden has updated its routines for ensuring that customers and suppliers comply with the require-ments imposed by Boliden in 2016. This work has taken the form of improved internal processes, training, and the acquisition of systems for evaluating business partners, together with so-called sanctions monitoring of companies and individuals linked to companies. A number of customer and supplier audits have been carried out to ensure a level that is within the framework of Boliden’s requirement structure.
Boliden has also updated its crisis management system at all units during the year. The Group’s crisis management group and its routines for handling crises, including internal and external com-munication and legal assistance, have also been updated.
FINANCIAL RISKS, CONT.
RISK MANAGEMENT
Other risks
Introduction Market Operations Corporate Governance Financial reports
Boliden Annual Report 2016 | 57

Comments from the Chairman of the BoardEfficient corporate governance is a prerequisite for generating added value for our shareholders and maintaining confidence amongst our stakeholders at large.
A group, essentially comprising Swedish institutional investors, have held their shareholding and been long-term owners in Boliden since we were relisted in Sweden 15 years ago and the last few years have seen their ranks joined by a number of large, foreign, institutional owners. There is no clear principal owner, however, and this places special demands on the Board as the owners’ ambitions must be “interpreted”.
We work in an industry that is characterised by high volatility, i.e. rapid and vigorous fluctuations – both up and down – in profits, and this is something that our shareholders must understand. The vola-tility also makes significant demands on the company’s management and Board in terms of their ability to provide high quality, transparent information and to handle these rapid changes without suffering either from hubris when the trend is upwards or dejection when the trend is downwards.
The Board of Directors and the management must, at the same time, successfully handle large and long-term investment projects, such as the acquisition of the Kevitsa copper/nickel mine in north-ern Finland. The decision to invest approximately SEK 6 billion in this project was taken by the Board in March 2016. This type of project naturally also entails a large number of risks, which are discussed over a relatively long period of time by the Board before any decision is taken, but is nevertheless vital in terms of the company’s ability to generate value.
One of the prerequisites for value-generating work by the Board is that the Board has a firm grasp on the operations and on events in the outside world. We achieve this by, amongst other things, month-ly reports and a well-structured body of material for the Board. We also usually visit two of Boliden’s operating facilities each year in order to learn about those operations in real depth and to meet with the local management and employees.
In addition, in order to ensure that we spend sufficient time on the more long-term and strategic issues, we agree every year on a number of themes that we incorporate into our Board agenda. The Corporate Governance Report details the themes we have addressed during the past year. Some of them are recurring themes, e.g. CSR issues, which we address specifically at our October meeting, and leadership development, which is the focus of our December meeting.
The evaluation of the Board’s work that we carried out in 2016 shows that the Board is functioning efficiently. This evaluation forms the basis for the work of the Nomination Committee and it is an important tool for the Board’s efforts to ensure continuous improve-ment in our work. February 2017Anders UllbergChairman of the Board
CORPORATE GOVERNANCE REPORT
58 | Boliden Annual Report 2016
Corporate Governance ReportGovernance of the Boliden GroupBoliden is a Swedish limited company listed on the NASDAQ Stockholm Stock Exchange (NASDAQ Stockholm). The Boliden Group has approximately 5,500 employees and runs mines and smelters in Sweden, Finland, Norway and Ireland.
Boliden’s corporate governance is based on the Swedish Annual Accounts Act, the Swedish Companies Act, NAS-DAQ Stockholm’s regulations for issuers, the Swedish Code of Corporate Governance, and other applicable legislation and regulations.
In addition to compliance with rules and regulations, Boliden applies internal governance instruments, such as the Group’s organisational and operational philosophy, the New Boliden Way, and Boliden’s internal control tool, the Boliden Internal Control System (BICS), together with policies in a number of areas such as Boliden’s Code of Conduct with which all employees must be famil-iar and in accordance with which they must conduct themselves. The Group’s units also work in accordance with health & safety, environmental, energy, and quality management systems.
Highlights and events during 2016Boliden acquired the Kevitsa nickel and copper mine in northern Finland from the mining company, First Quan-tum, in 2016. The acquisition is in line with Boliden’s strategy and enables growth via a high quality mine with a long lifespan. The acquisition also contributes to the supply of raw materials for nickel production at the Harjavalta smelter. Another important event during the year was the focusing of operations at the Odda zinc smelter through the divestment of its aluminium fluoride manufacturing operations. A decision to invest in a new crusher station at Aitik and to upgrade existing crushers was also approved. A number of investments have also been made in environmental improvement measures.
Shareholders and Annual General MeetingBoliden’s biggest shareholders are Swedish and foreign investment funds and institutions. There were a total of 69,048 (71,337) shareholders at the end of the year and the single largest shareholders were Norges Bank and Black-Rock. The percentage of foreign ownership reached approx-imately 67% (70) by the end of the year. See pages 52–53 of the Annual Report and Boliden’s website for further information on the shareholder structure within Boliden.
Boliden’s shareholders exercise their right of decision by submitting proposals to and participating in and voting on the proposals submitted to the Annual General Meeting and any Extraordinary General Meetings. Shareholders may request that a matter be discussed at the Annual Gen-eral Meeting by submitting a written request to the Board of Directors at the designated time that is sufficiently in advance of the meeting that the matter can be included in the notice convening the meeting. Shareholders are

CORPORATE GOVERNANCE REPORT
Introduction Market Operations Corporate Governance Financial reports
Boliden Annual Report 2016 | 59
Welcome to the 2017 Annual General Meeting!The 2017 Annual General Meetingwill be held in Aitik, Gällivareon 25 April 2017.
APRIL
also welcome to submit enquiries to the Board and the President, the Auditor or Committee Chairmen during the General Meeting.
The Annual General Meeting is the company’s su-preme decision-making body. The duties of the Annual General Meeting include the election of Members of the Board, the Chairman of the Board, auditors, and the Nomination Committee. The Annual General Meeting’s duties also include the adoption of the Income Statement and Balance Sheet, resolutions on the appropriation of profits and discharge from liability for the Members of the Board and the President of the com-pany, the determination of fees payable to the Members of the Board and to the auditors and the principles gov-erning conditions of employment and remuneration for the President and senior executives, and, where relevant, the amending of Articles of Association.
The Annual General Meetings are regularly held at one of Boliden’s facilities in Sweden in order to give the shareholders an insight into the operations. Sharehold-ers are offered the chance of a guided tour of Boliden’s mines, concentrators or smelters in conjunction with these meetings in order to deepen their knowledge of the operations and to give them an opportunity to meet with Boliden’s employees.
The 2016 Annual General MeetingThe 2016 Annual General Meeting was held on 3 May in Rönnskär. 104,698,900 shares were repre-sented at the Meeting by 1,033 shareholders, either in person or through their proxies. The shares represent-ed comprised 38.3% of the total number of shares. The Meeting was attended by all Members of the Board and members of the Group management, and the auditor.
The Meeting resolved, amongst other things, to re-elect all of the Members of the Board, with the ex-ception of Staffan Bohman, who had declined re-elec-tion. Pekka Vauramo, President & CEO of Finnair and former Director of Sandvik Mining was elected as a new Member of the Board. Anders Ullberg was re-elected as the Chairman of the Board. The Meeting further resolved:• To pay a dividend of SEK 3.25 per share, totalling
SEK 889 m, in accordance with the proposal by the Board of Directors.
• To appoint the following persons as members of the Nomination Committee: Jan Andersson (Swed-bank Robur fonder), Lars Erik Forsgårdh, Ola Peter Gjessing (Norges Bank Investment Management), Anders Oscarsson (AMF) and Anders Ullberg (Chairman of the Board).
• That Directors’ fees payable and fees payable to the Committees shall, in accordance with the pro-posal by the Nomination Committee, comprise a Director’s fee of SEK 1,400,000 to the Chairman of the Board and SEK 500,000 to Members who are not Boliden employees, that a fee of SEK 190,000 shall be payable to the Chairman of the Audit Committee and that the fees payable to each of the two members of the Audit Committee shall be SEK
90,000, and that the fees payable to each of the two members of the Remuneration Committee shall be SEK 50,000.
• To elect Deloitte AB as the company’s new auditors for the period up to and including the next Annual General Meeting, in accordance with the proposal by the Nomination Committee and that audi-tors’ fees shall be payable in accordance with the approved invoices received.
The Annual General Meeting also resolved to approve the proposed principles for remuneration to the Group management whereby the remuneration shall comprise a fixed salary, any variable remuneration, other benefits and pensions. The variable remunera-tion shall be maximised at 60% of the fixed salary for the President and maximised at 40−50% of the fixed salary for other senior executives and shall be based on results in relation to targets set. The variable remuner-ation shall not entitle to pensionable income.
The resolutions passed by the 2016 Annual General Meeting are included in the Minutes of the Meeting published on Boliden’s website, where the minutes of previous Annual General Meetings are also published.
Nomination Committee The Nomination Committee represents Boliden’s shareholders and is tasked with preparing and present-ing proposals for resolutions that Boliden’s share-holders vote on at the Annual General Meeting. The proposals relate to the election of and fees payable to Board Members, the Chairman of the Board and the company’s auditors, and to the process and the criteria that shall govern the appointment of the members of the Nomination Committee ahead of the next Annual General Meeting.
The focus of the Nomination Committee’s work is on ensuring that the company’s Board of Directors comprises Members who, collectively, possess the knowledge and experience that corresponds to the standards that Boliden’s shareholders require of the company’s most senior governing body. The Chair-man of the Board accordingly presents the Nomina-tion Committee with the evaluation conducted of the work of the Board and the individual Members during the past year as part of the process of drafting proposals for Board Members. The Company Presi-dent also presents Boliden’s operations and future ori-entation. The Nomination Committee is also afforded the opportunity to meet Members of the Board. The Nomination Committee also drafts proposals for the election of auditors. Shareholders can submit propos-als to the Nomination Committee in accordance with the instructions presented on Boliden’s website.
The Annual General Meeting passes resolutions on the principles governing the appointment and duties of the Nomination Committee. The Nomination Committee shall, in accordance with the Instructions for the Nomination Committee, comprise a minimum of five and a maximum of seven members. Five mem-bers shall be elected at the Annual General Meeting,
25

CORPORATE GOVERNANCE REPORT
60 | Boliden Annual Report 2016
of whom three shall represent the biggest shareholders and one the smaller shareholders, and one of whom shall be the Chairman of the Board. The Nomination Committee may, in order better to reflect the share-holder structure in the event of changes in ownership, offer places on the Committee to other larger share-holders. The Nomination Committee appoints its own Chairman and works in the best interests of all share-holders. The members of the Nomination Committee receive no remuneration for their work.
The work of the Nomination Committee in 2016Jan Andersson (Swedbank Robur fonder), Lars Erik Forsgårdh, Ola Peter Gjessing (Norges Bank Invest-ment Management), Anders Oscarsson (AMF) and Anders Ullberg (Chairman of the Board) were elected to the Nomination Committee at the 2016 Annual General Meeting. In October, the Chairman of the Board convened the members of the Committee, at which time, Jan Andersson was appointed Chairman of the Nomination Committee. The current composi-tion of the Nomination Committee is also shown on Boliden’s website. The Nomination Committee has met twice prior to the 2017 Annual General Meeting and has also had telephone contacts with and held meetings with both Members of the Board and the President. These contacts afford the Nomination Committee a good opportunity to form an opinion of the way in which the Chairman of the Board and the individual Members of the Board view the work of the Board, of the executive management, and of the way in which they view Boliden’s operations and the challenges faced by the company in the next few years.
The Nomination Committee endeavours to ensure an even gender distribution amongst the Board Mem-bers and the Nomination Committee also prioritises, in parallel with its efforts to achieve this objective, en-suring a multifaceted and broad composition that cov-ers relevant areas with regard to expertise, experience and background. Boliden’s operations, developmental phase and future orientation are important criteria in evaluating skill requirements and analyses aimed at
determining the optimum composition of the Board. The Nomination Committee’s proposals for
submission to the 2017 Annual General Meeting will be published in the impending notice convening the Annual General Meeting and on Boliden’s website.
The Board of DirectorsThe Board of Directors is appointed by Boliden’s own-ers to bear ultimate responsibility for the company’s organisation and the management of the company’s affairs in the best interests of both Boliden and the shareholders. This shall be done in a sustainable way that entails carefully balanced risk-taking, in order to ensure that the company’s long-term developmental trend is a positive one.
Boliden’s Board of Directors shall, under the provisions of the Articles of Association, comprise a minimum of three and a maximum of ten Members, without Deputy Members, elected by the Annual General Meeting. The company’s employees have a statutory entitlement to appoint three Members and three Deputy Members to the Board. The Board of Directors, which is elected for one year at a time, has comprised eight Members elected by the Annual Gen-eral Meeting and three Members appointed by the trade union organisations. The Board Meetings are attended both by the ordinary Members and by the unions’ three Deputy Members. The General Counsel Group Legal Affairs is the Board’s Secretary. Boliden’s Chief Financial Officer (CFO) also usually attends the Meetings as part of the Group management. Other members of the Group management and other exec-utives also attend and present reports on individual issues as required.
The Board Members elected by the Annual General Meeting are all to be regarded as independent in rela-tion to major shareholders and all, with the exception of the President, are to be regarded as independent in relation to the company and the Group manage-ment. The Board consequently complies with the requirements of the Code with regard to independent Members. The Members of the Board are presented
AuditorsElected by the Annual General Meeting. Audits the accounts, bookkeeping and the management by the Board of Directors and the President.
ShareholdersAround 70,000 shareholders. Exercise governance via the Annual General Meeting and, where appropriate, at any Extraordinary General Meetings.
Nomination CommitteeComprises 5 to 7 members. Submits proposals on such matters as Members of the Board to the Annual General Meeting.
Internal control functionReports to the CFO and presents reports on issues relating to internal control at the Audit Committee’s meetings.
Remuneration Committee 2 members
Audit Committee 3 members
President/CEO and Group managementThe President runs the operations with the support of the other four members of the Group management.
The Board of DirectorsComprises 8 members elected by the Annual General Meeting and 3 members and 3 deputies appointed by the trade union organisations.
B O L I D E N ’ S G O V E R N A N C E S T R U C T U R E

CORPORATE GOVERNANCE REPORT
Introduction Market Operations Corporate Governance Financial reports
Boliden Annual Report 2016 | 61
on pages 64–65 and on Boliden’s website. The Board sets the company’s financial goals and
strategy, appoints and evaluates the President and CEO, and ensures that efficient systems are put in place for following up on and monitoring operations, that the company complies with statutory and regula-tory requirements, and that information is published in a correct and transparent manner. The Board adopts a Formal Work Plan every year at the Statutory Board Meeting, held after the Annual General Meet-ing. The Formal Work Plan regulates the work and responsibilities of the Board in greater detail, together with the special duties with which the Chairman of the Board is tasked.
The Chairman of the Board presides over the Board’s work and the Board Meetings and establishes an open and constructive dialogue. The Chairman’s duties also include monitoring and evaluating the expertise and work of the Board Members and the contribution they make to the Board as a whole. An-other important component of the Chairman’s work is monitoring the operations through an ongoing dialogue with the President. The Chairman of the Board acts as a discussion party and source of support for the President and ensures implementation of and compliance with the Board’s decisions, instructions and directives. Prior to every Board Meeting, the Chairman and the President review the issues to be discussed at the meeting. The supporting documents for the Board’s discussion of the issues are sent to the Members one week before each Board Meeting. The division of labour between the Board of Directors and the President is clarified in the written “Instructions to the President” adopted by the Board at the Statutory Board Meeting.
The Board of Directors’ work in 2016The Board of Directors held 9 meetings in 2016, including the Statutory Board Meeting. A number of the Board Meetings are regularly held at the compa-ny’s operating units in order to give the Members an increased insight into the operations. In 2016, the Board visited Rönnskär, Tara and Kevitsa.
The Board receives ongoing information on Boliden’s commercial and financial performance and updates on Boliden’s fulfilment of its sustainability goals in the form of monthly reports and at Board Meetings. Every Board Meeting consequently begins with a review of the operations and of sustainability issues.
The Board also, at the beginning of the year and in addition to these and other customary operations-re-lated issues, sets a number of themes that it particular-ly wishes to address during the year in order to create an increased understanding of Boliden’s opportuni-ties and challenges from a broader perspective. The acquisition of the Kevitsa nickel and copper mine has also resulted in a considerable focus on developing an increased understanding of the nickel market and on the evaluation, financing and implementation of the acquisition. The Board has also discussed such
issues during the year as exploration activities, metal prices and terms, Boliden’s competitive position, and acquisitions and mergers in the mining industry. The previous increase in the accident frequency has meant that efforts to improve and coordinate safety issues have been the subject of ongoing monitoring and follow up work by the Board. Efficient and appropri-ate environmental permit processes and reasonable operating conditions are, in light of the nature of Boliden’s business, important issues for the company and its Board, and are the subject of recurring dis-cussions. The Board has also addressed a related area, namely CSR and business ethics concerns.
The Chairman ensures that the Board and its work are evaluated annually and that the results of the evaluation are conveyed to the Nomination Commit-tee. The evaluation is carried out by the Board itself under the guidance of the Chairman or with the help of an independent consultant. The 2016 evaluation was a self-assessment during which the Members answered a number of questions in writing on a range of different subjects and held one-on-one discussions with the Chairman of the Board, followed by a joint discussion, during which the Board discussed the conclusions drawn from the evaluation.
The overall responsibility of the Board of Directors cannot be delegated but the Board may, within itself, set up committees which prepare issues within their respective spheres. The Board has, accordingly and as in previous years, set up an Audit Committee and a Remuneration Committee in 2016. The Commit-tees’ members are appointed at the Board Meeting following the election held after the Annual General Meeting and their work is governed by the Commit-tees’ formal work plans and instructions.
Audit CommitteeThe Audit Committee prepares a number of issues for consideration by the Board and thereby supports the Board in its endeavours to fulfil its responsibili-ties within the areas of auditing and internal control and with assuring the quality of Boliden’s financial reporting. Boliden has an internal control function whose work involves mapping risk areas and following up on work in identified areas, amongst other things. The Committee also works with the procurement of services from the company’s auditors in addition to the actual auditing services and, when so tasked by the Nomination Committee, with the procurement of auditing services. The Audit Committee meets before the publication of every financial report, and as nec-essary. The Audit Committee comprises Ulla Litzén (Chairwoman), Tom Erixon and Anders Ullberg. The Committee members have specialist competence, experience of and interest in financial and accounting issues – see Directorships and previous positions, pages 64–65. The Committee’s meetings are also at-tended by Boliden’s CFO and the Director of Internal Control. The Committee met five times in 2016. Spe-cial attention was paid in 2016 to internal controls, IT security, and accounting principles. The Audit

CORPORATE GOVERNANCE REPORT
62 | Boliden Annual Report 2016
T H E B O A R D O F D I R E C T O R S ’ W O R K I N 2 0 1 6
Recurring business: Sustainability and health & safety issues, operational review, invest-ments, cost accounting, and theme items. The main matters on the agenda at Board Meetings in 2016 are shown below:
February: Review of the Year-End Report, the Annual Report, the Audit Report, and matters for submission to the Annual General Meeting, and a meeting between the Board of Directors and auditors in the absence of the manage-ment. In-depth examinations of Boliden’s met-als, particularly gold and nickel, and of metal prices and terms.
March: Extraordinary Board Meeting by reason of the Kevitsa acquisition.
May (three meetings): Q1 Interim Report. Structural transactions and acquisitions. Acquisition financing and the refinancing of Bo-liden’s loan facility. Review of purchasing issues and cost trends. Annual General Meeting and the Statutory Board Meeting.
July: Q2 Interim Report and review of the Audit Report.
August: Site visit to Tara in Ireland, strategic orientation for Business Area Mines, Aitik’s
crushers and the need for investment, explo-ration, sanction controls, and compliance with market abuse regulations.
October: Q3 Interim Report, strategic orienta-tion for Business Area Smelters, slag manage-ment, cost cutting in purchasing, the status of disputes, and following up on the New Boliden Way and Corporate Responsibility (CR).
November: Review of strategy, budget and business plan. Management development, managerial and Board Member evaluation, risk management.
Committee works on the basis of a set of “Instructions for the Audit Committee” adopted every year by the Board of Directors and reports back to the Board on the results of its work.
Remuneration Committee The Remuneration Committee submits proposals for resolution by the Board regarding salary and other terms of employment for the President, and follows up on and evaluates programmes for variable remuneration for the management. The Committee also approves proposals regarding salaries and other terms of employment for the Group management, as proposed by the President. The Remuneration Committee is, furthermore, tasked with submitting proposals regarding remuneration principles for the President and Group management – proposals which are then submitted by the Board to the Annual General Meeting for resolution. The application of the guidelines and relevant remuneration structures and levels within the company is also followed up by the Committee and the results of this evaluation are published on the company’s website. See Note 3 for an account of the remuneration paid to the Group management.
The Remuneration Committee works on the basis of a set of “Instructions for the Remuneration Committee” adopted every year by the Board of Directors and reports back to the Board on the results of its work. The Remuneration Committee comprises Anders Ullberg (Committee Chairman), and Mikael G:son Löw. The Committee has held two meetings during the year and has also had telephone contacts on a number of occasions.
The President and Group managementThe President has ultimate responsibility for Boliden’s strategic orientation and for ensuring the compliance with and implementation of the Board of Directors’ decisions, and for ensuring that risk management, steering, systems, organisation and processes are all of a satisfactory standard. The President is supported in his work by the Group’s management team which, in addition to the President, comprises the SVPs for Boliden’s two Business Areas, Mines and Smelters, the CFO, and the SVP Corporate Responsibility (CR). The Group management meets regularly once
a month to follow up on operations and to discuss Group-wide issues, and to draw up proposals for strategic plans, business plans, and budgets that the President submits to the Board of Directors for their consideration. The areas addressed by the Board have largely reflected the work of the Group management during the year. The Group management also holds two meetings every year on strategy planning. The Group management, together with the management of the respective Business Areas, also meet five times a year to review Business Area-specific issues including a review of budgets and operations. For large scale projects, relevant parts of the Group management form special steering groups, together with project managers and other stakeholders, and meet regular-ly. The President and the central staffs hold reviews every month. The Group management also meets with the company’s employee representative Board Members and their deputies ahead of every Board Meeting, at which time the Board Meeting agenda and other topical issues are discussed. The company’s senior managers and specialists meet at a management conference every year for discussions intended to build consensus and achieve widespread support on important issues. See page 66 for a presentation of the Group management team.
Business managementManagement by the Board goes through a chain of command from the President and the Group management to the operating units. Boliden has an organisation in which responsibilities and authority are delegated within clear frameworks. These frame-works are defined by Boliden’s steering documents, budget and strategic plan. The steering documents, which are available on Boliden’s internal web site and which comprise the internal framework required for effective management, include the Financial Policy, the Code of Conduct, the Anti-Corruption Policy, the Competition Law Policy, the Communications Policy, the Environmental Policy, the Health & Safety Policy, the Insider Trading Policy, and documentation on delegation and decision-making.
Sustainability governance in BolidenSustainability issues are an integral part of Boliden’s operations and the work is conducted from the

CORPORATE GOVERNANCE REPORT
Introduction Market Operations Corporate Governance Financial reports
Boliden Annual Report 2016 | 63
starting point of the most operationally critical issues. Sustainability issues are discussed at every manage-ment group and Board meeting, as is the case at the local management group meetings. One member of the Group management works primarily, further-more, with CR issues. The day-to-day responsibility is decentralised to the respective units. Central sus-tainability, environmental, energy and HR functions follow up on the units’ work and are responsible for creating a structure and orientation for the work. Networks have been established within the respective functions in order to promote knowledge exchange and development.
The sustainability issues identified by Boliden as being of the greatest significance are linked to Boliden’s budget and strategy. Factors that form the basis for the prioritisation include Boliden’s operations and their impact on people and the environment, the way in which work on these issues can support the operations, expectations of Boliden from internal and external stakeholders, risks and opportunities, external factors, and applicable regulations. The chal-lenges that will be prioritised change over time and are, therefore, regularly reviewed – usually once every year. It is the responsibility of the various controlling parties within the Group to set local goals with regard to the overall issues. In 2013, Boliden set new goals in the sustainability sphere that will apply until 2018, inclusive – see pages 8−9 of the Annual Report.
Boliden’s environmental work is value-based, which means that measures are approved not solely on the basis of official requirements, but on the basis of what can be done to improve the environment at the oper-ational sites. This means that investments that yield a substantial environmental benefit for the amount invested are approved and implemented, even in the absence of external requirements or charges. Invest-ments have, consequently, been approved with regard to, amongst other things, the separation of plastic for lead batteries at the Bergsöe lead smelter, and dioxin treatment at the Rönnskär smelter.
Viewed over a longer perspective, Boliden’s long-term health and safety work has yielded good results and displayed a downwards accident trend. The trend has, however, been negative in recent years and a high priority has, therefore, been placed on measures that will, in the long-term, enable Boliden’s vision of ac-cident-free operations to be realised. These measures, which entail managerial development that aims to create wider ranging employee commitment, are now yielding results and the trend is, once again, positive at the majority of production units. The measures that were taken and which yielded results in 2016 will continue unabated with an extra focus on the units where the trend has not, as yet, been turned around. A number of investments focusing on the work environ-ment have been approved during the year, including measures designed to increase the automation of certain jobs with a higher risk component at Kokkola and Odda. The work environment activities are, in common with the environmental work, value-based,
and investments are approved on the basis of risk analyses, rather than of mandatory laws and regula-tions. Boliden also imposes stringent demands on its business partners with regard to respect for, and com-pliance with, applicable health and safety directives and regulations. Business partners are investigated, selected, and evaluated on the basis of these issues, amongst others.
Efficient and appropriate licensing processes and reasonable operating conditions are, in the light of the nature of Boliden’s operations, important issues for the company. Boliden works actively with industry organisations to monitor and promote the interests of the mining industry.
Boliden’s GRI Index, and the associated informa-tion in the Annual Report and separate GRI Report have, since 2013, been subject to an external review by auditors, with the aim of, amongst other things, un-derlining the importance of the sustainability work to Boliden and to further reinforce the confidence of the market and other stakeholders in the work conducted by the company in this respect.
Matters of business ethics are constantly topical and an area with which the company actively works. Boliden focused specifically on competition law issues during the year and has implemented new policies in this area. Training in competition law has been provided, partly in an online format and partly in the form of targeted seminars. Boliden has also strengthened its work with sanctions compliance and implemented new tools for sanctions monitoring and evaluation of business partners. Boliden has a whistle blower function to facilitate the reporting of suspected cases of impropriety.
AuditorsThe external auditor conducts independent audits of Boliden’s accounts in order to ensure that they provide a correct, fair and comprehensive picture of the com-pany’s position and results. The auditor also reviews the management by the Board of Directors and the President and presents his/her observations to the Board in the absence of the management. The auditor has been in contact with the Group management in 2016 in conjunction with audits or issues arising. The auditor is a regular attendee at the Audit Committee’s meetings and has met with the Board on one occasion in 2016. The auditor also reports to the shareholders at the Annual General Meeting.
The accounting firm of Deloitte AB was elected at the 2016 Annual General Meeting to serve as the company’s auditors until the conclusion of the 2017 Annual General Meeting. Authorised Public Accountant, Jan Berntsson, is the auditor in charge. He is a partner in and CEO of Deloitte Sweden and his other audit engagements include Atlas Copco and Kinnevik. Remuneration to the company’s auditors is payable in accordance with the approved invoices received for the period up to the end of the 2017 Annual General Meeting. See Note 4 for information on remuneration disbursed in 2016.

CORPORATE GOVERNANCE REPORT
64 | Boliden Annual Report 2016
Name Anders Ullberg Chairman of the Board
Marie BerglundMember of the Board
Tom ErixonMember of the Board
Lennart EvrellMember of the Board
Position – Vice President, Raw Materials and Environment, NCC Industry.
President & CEO, Alfa Laval. President & CEO of Boliden.
Education M.Sc. Economics M.Sc. Biology LL.B, MBA. M.Sc. Engineering, Economics
Elected 2005 2003 2013 2008
Born 1946 1958 1960 1954
Directorships Chairman of the Boards of Eneqvist Consulting, Natur&Kultur and Studsvik. Member of the Boards of Atlas Copco, Beijer Alma and Valedo Partners. Chairman of the Swedish Financial Reporting Board and Member of the Board of the European Financial Reporting Advisory Group.
Chairman of the Board of Eurocon Consulting. Member of the Boards of Baltic Sea 2020, the Water Delegation of the Gulf of Bothnia’s Water District, and the Advisory Council of the County Administrati-ve Board of Västernorrland.
Member of the Board of Chinsay. Chairman of the Boards of Umeå University and the Employers’ Association of the Swedish Mining Industry. De-puty Chairman of the Board of SveMin. Member of the Board of the Confederation of Swedish Enterprise.
Previous positions CFO of Svenska Varv. CFO, Vice President, and President and CEO of SSAB.
Group Ecologist in the former MoDo Group, Environmental Mana-ger of Botniabanan AB, President of BioEndev (consultant).
Managing partner Boston Consul-ting Group, a variety of senior posi-tions within Sandvik, and President and CEO of Ovako.
President & CEO of Sapa and Munters, and a variety of senior positions within ASEA, Atlas Copco and Sphinx Gustavsberg.
Number of shares1) 45,000 1,000 6,900 41,235
Meetings attended 9 of 9 9 of 9 9 of 9 9 of 9
Committee work (present)
Audit Com-mittee 5 of 5
Remuneration Committee2 of 2
– Audit Committee5 of 5
–
Director’s fees, SEK 1,400,000 500,000 500,000 –
Committee fees, SEK 90,000 50,000 – 90,000 –
Combined fees 1,540,000 500,000 590,000
Independence from the company and the company management
Yes Yes Yes No
Independence from major shareholders
Yes Yes Yes Yes
Name Roland AntonssonEmployee Representative
Marie HolmbergEmployee Representative
Kenneth StåhlEmployee Representative
Position Member of the Board since 2012. Deputy Member of the Board: 2009 – 2012.Representative of IF Metall (the Swedish Metalworkers’ Union). Chairman of the IF Metall Rönnskär branch.
Member of the Board since 2008. Deputy Member of the Board: 2005 – 2008. Representative of the Swedish Association of Graduate Engineers.
Member of the Board since 2014.Process operator. Represent-ative of IF Metall (the Swedish Metalworkers’ Union). Chair-man of the IF Metall Bergsöe branch.
Elected 2012 2008 2014
Born 1957 1963 1973
Number of shares1) 0 50 0
Meetings attended 9 of 9 9 of 9 9 of 9
T H E B O A R D O F D I R E C T O R S

CORPORATE GOVERNANCE REPORT
Introduction Market Operations Corporate Governance Financial reports
Boliden Annual Report 2016 | 65
1) Own holdings and those of related legal or natural persons, on 31 Decem-ber 2016.
NameMichael G:son LöwMember of the Board
Ulla Litzén Member of the Board
Elisabeth NilssonMember of the Board
Pekka VauramoMember of the Board
Position – – The County Governor of the County of Östergötland
President & CEO, Finnair.
Education M.Sc. Economics M.Sc. Economics, MBA M.Sc. Engineering M.Sc. Engineering
Elected 2010 2005 2015 2016
Born 1951 1956 1953 1957
Directorships Chairman of the Boards of RecondOil. Member of the Boards of Concordia Maritime, Preem, the Confederation of Swedish Enterprise and Stena Bulk. Deputy Chairman of the Boards of IKEM, the Swedish Chamber of Commerce for Russia & CIS, and the Swedish Association for Energy Economics. Member of the Chalmers Advisory Committee and the Royal Swedish Academy of Engineering Sciences.
Member of the Boards of Ratos, Electrolux, Alfa Laval, Husqvarna and NCC.
Member of the Boards of Outokumpu and EKN. Member of Skandia’s Council.
Member of the Boards of Ilmarinen and Glaston Plc.
Previous positions A variety of senior positions within Conoco Inc. in Stockholm, Houston, Copenhagen, Bangkok, Prague, and London. President & CEO of Preem.
President of W Capital Manage-ment. Managing Director and member of the Management Group of Investor. Responsible for Core holdings and CEO of Investor Scandinavia.
CEO of Jernkontoret (the Swedish Steel Producers’ Association) and a variety of senior positions within the SSAB Group. CEO of SSAB Merox.
A variety of senior positions within Sandvik Mining and Cargotec.
Number of shares1) 100 8,400 200 0
Meetings attended 9 of 9 9 of 9 9 of 9 6 of 6
Committee work (present)
Remuneration Committee 2 of 2
Audit Committee5 of 5
– –
Director’s fees, SEK 500,000 500,000 500,000 500,000
Committee fees, SEK 50,000 190,000 – –
Combined fees 550,000 690,000 500,000 500,000
Independence from the company and the company management
Yes Yes Yes Yes
Independence from major shareholders
Yes Yes Yes Yes
Name Peter BaltzariEmployee Representative
Lars EngströmEmployee Representative
Jussi LehtinenEmployee Representative
Position Deputy Member of the Board since 2014.Representative in Boliden’s Group Council and the Profit Sharing Foundation.
Deputy Member of the Board since 2015.Representative of the Unionen trade union. Deputy Chairman of the Unionen Boliden office branch. Member of Boliden’s Council for Negotiation and Cooperation as well as Boliden’s Group Council.
Deputy Member of the Board since 2016. Representative of the Trade Union Pro. Production engineer at Harjavalta.
Elected 2014 2015 2016
Born 1953 1966 1978
Number of shares1) 1,424 174 0
Meetings attended 9 of 9 9 of 9 6 of 6
T H E B O A R D O F D I R E C T O R S

CORPORATE GOVERNANCE REPORT
66 | Boliden Annual Report 2016
Name Lennart Evrell Kerstin Konradsson Mikael Staffas
Position President & CEO of Boliden President Boliden Smelters President Boliden Mines
Education M.Sc. Engineering, Economics M.Sc. Engineering M.Sc. Engineering, MBA
Employed 2007 2012 2011
Born 1954 1967 1965
Directorships Chairman of the Boards of Umeå University and the Employers’ Association of the Swedish Mining Industry. Deputy Chairman of the Board of SveMin. Member of the Board of the Confederation of Swedish Enterprise.
Member of the Board of Höganäs. Member of the Boards of SJ, the Employers’ Association of the Swedish Mining Industry, and SveMin.
Previous positions President & CEO of Sapa and Munters, and a variety of senior positions within ASEA, Atlas Copco and Sphinx Gustavsberg.
Business Area President and CEO within the Åkers Group and a varie-ty of senior positions within SSAB.
CFO of Södra Skogsägarna, Partner atMcKinsey & Co.
Number of shares1) 41,235 3,033 7,700
Name Thomas Söderqvist Håkan Gabrielsson
Position Senior Vice President – Corporate Responsibility
CFO
Education Bergsskolan – The Swedish School of Mining and Metallurgy
M.Sc. Economics
Employed 2012 2009 – 2011, 2016
Born 1957 1967
Directorships – –
Previous positions Area Manager for the Boliden Area and a variety of senior positions within Sandvik.
CFO of Fagerhult, Director Group Controlling at Boliden, and a variety of positions within Sapa, Ericsson and Electrolux.
Number of shares1) 0 0
1) Own holdings and those of related legal or natu-ral persons, on 31 December 2016.
G R O U P M A N A G E M E N T

CORPORATE GOVERNANCE REPORT
Introduction Market Operations Corporate Governance Financial reports
Boliden Annual Report 2016 | 67
Internal control report by the Board of DirectorsThe purpose of internal control over financial report-ing is to provide reasonable assurance with regard to the reliability of the external financial reporting and to ensure that the reports are produced in accord-ance with generally accepted accounting principles, applicable legislation and statutes, and with other requirements imposed on listed companies.
The Board of Directors has overall responsibility for ensuring that an efficient internal control system exists within the Boliden Group. The President is responsi-ble for the existence of a process and organisation that ensure internal control and the quality of the internal and external financial reporting.
Internal control functionBoliden has an internal control function responsible for implementing processes and frameworks that secure internal control and ensure the quality of the financial reporting. The internal control function reports to the CFO and presents reports on issues relating to internal control at the Audit Committee’s meetings.
Control environmentThe control environment within Boliden is charac-terised by the fact that the Group has relatively few but large operating units that have carried out their operations for many years, using well-established processes and control activities. A structure of steering documents in the form of binding policies and guide-lines for the organisation’s delegated responsibilities has been established to ensure a collective attitude and methodology within the Group.
The starting point is the New Boliden Way, which includes the Code of Conduct, decision-making and authorisation instructions, and a financial manual covering financial policy, accounting and reporting instructions. Local management systems with more detailed instructions and descriptions of important processes have also been set up.
Boliden has a uniform and standardised internal control framework known as the Boliden Internal Control System (BICS).
Risk analysisThe operating units conduct ongoing risk analyses with regard to financial reporting. The risks inherent in the various accounting and reporting processes are identified, analysed and documented in BICS.
Control activitiesVarious types of control activities are carried out within the Group and within every different aspect of the accounting and reporting process on an ongoing basis. The control activities are carried out in order to manage known risks and to detect and rectify any errors and discrepancies in the financial reporting.
Documentation of significant control activities within the accounting and reporting process contin-ued in BICS in 2016. For every risk identified, the controls that manage the risk are documented.
Information and communicationInformation on policies, guidelines and manuals is available on Boliden’s intranet. Information on up-dates and changes to reporting and accounting prin-ciples is issued via email and at the regular treasury and controller meetings. External communication is conducted in accordance with the Group’s Communi-cations Policy. All information must be communicat-ed in a discerning, open and transparent manner.
Follow-upsWork on follow-ups of, improvements to and devel-opment of systems, processes and controls within the Group is ongoing. Annual testing of documented controls within the framework of BICS has been conducted since 2009, both by internal resources and external auditors. Areas where scope for improvement is identified in conjunction with audits are document-ed, analysed and actioned.
Control activity Responsible Follow-up
Compliance with Boliden’s accounting manual Group accounting/Controller department Group management
Control of consolidated results Group accounting/Controller department Group management
Analysis and follow-up work Business Areas/Controller department Group management
Budget and forecasts Business Areas/Controller department Group management
Correct financial reporting controls Operating units/Business Areas Group accounting/Internal control/Controller department
Tax control Operating units Group Tax Director

68 | Boliden Annual Report 2016
GROUP
Financial reports
The Group Consolidated Income Statement 69
The Consolidated Statement of Comprehensive Income 69
Balance Sheet, the Group 70
Changes in shareholders’ equity, the Group 71
Consolidated Statements of Cash Flow 72
The Parent Income Statements, the Parent Company 73
Company Balance Sheets, the Parent Company 73
Changes in shareholders’ equity, the Parent Company 73
Statements of Cash Flow, the Parent Company 73
Notes Note 01: Significant accounting and valuation principles 74
Note 02: Information per segment and geographical market 80
Note 03: Employees and personnel costs 81
Note 04: Auditors’ fees and reimbursement of expenses 83
Note 05: Key expense items 83
Note 06: Other operating income 83
Note 07: Financial income 83
Note 08: Financial expenses 83
Note 09: Government subsidies 83
Note 10: Supplementary information to the Statements of Cash Flow 83
Note 11: Business combinations 84
Note12: Intangible fixed assets 85
Note 13: Tangible fixed assets 86
Note 14: Leasing charges 87
Note 15: Participations in Group companies 88
Note 16: Participations in associated companies 88
Note 17: Taxes 89
Note 18: Inventories 90
Note 19: Accounts receivable 90
Note 20: Other current receivables 90
Note 21: Related Party Disclosures 91
Note 22: Shareholders’ equity 91
Note 23: Provisions for pensions and similar undertakings 91
Note 24: Other provisions 94
Note 25: Risk information 94
Note 26: Financial liabilities and maturity structure 95
Note 27: Financial derivative instruments 96
Note 28: Other current liabilities 96
Note 29: Financial assets and liabilities by valuation category 97
Note 30: Pledged assets and contingent liabilities 98
Note 31: Events after 31 December 2016 98
Other Proposed allocation of profits 99
Audit report 100
Auditor’s Limited Assurance Report on Boliden Sustainability Report 104
C O N T E N T S

Introduction Market Operations Corporate Governance Financial reports
Boliden Annual Report 2016 | 69
GROUP
Consolidated Income StatementSEK m Note 2016 2015
Revenues 2 40,316 40,242
Cost of goods sold 5 –33,204 –35,353
Gross profit 7,111 4,890
Selling expenses 5 –390 –361
Administrative expenses 4, 5 –607 –569
Research and development costs 5 –530 –496
Other operating income 6 235 162
Other operating expenses –140 –41
Results from participations in associated companies 16 3 5
Operating profit 2–6, 9, 11–14 5,682 3,590
Financial income 7 4 4
Financial expenses 8 –311 –238
Profit after financial items 5,375 3,356
Taxes 17 –1,135 –715
Net profit for the year 4,239 2,641
Net profit for the year attributable to:
The Parent Company’s shareholders 4,237 2,640
Non-controlling interests 3 1
Earnings per share, SEK 22 15.49 9.65
There are no potential shares and hence no dilution effect
Average number of shares, basic and diluted 273,511,169 273,511,169
The Consolidated Statement of Comprehensive Income
SEK m Note 2016 2015
Net profit for the year 4,239 2,641
Other comprehensive income Items that will be reclassified to the profit/loss Cash flow hedging
Change in market value of derivative instruments –140 0
Fiscal effect on derivative instruments 31 1
Transfers to the Income Statement 49 6
Tax on transfers to the Income Statement –11 –1
–71 6
Year’s translation difference when converting overseas operations 658 –378
Result of hedging of net investments in overseas operations –186 48
Tax on the net profit for the year from hedging instruments 41 –11
513 –340Total items that will be reclassified to the profit/loss 442 –335
Items that will not be reclassified to the profit/loss Revaluation of defined benefit pension plans –274 189
Tax attributable to items not reversed to the profit/loss for the period 68 –47
Total items that will not be reclassified to the profit/loss –206 143Total other comprehensive income 236 –192Comprehensive income for the year 4,476 2,449
Comprehensive income for the year attributable to:
The Parent Company’s shareholders 4,473 2,448
Non-controlling interests 3 1

70 | Boliden Annual Report 2016
GROUP
SEK m Note 31-12-2016 31-12-2015
ASSETS Fixed assets Intangible fixed assets 12 3,508 3,366Tangible fixed assets 13, 14Buildings and land 5,505 4,539Deferred mining costs 7,913 5,998Machinery and other technical facilities 19,052 15 923Equipment, tools, fixtures and fittings 260 229Work in progress 2,120 1,684
34,850 28,372
Other fixed assets Participations in associated companies 16 25 22Other shares and participations 29 31 26Deferred tax assets 17 152 23Long-term receivables 296 111
504 182
Total fixed assets 38,861 31,920
Current assets Inventories 18 10,077 7,748Accounts receivable 19, 29 2,017 1,236Tax receivables 22 58Interest-bearing receivables 29 2 2Derivative instruments 27, 29 298 264Other current receivables 20 1,097 871Liquid assets 10, 29 1,503 923
Total current assets 15,016 11,102
TOTAL ASSETS 53,877 43,022
SHAREHOLDERS’ EQUITY AND LIABILITIES Shareholders’ equity 22Share capital 579 579Other capital provided 5,940 5,940Translation reserve 95 –418Hedging reserve –2 68Defined benefit pension plans –808 –602Retained earnings 23,582 20,234Shareholders’ equity attributable to the Parent Company’s shareholders 29,386 25,801
Non-controlling interests 8 6Total shareholders’ equity 29,394 25,807
Long-term liabilities Provisions for pensions 23 925 1,075Other provisions 24 2,655 1,784Deferred tax liabilities 17 3,062 2,965Liabilities to credit institutions 26, 29 8,187 2,484Derivative instruments 26, 27, 29 – 20Other interest-bearing liabilities 26, 29 7 11
Total long-term liabilities 14,837 8,339
Current liabilities Liabilities to credit institutions 26, 29 1,903 3,178Other interest-bearing liabilities 26, 29 4 4Accounts payable 26, 29 4,239 3,142Other provisions 24 236 197Current tax liabilities 835 613Derivative instruments 26, 27, 29 46 302Other current liabilities 28 2,382 1,439
Total current liabilities 9,646 8,875TOTAL SHAREHOLDERS’ EQUITY AND LIABILITIES 53,877 43,022
Balance Sheet, the Group

Introduction Market Operations Corporate Governance Financial reports
Boliden Annual Report 2016 | 71
GROUP
SEK m Note
Shareholders’ equity attributable to the Parent Company’s shareholders
Non-controlling
interests
Total share-
holders’ equity
Share capital
Other capital
provided
Trans-lation
reserve Hedging reserve
Defined benefit
pension plans
Retained earnings
Total – Boliden’s
share-holders
22
Opening shareholders’ equity 01-01-2015 579 5 940 –78 63 –745 18,209 23,968 7 23,974
Net profit for the year – – – 2,640 2,640 1 2,641
Other comprehensive income – – –340 6 143 – –192 – –192
Comprehensive income for the year – – –340 6 143 2,640 2,448 1 2,449Dividend to Boliden AB’s shareholders – – – – – –615 –615 – –615
Dividend to non-controlling interests – – – – – – – –1 –1
Closing shareholders’ equity 31-12-2015 579 5,940 –418 68 –602 20,234 25,801 6 25,807
Opening shareholders’ equity 01-01-2016 579 5,940 –418 68 –602 20,234 25,801 6 25,807
Net profit for the year 4,237 4,237 3 4,239
Other comprehensive income – – 513 –71 –206 – 236 0 236
Comprehensive income for the year – – 513 –71 –206 4,237 4,473 3 4,476Dividend to Boliden AB’s shareholders – – – – – –889 –889 – –889
Dividend to non-controlling interests – – – – – – – 0 0
Closing shareholders’ equity 31-12-2016 579 5,940 95 –2 –808 23,582 29,386 8 29,394
Other capital providedRefers to shareholders’ equity contributed by the owners. When shares are issued at a premium, an amount corresponding to the amount received in excess of the nominal value of the shares is reported as Other capital provided.
Translation reserveThe current method is applied to convert the Income Statements and Balance Sheets of overseas subsidiaries. Any exchange rate differen-ces arising are reported under Other comprehensive income. Boliden currency hedges net investments in overseas subsidiaries to some extent by adopting the opposite position in the form of loans in the relevant foreign currency. The exchange rate difference on loans raised is, after the fiscal effect, reported under Other comprehen-sive income.
Hedging reserveBoliden applies hedge accounting for financial derivatives acquired with a view to hedging part of the forecast currency, metal and inte-rest flows. Changes in the market value of hedging instruments are reported under Other comprehensive income until such time as the underlying flows are reported in the Income Statement.
Defined benefit pension plansRevaluations of pension undertakings have been reported under Other comprehensive income.
Retained earningsRefers to profit earned.
Net debt, SEK m 31-12-2016 31-12-2015
Liabilities to credit institutions 10,090 5,662
Other interest-bearing liabilities 11 15
Pension liabilities 925 1,075
Interest-bearing assets –184 –2
Short-term investments 0 0
Liquid assets –1,503 –923
9,339 5,827
Capital employed, SEK m 31-12-2016 31-12-2015
Intangible assets 3,508 3,366
Tangible assets 34,850 28,372
Participations in associated companies 25 22
Other shares and participations 31 26
Inventories 10,077 7,748
Accounts receivables 2,017 1,236
Other receivables 1,509 1,246
Provisions, other than for pensions and tax –2,891 –1,981
Accounts payables –4,239 –3,142
Other non-interest-bearing liabilities –2,429 –1,761
42,457 35,131
Changes in shareholders’ equity, the Group

72 | Boliden Annual Report 2016
GROUP
Consolidated Statements of Cash Flow
SEK m Note 2016 2015
10
Operating activities Profit after financial items 5,375 3,356
Adjustment for items not included in the cash flow:
Depreciation, amortisation and write-down of assets 12, 13 4,199 3,522
Provisions –434 –185
Revaluation of process inventory –588 420
Translation differences and Other 74 122
Tax paid –709 –272
Cash flow from operating activities before changes in working capital 7,918 6,963
Cash flow from changes in working capital Increase (–)/Decrease (+) in inventories –1,373 –342
Increase (–)/Decrease (+) in operating receivables –962 179
Increase (+)/Decrease (–) in operating liabilities 1,407 –572
Other 5 7
Cash flow from changes in working capital –923 –728Cash flow from operating activities 6,995 6,235
Investment activities Acquisition of operations 11 –5,925 –
Disposal of operations 121
Acquisition of intangible fixed assets 12 –14 –19
Acquisition of tangible fixed assets 13 –3,975 -3,628
Sale of tangible fixed assets 6 0
Acquisition of financial fixed assets –9 –23
Cash flow from investment activities –9,795 –3,670
Free cash flow –2,801 2,565
Financing activities Dividend –889 –615
Loans raised 7,559 5,412
Amortisation of loans –3,295 –7,300
Cash flow from financing activities 3,376 –2,503
Cash flow for the year 575 63Opening liquid assets 923 865Exchange rate difference on liquid assets 5 –5Closing liquid assets 10 1,503 923

Introduction Market Operations Corporate Governance Financial reports
Boliden Annual Report 2016 | 73
PARENT COMPANY
Income Statements, the Parent Company
SEK m Note 2016 2015
Dividends from subsidiaries 15 – –
Impairment of participations in Group companies – –
Profit after financial items – –
Taxes – –
Net profit for the year – –
The operations of Boliden AB are limited in scale and are conducted on its behalf by Boliden Mineral AB, which means that the profit is reported as part of Boliden Mineral AB.
Boliden AB has no amounts to report under Other comprehensive income.
Balance Sheets, the Parent Company
SEK m Note 31-12-2016 31-12-2015
ASSETS Fixed assets Financial fixed assets Participations in Group companies
153,911 3,911
Participations in other companies 5 5
Long-term receivables from Group companies 7,334 8,223
Total fixed assets 11,250 12,139
Current receivables Current receivables from Group companies 1,687 2,154
Total current assets 1,687 2,154TOTAL ASSETS 12,938 14,294
SHAREHOLDERS’ EQUITY AND LIABILITIES Shareholders’ equity 22
Restricted equity Share capital 579 579
Statutory reserve 5,252 5,252
5,831 5,831
Non-restricted equity Retained earnings 4,920 5,809
Net profit for the year – –
4,920 5,809Total shareholders’ equity 10,751 11,640
Liabilities Long-term liabilities to credit institutions 26 500 500
Short-term liabilities to credit institutions 26 1,687 2,154
Total liabilities 2,187 2,654TOTAL SHAREHOLDERS’ EQUITY AND LIABILITIES 12,938 14,294
Changes in shareholders’ equity, the Parent Company
SEK mShare capital
Stat-utory
reserve
Non-res-tricted share-
holders’ equity
Total share-
holders’ equity
Opening shareholders’ equity 01-01-2015 579 5,252 6,424 12,255Dividend – – –615 –615
Net profit for the year – – – –
Closing shareholders’ equity 31-12-2015 579 5,252 5,809 11,640
Opening shareholders’ equity 01-01-2016 579 5,252 5,809 11,640Dividend – – –889 –889
Net profit for the year – – – –
Closing shareholders’ equity 31-12-2016 579 5,252 4,920 10,751
The statutory reserve includes amounts which, prior to 1 January 2006, were transferred to the share premium reserve. The retained earnings comprises, together with the net profit for the year, the total non-restricted equity. The non-restricted shareholders’ equity in the Parent Company is available for distribution to the shareholders.
Statements of Cash Flow, the Parent Company
SEK m 2016 2015
Operating activities Profit after financial items – –
Cash flow from operating activities – –
Financing activities Loans raised 1,514 3,939
Amortisation of loans –1,978 –4,300
Dividend –889 –615
Loans raised from Group companies 1,353 976
Cash flow from financing activities – –
Cash flow for the year – –
Opening liquid assets – –
Closing liquid assets – –

NOTES
74 | Boliden Annual Report 2016
NotesAll amounts are in SEK million unless otherwise stated. All notes refer to the Group unless otherwise stated.
Note 01 Significant accounting and valuation principles
General accounting principlesBoliden AB (publ.) Swedish corporate ID no. 556051-4142, is a lim-ited liability company registered in Sweden. The Company’s regis-tered office is in Stockholm at the address: Klarabergsviadukten 90, SE-101 20 Stockholm. The Boliden share is listed on NASDAQ Stock-holm’s Large Cap list.
The Company is the Boliden Group’s Parent Company, whose prin-cipal operations involve the mining and production of metals and operations compatible therewith.
The Consolidated Statements have been compiled in accordance with the EU-approved International Financial Reporting Standards (IFRS) and interpretations of the International Financial Reporting Interpretations Committee (IFRIC). In addition, the Group applies the Swedish Financial Reporting Board’s recommendation RFR 1 “Sup-plementary accounting regulations for corporate conglomer-ates” specifying the supplements to IFRS required pursuant to the stipulations of the Swedish Annual Accounts Act.
The Parent Company’s functional currency is the Swedish krona (SEK) and this is also the reporting currency for both the Group and the Parent Company.
Items have been valued at their historical cost in the consolidated accounts, with the exception of certain financial assets and liabilities (derivative instruments), which have been valued at their fair value, and inventories in those cases where they are hedged at fair value.
The Parent Company’s accounting principles follow those of the Group with the exception of the mandatory regulations stipulated in the Swedish Financial Reporting Board’s recommendation, RFR 2 “Accounting for legal entities”. The Parent Company’s accounting principles are specified under the heading, “The Parent Company’s accounting principles”.
The most important accounting principles that have been applied are described below. These principles have been applied consistently for all years presented, unless otherwise specified.
The Annual Report was approved for publication by the Board of Directors on 10 February 2017. The Balance Sheets and Income Statements are subject to approval by the Annual General Meeting on 25 April 2017.
New or amended standards and interpretations from IASB and IFRS IC pronouncements that came into force in the 2016 calendar yearNo new standards or amendments requiring a change to Boliden’s accounting principles or disclosures have been introduced during the year.
New standards and interpretations that come into force in the 2017 calendar year or thereafterIFRS 9, Financial instruments: The standard comes into force for financial years beginning in 2018 or thereafter and replaces IAS 39. It is divided into three sections: classification, hedge accounting and impairment. The standard requires the classification of financial assets in accordance with three valuation categories, namely amor-tised cost, fair value through other comprehensive income, or fair value through the Income Statement. The classification is deter-mined when the asset is first accounted for on the basis of the char-acteristics of the financial asset and the Company’s business model. No major changes apply with regard to financial liabilities.
IFRS 9 also includes augmented regulations regarding disclosures in relation to risk management and the effects of hedge accounting. The standard has been complemented with regulations governing the impairment of financial assets, where the model is based on anticipated losses. An overall assessment of the effects on Boliden’s accounting will be made at a later date.
IFRS 15, Revenue from Contracts with Customers: The standard comes into force on 1 January 2018 and replaces existing standards and interpretations regarding revenues. The standard introduces a new revenue recognition model for contracts with customers and shall be applied to all contracts with customers with the exception of
insurance contracts, financial instruments and leasing contracts in that separate standards exist in these areas. The new standard also entails new starting points for when revenue shall be recognised and requires new evaluations by the Company management that differ from those currently applied.
The principal areas in which existing regulations differ from the new ones are:– Control-based model for determining when revenue shall be reco-
gnised (transfer of risks and benefits is only retained to indicate that control may have been transferred).
− The valuation of the revenue shall be based on what the vendor expects to receive, rather than on fair value.
− New rules governing the way in which a contract’s goods and services shall be distinguished in the financial reporting.
− Revised criteria governing how revenue shall be recognised over time.
− Expenditure for the acquisition and fulfilment of contracts. − Significantly additional disclosure requirements.
IFRS 15 is not currently expected to affect Boliden to any substantial degree with the exception of augmented disclosure requirements.
IFRS 16, Leasing: the standard comes into force on 1 January 2019 and replaces existing standards and interpretation pronounce-ments in leasing. The standard will entail assets and liabilities attrib-utable to leasing agreements, with a very few exceptions, being reported in the Balance Sheet. This reporting is based on the view that the lessee is entitled to make use of an asset for a fixed period of time and, at the same time, has an obligation to pay for this right. The reporting by the lessor will, in every significant respect, remain unchanged. Boliden will be affected by the new standard such that operational leasing will, under the current standard, be reported in the Balance Sheet.
The standards and interpretations presented are those that may, in the opinion of the Group, have an effect in future. The Group intends to implement these standards when they become applicable.
Estimates and assessmentsIn order to compile the Financial Statements in accordance with IFRS accounting principles, assessments and assumptions must be made that impact the reported asset and liability amounts and the income and expense amounts, as well as other information provided in the Financial Statements. The estimates and assessments of the Board of Directors and the Company’s management are based on historical experience and forecast future trends. The actual outcome may differ from these assessments.
Valuation of inventoriesIt is not easy, in the smelters’ process inventories and stocks of finis-hed metals, to differentiate between externally purchased material and mined concentrate from the Group’s own operations. Calculating the internal profit of inventories and the reported value of process in-ventory consequently entails estimations of the share of the process inventory and finished metal stocks that comes from the in-house mining operations, based on the quantities of mined concentrate bought in and produced in-house.
Pension undertakingsPension provisions are dependent on the assumptions made in con-junction with the calculations of the amounts. The assumptions refer to discount interest rates, rate of salary increases, future increases in pensions, the number of remaining working years for employees, life expectancy, inflation and other factors, and are reviewed annually. The assumptions are made for every country in which Boliden has defined benefit pension plans. The most significant assumptions, in Boliden’s opinion, are with regard to the discount rate, the rate of salary increases, and life expectancy, and Boliden has elected to present sen-sitivity analyses for these factors. Boliden’s assumptions and sensitiv-ity analyses are presented in Note 23.

Introduction Market Operations Corporate Governance Financial reports
NOTES
Boliden Annual Report 2016 | 75
Legal disputesBoliden regularly analyses and evaluates outstanding legal disputes using internal company legal counsels and, when necessary, with the help of external advisors, in order to assess the need for provisions to be made. See Note 30, Pledged assets and contingent liabilities.
Reclamation costsProvisions for reclamations are made on the basis of an assessment of future costs based on current conditions. Provisions are reviewed regularly by internal or external specialists and updates made when necessary when the estimated useful lives, costs, technical precon-ditions, regulations or other conditions of mine and smelter assets change. See Note 13, Tangible fixed assets and Note 24, Other provi-sions.
Boliden also has a responsibility for the reclamation of a number of decommissioned mines and continuously reviews the requirement to make provisions in respect of these objects. Inspection of and risk assessments in relation to reclamation measures are conducted on a systematic basis.
In the event of complementary reclamation work on a decommis-sioned mine being deemed necessary in order to comply with the requirements of external regulations, a provision is reported for the anticipated future costs. The provision is reviewed as investigations and action plans provide underlying data for revised costings.
Valuation of fixed assetsImpairment tests for tangible and intangible assets are based on the Company’s internal business plan and on assumptions with regard to future trends in metal prices, treatment and refining charges, and exchange rates, amongst other things. Changes in market prices of metals, treatment and refining charges and currencies have a sub-stantial effect on the Company’s future cash flows and hence on the estimated write-down requirement. Assumptions with regard to price trends for metals, treatment and refining charges and curren-cies are made by the Company management with the help of external experts. The assumptions are reviewed on an annual basis and adjusted when necessary. For further information, see Note 13, Tan-gible fixed assets.
The depreciation period for deferred mining costs, installations and equipment in mines depend on future ore extraction and the lifespan of the mine. The assessment of these aspects is, in turn, heavily dependent on Mineral Reserves and, consequently, on fac-tors such as anticipated future metal prices. Changes to conditions may entail changes to the rate of depreciation applied in future. Busi-ness Area Mines draws up annual production plans for the mines’ lifespans.
Mineral ReservesBoliden’s Mineral Reserves are divided into two categories, namely probable and proven. The assessment is based on geological meas-urements and assumptions that are explained in greater detail on pages 105−108. Boliden’s assessment of the size of the Mineral Reserves affects annual depreciation costs and impairment tests.
Consolidated StatementsThe Consolidated Statements cover the Parent Company and all companies over which the Parent Company through ownership, directly or indirectly, exercises a controlling influence. The term “con-trolling influence” refers to companies in which Boliden exerts influ-ence, is exposed to, or is entitled to a variable return from its involve-ment and in which it can use its influence over the company to influ-ence its return. This is generally achieved by ensuring that its owner-ship share, and the share of votes, exceeds 50 per cent. The exist-ence and effect of potential voting rights that can currently be uti-lised or converted are taken into account when assessing whether the Group is capable of exercising a controlling influence over another company. Subsidiaries are included in the Consolidated Statements as of the point in time at which a controlling influence has been attained, while companies that have been sold are included in the Consolidated Statements up to the time when the sale occurred, i.e. up to the point in time when controlling influence ceased to be exercised.
The Consolidated Statements have been compiled in accordance with the acquisition accounting method, which means that the histor-ical cost of a company comprises the fair value of the payment made (including the fair value of any assets, liabilities and own equity instru-ments issued). The identifiable assets, liabilities and contingent liabili-
ties acquired are reported at their fair value on the acquisition date. A determination of whether a holding without a controlling influence shall be reported at fair value or at the holding’s proportional share of the acquired company’s net assets is conducted in conjunction with every acquisition. When required, the subsidiaries’ accounts are adjusted to ensure that they follow the same principles applied by other Group companies. All internal transactions between Group companies and intra-Group transactions are eliminated when the Consolidated Statements are compiled.
Associated companiesShareholdings in associated companies, in which the Group has a minimum of 20 per cent and a maximum of 50 per cent of the votes, or otherwise has a significant influence over operational and financial management, are reported in accordance with the equity method. Under the equity method, the consolidated book value of the shares in the associated companies corresponds to the Group’s share of the associated companies’ shareholders’ equity and any consolidated surplus values. Shares in associated companies’ profits/losses are reported in the Consolidated Income Statement as part of the oper-ating profit and comprise the Group’s share in the associated compa-nies’ net profits/losses.
Conversion of foreign subsidiaries and other overseas operationsThe currency in the primary economic environments in which the subsidiary companies operate is the functional currency. The current method is applied in the conversion of Income Statements and Bal-ance Sheets to the Group’s reporting currency. Under the current method, all assets, provisions and liabilities are converted at the rate of exchange applying on the closing day, while all items in the Income Statement are converted at the average exchange rate. Any exchange rate differences arising and accumulated translation dif-ferences in respect of the conversion of subsidiaries are reported as Other comprehensive income.
Boliden hedges its net investments in foreign subsidiaries to some extent by taking an opposite position (in the form of loans) in the rele-vant foreign currency. Exchange rate differences on hedging meas-ures are reported as Other comprehensive income.
In conjunction with the sale of overseas operations whose func-tional currency is different from the Group’s reporting currency, the accumulated translation differences attributable to the operations are realised in the Consolidated Income Statement, after deductions for any currency hedging activities.
Financial instrumentsThe following financial instruments, i.e. financial assets and liabilities, are recognised in the Balance Sheet: shares, receivables, liquid assets, liabilities and derivatives.
Financial instruments are recognised in the Balance Sheet when the company becomes bound by the instrument’s contractual terms (the economic approach). Liabilities to credit institutions are, how-ever, not reported until the settlement date. Financial assets are removed from the Balance Sheet when the rights entailed by the agreement are utilised, mature or are transferred to another coun-terparty. Financial liabilities are removed from the Balance Sheet when the agreement’s obligations are fulfilled or if significant aspects of the loan terms are renegotiated.
Financial instruments are reported at the fair value or amortised cost, depending on the initial categorisation under IAS 39. On each reporting occasion, the Group performs an impairment test to deter-mine whether objective indications exist of the need to write down a financial asset or group of assets.
Valuation principlesFair valueThe fair value of derivatives is based on listed bid and ask prices on the closing day and on a discounting of estimated cash flows, and includes risk assumptions. Market prices for metals are taken from the trading locations of metal derivatives, i.e. the London Metal Exchange (LME) and the London Bullion Market Association (LBMA). Discount rates are based on current market rates per currency and time to maturity for the financial instrument. Exchange rates are obtained from the Riksbank.
When presenting the fair value of liabilities to credit institutions, the fair value is calculated as discounted agreed amortisations and inter-est payments at estimated market interest rate levels. The fair value
1
2
3
4
5
6
7
8
9
10
11
12
13
14
15
16
17
18
19
20
21
22
23
24
25
26
27
28
29
30
31

NOTES
76 | Boliden Annual Report 2016
of accounts receivable and accounts payable is deemed to be the same as the reported value due to the short term to maturity, to the fact that provisions are made for bad debts, and to the fact that any penalty interest incurred will be debited. If changes in value cannot be determined for financial assets or liabilities reported at fair value, they are reported at the historical costs of the instruments at their time of acquisition, which corresponds to the fair value at the time of acquisi-tion. Boliden provides information on all financial assets and liabilities reported at fair value in the Balance Sheet on the basis of a three-level fair value hierarchy. Level one comprises instruments that are listed and traded on an active market where identical instruments are traded. Level two comprises instruments that are not traded on an active market, but where observable market data is used for valuation of the instrument (either directly or indirectly). Level three comprises instruments where the valuation is, to a considerable extent, based on unobservable market data.
The assessments have been conducted on the basis of the circum-stances and factors obtaining with regard to the various instru-ments. Metal futures are classified as level two, in that the dis-counted prices are based on listed daily prices from the exchanges. Currency futures and interest swaps have also been classified as level two, with reference to the fact that the valuation is based on observable market data. The fair value of liabilities to credit institu-tions has been classified as level two. Shares and participations that are not listed have been classified as level three. Exceptions to classi-fication on the basis of the fair value hierarchy are made for accounts receivable, liquid assets and accounts payable where the reported value is deemed to constitute a reasonable estimation of the fair value.
Amortised costAmortised cost is calculated using the effective interest rate method. This means that any premiums or discounts, as well as expenses or income directly attributable to them, are distributed over the duration of the contract with the aid of the estimated effec-tive interest rate. The effective interest rate is the rate that yields the instrument’s historical cost as a result in conjunction with cur-rent value calculation of future cash flows.
Valuation categoryBoliden divides financial instruments into the following valuation cate-gories. See also Note 29.
Held at fair value Derivatives valued at fair value and for which changes in value are reported under net financial items. The derivatives comprise cur-rency futures and are not included in hedge accounting.
Loans and accounts receivablesThis category includes financial investments, receivables not listed on an active market, and liquid assets. Liquid assets are defined as, in addition to cash and bank balances, short-term investments with a maximum term of three months at the time of acquisition and which can easily be converted to cash. Liquid assets are only exposed to an insignificant risk of fluctuations in value and are reported according to the amortised cost method. Receivables are defined as accounts receivable and interest-bearing short-term holdings of securities or other investments which are not classified as fixed assets and which are not attributable to liquid assets. Receivables are reported in the anticipated recoverable amount, i.e. after deductions for bad debts, which are assessed on an individual basis. The anticipated term of accounts receivables and other current receivables is short and the value is, therefore, reported at the nominal amount without discount-ing in accordance with the amortised cost method.
Financial assets available for saleAssets in this category comprises shares valued at fair value with changes in value recognised under Other comprehensive income. If it is not possible to establish the fair value of such shares, they are reported at their historical cost, taking into account accumulated write-downs.
Derivatives used in hedge accountingThis category comprises derivatives valued at fair value and which form part of fair value hedging or cash flow hedging. The derivatives comprise metals futures, currency futures, and interest derivatives. See Note 27 for details of derivatives used for hedging purposes.
Other financial liabilitiesFinancial liabilities primarily comprise liabilities to credit institutions and accounts payable. The anticipated term of accounts payables is short and the value is, consequently, reported at a nominal amount in accordance with the amortised cost method. Liabilities to credit institutions are initially valued at amounts received, less any set-up fees, and are then valued at the amortised cost method. Interest expenses are reported on a rolling basis in the Income Statement with the exception of the part included in the historical cost for tangi-ble fixed assets. Capitalised set-up fees are reported directly against the loan liability to the extent that the loan agreement’s underlying loan guarantee has been utilised, and are recognised in the Income Statement under Other financial expenses over the contractual term of the loan. If a loan agreement is terminated or otherwise ceases to obtain at a point in time prior to the end of the original contractual term, capitalised set-up fees are taken up as income. If a current agreement is renegotiated during the contractual term, any addi-tional fees in connection with the renegotiation are allocated over the remaining contractual term of the loans.
Assets and liabilities in foreign currenciesReceivables, liabilities and derivatives in foreign currencies are con-verted to Swedish kronor at the exchange rate applying on the clos-ing day. Exchange rate differences on operating receivables and operating liabilities are included in the operating profit, while exchange rate differences on financial assets and liabilities, including any profit/loss, are reported under financial items. Exchange rate effects on financial instruments used in cash flow hedging and the hedging of net investments in overseas operations, are reported under Other comprehensive income with the exception of any exchange rate differences on currency swaps in foreign currencies reported under net financial items.
Classification and reporting of derivatives used for hedging purposesSee also “Risk management” in the Directors’ Report on pages 54–57.
Fair value hedging (binding undertaking)Changes in the value of financial derivatives used to hedge a binding undertaking are reported under the operating profit together with changes in the value of the asset or liability that the hedging is designed to counter. The fair value of the derivatives is reported in the Balance Sheet as other assets and liabilities. Parts of inventories constitute binding undertakings and are reported at market value as inventory value, and changes in the value of derivatives consequently effectively match the changes in value from hedged items in the Income Statement and Balance Sheet.
Cash flow hedging (forecasted cash flows)Hedge accounting is applied to financial derivatives that refer to the hedging of forecast flows, which means that the effective share of the unrealised market values is reported under Other comprehensive income up to the point in time when the hedged item, such as fore-cast metal sales, US dollar income, and interest expenses, is real-ised and thus reported in the Income Statement. Realised profits/ losses attributable to metal and currency derivatives are reported under net sales, while the profit/loss on interest derivatives is reported under net financial items. Individual interest swaps and mul-tiple interest swaps – known as portfolio hedging – are both used to hedge future interest payments. Any ineffective part of cash flow hedging is reported under net financial items.
Hedging of net investmentsHedge accounting is applied to the profit/loss on hedging in respect of net investments in overseas operations under Other comprehen-sive income. Any ineffective component of these hedges is reported under net financial items. Associated hedging results are, in conjunc-tion with the sale of overseas operations, reported in the Income Statement, together with the translation effect of the net invest-ment.
Offsetting of financial assets and liabilitiesThe offsetting of financial assets and liabilities is regulated by ISDA (International Swaps and Derivatives Association) agreements, which regulate both offsetting between contracted counterparties as part of operating activities and in conjunction with circumstances

Introduction Market Operations Corporate Governance Financial reports
NOTES
Boliden Annual Report 2016 | 77
relating to breach of contract or early termination. In its operating activities, Boliden offsets payments on undertakings with the same maturity date, which are in the same currency, which have the same counterparty, and which are for the same type of instrument. Sur-plus amounts per instrument and currency only are paid by the party with the biggest outstanding liability. All terminated undertakings comprised by ISDA agreements are, in conjunction with breach of contract or early termination, which may be caused by circum-stances not directly linked to neglect by any party, offset in a sum that is paid by the party with the biggest outstanding liability.
Government contributions and supportGovernment support refers to subsidies, grants or premiums designed to provide an economic benefit, or Government support in the form of transfers of resources to the company that may be applied to an undertaking. Government support attributable to assets is reported either by recognising the support as a prepaid income or by reducing the reported value of the asset.
Revenue recognitionSales of metal concentrates, metals and by-products are reported at the time of delivery to the customer in accordance with the terms and conditions of sale, that is to say revenue is recognised whenever significant rights and obligations associated with the title transfer to the purchaser. These sales are reported net after VAT, discounts and exchange rate differences when sales are made in foreign cur-rencies.
Preliminary invoices are issued for the Group’s metal concentrates at the time of delivery. Final invoices are issued when all component parameters (concentrate quantity, metal content, impurity content, and the metal price for the agreed pricing period – normally the aver-age price on the LME in the month after delivery) have been estab-lished.
The Group’s metals are invoiced to the customers at the time of delivery. The Group eliminates the price risk in conjunction with the sale and purchase of metals by hedging the imbalance between quan-tities purchased and sold on a daily basis. The smelters’ income com-prises treatment and refining charges (TC/RC), free metals, com-pensation for impurities in the raw materials, and the worth of by-products.
Income from activities outside the sphere of the regular opera-tions is reported as Other operating income.
Exploration, research and developmentBoliden’s R&D primarily comprises exploration. Boliden is also involved, to a limited extent, in developing mining and smelting pro-cesses. Expenses associated with research and development are primarily booked as costs when they arise. When the financial poten-tial for the exploitation of a mine deposit has been confirmed, the expenses are booked as costs up to that date. After that date, the expenses are capitalised as deferred mining costs, the governing principles of which are described under the Tangible fixed assets heading. Exploration rights acquired in conjunction with operational acquisitions have been capitalised as intangible assets.
Intangible fixed assetsIntangible fixed assets include patents, licenses, similar rights, emis-sion rights, exploration rights acquired in conjunction with opera-tional acquisitions and goodwill. Goodwill comprises the amount by which the historical cost exceeds the fair value of the Group’s share of the identifiable net assets of the subsidiary company acquired at the time of acquisition. Goodwill is reported in the Balance Sheet at the value given in conjunction with the acquisition, converted, where relevant, at the closing day rate, after deduction for accumulated impairments. Calculations of the profit or loss on the sale of a unit include any remaining reported goodwill value ascribed to the opera-tions sold. Goodwill has been assessed as having an indefinite useful life. Goodwill is allocated to the smallest possible unit or group of units that generate cash where separate cash flows can be identi-fied, and an impairment test is performed on the reported value at least once a year to determine whether there is any need for an impairment. Such impairment tests are, however, performed more frequently if there are indications that the value may have fallen dur-ing the year.
Other intangible fixed assets, with the exception of emission and exploration rights, are amortised over their anticipated useful lives.
Emission rightsThe Boliden Group participates in the European system for emission rights. Rights are allocated across the European market. One emis-sion right grants entitlement to emit the equivalent of one tonne of carbon dioxide or similar gas and is classified as an intangible asset. Emission rights allocated are valued at the historical cost of zero, while rights acquired are valued at the purchase price. An intangible asset and a provision in the corresponding amount are reported dur-ing the current year in the event of any need arising to purchase addi-tional emission rights. The asset is amortised over the remaining months of the year, thereby distributing the cost in line with produc-tion. The intangible fixed asset is thereby exhausted and the provision for emissions made is settled. If the liability to deliver emission rights exceeds the remaining emission rights allocation, the liability is reval-ued at the market value of the number of emission rights required to clear the undertaking on the closing day.
Tangible fixed assetsLand, plants and equipment, and capitalised costs associated there-with for development, pre-production measures and future reclama-tion costs, are booked at the historical cost less depreciations and any write-downs. Interest expenses attributable to financing develop-ment and completion of significant tangible fixed assets are included in the acquisition value. Repair and maintenance expenses are booked as costs, while substantial improvements and replacements are capitalised. Estimated future expenses for the dismantling and removal of a tangible asset and the restoration of a site or area where the tangible asset is located (reclamation costs) are capital-ised. Capitalised amounts comprise estimated expenses, calculated at current value, which are simultaneously reported as provisions. Effects of subsequent events that result in costs that exceed the pro-vision are discounted, capitalised as a fixed asset, and increase the provisions, and are written off over the remaining life of the asset.
Deferred mining costs at mines comprise the waste rock excava-tion required to access the ore body, work relating to infrastructural facilities, roads, tunnels, shafts and inclined drifts, as well as service, electricity and air distribution facilities. Deferred mining costs arising from capacity expansion of the mining operation, the development of new ore bodies, and the preparation of mining areas for future ore production are capitalised. Mining costs arising from waste rock removal from open-pit mines are capitalised as part of an asset when it becomes possible to identify the part of an ore body to which access has been improved.
Depreciation principles for tangible fixed assetsDepreciation according to plan is based on the original capitalised values and the estimated economic lifespan. Depreciation of an asset begins when an asset becomes operational.
Fixed assets and capitalised values attributable to waste rock are depreciated per push-back and in conjunction with ore extraction in relation to the anticipated ore extraction for the entire push-back. Fixed assets and capitalised values included in deferred mining costs are depreciated in accordance with a production-based depreciation method that is based on the proven and probable Mineral Reserves in the respective ore bodies. Depreciation is effected to the esti-mated residual value. Estimated residual values and production capacity are subject to ongoing review. Fixed assets not directly linked to production capacity are depreciated on the basis of their anticipated useful lives.
Smelters and production plants are depreciated linearly over their anticipated useful lives. The following depreciation periods are applied to tangible fixed assets including future reclamation costs:Buildings 20–50 yearsLand improvements 20 yearsDeferred mining costs and waste rock capitalisation Concurrently with ore depletionCapitalised restoration costs Linearly over the anticipated lifespanProcessing facilities 10–25 yearsMachinery 3–10 yearsEquipment, tools, fixtures and fittings 3–10 years
Boliden applies component depreciation, which means that larger processing facilities are broken down into component parts with dif-ferent useful lives and thus different depreciation periods.
1
2
3
4
5
6
7
8
9
10
11
12
13
14
15
16
17
18
19
20
21
22
23
24
25
26
27
28
29
30
31

NOTES
78 | Boliden Annual Report 2016
ImpairmentOn each reporting occasion, an assessment is performed to deter-mine whether there is any indication that the value of the Group’s assets has depreciated or been impaired. Should this be the case, a calculation is performed of the recoverable amount of the asset in question. Goodwill is, together with any intangible assets with an indefinable useful life, subject to annual impairment tests even if there are no indications of a reduction in its value. The recoverable amount comprises whichever is the higher of the value in use of the asset in the operations and the value that would result if the asset were sold to an independent party, fair value minus selling expenses. The value in use comprises the present value of all incoming and out-going payments attributable to the asset for the duration of its expected use in the operations, plus the present value of the net sales value at the end of the asset’s useful life. If the estimated recov-erable amount is lower than the book value, the latter is written down to the former.
Impairment are reported in the Income Statement. Any impair-ment are reversed if changes in the assumptions leading to the origi-nal impairment mean that the impairment is no longer warranted. Impairment that have been performed are not reversed in such a way that the reported value exceeds the amount that would, following deductions for depreciation according to plan, have been reported if no impairment had been performed. Reversals of impairment per-formed are reported in the Income Statement. Goodwill impairment are not reversed. See also the section on Valuation of fixed assets.
LeasingA financial leasing agreement is an agreement whereby the financial risks and benefits associated with a title are, in all significant respects, transferred from the lessor to the lessee. Leasing agree-ments that are not classified as financial leasing agreements are classified as operational leasing agreements.
Assets held in accordance with financial leasing agreements are reported initially as fixed assets in the Consolidated Balance Sheet at the present value of the future lease payments. The Group’s liability in relation to the lessor is reported in the Balance Sheet under the heading of Liabilities to credit institutions, broken down into short- and long-term components.
Lease payments are broken down into interest and amortisation of the liability. The interest is distributed over the leasing period so that an amount corresponding to the fixed interest amount payable on the liability reported in each period is charged to each reporting period. The leased asset is depreciated according to the same princi-ples as those that apply to other assets of the same type.
The leasing charges for operational leasing agreements are booked as costs on a linear basis over the leasing period.
InventoriesThe Group’s inventories primarily comprise mined concentrates, materials tied up in the smelters’ production processes, and finished metals. Inventories are valued at whichever is the lower of the histor-ical cost in accordance with the first-in-first-out principle and the net sale value, taking into account the risk of obsolescence. The histori-cal cost of inventories of metals from the company’s mines and semi-finished and finished products manufactured in house com-prises the direct manufacturing costs plus a surcharge for indirect manufacturing costs. Supplies inventories are valued at whichever is the lower of the average historical cost and the replacement value. When mined concentrates are bought in from external sources and definitive pricing has not yet occurred, the acquisition value is esti-mated at the closing day price. Fair value hedging is effected in con-junction with the definitive pricing of mined concentrates. The change in the value of hedged items in the inventory value is also reported in conjunction with fair value hedging of mined concentrates and fin-ished metals.
TaxesThe tax expense (income) for the period comprises current tax and deferred tax. Taxes are reported in the Income Statement under Other comprehensive income or Shareholders’ equity, depending on where the underlying transaction has been reported.
Current tax is the tax calculated on the taxable profit/loss for each period. The year’s taxable profit/loss differs from the year’s reported profit/loss before tax in that it has been adjusted for non-taxable and non-deductible items and temporary differences. The Group’s cur-
rent tax liability is calculated in accordance with the taxation rates stipulated or announced on the closing day.
Deferred tax is reported using the Balance Sheet method, under which deferred tax liabilities are reported in the Balance Sheet for all taxable temporary differences between reported and fiscal values of assets and liabilities. Deferred tax receivables are reported in the Balance Sheet in respect of loss carry-forwards and all deductible temporary differences to the extent that it is likely that these amounts can be used to offset future taxable surpluses. The reported value of deferred tax receivables is checked at the end of each accounting period and reduced to the extent that it is no longer likely that sufficient taxable surpluses will be available for its use. Deferred tax is calculated in accordance with the taxation rates that are expected to apply to the period in which the asset is recovered or the liability settled.
Both deferred and current tax receivables and tax liabilities are off-set when they relate to income tax levied by the same tax authority.
ProvisionsProvisions are reported when the Group has, or may be considered to have an obligation as a result of events that have occurred and it is likely that disbursements will be required in order to fulfil this obliga-tion. A further prerequisite is that it should be possible to make a reli-able estimate of the amount to be paid.
When a significant effect arises due to the point in time at which a provision is made, the provision is valued at the present value of the amount estimated to be required to fulfil the obligation. A discount interest rate before tax that reflects current market evaluations of the time value of money and the risks associated with the provision is applied in conjunction herewith. The increase that is due to time passing is reported as an interest expense. Provisions are broken down into short-term and long-term provisions.
Boliden’s provisions primarily, with the exception of pensions (see separate section), refer to reclamation costs that are expected to arise when operations are decommissioned. Provisions are also made for any purchases of emission rights and for any remuneration payable in conjunction with the termination of employment that may be payable to employees to whom a commitment of termination has been given or to employees who accept voluntary redundancy. The Group reports a provision and a cost in conjunction with termination when Boliden is obligated either to give the employee notice prior to the normal point in time for employment cessation, or to provide remuneration with a view to encouraging early retirement.
Contingent liabilitiesA contingent liability is a potential undertaking that derives from events which have occurred and whose incidence is only confirmed by one or more uncertain future events. A contingent liability can also be an existing undertaking that has not been reported in the Bal-ance Sheet because it is unlikely that an outflow of resources will be required or because the size of the undertaking cannot be calcu-lated. See Note 30.
Employee benefitsPension undertakingsThe Group’s companies have a variety of pension systems in accord-ance with local conditions and practices in the countries in which they operate. They are generally financed through payments made to insurance companies or through the company’s own provisions which are determined through periodic actuarial calculations. The Group’s provisions for pension undertakings are calculated in accord-ance with IAS 19, Employee benefits.
For pension systems where the employer is committed to defined contribution systems, the undertaking in relation to the employee ceases when the agreed premiums have been paid. Premiums paid are booked as costs on an ongoing basis.
The undertaking does not cease for pension systems where a defined benefit pension has been contractually agreed, until the agreed pensions have been paid out. Boliden commissions independ-ent actuaries to calculate pension undertakings relating to the defined benefit pension plan arrangements in each country. For infor-mation on calculation parameters, see the section entitled “Esti-mates and assessments − pension undertakings” and Note 23.
Revaluations of the defined benefit net pension liability, such as actuarial profits and/or losses and the difference between the return on plan assets and the discount rate, are reported under

Introduction Market Operations Corporate Governance Financial reports
NOTES
Boliden Annual Report 2016 | 79
Other comprehensive income. The financing cost of the net pension liability is calculated using the discount rate for the pension liability. The financing cost, the cost of service during the current period and any previous periods, losses from settlements and costs in connec-tion with special payroll tax are all reported in the Income Statement. Special payroll tax is regarded as part of the total net pension liability.
Share capitalOrdinary shares are classified as share capital. Transaction costs in conjunction with a new share issue are reported as a net amount after tax for deduction from the issue proceeds received.
Buy-back of own sharesBoliden’s holdings of its own shares are reported as a reduction in shareholders’ equity. Transaction costs are reported directly against shareholders’ equity.
DividendA dividend payment proposed by the Board of Directors does not reduce the shareholders’ equity until it has been approved by the Annual General Meeting.
Information per segment and geographical marketBoliden’s operations are organised into two segments: Business Area Mines and Business Area Smelters. The Business Areas corre-spond to Boliden’s operating segments in that 1) the Business Area Managers are directly responsible to the CEO, 2) the CEO controls the Group’s component parts via two “Business Area Boards”, one for each Business Area, through which the financial results in rela-tion to financial goals are evaluated, 3) financial goals and investment plans and overhead budgets for the respective Business Areas are set in the business plan and budget process, 4) decisions on goals and resource allocation for units within the respective Business Areas are made within the respective Business Areas’ management groups, and 5) heads of operating units report not to the CEO but to the Business Area Managers.
Business Area Mines comprises the operations of the Swedish mines, Aitik, the Boliden Area and Garpenberg, the Tara mine in Ire-land, the Kylylahti mine in Finland and, as of the second quarter of 2016, the Kevitsa mine in Finland. Aitik produces copper concen-trate with some gold and silver content. The other Swedish mines produce zinc, copper and lead concentrates with variable gold and silver content. Tara produces zinc and lead concentrates and Kylylahti produces concentrate that contains copper, gold, zinc and silver. Kevitsa primarily produces nickel and copper concentrate. Business Area Mines is also responsible for sales of mined concen-trates. Business Area Smelters includes the Kokkola and Odda zinc smelters in Finland and Norway, respectively, the Rönnskär and Har-javalta copper smelters in Sweden and Finland, respectively, and the Bergsöe lead smelter in Sweden.
The Business Area is responsible for all sales of the smelters’ products and handles all raw material flows between the Group’s mines, smelters and customers. This includes responsibility for pur-chases of metal concentrates and recycling materials from external suppliers. The zinc smelters’ production primarily comprises zinc metal, but also includes silver concentrate, aluminium fluoride and sulphuric acid. The copper smelters’ production primarily comprises copper, gold, silver, lead and sulphuric acid. The copper smelters also recycle metal and electronic scrap and smelt nickel. The Bergsöe lead smelter recycles lead metal, mainly from scrap car bat-teries.
Transactions between the Business Areas, primarily involving metal concentrates, are settled on an arms’ length basis.
Group staff functions and Group-wide functions that are not assigned to Mines or Smelters are reported under the heading Other. Items where the accounting method differs between the Busi-ness Areas and the Group are reported under the heading Account-ing principles. The market valuation of financial derivative instru-ments used to manage currency risks, metal price risks and interest risks are, for example, reported under Accounting principles until such time as the underlying flows are reflected in the Income State-ment and distributed between the respective segments.
Note 2 contains details of revenues per segment and geographical market, showing the location of external customers, and providing information on major customers. Assets and investments per geo-graphical market are also reported there.
The Parent Company’s accounting principlesThe Parent Company’s annual accounts are compiled in accordance with the Swedish Annual Accounts Act, the Swedish Financial Report-ing Board’s recommendation, RFR2, Accounting for legal entities, and the statements issued by the Swedish Financial Reporting Board. Under RFR2, the Parent Company shall, in the accounts for the legal entity, apply all EU-approved International Financial Report-ing Standards (IFRS) and statements to the extent that this is possi-ble within the framework of the Swedish Annual Accounts Act and while taking into account the connection between reporting and taxa-tion. The recommendation specifies the exceptions and additions to be made in relation to IFRS. The differences between the Group’s and the Parent Company’s accounting principles are described below.
Reporting of Group contributions and shareholders’ contributionsGroup contributions received or made are reported as appropria-tions. Shareholders’ contributions are booked directly against non-restricted equity by the recipient and as an increase in the Par-ticipations in Group companies item by the contributor.
Anticipated dividendsAnticipated dividends can be reported in those cases where the Par-ent Company has the sole right to determine the size of the dividend and has ensured that the dividend does not exceed the subsidiary company’s dividend payment capacity.
Financial instrumentsFinancial instruments are not valued in the Parent Company in accordance with IAS 39. The valuation is conducted on the basis of the historical cost (see the Group’s accounting principles).
SubsidiariesParticipations in subsidiary companies are reported in the Parent Company in accordance with the historical cost method. Transaction expenses in conjunction with the acquisition of subsidiaries are reported as costs in the consolidated accounts, while in the Parent Company, they are reported as part of the historical cost.
Determination of the value of subsidiary companies is effected when there are indications of a decline in value.
1
2
3
4
5
6
7
8
9
10
11
12
13
14
15
16
17
18
19
20
21
22
23
24
25
26
27
28
29
30
31

NOTES
80 | Boliden Annual Report 2016
Note 02 Information per segment and geographical market
For additional information, please refer to “General accounting principles” for segment reporting on page 79.
Segment – Business Areas
31-12-2016 Mines Smelters OtherAccounting principles2) Eliminations The Group
External revenues 1,776 38,575 0 – – 40,351Effect on profit of metal price and currency hedging –34 – – – – –34Internal revenues 10,918 –58 73 – –10,933 –Revenues 12,659 38,516 73 – –10,933 40,316Results from participations in associated companies 5 –1 0 – – 3Operating profit 2,804 3,347 –469 – – 5,682Net financial items –308Profit after financial items 5,375Taxes –1,135Net profit for the year 4,239
Intangible fixed assets 389 3,114 4 3,508Tangible fixed assets 25,874 8,903 73 34,850Equity shares and other financial fixed assets 18 9 29 56Inventories 1,128 9,394 –445 10,077Other receivables 2,038 2,668 375 2 –1,556 3,525Assets in capital employed 29,448 24,088 36 2 –1,556 52,016Provisions, other than for pensions and tax 2,312 579 0 2,891Other liabilities 2,164 5,670 389 –1,556 6,668Liabilities in capital employed 4,476 6,249 389 –1,556 9,559Total capital employed 24,972 17,838 –354 2 42,457Depreciation 3,172 1,026 1 4,199Investments1) 2,755 1,372 0 4,127
31-12-2015 Mines Smelters OtherAccounting principles2) Eliminations The Group
External revenues 1,208 39,019 0 – – 40,228Effect on profit of metal price and currency hedging 15 – – – – 15Internal revenues 8,585 –71 52 – –8,567 0Revenues 9,808 38,948 52 – –8,567 40,242Results from participations in associated companies 3 1 2 – – 5Operating profit 1,429 2,272 –148 – 38 3,590Net financial items –234Profit after financial items 3,356Taxes –715Net profit for the year 2,641
Intangible fixed assets 378 2,988 0 – – 3,366Tangible fixed assets 19,961 8,318 94 – – 28,372Equity shares and other financial fixed assets 10 10 29 – – 48Inventories 649 7,229 – – –130 7,748Other receivables 1,168 1,836 504 89 –1,114 2,484Assets in capital employed 22,166 20,381 626 89 –1,244 42,018Provisions, other than for pensions and tax 1,468 507 7 – – 1,981Other liabilities 1,422 3,995 600 – –1,114 4,903Liabilities in capital employed 2,890 4,502 607 – –1,114 6,885Total capital employed 19,275 15,878 19 89 –130 35,131Depreciation 2,520 1,002 – – – 3,522Investments1) 2,394 1,248 8 – – 3,650
1) Excluding capitalised reclamation costs and financial leasing.
2) Comprises unrealised market values attributable to cash flow hedging and minor adjustments for other accounting principles only followed up at Group level. The market values of the cash flow hedges are, when realised, reported in the respective segments.

Introduction Market Operations Corporate Governance Financial reports
NOTES
Boliden Annual Report 2016 | 81
Boliden has three customers within Segment Smelters who account for 13% (15), 13% (8) and 7% (7), respectively, of Boliden’s external revenue. Other customers each represent less than 5% (4) of Boliden’s total external revenue. Boliden’s metals are sold primarily to industrial customers, but are also sold to base metal dealers and international metal stocks, such as the LME.
Geographical areasSales figures are based on the country in which the customer is located. Assets and investments are reported in the location of the asset.
Revenues 2016 2015
Sweden 5,289 6,755Nordic region, other 5,353 5,164Germany 12,116 13,577UK 9,951 7,836Europe, other 7,141 6,683North America 118 0Other markets 347 227
40,316 40,242
Assets in capital employed 31-12-2016 31-12-2015
Sweden 37,460 34,803Finland 10,971 3,822Norway 1,552 1,473Ireland 2,011 1,901Other countries 21 18
52,016 42,018
Investments in fixed assets1) 31-12-2016 31-12-2015
Sweden 2,314 2,393Finland 1,299 700Norway 214 283Ireland 299 274Other countries 1 0
4,127 3,650
1) Excluding capitalised reclamation costs and financial leasing.
Boliden’s total revenues of SEK 40,316 m (40,242) comprised SEK 32,827 m (34,162) from sales of metals, SEK 5,363 m (3,435) from sales of concentrates, and SEK 2,126 m (2,645) from other sales.
Note 03 Employees and personnel costs
The Parent Company has no employees. The Group management is employed by Boliden Mineral AB.
Average number of employees1) 2016 of whom, women of whom, men 2015 of whom, women of whom, men
Subsidiaries
Sweden 3,024 656 2,368 2,937 620 2,317Finland 1,551 238 1,313 1,035 167 868Norway 285 44 241 289 43 246Ireland 597 31 566 598 30 568Other 20 7 13 20 7 13Total in subsidiaries/Group 5,477 976 4,501 4,878 867 4,012
1) Refers to full-time employees.
Percentage of women at Board and Group management level 2016 2015
Board of Directors 36% 36%Group management 20% 20%
Salaries, other remuneration and social security expenses
2016 2015
Salaries and remuneration
Social security expenses
Salaries and remuneration
Social security expenses
Subsidiaries 3,072 853 2,723 757 of which, pension expenses (72)1) (50) 1)
Group, total 3,072 853 2,723 757
1) The pension cost for the year includes the SEK +224 m impact of the conversion from Tara’s defined benefit pension plan to defined contribution pension plan. In the prior year, a total of +227 m was included due to the changes to pension terms at Tara. These changes have reduced the pension costs in both 2016 and 2015. For further information, see Note 23 Provisions for pensions and similar undertakings.
Salaries and other remuneration broken down by country and between Board Members etc. and other employees
2016 2015
Board of Directors, President & other senior executives Other employees
Board of Directors, President & other senior executives Other employees
Subsidiaries in Sweden 29 1,619 26 1,509Subsidiaries abroad
Finland 7 698 6 511Norway 2 176 3 170Ireland 5 523 5 478Other 1 12 2 13Group, total 44 3,028 42 2,681
1
2
3
4
5
6
7
8
9
10
11
12
13
14
15
16
17
18
19
20
21
22
23
24
25
26
27
28
29
30
31

NOTES
82 | Boliden Annual Report 2016
Profit-sharing systemA profit-sharing system was introduced for all employees of the Boliden Group in 2007. A profit share is payable when the return on capital employed exceeds 8%, and the maximum profit share (SEK 30,000/full-time employee) is payable when the return on capital employed reaches 18%. The annual maximum allocation must never, however, exceed one third of the dividend paid to shareholders. The funds cannot be disbursed to employees until after 3 years. An allocation of SEK 19,770 (6,390) per full-time employee is proposed for 2016 as the return on capital employed was 14.6% (10.1). This is, however, conditional upon the dividend resolution by the Annual General Meeting. The allocation for each year is invested in liquid interest-bearing assets and shares in Boliden.
Remuneration paid to the Board Members and senior executivesPrinciplesFees as approved by the Annual General Meeting are payable to the Chairman of the Board and to Members of the Board. The President
and Employee representatives receive no Directors’ fees. Remunera-tion paid to the President and other senior executives comprises the basic salary, variable remuneration, other benefits and pensions. The term senior executives refers to those persons who have comprised the Group management during the year. The Group management comprised five persons, including the President, at the end of the year. All members of the Group management are employed in Sweden.
The breakdown between basic salary and variable remuneration shall be in proportion to the executive’s responsibilities and authority. The variable remuneration is maximised to 60% of the basic salary for the President, while for other senior executives, it is maximised to 40–50% of the basic salary. 10 percentage points of this is condi-tional on the purchase of Boliden shares for the gross sum before tax.
Pension benefits and other benefits payable to the President and other senior executives are taken into account when determining fixed and variable remuneration.
Remuneration and other benefits paid during the yearSpecification of remuneration paid to the Board Members and senior executives.
SEK k
Directors’ fees/ Basic salary Variable remuneration Other benefits Pension cost
2016 2015 2016 2015 2016 2015 2016 2015
Board of Directors Anders Ullberg, Chairman 1,540 1,425Marie Berglund 500 480Staffan Bohman1) – 530Tom Erixon 590 555Michael G:son Löw 550 480Ulla Litzén1) 690 630Elisabeth Nilsson 500 480Pekka Vauramo 500 –
Group management Lennart Evrell, President 7,300 7,002 2,6994) 1,5643) 179 183 2,555 2,237Other members of the Group management2) 9,223 12,5155) 2,9234) 1,3183) 319 481 3,205 2,819
1) These Directors invoice their fees, either wholly or in part, through their own companies, at which point social security contributions are payable. This is cost-neutral for Boliden.
2) A total of 4 people in 2015 and 2016.
3) The amounts are attributable to 2015 but were disbursed in 2016.
4) The amounts are attributable to 2016 but will be disbursed in 2017.
5) Includes a non-recurring cost due to changes in the Group management.
The Directors’ fees shown above also include remuneration for work on the Remuneration and Audit Committees.
Variable remunerationThe variable remuneration paid to the President in 2016 was based on the Group’s return on shareholders’ equity, and a combination of the acquisition of Kevitsa and the accident trend within the Group.
For other members of the Group management, 20−93% of the variable remuneration for 2016 was based on the Group’s financial goals and 7−80% on their personal spheres of responsibility and indi-vidual targets. Other benefits refer primarily to company cars.
PensionsThe President has a defined contribution pension plan to which the company allocates 35% of the fixed monthly salary on a rolling basis. The President decides for himself the level of survivor annuity, indem-nity for medical treatment or disability, etc. component of his insu-rance solution. The President’s retirement age is 65.
All other members of the Group management have defined contri-bution pension plans to which the company allocates 30−50% of the fixed monthly salary. The retirement age is 65.
Severance payThe President and the company shall give six and twelve months’ notice of the termination of the President’s position, respectively. If notice is given by the company, severance pay corresponding to twelve months’ salary is payable, over and above the notice period pay. Other income shall be offset against the severance pay. No seve-rance pay is payable in the event of notice being given by the Presi-dent.
Other members of the Group management have notice periods of between three and six months if they give notice themselves. If notice of termination is given by the company, the period of notice is between six and twelve months. In addition, severance pay corres-ponding to a maximum of twelve months’ salary shall be payable. Other income shall be offset against the severance pay. No seve-rance pay is payable in the event of notice being given by the member of the Group management.
Preparation and decision-making processSee the 2016 Corporate Governance Report for information.

Introduction Market Operations Corporate Governance Financial reports
NOTES
Boliden Annual Report 2016 | 83
Note 04 Auditors’ fees and reimbursement of expenses
2016 2015
Deloitte ABAudit engagements 6 5Auditing assignments over and above audit engagements 0 0Tax consultancy 0 0Other services 0 0
6 5
Note 05 Key expense items
2016 2015
Raw material costs, incl. inventory changes 17,775 21,675Personnel costs 4,063 3,623Energy costs 2,388 2,602Other external costs 6,307 5,357Depreciation 4,199 3,522
34,731 36,779
The specification of key expense items relates to the following Income Statement items: “Cost of goods sold”, “Selling expenses”, “Adminis-trative expenses” and “Research and development costs”.
Depreciation and amortisation are reported under the following Income Statement items : 2016 2015
Cost of goods sold 4,175 3,501Selling expenses 0 0Administrative expenses 19 16Research and development costs 5 4
4,199 3,522
Note 06 Other operating income
2016 2015
Payment for sludge deliveries 22 22Rental income, industrial properties 24 20Insurance payments 1 4Capital gain, sale of fixed assets 4 11Capital gain, disposal of aluminium fluoride operations at Odda 47 –Realised exchange rate profits 67 –Other 70 105
235 162
Note 07 Financial income
2016 2015
Interest income on liquid assets 2 1Other 1 3
4 4
Note 08 Financial expenses
2016 2015
Interest on loans at amortised cost 113 101Interest on currency futures 2 19Interest on pension provisions 23 32Interest on reclamation reserve 56 37Other financial items 117 47
311 238
Boliden’s average interest rate totalled 1.19% (1.47), weighted against rolling debt.
Note 09 Government subsidies
Government subsidies totalling SEK 35 m (30) were received in 2016 and SEK 32 m (29) was reported in the Income Statement. The majo-rity of the subsidies were received in Norway under a carbon dioxide compensation scheme and for energy efficiency improvement mea-sures.
Note 10 Supplementary information to the Statements of Cash Flow
The Statements of Cash Flow are drawn up in accordance with the indirect method.
2016 2015
Interest received
Interest on currency futures – –Bank interest 2 1
2 1Interest paid
Interest on currency futures –2 –20Interest on external loans –113 –118
–115 –138The following items are included in liquid assets: Cash and bank balances Short-term investments 1,503 923Kortfristiga placeringar 0 0
1,503 923
The interest paid in the Statement of Cash Flow does not include accrued interest expenses, unlike in the Income Statement. Interest paid for interest capitalisation is reported as part of the investment operations.
The short-term investments included in liquid assets comprise investments with a term of three months or less at the point of acqui-sition and which can be easily converted into liquid assets. Liquid assets are only exposed to an insignificant risk of value fluctuation.
1
2
3
4
5
6
7
8
9
10
11
12
13
14
15
16
17
18
19
20
21
22
23
24
25
26
27
28
29
30
31

NOTES
84 | Boliden Annual Report 2016
Note 11 Business combinations
Acquisitions, 2016On 1 June 2016, Boliden Mineral AB acquired all of the shares in Kevitsa Mining Oy and its subsidiary company, FinnEx Oy, from First Quantum. Kevitsa is a nickel-copper mine in Finland. The total consi-deration on a debt-free basis is USD 712 m together with adjust-ments for working capital and net debt at closing. The consideration transferred totals SEK 5,961 m after adjustments for working capi-tal and net debt, and has been paid in cash. A final adjustment to the consideration was carried out in October 2016 and entailed a downwards adjustment of the consideration by USD 2 m (SEK 18 m).
The acquisition of Kevitsa is consistent with Boliden’s growth stra-tegy and offers the potential for expanding Boliden’s operations in the form of a high quality mine that is a good fit for Boliden, both operatio-nally and geographically. The Kevitsa acquisition will also provide good synergies with Boliden’s existing mining, concentrating, smel-ting, and regional exploration operations.
The acquisition includes tangible fixed assets comprising existing assets in the mining operations. The acquisition analysis has been confirmed and is final.
Kevitsa’s operating profit (EBIT) and (EBITDA) for the period from the acquisition date of 1 June 2016 totalled SEK 166 m and SEK 500 m, respectively. The consolidated EBIT and EBITDA would have been affected in the sums of SEK 16 m and SEK 408 m, respectively, if the acquisition had taken place on 1 January 2016.
Kevitsa will, as of 2017, begin application of Boliden’s calculation model for waste rock capitalisation, which will result in a larger share being booked as an investment and an improvement in EBITDA.
The Group’s cost of goods sold includes acquisition costs totalling SEK 39 m.
Purchase price analysis, SEK m
Tangible fixed assets 5,577 Financial fixed assets 174 Deferred tax assets 213 Inventories 289 Accounts receivables and other current receivables 127 Liquid assets 37 Other provisions –181 Other current liabilities –273 Net identifiable assets and liabilities 5,961
Consideration transferred –5,961
Deducted:
Liquid assets in the company acquired 37 Change in the Group’s liquid assets –5,925

Introduction Market Operations Corporate Governance Financial reports
NOTES
Boliden Annual Report 2016 | 85
Note 12 Intangible fixed assets
Capitalised development
expenses
Patents, licences, and similar rights
Exploration rights
Emission rights Goodwill
Total intangible
fixed assets
Historical costs Opening balance 01-01-2015 132 199 232 – 3,079 3,642Investments 11 8 – – – 19Sales and retirements – –2 – – – –2Reclassifications – 5 – – – 5Translation differences –3 –8 –9 – –120 –141Closing balance 31-12-2015 140 202 223 – 2,958 3,523
Opening balance 01-01-2016 140 202 223 – 2,958 3,523Investments 8 6 – – – 14Sales and retirements – –4 – – – –4Reclassifications 25 6 – – – 30Translation differences 4 10 11 – 128 153Closing balance 31-12-2016 177 219 233 – 3,087 3,718
Amortisation Opening balance 01-01-2015 –17 –109 – – – –128Amortisation for the year –24 –14 – – – –39Sales and retirements 2 – – – 2Translation differences 1 5 – – – 5Closing balance 31-12-2015 –41 –117 – – – –158
Opening balance 01-01-2016 –41 –117 – – – –158Amortisation for the year –34 –14 – – – –48Sales and retirements – 4 – – – 4Translation differences –1 –6 – – – –7Closing balance 31-12-2016 –76 –133 – – – –211
Reported value, as per Balance Sheet, 31-12-2015 100 85 223 – 2,958 3,366Reported value, as per Balance Sheet, 31-12-2016 101 86 233 – 3,087 3,508
Amortisation according to plan, included in the operating profit
2015 –24 –14 – – – –392016 –34 –14 – – – –48
Goodwill The Group’s goodwill item arose primarily in conjunction with the acquisition of the operations from Outokumpu at the end of Decem-ber 2003. Goodwill from the 2003 acquisition has principally been allocated to the Group’s Smelters segment. Impairment tests have been carried out on the goodwill value in the manner described in Note 13 under Impairment tests – Intangible and tangible fixed assets.
Emission rights The Boliden Group had a surplus of emission rights in 2016 and there was consequently no impact on the Group’s financial reports. Emis-sion rights reporting is described in Note 1 Significant accounting and valuation principles.
Exploration rightsIn 2014, Boliden acquired the exploration rights and mining opera-tions of the Kylylahti copper mine in Finland. The acquisition yielded intangible fixed assets totalling SEK 221 m in respect of exploration rights. No depreciation of these assets has been effected. Acquired exploration rights are adjudged to have an indefinite useful life and that there is no predictable limit on the time period during which the asset is expected to generate net payments to Boliden. Impairment testing in respect of exploration rights is carried out in accordance with IFRS 6 Exploration for and Evaluation of Mineral Resources, and impairment testing is, therefore, only carried out in the presence of an indication that the need to write down an asset exists.
1
2
3
4
5
6
7
8
9
10
11
12
13
14
15
16
17
18
19
20
21
22
23
24
25
26
27
28
29
30
31

NOTES
86 | Boliden Annual Report 2016
Note 13 Tangible fixed assets
Buildings and land
Deferred mining costs
Machinery and other technical
facilities
Equipment, tools, fixtures
and fittings Work in
progress
Total tangible fixed
assets
Historical costs Opening balance 01-01-2015 8,720 10,588 36,267 1,508 476 57,558Investments 206 923 1,026 4 1,468 3,628Capitalised reclamation costs 27 – –106 – – –80Sales and retirements –9 –1 –523 –4 – –537Reclassifications 17 – 206 –1 –228 –6Translation differences –178 –82 –567 –126 –32 –986Closing balance 31-12-2015 8,784 11,428 36,302 1,380 1,684 59,577
Opening balance 01-01-2016 8,784 11,428 36,302 1,380 1,684 59,577Acquisitions 825 1,895 2,761 0 96 5,577Investments 301 1,369 1,701 30 712 4,113Capitalised reclamation costs 50 – 537 7 – 594Sales and retirements –22 – –835 –17 – –874Reclassifications 102 – 248 23 –404 –30Translation differences 210 122 719 131 33 1,215Closing balance 31-12-2016 10,250 14,813 41,432 1,556 2,120 70,171
Depreciation Opening balance 01-01-2015 –4,042 –4,428 –19,246 –1,220 – –28,935Depreciation for the year –326 –1,045 –2,069 –43 – –3 ,483Sales and retirements 8 1 523 4 – 536Reclassifications – – –1 1 – –Translation differences 114 42 414 107 – 677Closing balance 31-12-2015 –4,245 –5,430 –20,379 –1,151 – –31,205
Opening balance 01-01-2016 –4,245 –5,430 –20,379 –1,151 – –31,205Depreciation for the year –386 –1,412 –2,310 –43 – –4,151Sales and retirements 13 – 776 9 – 798Reclassifications – – – – – –Translation differences –127 –58 –467 –111 – –763Closing balance 31-12-2016 –4,745 –6,900 –22,380 –1,296 – –35,322
Reported value, as per Balance Sheet, 31-12-2015 4,539 5,998 15,923 229 1,684 28,372Reported value, as per Balance Sheet, 31-12-2016 5,505 7,913 19,052 260 2,120 34,850
Depreciation according to plan included in the operating profit 2015 –326 –1,045 –2,069 –43 – –3,4832016 –386 –1,412 –2,310 –43 – –4,151
Capitalised reclamation costs include expenses in relation to the dis-mantling and removal of assets and the restoration of the sites where the assets are located. Accumulated capitalised reclamation costs total SEK 1,659 m (1,065). Accumulated depreciation totals SEK –335 m (–240). The year’s capitalised reclamation costs total SEK 594 m (−80) and are primarily attributable to amended evalua-tions, principally in respect of environmental permits at Aitik and the application of relevant EU legislation for the Finnish mines. The change is reported in accordance with IFRIC 1, Changes in Existing Decommissioning, Restoration and Similar Liabilities. The year’s rec-
lamation costs are not included in the consolidated key ratios for the year’s investments, and have no liquid effect on the Group’s cash flow.
Investments in tangible fixed assets include financial leasing in the sum of SEK 0 m (0), see also Note 14 Leasing charges. The same principle applies to financial leasing as to the year’s capitalised recla-mation costs with regard to key ratios and cash flow.
At the end of the year, there were no material, contractual under-takings to acquire tangible fixed assets to report.
Interest expenses carried forward included in the residual value according to plan
31-12-2016 31-12-2015
Reported value, SEK m
Interest rate, %
Reported value, SEK m
Interest rate, %
Rönnskär’s expansion, completed 2000 31 6.8 34 6.8Odda’s expansion, completed 2004 6 4.0 6 4.0Aitik’s expansion, completed 2011 168 2.5 181 2.5Rönnskär, electronic scrap recycling, completed 2012 10 3.2 11 3.2Garpenberg’s expansion, completed 2014 91 1.7 97 1.7

Introduction Market Operations Corporate Governance Financial reports
NOTES
Boliden Annual Report 2016 | 87
Impairment tests – Intangible and tangible fixed assetsImpairment tests are carried out yearly, or throughout the year if an event occurs that may result in an impairment requirement, and are based on the Group’s annual budget and strategic planning work. The planning horizon is the estimated lifespan of each mine – typically between 5 and 30 years − and 10 years for smelters. Boliden’s oper-ations are characterised by long-term production plans in which every mine has set production plans for the entire estimated lifespan of the mine in question, while a substantial part of the smelters’ con-centrate supply is regulated by means of long-term delivery agree-ments. This long-term production planning also enables the use of long-term cash flow forecasts. Additional growth assumptions are not included in extrapolated cash flow forecasts beyond the planning horizon, and smelters’ cash flows from year eleven onwards are, therefore, extrapolated using year ten as a base, after which no growth is taken into account. The value of discounted cash flows is highly sensitive to metal prices, treatment and refining charges (TC/
RC), and exchange rates (see sensitivity table on page 56 of the Risk management section of the Directors’ Report). The present value of estimated future cash flows is based on the budget and planning prices adopted by the Board of Directors. Planning prices for the first year comprise futures prices on metals and currency markets. The long-term planning prices used in year two and thereafter con-sist of an anticipated average price over a single business cycle, gen-erally 10 years. The long-term planning prices are based on internal and external analyses, primarily with regard to anticipated demand for metals and margin costs for metal producers. The long-term planning prices are compared with average long-term prices from different market players, such as industry analysts and other mining and smelting companies. The Group does not believe that futures prices from base metals markets are good indicators of long-term price trends, in that they are heavily dependent on spot prices.
The long-term real planning prices are currently as listed in the table below.
2016 2015
Metal prices Treatment/refining charges Exchange rates Metal prices Treatment/refining charges Exchange rates
Copper USD 6,200/t USD 80/tonne/USc 8.0/lb. USD/SEK 7.50 USD 6,600/t USD 80/tonne/USc 8.0/lb. USD/SEK 7.00Zinc USD 2,200/t USD 210 base USD 2,200 USD/NOK 7.50 USD 2,300/t USD 220 base USD 2,300 USD/NOK 6.30
Lead USD 2,100/t USD 215 EUR/USD 1.15 USD 2,300/t USD 225 EUR/USD 1.25Gold USD 1,100/tr.oz. USD 1,200/tr.oz.Silver USD 18.0/tr.oz. USD 20.0/tr.oz.
Individual mines or mining areas with centralised concentrating facilities, copper smelters, zinc smelters, Boliden Bergsöe AB and Boliden Commercial AB are classified as cash-generating units. The discounted real cash flows before tax for the respective cash-gen-erating units are compared with the book value of capital employed. The cash flows are discounted with a real discount rate before tax of 9% (10), which corresponds to the weighted capital cost. The Group’s goodwill is allocated to Segment Smelters, rather than to cash-generating units, in accordance with monitoring of goodwill. The value in use of the Group’s assets is held to exceed the reported values and no impairment requirement is consequently deemed to exist.
An increase in the discount rate of one percentage point would not
give rise to any impairments. A lowering of all long-term planning prices for metals by 10% would not result in any impairment require-ments for Segment Smelters, while for Segment Mines, a corre-sponding lowering would result in the book value exceeding the dis-counted cash flows in respect of a cash-generating unit. Nor, if the long-term planning prices for metals remain unchanged, would a 10% weakening of the US dollar against all other currencies occasion an impairment requirement for Segment Mines or Smelters. The calcu-lation does not include any compensatory movements in metal prices, TC/RC, or the prices of by-products or input goods, which has histori-cally often been the case. A 10% fall in TC/RC for all metals would not result in any impairment requirement in Segment Smelters. For Seg-ment Mines, the same fall would have a positive effect.
Note 14 Leasing charges
Group
Assets held via operational leasing agreements 2016 2015
Leasing charges paid during the financial year 21 21Contracted future leasing charges
Maturity within one year 17 16Maturity later than one year, but within five years 19 20Maturity later than five years 0 0
Assets held via financial leasing agreements 2016 2015
Machinery and other equipment
Historical cost 45 45Accumulated depreciation –30 –25Closing value on 31 December 15 20
The companies with financial leasing agreements are Kylylahti Cop-per OY and Kokkolan Teollisuusvesi OY. Kylylahti’s leasing agreements refer to mining machinery. Kokkolan has an agreement in respect of the rent of and renewal of a water purification plant’s automation system and another in respect of usufruct for active carbon filters for ionized water replacement systems and domestic water supply.
1
2
3
4
5
6
7
8
9
10
11
12
13
14
15
16
17
18
19
20
21
22
23
24
25
26
27
28
29
30
31

NOTES
88 | Boliden Annual Report 2016
Note 15 Participations in Group companies
Specification of the Parent Company’s and the Group’s holdings of participations in Group companies.
Subsidiary/Co. reg. no./Registered office
31-12-2016
Book value 2015
Shares/ participations
Percent-age share Book value
Boliden Limited, 3977366, Toronto, Canada 85,811,638 100 – – Boliden Power Ltd, 700245, Toronto, Canada
Ontario Inc, 1393512, Toronto, Canada
Boliden BV, 18048775, Drunen, Netherlands
Boliden Apirsa S.L under liquidation, ESB-41518028, Aznalcóllar (Seville), Spain
Boliden Mineral AB, 556231-6850, Skellefteå 1,650,000 100 3,911 3,911 Mineral Holding Sweden AB, 556610-2918, Skellefteå
Boliden Harjavalta Oy, 1591739-9, Harjavalta, Finland
Boliden Kokkola Oy, 0772004-3, Kokkola, Finland
Kokkolan Teollisuusvesi OY, 2558533-2, Kokkola, Finland
Boliden Commercial AB, 556158-2205, Stockholm
Boliden Commercial UK Ltd, 5723781, Warwickshire, UK
Boliden Commercial Deutschland GmbH, 165903, Neuss, Germany
Tara Mines Holding Ltd, 60135, Navan, Ireland
Boliden Tara Mines Ltd, 33148, Navan, Ireland
APC Properties Ltd, 361022, Navan, Ireland
Irish Mine Development Ltd, 174811, Navan, Ireland
Tara Prospecting Ltd, 34434, Navan, Ireland
Tara Exploration and Development Company Ltd, E1292, Navan, Ireland
Dowth Investment Holdings Ltd, 338698, Toronto, Canada
Motet Investments Ltd, E3093, Navan, Ireland
Boliden Odda AS, 911177870, Odda, Norway
Boliden Bergsöe AB, 556041-8823, Landskrona
Boliden Bergsoe AS, A/S244629, Glostrup, Denmark
Boliden International AB, 556040-1399, Skellefteå
Kuhmo Nickel Ltd, 05311516, London, UK
Boliden Kylylahti Oy, 1925412-3, Polvijärvi, Finland
Vulcan Exploration BV, 821652345, Amsterdam Zuidoost, Netherlands
Kuhmo Metals Oy, 1925450-2, Polvijärvi, Finland
Boliden Kevitsa Mining Oy, 2345699-1, Sodankylä, Finland
Boliden FinnEx Oy, 2345662-5, Sodankylä, Finland
Other subsidiaries, dormant or of lesser significance
3,911 3,911
On 1 June 2016, Boliden Mineral AB acquired 100% of the shares in Boliden Kevitsa Mining Oy and its subsidiary company Boliden FinnEx Oy. For additional information, see Note 11.
Note 16 Participations in associated companies
31-12-2016 31-12-2015
Book value at beginning of year 22 19Exchange rate differences 0 –1Share in associated companies’ profits for the year 3 5Book value at year-end 25 22
Co. reg. no. Registered office Number of
participations Percentage
share Value of equity
share in the Group
Indirectly owned
KIP Service OY 2240650-3 Kokkola 3,280 46 7Aitik EcoBallast AB 556726-2299 Gällivare 500 50 13KB Aitik EcoBallast 969731-9748 Gällivare 1,000 50 –Industrikraft i Sverige AB 556761-5371 Stockholm 20,000 20 5
25

Introduction Market Operations Corporate Governance Financial reports
NOTES
Boliden Annual Report 2016 | 89
Note 17 Taxes
Current tax expenses 2016 2015
Tax expenses for the period –953 –656Adjustment of tax attributable to previous years –5 2
–958 –654
Deferred tax expenses (–) /tax income (+) Deferred tax income/tax expenses in respect of temporary differences –275 –38Deferred tax income in fiscal value capitalised during the year in loss carry forward deductions 98 –Deferred tax expense resulting from the utilisation of previously capitalised fiscal value in loss carry forward deductions – –23
–177 –61Total reported tax expenses (–) /tax income (+) –1,135 –715
Reconciliation of effective tax Reported profit before tax 5,375 3,356
Tax according to current taxation rate –1,184 –726Fiscal effect of non-deductible expenses –52 –4Fiscal effect of non-taxable income 8 7Market valuation of deferred tax receivables 0 6Capitalised fiscal value in loss carry forward deductions 98 –Adjustment of tax attributable to previous years –5 2Total reported tax expenses –1,135 –715
Tax expenses comprise 21.1% (21.3) of the Group’s pre-tax profit. The anticipated tax expense for 2016 of 22.0% (21.6) has been calculated given the current Group structure and applicable taxation rates in the respective countries.
Deferred tax assets/tax liabilityThe tax assets reported in the Balance Sheet and the provision for deferred tax relates to the following assets and liabilities.
Group
31-12-2016 31-12-2015
Deferred tax assets
Deferred tax liability Net
Deferred tax assets
Deferred tax liability Net
Intangible assets 1 –1 – 1 –1 –Buildings and land 103 –143 –40 116 –107 9Machinery and fixtures and fittings 1 –2,766 –2,765 – –2,714 –2,714Deferred mining costs – –227 –227 – –189 –189Other tangible fixed assets 1 –101 –100 – –3 –3Inventories 20 –356 –336 13 –292 –279Long-term liabilities 387 –1 386 253 –1 252Current liabilities 21 –1 20 1 –19 –18Tax losses carried forward 152 – 152 – – –Total 686 –3,596 –2,910 384 –3,326 –2,942
Offset within companies –534 534 – –361 361 –Total deferred tax assets/ tax liability 152 –3,062 –2,910 23 –2,965 –2,942
Change in deferred tax in respect of temporary differences and tax losses carried forward
Group 2016
Amount at the beginning
of the year Acquisitions
Reported in the Income Statement
Reported under Other
comprehensive income
Translation difference
Amount at year-end
Intangible assets – – – – – –Buildings and land 9 – –58 – 9 –40Machinery and fixtures and fittings –2,714 – –21 –1 –29 –2,765Deferred mining costs –189 –73 45 – –10 –227Other tangible fixed assets –3 21 –116 – –2 –100Inventories –279 – –57 – – –336Long-term liabilities 252 35 –14 112 1 386Current liabilities –18 – 20 18 – 20Tax losses carried forward – 123 24 – 5 152Total –2,942 106 –177 129 –26 –2,910
1
2
3
4
5
6
7
8
9
10
11
12
13
14
15
16
17
18
19
20
21
22
23
24
25
26
27
28
29
30
31

NOTES
90 | Boliden Annual Report 2016
Change in deferred tax in respect of temporary differences and tax losses carried forward
Group 2015
Amount at the beginning
of the year
Reported in the Income Statement
Reported under Other
comprehensive income
Translation difference
Amount at year-end
Intangible assets – – – – –Buildings and land –18 36 – –9 9Machinery and fixtures and fittings –2,575 –167 – 28 –2,714Deferred mining costs –219 21 – 9 –189Other tangible fixed assets –5 2 – – –3Inventories –374 95 – – –279Long-term liabilities 341 –26 –57 –6 252Current liabilities –18 1 –1 – –18Tax losses carried forward 23 –23 – – –Total –2,845 –61 –58 22 –2,942
Deferred tax assets in respect of tax losses carried forward in Nor-way have been taken into account in full as the company is of the opin-ion that Boliden will be able to generate sufficient taxable income in the future to exploit these tax losses carried forward. Unutilised tax losses carried forward for which a deferred tax assets has not been reported totalled SEK 135 m (111) in Canada on 31 December 2016, of which SEK 21 m matures in 2017, and the remaining SEK 114 m between 2027 and 2036.
Note 18 Inventories
31-12-2016 31-12-2015
Raw materials and consumables 5,496 4,177Goods under manufacture 2,843 2,562Finished goods and tradable goods 1,737 1,005Advances to suppliers – 4
10,077 7,748
Note 19 Accounts receivable
On 31 December 2016, accounts receivable falling due for payment in more than 30 days totalled SEK 13 m (13), corresponding to 1.0% (1.0) of the total accounts receivable. The maturity structure is shown in the following table:
31-12-2016 31-12-2015
Accounts receivable, not due 1,796 1,114Due: 0−30 days 206 110Due: 31−60 days 12 6Due: 61−90 days 1 0Due: >90 days 0 7
2,017 1,236
The majority of the Group’s accounts receivable relate to European customers. Accounts receivable in foreign currencies have been val-ued at the closing day rate. Note 2, Information per business seg-ment and geographical market shows the breakdown of revenues by geographical area.
Accounts receivable are only written down to a minor extent and doubtful receivables total only small amounts. Confirmed bad debt losses are insignificant.
For information on the management of credit risks, see the sec-tion entitled Credit risks in accounts receivable on page 57 that forms part of the Risk management section of the Directors’ Report.
Note 20 Other current receivables
31-12-2016 31-12-2015
Energy taxes 167 –
Other prepaid expenses and accrued income 134 372VAT recoverable 604 413Other current receivables 192 86
1,097 871
Note 21 Related Party Disclosures
RelationshipsThe Parent Company’s directly owned subsidiaries are reported in Note 15, Participations in Group companies, while its participations in associated companies are reported in Note 16, Participations in Associated companies. Information regarding the Members of the Board and Group management, and the remuneration paid to the same, is presented in Note 3, Employees and personnel costs and in the Corporate Governance Report on pages 58−67.
TransactionsNo Member of the Board or senior executive in the Group partici-pates or has participated, directly or indirectly, in any business trans-actions during the current or previous financial year between them-selves and the Group which are or were unusual in nature with regard to their terms. Nor has the Group granted loans, issued guar-antees or provided sureties to any of the Members of the Board or senior executives of the Company.
Tax paid by country
2016 2015
Sweden 339 102Finland 317 168Ireland –23 –Norway 75 –Other 1 1
709 272

Introduction Market Operations Corporate Governance Financial reports
NOTES
Boliden Annual Report 2016 | 91
Note 22 Shareholders’ equity
Share capital 31-12-2016 31-12-2015
Opening number of shares 273,511,169 273,511,169
Change during the year – –Closing number of shares 273,511,169 273,511,169
Nominal value, SEK 578,914,338 578,914,338Nominal value per share 2.12 2.12
Shareholders’ equity, SEK m 31-12-2016 31-12-2015
Share capital 579 579Total shareholders’ equity 29,394 25,807Shareholders’ equity attributable to the Parent Company’s shareholders 29,386 25,801Shareholders’ equity per share, SEK 107.44 94.33
Earnings per share 2016 2015
Net profit for the year attributable to the Parent Company’s share-holders, SEK m 4,237 2,640Average number of shares, basic and diluted 273,511,169 273,511,169Number of own shares held – –Earnings per share, SEK 15.49 9.65
Shareholders’ equityThe Articles of Association for Boliden AB state that the share capi-tal shall comprise a minimum of SEK 150,000,000 and a maximum of SEK 600,000,000. The share capital comprises a single class of share. There are no potential shares and hence no dilution effect.
The Annual General Meeting of the Company’s shareholders held on 3 May 2016 resolved to pay a dividend of SEK 3.25 (2.25) per share, equivalent to a total payment of SEK 888,911,299.
Boliden’s Board of Directors will propose to the Annual General Meeting that a dividend of SEK 5.25 (3.25) per share be paid, equiva-lent to a total of SEK 1,435,933,637. Boliden’s dividend policy stipu-lates that approximately one third of the net profit after tax shall be disbursed in the form of dividends.
Earnings per shareEarnings per share are calculated by dividing the profit for the period attributable to the Parent Company’s shareholders by the average number of shares.
Asset managementBoliden’s managed assets comprise shareholders’ equity. There are no other external capital requirements than those mandated in the Swedish Companies Act.
Boliden monitors its capital structure with the aid of the net debt/ equity ratio, amongst other things. The net debt/equity ratio is calcu-lated as the net of interest-bearing provisions and liabilities minus financial assets including liquid assets divided by shareholders’ equity.
See page 8 for details of Boliden’s dividend policy and net debt goal.
Note 23 Provisions for pensions and similar undertakings
Boliden has established pension plans in the countries in which the company operates. The pension plans include both defined benefit and defined contribution plans. The defined benefit plans provide the employee with a fixed amount of their final salary in conjunction with retirement. Boliden’s defined benefit plans are mainly operated in Sweden and Ireland, with a very small number also operated in Nor-way and Finland. The defined contribution plans comply with local reg-ulations in the respective countries. Boliden has defined contribution plans in Sweden, Ireland, Finland and Norway.
SwedenBoliden’s pension undertakings in Sweden are not invested in funds. The pension undertakings are secured through the Swedish PRI/ FPG system and through insurance companies. The majority of the pension undertakings for salaried employees are secured through insurances with Alecta and are lifelong retirement pensions. The benefits offered by the lifelong pensions are determined using differ-ent percentages for different salary intervals. Alecta has not pro-vided sufficient information for 2016 for the ITP plan (supplementary pensions for salaried employees) to be reported as a defined benefit plan, and it is consequently reported in accordance with UFR 10 as a defined contribution plan. A surplus in Alecta can be allocated to the policyholders and/or those insured. At the end of the year, Alecta’s collective consolidation level was 149% (153). The collective consoli-dation level comprises the market value of Alecta’s assets as a per-centage of the insurance undertakings calculated in accordance with Alecta’s actuarial calculation assumptions, which do not correspond with those of IAS 19. Boliden’s pension undertakings account for only a very small percentage of Alecta’s insurance undertakings. There are, in addition to the ITP plan, a few previously earned temporary retirement pensions within Boliden.
“Gruvplanen” (GP) is a pension agreement for underground workers. The plan grants underground workers entitlement to receive a pen-sion between the ages of 60 and 65 and between 65 and 70 under certain preconditions based on an average income. The “Gruvplanen” plan was closed to new earners in 2011 and replaced by a defined con-tribution pension plan (GLP). The commitments change from vesting to non-vesting in conjunction with retirement.
IrelandThe pension undertaking is secured by the transfer of funds to four defined benefit plans and one defined contribution plan. The defined benefit plans are closed to new employees. The pension plans are con-trolled by the Irish Pensions Board and Irish Pensions Legislation. All defined benefit plans are invested in funds. The largest defined benefit plan and the defined contribution pension plan have Board Members from both the company and the members. Boliden has appointed the Irish Pension Trust to manage the other defined benefit plans.
The financial position of the pension plans is reviewed every three years by an actuary in order to determine the requisite financing level. When a pension plan is deemed to be in deficit, which is cur-rently the case for the four defined benefit plans, a financing proposal must be submitted to the Irish Pension Board in order to demon-strate how the deficit will be cleared. The actuary also ensures that Boliden receives annual reports on the financial position in accord-ance with accounting requirements. Payments are made to all five plans through a combination of contributions from both Boliden and employees in accordance with employment contracts. No other deposits are made.
It was decided, in 2016, that the largest defined benefit pension plan would be converted to a defined contribution plan. The conver-sion of the pension plan resulted in a net effect on the result of SEK 224 m. The amounts are reported gross under the Settlements/curtailments in pension plans and Cost of defined contribution pen-sion plans items. In 2015, the Irish Pension Board approved the pro-posal, amongst other things, to reduce the pension benefits by 10% for all members with the exception of those with pensions of less than EUR 12 k per annum in order to manage the deficit in the pen-sion plans. This was reported in 2015 as a reduction of SEK 227 m in the pension undertaking.
The Board of the pension plans is responsible for investments in plan assets. The majority of the shares are invested in companies operating in the health care, financial services and raw materials sectors that are based in North America (62%) and Europe (26%), and which are measured against sector indices and other bench-marks. Some of the assets are invested in index funds. A significant share of the assets, 54%, is invested in European government bonds in order to reduce the risk. Liquid assets are held in order to facili-tate pension disbursements.
NorwayThe pension undertaking is primarily secured by means of defined contribution pension plans in that Boliden wound up the majority of the defined benefit plans in 2012. The defined benefit plan only com-prises the operations manager. Other employees in Norway are cov-
1
2
3
4
5
6
7
8
9
10
11
12
13
14
15
16
17
18
19
20
21
22
23
24
25
26
27
28
29
30
31

NOTES
92 | Boliden Annual Report 2016
ered by a defined contribution plan that covers all employees and a contractual early retirement pension (AFP) with supplementary bene-fits from the ages of 62 to 67.
Events during the yearThe current value of Boliden’s pension undertaking is lower than last year’s level (recalculated) and is largely due to the effect of the transi-tion to defined contribution pension plans in Ireland, as described above. The market value of the plan assets has decreased, year on year, as a result of these changes.
The Group’s reported pension liability totals SEK 925 m (1,075), which includes endowment insurance and similar undertakings total-ling SEK 94 m (91) in respect of defined contribution pension plans in Sweden.
Actuarial assumptions during the yearCosts, undertakings and other factors in pension plans are calcu-lated by means of the Projected Unit Credit Method, using the assumptions shown in the table below.
The discount rate is established for every geographical market with reference to the market return on company bonds on the clos-ing day. In Sweden, where there is no functioning market for such bonds, the market return on housing bonds has been used and a pre-mium for a longer term added, based on the duration of the pension undertakings.
The financing cost of the net pension liability is calculated using the discount rate and is reported under Boliden’s net financial items.
Actuarial assumptions (weighted averages)
Sweden Ireland Other
2016 2015 2016 2015 2016 2015
Discount rate, % 2.50 3.00 1.50 2.40 1.3-2.7 2.30Future pay increases, % 2.50 3.00 1.50 0.00 2.3-2.5 2.75Future pension increases, % 1.50 1.50 0.00 0.00 1.5 0.10Life expectancy Women 89 90 90 90 90 –Men 87 88 88 90 86 –
Specification of provisions for pensions
Sweden Ireland Other Total
2016 2015 2016 2015 2016 2015 2016 2015
Pension undertaking at the beginning of the year 737 744 237 648 11 9 985 1,401Reclassifications – – – – 6 – 6Defined benefit plan costs 56 51 –400 –156 4 8 –340 –98Revaluations recognised in Other comprehensive income 11 –19 262 –169 – – 274 –189Payments and disbursements –38 –40 –57 –68 –6 –6 –101 –114Translation differences – – 9 –17 –1 0 8 –16Pension undertaking at the end of the year1) 766 737 51 237 14 11 831 985
Endowment insurance and similar undertakings 94 91 – – – – 94 91Net debt, as per Balance Sheet2) 860 827 51 237 14 11 925 1,075
Specification of provisions for pensions, as per 31 December
Pension undertakings, funded – – 283 2 197 21 1 304 2,198Pension undertakings, unfunded 766 737 – – 9 10 775 747Fair value of plan assets – – –232 –1 960 –16 – –248 –1,960Pension undertakings 766 737 51 237 14 11 831 985
Endowment insurance and similar undertakings 94 91 – – – – 94 91Net debt, as per Balance Sheet 860 827 51 237 14 11 925 1,075
Specification of costs
Cost of defined benefit plans Current service cost 35 36 25 49 4 8 64 93Past service cost – – – –227 – – – –227Interest expense on undertaking 20 18 27 54 0 – 47 72Interest income from plan assets – – –23 –40 – – –23 –40Special payroll tax and other taxes 1 –3 – – – – 1 –3Administrative costs and premiums paid – – 3 7 0 – 3 7Settlements/curtailments of pension plans – – –432 – – – –432 –Total cost of defined benefit plans 56 51 –400 –156 4 8 –340 –98
Cost of defined contribution plans 50 63 230 – 156 117 436 180Total pension costs 106 114 –170 –156 160 125 96 82
1) Undertakings in Sweden include undertakings in accordance with PRI/FGI totalling SEK 449 m (395), undertakings for underground workers totalling SEK 236 m (262), and other undertakings totalling SEK 1 m (3).
2) The pension liability reported in the Balance Sheet includes not only the defined benefit pension undertaking and endowment insurance but also special payroll tax in Sweden.

Introduction Market Operations Corporate Governance Financial reports
NOTES
Boliden Annual Report 2016 | 93
Reconciliation of pension undertaking
Sweden Ireland Other Total
2016 2015 2016 2015 2016 2015 2016 2015
Present value of undertakings at the beginning of the year 737 744 2,197 2,599 11 9 2,945 3,352Reclassifications – – – – 20 20Current service cost 35 36 25 49 5 8 65 93Past service cost – – – –227 – – – –227Interest expense on undertaking 20 18 27 54 0 – 47 72Special payroll tax 1 –3 – – – – 1 –3Fees from plan participants – – 7 17 – – 7 17Revaluation of defined benefit pension liability recognised in Other comprehensive income 11 –18 274 –133 – – 285 –151 of which profit/loss as a result
of financial assumptions 22 –24 223 –117 – – 245 –141 of which profit/loss as a result
of experience-based assumptions –11 6 52 –16 – – 40 –10Disbursements made –38 –40 –35 –66 –7 –6 –80 –111Disbursements in conjunction with terminationsCurtailments and settlements – – –2,298 – – – –2,298 –Translation differences – – 85 –95 1 0 85 –95Present value of undertakings at the end of the year 766 737 283 2,197 30 11 1,079 2,945
Endowment insurance and similar undertakings 94 91 – – – – 94 91of which amounts attributable to active employees 376 534 32 1 123 17 4 425 1 661of which amounts attributable to holders of paid up policies 142 56 18 190 – – 160 246of which amounts attributable to retired employees 168 237 232 884 13 6 413 1 127
Reconciliation of plan assets
Fair value of plan assets at the beginning of the year – – 1,960 1,951 0 0 1,960 1,951Reclassifications – – – – 14 – 14 –Interest income on plan assets – – 23 40 0 0 24 40Return on plan assets excluding amounts included in net interest items recognised in Other compre-hensive income – – 13 37 – – 13 37Fees from the employer excluding disbursements in conjunction with terminations – – 57 69 –1 – 56 69Fees from plan participants – – 7 17 – – 7 17Disbursements made – – –35 –66 – – –35 –66Administrative costs, taxes and premiums paid – – –4 –9 1 – –4 –9Curtailments and settlements – – –1,866 – – – –1,866Translation differences – – 77 –80 2 – 79 –80Fair value of plan assets at the end of the year – – 232 1,960 16 0 248 1,960
Net debt, as per Balance Sheet1) 925 1,075
1) Including endowment insurance and similar undertakings totalling SEK 94 m (91).
Specification of plan assets
Listed shares and participations – – 97 949 – 0 97 949Interest-bearing securities – – 125 957 – – 125 957Liquid assets – – 5 50 – – 5 50Other – – 5 4 16 – 5 4
– – 232 1,960 16 0 248 1,960
1
2
3
4
5
6
7
8
9
10
11
12
13
14
15
16
17
18
19
20
21
22
23
24
25
26
27
28
29
30
31

NOTES
94 | Boliden Annual Report 2016
Defined benefit pension liability terms Sweden Ireland Other Total
Benefits scheduled for disbursement within 12 months 46 14 2 62Benefits scheduled for disbursement within 1−5 years 182 59 7 248Benefits scheduled for disbursement after 5 years or more 632 169 26 827
The maturity of plan assets in Ireland have reduced anticipated payments after 5 years or more. The weighted average duration of the defined benefit pension liability is 16 years for Sweden and 11 years for Ireland.
Note 24 Other provisions
31-12-2016 31-12-2015
Reclamation costs 2,873 1,943Other 18 38
2,891 1,981
Of which: Long-term 2,655 1,784Short-term 236 197
2,891 1,981
Reclamation costsProvisions for reclamation costs are made on the basis of an assess-ment of future costs based on current technology and other condi-tions. Provision has been made for the current value of estimated undertakings in accordance with IAS 37 and IFRIC 1. Gradual reclama-tion is preferable, although most of the reclamation work is carried out after a decision to decommission. In historical terms, Boliden has suc-ceeded in extending the useful life of its mining assets compared with the original plans. Reclamation provisions are reviewed on an ongoing basis. The previous year’s addition to existing provisions is primarily attributable to a new environmental permit at Aitik and the effect of applying relevant EU legislation for the Finnish mines.
Group
2016 2015
Reclamation costs Other Total
Reclamation costs Other Total
Book value at beginning of year 1,943 38 1,981 2,057 62 2,119Additions to existing provisions 831 4 834 162 6 168Acquisitions 181 1 182 – – –Reversal of existing provisions –9 –22 –30 –188 –22 –210Payments –170 –4 –174 –105 –1 –106Discount effect for the period 56 56 37 – 37Translation difference 41 1 42 –20 –7 –27Book value at year-end 2,873 18 2,891 1,943 38 1,981
Anticipated date of outflow of resources:
Within one year 235 1 236 194 3 197Between one and two years 195 11 206 91 22 113Between three and five years 89 1 90 206 1 207More than five years 2,354 4 2,358 1,452 12 1,464
2,873 18 2,891 1,943 38 1,981
Note 25 Risk information
See the section entitled “Risk management” in the Directors’ Report on pages 54–57 for a description of Boliden’s financial risks. The amounts reported refer to the Group.
Sensitivity analysis of the effect on the defined benefit pension liability (+increase/−decrease in pension liability) Sweden Ireland Total
Significant actuarial assumptions 2016 2016 2016Discount rate, % +0.5 –49 –15 –64
–0.5 53 17 70Pay increases, % +0.5 46 5 51
–0.5 –39 – –39Increased life expectancy, years Man + 1 16 12 28
Woman + 1 –16 0 –16
The sensitivity analysis has been conducted on the basis of the above mentioned actuarial changes as Boliden is of the opinion that they can have a substantial impact on the pension liability. It is also likely that changes to these assumptions will be made. The calculations have been performed by means of the analysis of each change individ-
ually and the calculations have not taken into account any interde-pendence between the assumptions. No sensitivity analyses have been conducted for Norway and Finland as the amounts in question are insignificant. Other countries do not have any defined benefit pen-sion liabilities.

Introduction Market Operations Corporate Governance Financial reports
NOTES
Boliden Annual Report 2016 | 95
Note 26 Financial liabilities and maturity structure
31-12-2016,SEK m
Financial liabilities Maturity structure2)
Currency Interest1)
%Reported
amount 2017 2018 2019 2020 2021 2022+
Bilateral loans EUR 1.43 1,499 221 795 221 157 98 98Bilateral loans SEK 1.70 545 10 10 10 10 549Bond3) SEK 1.90 500 10 10 10 503Term loan EUR/SEK 1.30 5,858 76 76 76 5,890Commercial papers3) SEK 0.60 1,687 1,697Leasing, other 11 4 5 2Accounts payable 4,239 4,239Derivative instruments 46 46Total 14,386 6,304 896 319 6,559 647 98
31-12-2015,SEK m
Financial liabilities Maturity structure2)
Currency Interest1)
%Reported
amount 2016 2017 2018 2019 2020 2021+
Bilateral loans EUR 1.62 2,202 806 214 759 199 144 176Bilateral loans SEK 1.82 807 267 13 13 13 13 559Bond3) SEK 1.90 500 10 10 10 10 502Commercial papers3) SEK 0.68 2,154 2,169Leasing, other 15 4 4 4 3Accounts payable 3,142 3,142Derivative instruments 322 302 20Total 9,141 6,700 260 785 224 659 735
1) Weighted interest including interest swaps.
2) The duration analysis includes gross flows of loans and interest, including flows from interest swaps.
3) Outstanding commercial papers and bonds are officially reported under the Group’s Parent Company, Boliden AB.
Loan portfolioBoliden has a number of utilised long-term loans from Swedish, Nordic and European institutions which, on 31 December 2016, totalled SEK 2,044 m (3,009) and which mature between 2017 and 2022. A term loan for EUR 620 m that matures in 2020 was raised during the year in conjunction with the acquisition of Kevitsa. Boliden also has syndicated credit facilities totalling EUR 362 m and EUR 408 m that mature in 2019 and 2021, respectively. The utilised component of the syndicated credit facilities totalled SEK 0 m (0) on 31 December 2016. A bond for SEK 500 m was issued in the Swedish capital market in 2014 and matures in 2020. SEK 1,687 m (2,154) of Boliden’s commercial papers programme, with a fra-mework of SEK 4,000 m, remained outstanding on 31 December 2016. The average term of the loan facilities on 31 December 2016
was 3.3 years (2.4) and the debt portfolio’s average interest rate was 1.26% (1.30). The fixed interest term of outstanding loans, inclu-ding interest swaps entered into, totalled 0.2 years (0.5) on 31 December 2016. The above maturity analysis includes interest flows from interest swaps. Boliden’s current liquidity in the form of liquid assets and unutilised credit facilities with a term in excess of one year totalled SEK 6,968 m (6,514) on 31 December 2016. The above maturity structure for the financial liabilities, including interest pay-ments and accrued interest on derivatives, includes the undiscoun-ted cash flows that derive from the Group’s liabilities, based on the contracted remaining durations. Interest maturity, including interest swaps, has been calculated on the basis of the applicable closing interest rates.
1
2
3
4
5
6
7
8
9
10
11
12
13
14
15
16
17
18
19
20
21
22
23
24
25
26
27
28
29
30
31

NOTES
96 | Boliden Annual Report 2016
Hedge accounting, SEK m 2016 2015
Hedging of fair value – Changes in value of hedging instruments in respect of binding undertakings –109 –1 076– Change in value of hedged item 109 1 076Ineffectiveness of fair value hedging – –Ineffectiveness of cash flow hedging – –Ineffectiveness of hedging net investments in overseas operations – –Total ineffectiveness 0 0
The effect of effective cash flow hedging with regard to Transaction exposure on the result for 2016 totals SEK −49 m (–6), of which SEK –34 m (15) refers to exchange rate and metal price hedging and SEK –14 m (–21) to interest swaps.
Currency derivatives in respect of forecasted exposure – Cash flow hedgingA summary of Boliden’s outstanding currency hedging for currency exposure in USD/SEK on 31 December 2016 is shown in the table below. Hedging related to forecasted exposure between 2016 and 2017 matured but was extended in 2015. The effect on the profit of premature maturity of hedging related to 2017 has been reported in shareholders’ equity during the year but will be recognised through the Income Statement on a rolling basis in 2017. The effect for 2016 has been recognised through the Income Statement during the year. Boliden’s other currency risks in respect of forecast exposure are, in every significant respect, unhedged. For further information about the Group’s transaction exposure, see Risk management on page 55.
Currencies 2017 Totalt
USD/SEKHedged volume (USD m) 43Forward rate, USD/SEK 6.59Market value, SEK m1) –98 –98
1) Of which SEK −112 m and SEK −75 m for 2016 and 2017, respectively, have been cash settled in June 2015 and will be recognised in the Income State-ment in respective years. The profit has been affected by SEK −112 m as of 31 December 2016.
Raw materials derivatives in respect of forecasted exposure – Cash flow hedgingThe table below provides a summary of Boliden’s outstanding price hedges for gold on 31 December 2016. Hedging related to foreca-sted exposure between 2016 and 2017 matured but was extended in 2015. The effect on the profit of premature maturity of hedging related to 2017 has been reported in shareholders’ equity during the year but will be recognised through the Income Statement on a rol-ling basis in 2017. The effect for 2016 has been recognised through the Income Statement during the year. Boliden’s other metal price risks in respect of forecast exposure are, in every significant res-pect, unhedged. For further information about the Group’s transac-tion exposure, see Risk management on page 55.
Metals 2017 Totalt
Gold
Hedged volume (troy oz.) 29,000Forward rate, USD/troy oz. 1,507Market value, SEK m1) 82 82
1) Of which SEK 110 m and SEK 79 m for 2016 and 2017, respectively, have been cash settled in June 2015 and will be recognised in the Income State-ment in respective years. The profit has been affected by SEK 110 m as of 31 December 2016.
Offsetting of financial assets and liabilities
31-12-2016 31-12-2015
Gross amount for financial assets 403 272Amount offset in Balance Sheet –105 –8Net asset reported in Balance Sheet 298 264Amount comprised by offsetting in conjunction with insolvency etc. –30 –90Net asset 268 174
31-12-2016 31-12-2015
Gross amount for financial liabilities 152 330Amount offset in Balance Sheet –105 –8Net liability reported in Balance Sheet 46 322Amount comprised by offsetting in conjunction with insolvency, etc. –30 –90Net liability 16 232
Note 28 Other current liabilities
31-12-2016 31-12-2015
Accrued salaries and social security expenses 871 591Accrued interest expenses 14 15Other accrued costs and prepaid income 1 072 491Other operating liabilities 425 341
2 382 1 439
Note 27 Financial derivative instruments
Boliden uses financial derivative instruments to manage currency rate risks, raw material price risks, and interest rate risks arising within its operations.
Outstanding financial derivative instruments, SEK m
31-12-2016 31-12-2015
Nominal amount
Fair value
Nominal amount
Fair value
Transaction exposure (binding undertakings) Currency futures –5,499 85 –4,595 73Raw material derivatives –167 195 733 –204Transaction exposure (forecasted cash flows) Currency futures –25 –26 –644 5Raw material derivatives –310 3 –759 81Interest derivatives –1,070 –5 –2,075 –13Total 252 –58

Introduction Market Operations Corporate Governance Financial reports
NOTES
Boliden Annual Report 2016 | 97
Note 29 Financial assets and liabilities by valuation category
31-12-2016Valuation hierarchy
Held at fair value
Loan recei-vables and accounts
receivable
Financial assets
available for sale
Derivatives used in hedge
accounting
Financial liabilities valued at
amortised cost
Total reported
value Total
fair value
ASSETS Financial fixed assets Other shares and participations 3 31 31 31
Current assets Current receivables Accounts receivable 2,017 2,017 2,017Interest-bearing receivables 2 2 2Derivative instruments 2 97 201 298 298Liquid assets 1,503 1,503 1,503Total financial assets 97 3,522 31 201 0 3,851 3,851
LIABILITIES Long-term liabilities Liabilities to credit institutions 2 8,187 8,187 8,217Other interest-bearing liabilities 2 7 7 7
Current liabilities Liabilities to credit institutions 2 1,903 1,903 1,903Other interest-bearing liabilities 2 4 4 4Accounts payable 4,239 4,239 4,239Derivative instruments 2 44 2 46 46Total financial liabilities 44 2 14,341 14,387 14,417
Boliden’s financial instruments are reported at fair value in the Balance Sheet is classified as level two in the Fair value hierarchy (see Accounting principles), with the exception of a small amount in other shares and participations that is classified as level three. The fair value of liabilities to credit institutions is calculated as discounted contractually agreed amortisations and interest payments at esti-mated market interest rates. The interest covenants of existing loan
agreements were, on 31 December 2016, adjudged to be on a par with credit market interest rates, and the fair value therefore corre-sponds, in every significant respect, to the reported value.
The reported value of accounts receivable and accounts payable is held to be the same as the fair value due to the short term to matu-rity, to the fact that provision has been made for bad debts, and to the fact that any penalty interest will be debited.
31-12-2015Valuation hierarchy
Held at fair value
Loan recei-vables and accounts
receivable
Financial assets
available for sale
Derivatives used in hedge
accounting
Financial liabilities valued at
amortised cost
Total reported
value Total
fair value
ASSETS Financial fixed assets Other shares and participations 3 26 26 26
Current assets Current receivables Accounts receivable 1,236 1,236 1,236Interest-bearing receivables 2 2 2Derivative instruments 2 58 206 264 264Liquid assets 923 923 923Total financial assets 58 2,160 26 206 – 2,451 2,451
LIABILITIES Long-term liabilities Liabilities to credit institutions 2 2,484 2 484 2,489Other interest-bearing liabilities 2 11 11 11Derivative instruments 2 20 20 20
Current liabilities Liabilities to credit institutions 2 3,178 3,178 3,178Other interest-bearing liabilities 2 4 4 4Accounts payable 3,142 3,142 3,142Derivative instruments 2 20 282 302 302Total financial liabilities 20 – – 302 8,804 9,141 9,145
1
2
3
4
5
6
7
8
9
10
11
12
13
14
15
16
17
18
19
20
21
22
23
24
25
26
27
28
29
30
31

NOTES
98 | Boliden Annual Report 2016
Note 30 Pledged assets and contingent liabilities
Group Parent Company
2016 2015 2016 2015
Pledged assets For own liabilities and provisions None None None NoneContingent liabilities Parent Company sureties – – 10 141 5,683Other sureties and guarantees 3,562 3,405 133 127Pension liabilities 5 5 – –Agreed residual values according to leasing contracts 10 11 – –
3,576 3,421 10,274 5,810
The Parent Company sureties refer to guarantees issued for subsidi-ary companies. SEK 10,274 m (5,810) refers to Parent Company sureties for external financial borrowing. Parent Company sureties in the above table have been booked in the utilised amounts. Guaran-tees in respect of unutilised credits total SEK 7,367 m (8,765).
The possibility exists, in addition to the above specifications under the heading of contingent liabilities and the items included in the finan-cial information, that the Group may incur environmentally-related contingent liabilities or contingent liabilities attributable to legal pro-ceedings and claims which cannot be currently calculated but which may, in future, entail costs or investments.
Legal proceedingsOverviewBoliden conducts extensive domestic and international operations and is occasionally involved in disputes and legal proceedings arising in the course of these operations. These disputes and legal proceedings are not expected, either individually or collectively, to have any significant negative impact on Boliden’s operating profits, profitability or financial position, over and above that detailed below.
DisputesDisputes arising from the dam breach accident in SpainIn April 1998, a dam breach occurred in a tailings pond at the Los Frailes mine in Spain, which was then owned by Boliden’s subsidiary, Boliden Apirsa S.L. (“Apirsa”). Following the dam breach, preliminary investigations in a criminal case were initiated against Apirsa and its representatives. In December 2000, the investigations were closed. The ruling was appealed but finally ratified in November 2001. The criminal proceedings determined that the accident was caused by design and construction errors in the dam, not by Apirsa’s opera-tions at the mine. The outcome of the criminal proceedings notwith-standing, the Spanish Ministry of the Environment declared Apirsa liable to pay an amount corresponding to approximately EUR 45 m in clean-up costs, damages and fines. This resulted, in January 2005, in Apirsa initiating insolvency proceedings in order to ensure a coor-dinated and orderly closure of the company. The receivers in bankruptcy have, within the framework of the insolvency procee-dings, requested that Apirsa’s parent company, Boliden BV, together with Boliden Mineral AB and Boliden AB, be held liable for Apirsa’s shortfall in an amount which, according to the receivers in bankruptcy, totals approximately EUR 141 m, including a yet unte-sted claim of approximately EUR 89 m which the local government (Junta de Andalucía) believes it is owed, as described in greater detail below.
As a result of the dam breach, the local government sued Apirsa in its capacity as the owner and operator of the mine at the time of acci-dent, and Boliden BV and Boliden AB in their capacity as the direct and indirect owners of Apirsa, in a civil court, demanding joint and several liability for damages to cover expenses totalling approximately EUR 89 m. The suit was dismissed on formal legal grounds and the dismissal con-formed by a higher court. Since the dismissal of the suit in the civil court, the local government in Andalucía has initiated administrative proceedings in respect of the same claim. This proceeding also resulted in the local government’s ruling and claim against the Boliden companies in question being deemed invalid on formal grounds. The
Supreme Administrative Court decided that, in the light of the fact that the local government’s claims have hence been ruled inadmissible in both civil and administrative courts, the civil court was the correct court in which to hear the matter. The local government consequently brought suit against the above-mentioned companies in the Seville Dis-trict Court in 2015. The suit is the same as that brought back in 2002 and the local government is demanding compensation for the costs that it claims to have incurred in conjunction with the clean-up after the dam breach accident. All three defendants have contested the plaintiff’s suit.
The companies that were responsible for the design and construc-tion of the dams and against which Apirsa had previously brought suit and lost have now submitted claims against Apirsa, seeking compen-sation for their legal costs. Final rulings on these compensation claims will be made by the respective courts of instance. It is currently not possible to assess with any reasonable degree of certainty whether the legal cost claims can be brought against any Boliden company other than Apirsa.
Based on the legal advice and opinions given by the company’s Span-ish legal counsel, Boliden’s overall view is that the company will not suf-fer any substantial financial loss as a result of the legal proceedings described. The company has made no provision, pending a final ruling.
Summons arising due to exports to Chile in the 1980sIn October 2013, suit was brought against Boliden claiming damages for the arsenic exposure suffered by claimants from the Chilean town of Arica to which Boliden exported metallic residues from the Rönn-skär smelter between 1984 and 1985 for processing by a Chilean company, Promel. The suit was brought by a Swedish limited partner-ship, Arica Victims KB. The claim comprises approximately 800 peo-ple and is for a combined total of just over SEK 105 m plus interest. Boliden has contested the claim. Boliden is of the opinion, overall, that the company will not suffer any substantial financial loss as a result of the legal process described. The company has made no provision, pending a final ruling.
Note 31 Events after 31 December 2016
Boliden invests in the Tara mineTara, which is one of the larger zinc mines in the world, accounts for half of Boliden’s production of zinc concentrate. Successful explora-tion has resulted in the discovery of a new mineralisation, Tara Deep, and an extension of the capacity of the tailings pond, which currently limits Tara’s lifespan until 2020, has been decided. The new tailings pond will have sufficient capacity for up to 2026. The investment totals EUR 33 m and is conditional upon obtaining the necessary offi-cial permits. It is based on an extension to 2023, and the new Mine-ral Resources will offer additional potential. The construction of an exploration drift to the new deposit at a cost of EUR 11 m has also been approved.
The new Tara Deep deposit has inferred Mineral Resources totalling 10 Mtonnes with a zinc grade of 8.5% and a lead grade of 1.8%. The mineralisation resembles Tara’s main ore body, but has a more compli-cated structure and is at a greater depth of between 1,200 and 1,900 m. In addition to identifying the Tara Deep deposit, successful exploration in the existing mine managed to replace virtually the entire year’s production in the mineral reserve.
Diesel tax at AitikDuring the period from April 2009 to October 2012, dyed diesel was incorrectly used at Aitik instead of undyed diesel. The two types carry different tax classification. When the mistake was discovered in Octo-ber 2012, Boliden immediately contacted both the supplier, in order to switch to undyed diesel, and the Swedish Tax Agency, in order to inform them of what had happened. The Swedish Tax Agency imposed an energy tax liability totalling SEK 212 m, plus interest, on Boliden, which ruling has been confirmed by the Administrative Court and the Administrative Court of Appeal. In January 2016, the Supreme Admin-istrative Court refused to leave appeal. Boliden has previously paid the energy tax imposed in the net sum of SEK 156 m (after review of the company’s income tax) and booked the amount as a cost in 2015. In January 2017, the Government rejected Boliden’s appeal for a reduc-tion in or remission of the tax. The decision will have no additional effect on Boliden’s result or cash flow.

Introduction Market Operations Corporate Governance Financial reports
Boliden Annual Report 2016 | 99
PROPOSED ALLOCATION OF PROFITS
Proposed allocation of profits
The Board’s proposed allocation of profits for 2016 and statement in accordance with the Swedish Companies Act, 18:4
Boliden has a dividend policy whereby approximately one third of the profit after tax is to be distributed. The Board of Directors proposes that the Annual General Meeting approve payment of a dividend of SEK 5.25 (3.25) per share or a total of SEK 1,436 m (889), corresponding to 33.9% of the profit after tax for 2016. The Parent Company’s non-restricted shareholders’ equity totals SEK 4,920 m and the Group’s total shareholders’ equity is SEK 29,386 m. The non-restricted shareholders’ equity in the Parent Company and the Group will total SEK 3,484 m and SEK 27,950 m, respectively, after payment of the proposed div-idend to the shareholders. The Board has taken the cyclic nature
of the industry and the risks associated with the operations into account in its dividend proposal.
The Annual Accounts have been prepared in accordance with generally accepted accounting principles in Sweden and the Consolidated Accounts have been prepared in accordance with EU-approved International Financial Reporting Standards, IFRS.
The Annual Accounts and the Consolidated Accounts give a true and fair view of the Parent Company’s and the Group’s financial position and results of operations.
The Directors’ Report for the Group and the Parent Company give a true and fair overview of the Group’s and the Parent Com-pany’s operations, position and results and describes the material risks and uncertainties faced by the Parent Company and the companies that make up the Group.
Stockholm, 10 February 2017
Anders Ullberg Chairman
Marie Berglund Tom Erixon Lennart Evrell Member of the Board Member of the Board Member of the Board President & CEO
Michael G:son Löw Ulla Litzén Elisabeth Nilsson Member of the Board Member of the Board Member of the Board
Pekka Vauramo Roland Antonsson Marie Holmberg Member of the Board Employee Representative Employee Representative
Kenneth Ståhl Employee Representative
Our Audit Report was submitted on 10 February 2017 Deloitte AB
Jan Berntsson Authorised Public Accountant

AUDITOR’S REPORT
100 | Boliden Annual Report 2016
Auditor’s Report
REPORT ON THE ANNUAL ACCOUNTS AND CONSOLIDATED ACCOUNTS
OpinionsWe have audited the annual accounts and consolidated accounts of Boliden AB (publ) for the financial year 2016-01-01–2016-12-31 except for the corporate governance statement on pages 58-67. The annual accounts and consolidated accounts of the company are included on pages 25-47 och 54-99 in this document.
In our opinion, the annual accounts have been prepared in accordance with the Annual Accounts Act and present fairly, in all material respects, the financial position of parent company as of 31 December 2016 and its financial performance and cash flow for the year then ended in accordance with the Annual Accounts Act. The consolidated accounts have been prepared in accordance with the Annual Accounts Act and present fairly, in all material respects, the financial position of the group as of 31 December 2016 and its financial performance and cash flow for the year then ended in accordance with International Financial Reporting Standards (IFRS), as adopted by the EU, and the Annual Accounts Act. Our opinions do not cover the corporate governance statement on pages 58-67. The statutory adminis-tration report is consistent with the other parts of the annual accounts and consolidated accounts.
We therefore recommend that the general meeting of share-holders adopts the income statement and balance sheet for the parent company and the group.
Basis for opinionWe conducted our audit in accordance with International Standards on Auditing (ISA) and generally accepted auditing standards in Sweden. Our responsibilities under those standards are further described in the Auditor’s Responsibilities section. We are independent of the parent company and the group in ac-cordance with professional ethics for accountants in Sweden and have otherwise fulfilled our ethical responsibilities in accordance with these requirements.
We believe that the audit evidence we have obtained is suffi-cient and appropriate to provide a basis for our opinions.
Key Audit MattersKey audit matters of the audit are those matters that, in our professional judgment, were of most significance in our audit of the annual accounts and consolidated accounts of the current period. These matters were addressed in the context of our audit of, and in forming our opinion thereon, the annual accounts and consolidated accounts as a whole, but we do not provide a separate opinion on these matters.
Recognition of revenues from sales of metals at the appropriate price and in the correct periodThe group’s sales of metals are to a large extent priced in US dollars and sales are often made to predetermined price terms. Individual sales transactions may represent significant amounts. Contractual prices are hedged for variations in metal prices and exchange rates. Taken together, this requires good practices to ensure that revenues are recognized at agreed prices adjusted for the effects from hedging and that revenues are recognized in the correct period.
For the group’s accounting principles for revenue recognition please refer to note 1, and for the group’s revenues by geograph-ical area and revenues disaggregated on metal, concentrate and other please refer to note 2.
Our audit procedures Our audit procedures included, but were not limited to:• review of the group’s accounting policy for revenue
recognition for compliance with IFRS,• evaluating the group’s controls for recognizing revenues at
appropriate prices and in the correct accounting period,• analysis of revenues by metal based on sales volumes, metal
prices and exchange rates, and• on a sample basis testing of sales transactions against sales
contracts, invoices and shipping documents to assess that revenues have been recognized at appropriate prices and in the correct accounting period.
Valuation of inventory The group’s inventory consists primarily of metal concentrate, materials tied up in the production process of the smelters and finished metal. The group’s accounting and valuation of inven-tory is complex and requires judgment about stock levels, metal content, metal prices, exchange rates and internal profits.
For the group’s accounting principles for valuation of invento-ry please refer to note 1, and please refer to 18 for a breakdown of the group’s inventory.
Our audit proceduresOur audit procedures included, but were not limited to:• review of the group’s valuation policy for inventory and its
compliance with IFRS,• assessing the group’s controls for inventory valuation,• observations of physical inventory counts,• on a sample basis testing that the inventory has been valued to
current metal prices and exchange rates, • review of the process inventory revaluation and eliminations
for intragroup profits in inventory.
Accounting and valuation of financial instruments The group is exposed to changes in metal prices, exchange rates and interest rates. To reduce its exposure in larger investment projects and in contracted purchase and sales commitments the group uses various types of financial instruments, including derivatives. The group also manages its exposure to changes in interest rates by reducing or extending the interest duration period via interest rate swaps. The accounting for financial instruments is complex and may have significant impact on the group’s earnings and financial position.
For the group’s financial risks and management of these risks
To the general meeting of the shareholders of Boliden AB (publ) corporate identity number 556051-4142
Introduction Market Operations Corporate Governance Financial reports
AUDITOR’S REPORT
Boliden Annual Report 2016 | 101
please refer to page 55-57, refer to note 1 for the group’s princi-ples for the valuation of financial instruments and note 27 for the group’s financial derivatives.
Our audit proceduresOur audit procedures included, but were not limited to:• review of the group’s financial policy and hedging strategies, • review of hedging activities to ensure that these have been
properly authorized and accounted for in accordance with IFRS, and
• review of the relevance of market data and methodologies used to determine fair value of derivative contracts.
Capitalization and depreciation of deferred mining costsIn conjunction with excavation of waste rock and production of ore in open pit mines, the costs of waste rock removal which improves access to the ore body are capitalized. Deferred mining costs are depreciated per push-back and the depreciation is based on the units of production for the entire push-back. Both the initial capitalization and the depreciation rate are dependent on planned production and estimated Mineral Reserves and, as a consequence among other things, expected future metal prices. Hence, the carrying value and depreciation of deferred mining costs are dependent on a number of complex assumptions and estimates.
For the group’s accounting principles related to deferred mining costs please refer to note 1 and note 13 for the group’s investments and depreciation of deferred mining costs.
Our audit proceduresOur audit procedures included, but were not limited to:• review of accounting policy for deferred mining costs for
compliance with IFRS,• review of model used for capitalization and depreciation
of deferred mining costs against production costs and production volumes, and
• analytical review of capitalization and depreciation in relation to production costs and production volumes.
Provisions for reclamation costs The group has commitments for reclamation of closed mines and for reclamation costs that are expected to arise for mines when the mine operations are decommissioned. The provi-sion for these commitments is judgmental and dependent on several factors including cost estimates for different reclamation measures, life of mine, regulatory decisions, future inflation and discount rates. Any changes in these estimates and assump-tions may have a significant impact on the group’s earnings and financial position.
For the group’s accounting principles for reclamation provisions please refer to note 1 and note 13 for this year’s change in capital-ized reclamation costs, and note 24 for the group’s reclamation provisions.
Our audit proceduresOur audit procedures included, but were not limited to:• review of accounting policy for reclamation provisions for
compliance with IFRS,• evaluating the group’s controls to account for reclamation
provisions,
• review of external and internal opinions on expected reclama-tion measures and the costs for these, and
• review of assumptions used to estimate the reclamation provisions for consistency with approved production plans, life of mines expectancies, and current financial conditions (inflation and interest rates).
Valuation of intangible and tangible fixed assets The group’s intangible and tangible assets represent significant amounts. Impairment testing of these assets is based on produc-tion plans, which in turn are based on assumptions about future metal prices, treatment and refining charges, and exchange rates. Changes in market prices for metals, treatment and refining charges, and exchange rates have a significant impact on the group’s future cash flows and thus the estimated recoverable val-ue of intangible and tangible assets and any impairment needs.
For the group’s principles to prepare impairment tests for intan-gible and tangible assets please refer to note 1 and for significant assumptions applied in the impairment tests, please refer to note 13.
Our audit proceduresOur audit procedures included, but were not limited to:• review of the group’s process and principles for preparing
impairment tests for compliance with IFRS,• evaluation of key assumptions such as estimated life of mines,
production plans, metal prices, treatment and refining charg-es, and exchange rates and the sensitivity in these assumptions to any changes, and
• review of the model used to discount future cash flows for arithmetical correctness.
Accounting for acquisition of KevitsaDuring the year the group acquired the Kevitsa mine for a purchase price of SEK 5 961 million. Accounting for business combinations requires significant judgments and estimates by management to determine the fair value of acquired assets and assumed liabilities. The purchase price for Kevitsa was also hedged with forward contracts which needs to be considered when determining the final purchase price.
For the Group’s purchase price allocation for the Kevitsa acquisition, please refer to note 11.
Our audit proceduresOur audit procedures included, but were not limited to:• review of fair values assigned to acquired assets and assumed
liabilities, and• review of forward contracts for appropriate allocation to the
purchase price.
Other information than the annual accounts and consolidated accounts This document also contains other information than the annual accounts and consolidated accounts and is found on pages 1-24, 48-53 och 105-119. The Board of Directors and the Managing Director are responsible for this other information.
Our opinion on the annual accounts and consolidated accounts does not cover this other information and we do not express any form of assurance conclusion regarding this other information.

AUDITOR’S REPORT
102 | Boliden Annual Report 2016
In connection with our audit of the annual accounts and consolidated accounts, our responsibility is to read the informa-tion identified above and consider whether the information is materially inconsistent with the annual accounts and consoli-dated accounts. In this procedure we also take into account our knowledge otherwise obtained in the audit and assess whether the information otherwise appears to be materially misstated.
If we, based on the work performed concerning this infor-mation, conclude that there is a material misstatement of this other information, we are required to report that fact. We have nothing to report in this regard.
Responsibilities of the Board of Directors and the Managing DirectorThe Board of Directors and the Managing Director are responsi-ble for the preparation of the annual accounts and consolidated accounts and that they give a fair presentation in accordance with the Annual Accounts Act and, concerning the consolidated accounts, in accordance with IFRS as adopted by the EU. The Board of Directors and the Managing Director are also respon-sible for such internal control as they determine is necessary to enable the preparation of annual accounts and consolidated accounts that are free from material misstatement, whether due to fraud or error.
In preparing the annual accounts and consolidated accounts, the Board of Directors and the Managing Director are respon-sible for the assessment of the company’s and the group’s ability to continue as a going concern. They disclose, as applicable, matters related to going concern and using the going concern basis of accounting. The going concern basis of accounting is however not applied if the Board of Directors and the Managing Director intends to liquidate the company, to cease operations, or have no realistic alternative but to do so.
The Audit Committee shall, without prejudice to the Board of Director’s responsibilities and tasks in general, among other things oversee the company’s financial reporting process.
Auditor’s responsibilityOur objectives are to obtain reasonable assurance about whether the annual accounts and consolidated accounts as a whole are free from material misstatement, whether due to fraud or error, and to issue an auditor’s report that includes our opinions. Reasonable assurance is a high level of assurance, but is not a guarantee that an audit conducted in accordance with ISAs and generally accepted auditing standards in Sweden will always detect a material misstatement when it exists. Misstatements can arise from fraud or error and are considered material if, individ-ually or in the aggregate, they could reasonably be expected to influence the economic decisions of users taken on the basis of these annual accounts and consolidated accounts.
As part of an audit in accordance with ISAs, we exercise professional judgment and maintain professional skepticism throughout the audit. We also:• Identify and assess the risks of material misstatement of the
annual accounts and consolidated accounts, whether due to fraud or error, design and perform audit procedures respon-sive to those risks, and obtain audit evidence that is sufficient and appropriate to provide a basis for our opinions. The risk of not detecting a material misstatement resulting from fraud is higher than for one resulting from error, as fraud may in-
volve collusion, forgery, intentional omissions, misrepresenta-tions, or the override of internal control.
• Obtain an understanding of the company’s internal control relevant to our audit in order to design audit procedures that are appropriate in the circumstances, but not for the purpose of expressing an opinion on the effectiveness of the company’s internal control.
• Evaluate the appropriateness of accounting policies used and the reasonableness of accounting estimates and related disclosures made by the Board of Directors and the Managing Director.
• Conclude on the appropriateness of the Board of Directors’ and the Managing Director’s use of the going concern basis of accounting in preparing the annual accounts and consolidat-ed accounts. We also draw a conclusion, based on the audit evidence obtained, as to whether any material uncertainty exists related to events or conditions that may cast significant doubt on the company’s and the group’s ability to continue as a going concern. If we conclude that a material uncertain-ty exists, we are required to draw attention in our auditor’s report to the related disclosures in the annual accounts and consolidated accounts or, if such disclosures are inadequate, to modify our opinion about the annual accounts and consolidated accounts. Our conclusions are based on the audit evidence obtained up to the date of our auditor’s report. However, future events or conditions may cause a company and a group to cease to continue as a going concern.
• Evaluate the overall presentation, structure and content of the annual accounts and consolidated accounts, including the disclosures, and whether the annual accounts and consolidat-ed accounts represent the underlying transactions and events in a manner that achieves fair presentation.
• Obtain sufficient and appropriate audit evidence regarding the financial information of the entities or business activities within the group to express an opinion on the consolidated accounts. We are responsible for the direction, supervision and performance of the group audit. We remain solely respon-sible for our opinions.
We must inform the Board of Directors of, among other mat-ters, the planned scope and timing of the audit. We must also inform of significant audit findings during our audit, including any significant deficiencies in internal control that we identified.
We must also provide the Board of Directors with a state-ment that we have complied with relevant ethical requirements regarding independence, and to communicate with them all relationships and other matters that may reasonably be thought to bear on our independence, and where applicable, related safeguards.
From the matters communicated with the Board of Directors, we determine those matters that were of most significance in the audit of the annual accounts and consolidated accounts, in-cluding the most important assessed risks for material misstate-ment, and are therefore the key audit matters. We describe these matters in the auditor’s report unless law or regulation precludes disclosure about the matter or when, in extremely rare circum-stances, we determine that a matter should not be communicat-ed in the auditor’s report because the adverse consequences of doing so would reasonably be expected to outweigh the public interest benefits of such communication.

Introduction Market Operations Corporate Governance Financial reports
AUDITOR’S REPORT
Boliden Annual Report 2016 | 103
REPORT ON OTHER LEGAL AND REGULATORY REQUIREMENTS Opinions In addition to our audit of the annual accounts and consoli-dated accounts, we have also audited the administration of the Board of Directors and the Managing Director of Boliden AB (publ) for the financial year 2016-01-01 - 2016-12-31 and the proposed appropriations of the company’s profit or loss.
We recommend to the general meeting of shareholders that the profit to be appropriated in accordance with the proposal on page 99 and that the members of the Board of Directors and the Managing Director be discharged from liability for the financial year.
Basis for OpinionsWe conducted the audit in accordance with generally accepted auditing standards in Sweden. Our responsibilities under those standards are further described in the Auditor’s Responsibilities section. We are independent of the parent company and the group in accordance with professional ethics for accountants in Sweden and have otherwise fulfilled our ethical responsibilities in accordance with these requirements.
We believe that the audit evidence we have obtained is suffi-cient and appropriate to provide a basis for our opinions.
Responsibilities of the Board of Directors and the Managing DirectorThe Board of Directors is responsible for the proposal for appropriations of the company’s profit or loss. At the proposal of a dividend, this includes an assessment of whether the dividend is justifiable considering the requirements which the company’s and the group’s type of operations, size and risks place on the size of the parent company’s and the group’s equity, consolidation requirements, liquidity and position in general.
The Board of Directors is responsible for the company’s organization and the administration of the company’s affairs. This includes among other things continuous assessment of the company’s and the group’s financial situation and ensuring that the company’s organization is designed so that the accounting, management of assets and the company’s financial affairs other-wise are controlled in a reassuring manner. The Managing Di-rector shall manage the ongoing administration according to the Board of Directors’ guidelines and instructions and among other matters take measures that are necessary to fulfill the company’s accounting in accordance with law and handle the management of assets in a reassuring manner.
Auditor’s responsibilityOur objective concerning the audit of the administration, and thereby our opinion about discharge from liability, is to obtain audit evidence to assess with a reasonable degree of assurance whether any member of the Board of Directors or the Managing Director in any material respect:• has undertaken any action or been guilty of any omission which
can give rise to liability to the company, or• in any other way has acted in contravention of the Companies
Act, the Annual Accounts Act or the Articles of Association.
Our objective concerning the audit of the proposed appropri-ations of the company’s profit or loss, and thereby our opinion about this, is to assess with reasonable degree of assurance whether the proposal is in accordance with the Companies Act.
Reasonable assurance is a high level of assurance, but is not a guarantee that an audit conducted in accordance with generally accepted auditing standards in Sweden will always detect actions or omissions that can give rise to liability to the company, or that the proposed appropriations of the company’s profit or loss are not in accordance with the Companies Act.
As part of an audit in accordance with generally accepted audit-ing standards in Sweden, we exercise professional judgment and maintain professional scepticism throughout the audit. The exam-ination of the administration and the proposed appropriations of the company’s profit or loss is based primarily on the audit of the accounts. Additional audit procedures performed are based on our professional judgment with starting point in risk and materiality. This means that we focus the examination on such actions, areas and relationships that are material for the operations and where deviations and violations would have particular importance for the company’s situation. We examine and test decisions undertaken, support for decisions, actions taken and other circumstances that are relevant to our opinion concerning discharge from liability. As a basis for our opinion on the Board of Directors’ proposed appro-priations of the company’s profit or loss we examined the Board of Directors’ reasoned statement and a selection of supporting evidence in order to be able to assess whether the proposal is in accordance with the Companies Act.
The auditor’s examination of the corporate governance statement The Board of Directors is responsible for that the corporate governance statement on pages 58-67 has been prepared in accordance with the Annual Accounts Act.
Our examination of the corporate governance statement is conducted in accordance with FAR´s auditing standard RevU 16 The auditor´s examination of the corporate governance state-ment. This means that our examination of the corporate govern-ance statement is different and substantially less in scope than an audit conducted in accordance with International Standards on Auditing and generally accepted auditing standards in Sweden. We believe that the examination has provided us with sufficient basis for our opinions.
A corporate governance statement has been prepared. Disclosures in accordance with chapter 6 section 6 the second paragraph points 2-6 of the Annual Accounts Act and chapter 7 section 31 the second paragraph the same law are consistent with the other parts of the annual accounts and consolidated accounts and are in accordance with the Annual Accounts Act.
Stockholm, February 10, 2017 Deloitte AB
Jan Berntsson Authorised Public Accountant

104 | Boliden Annual Report 2016
AUDITOR’S LIMITED ASSURANCE REPORT ON BOLIDEN AB’S SUSTAINABILITY REPORT
Auditor’s Limited Assurance Report on Boliden AB’s Sustainability Report
To Boliden AB
Introduction We have been engaged by the Board of Directors of Boliden AB to undertake a limited assurance engagement of Boliden ABs Sustainability Report for the year 2016. The Company has defined the scope of the Sustainability Report in the GRI index on pages 4−7 in Boliden’s GRI Report.
Responsibilities of the Board of Directors and the Executive Management for the Sustainability ReportThe Board of Directors and the Executive Management are responsible for the preparation of the Sustainability Report in accordance with the applicable criteria, as explained on page 8 in Boliden’s GRI Report, and are the parts of the Sustainability Reporting Guidelines (published by The Global Reporting Ini-tiative (GRI)) which are applicable to the Sustainability Report, as well as the accounting and calculation principles that the Company has developed. This responsibility also includes the internal control relevant to the preparation of a Sustainability Report that is free from material misstatements, whether due to fraud or error.
Responsibilities of the auditorOur responsibility is to express a conclusion on the Sustainabil-ity Report based on the limited assurance procedures we have performed.
We conducted our limited assurance engagement in accord-ance with RevR 6 Assurance of Sustainability Reports issued by FAR. A limited assurance engagement consists of making inquiries, primarily of persons responsible for the preparation of the Sustainability Report, and applying analytical and other limited assurance procedures. The procedures performed in a limited assurance engagement vary in nature from, and are less in extent than for, a reasonable assurance engagement conducted in accordance with IAASB’s Standards on Auditing and other generally accepted auditing standards in Sweden.
The firm applies ISQC 1 (International Standard on Quality Control) and accordingly maintains a comprehensive system of quality control including documented policies and procedures regarding compliance with ethical requirements, professional standards and applicable legal and regulatory requirements. The procedures performed consequently do not enable us to obtain assurance that we would become aware of all significant matters that might be identified in a reasonable assurance engagement. Accordingly, we do not express a reasonable assurance conclu-sion.
Our procedures are based on the criteria defined by the Board of Directors and the Executive Management as described above. We consider these criteria suitable for the preparation of the Sustainability Report.
We believe that the evidence we have obtained is sufficient and appropriate to provide a basis for our conclusion below.
ConclusionBased on the limited assurance procedures we have performed, nothing has come to our attention that causes us to believe that the Sustainability Report, is not prepared, in all material respects, in accordance with the criteria defined by the Board of Directors and Executive Management.
Stockholm, 10th February 2017
Deloitte AB
Jan Berntsson Authorised Public Accountant
Didrik Roos Authorised Public Accountant

Introduction Market Operations Corporate Governance Financial reports
MINERAL RESERVES AND RESOURCES
Boliden Annual Report 2016 | 105
Mineral Reserves and Resources
Mineral Reserves and Mineral Resources are the basis for the future viability of a mining company’s operations. The reserves are reduced each year through mining activities, and it is, therefore, vital that Mineral Reserves and Resources are increased by means of successful exploration or acquisitions. In 2016, Boliden made one acquisition – Kevitsa in Finland – and was also able to announce a new, inferred Mineral Resource at Tara in Ireland. Large parts of Garpenberg’s Mineral Resources were, furthermore, upgraded to Mineral Reserves.
Boliden shall work to ensure optimal resource and materials handling at every stage of the value chain and the responsible conversion of assets in the form of Min-eral Resources and Mineral Reserves is an important component of this work. We consequently follow up on our Mineral Resources and Reserves carefully and produce an annual summary. The estimations of Min-eral Resources and Reserves are always associated with a degree of uncertainty as to the geological basis and due to sensitivity to the pricing and cost conditions used.
Mineral Resources and Reserves 2016Boliden’s estimations and compilations are carried out in accordance with the recommendations of the Swedish industry organisation for mining and metal companies, Swedish Association of Mines, Minerals and Metal Producers, (SveMin).
Aitik No extensive exploration work was carried out at the Aitik mine during the year and the changes in the Mineral Reserve effectively correspond to the year’s mining. The extraction of molybdenum has been eval-uated, leading to the conclusion that in the light of the anticipated price trend, investing in the extraction of molybdenum at Aitik is not profitable. Molybdenum consequently no longer forms part of Aitik’s Mineral Reserve, but as conditions may change, it is still includ-ed in the mine’s Mineral Resource. Work continues on
the nearby Nautanen deposit with the aim of submit-ting an application for a mining concession in 2017.
The Boliden AreaIn Kristineberg, Boliden has continued its exploration in the direction of Rävliden, approximately 2.5 km to the west of the Kristineberg ore deposit. The Mineral Resource has been increased and some parts upgraded to Indicated Resource. Rävliden is reported under Kristineberg. The Maurliden Östra mine has been mined out and a final report submitted to the Mining Inspectorate of Sweden. There are, however, still some Mineral Resources which may, in future, be profitable to mine. Exploration in Renström and Kankberg has added new quantities to the reserves, but they fell short of the quantities extracted during the year, and the Boliden Area’s total reserves fell in 2016.
GarpenbergNew Mineral Resources have been added and a sig-nificant element of the Mineral Resources have been upgraded to Mineral Reserves. The addition to the reserve has been proven by means of technical studies. All of the new sections are showing good profitability, although they have meant a fall in Garpenberg’s aver-age grade. A total of over 36 Mtonnes has been added to the Mineral Reserve, but the substantial upgrade from Mineral Resource to Mineral Reserve has result-ed in a net reduction in Mineral Resources.
Aitik
0
500,000
1,000,000
1,500,000
2,000,000
2,500,000
07 08 09 10 11 12 13 14 15 16
Mineral Resources and Reserves are declining.Extraction work during the year has resulted in a reduction in the reserve.
The Boliden Area
0
4,000
8,000
12,000
16,000
20,000
07 08 09 10 11 12 13 14 15 16
The upgrading of Mineral Resources to Reserves has resulted in an increase in the reserves and a decrease in the resources, despite the addition of new resources.
Garpenberg
0
20,000
40,000
60,000
80,000
07 08 09 10 11 12 13 14 15 16
● Probable/proven Mineral Reserve
● Measured/indicat-ed Mineral Resource
● Inferred Mineral Resource
All values are shown in ktonnes.
Production ×10

MINERAL RESERVES AND RESOURCES
106 | Boliden Annual Report 2016
KevitsaBoliden acquired Kevitsa in 2016, and production in the mine has proceeded according to plan. The Min-eral Reserve figures for this year are based on Boliden’s more conservative estimation, resulting in a slight fall in the reserve’s grades.
Kylylahti Boliden acquired Kylylahti 2014, and production at the mine is going well. Exploration has not yielded any major additions: indeed, infill drilling has actually re-sulted in some losses. There was a 1 Mtonne reduction in the Mineral Reserve.
Tara The Tara Deep deposit at Tara has added 10 Mtonnes in the form of a new, inferred Mineral Resource (8.5% Zn and 1.8% Pb). The mineralisation is similar to Tara’s other ores, but is at a greater depth of 1.2 – 1.9 km below the surface. Much of what was mined was replaced with new reserves. Mineral Resources, exclu-ding Tara Deep, decreased.
About the classificationMineral Resources and Mineral Reserves are estimated separately and broken down into different categories. Boliden’s Mineral Reserves are not subsidiary amounts of the Mineral Resources, and when a Mineral Re-source is upgraded to a Mineral Reserve, the quantity is eliminated from the Mineral Resource.
A Mineral Resource is a concentration or occurrence of material of economic interest in or on the Earth’s crust in such a form, quality and quantity that there are reasonable prospects for eventual economic extraction. Location, quantity, grade, continuity and other geolog-ical characteristics of a Mineral Resource are known, estimated or interpreted from specific geological evidence, sampling and knowledge. A Mineral Reserve is proved to be economically viable. It includes diluting materials and allowances for ore losses, which may occur when the material is mined. Appropriate assess-ments and studies have been carried out, and include consideration of, and modification by realistically assumed mining, metallurgical, economic, marketing,
legal, environmental, social and political factors. These assessments demonstrate at the time of reporting that extraction could reasonably be justified.
Inferred Mineral ResourceAn inferred Mineral Resource is a Mineral Resource for which tonnage, shape, grades and mineral content can be estimated with only a low degree of certainty. It is indicated by geology, sampling and anticipated but unverified geological and/or grade continuity. It is based on information obtained through exploration, sampling and testing carried out in accordance with appropriate techniques. The information is limited or of uncertain quality and reliability.
Indicated Mineral ResourceAn indicated Mineral Resource is a Mineral Resource for which tonnage, shape, grades and mineral content can be estimated with reasonable certainty. It is indi-cated by geology, sampling and anticipated but unver-ified geological and/or grade continuity. It is based on information obtained through exploration, sampling and testing carried out in accordance with appropriate techniques. The information points are, however, too sparse or inappropriately distributed to ensure the deposit’s geological and/or grade continuity.
Measured Mineral ResourceA measured Mineral Resource is a Mineral Resource for which tonnage, shape, grades and mineral content can be estimated with a high degree of certainty. It is based on information gained through detailed and reliable exploration, sampling and testing carried out in accordance with appropriate techniques. The infor-mation points are sufficiently dense to demonstrate the deposit’s geological and/or grade continuity.
Probable Mineral ReserveA probable Mineral Reserve meets the requirements for an indicated or, under certain circumstances, measured Mineral Resource where mining-engineering and profitability studies show that it is technically and economically feasible to mine and process the deposit in line with the company’s profitability requirements.
The Mineral Reserve is declining, but there was some increase in Mineral Resources.
Kylylahti
0
2,000
4,000
6,000
8,000
07 08 09 10 11 12 13 14 15 16
A significant increase in the inferred Mineral Resource and a small decrease in the Mineral Reserve.
Tara
0
5,000
10,000
15,000
20,000
25,000
30,000
07 08 09 10 11 12 13 14 15 16
Boliden acquired Kevitsa in 2016.
Kevitsa
0
50,000
100,000
150,000
07 08 09 10 11 12 13 14 15 16

Introduction Market Operations Corporate Governance Financial reports
MINERAL RESERVES AND RESOURCES
Boliden Annual Report 2016 | 107
Proven Mineral ReserveA proven Mineral Reserve meets the requirements for a measured Mineral Resource where mining-engineer-ing and profitability studies show that it is techni-cally and economically feasible to mine and process the deposit in line with the company’s profitability requirements.
Basis for the estimationsBoliden is 100% owner of all properties and holds the required exploitation concessions and environmental permits for all of the mines currently in operation. The environmental permits have limited durations and are, therefore, subject to an ongoing process of renewal. The Mineral Resources are protected by exploitation concessions or exploration permits. The estimations are based on the following underlying factors:
Metal pricesMineral Resources and Mineral Reserves are the basis for the company’s long-term planning and will be mined for many years to come. Planning prices, which are an expression of the anticipated average prices for metals and currencies over the forthcoming business cycle are, therefore, primarily utilised in the estima-tions. Boliden’s current planning prices are shown in the following table:
Planning pricesLong-term prices
2016Change
since 2015
Copper USD 6,200/tonne –400Zinc USD 2,200/tonne –100Lead USD 2,100/tonne –200Gold USD 1,100/tr. oz. –100Silver USD 18/tr. oz. –2Molybdenum USD 8/lb. –7Nickel USD 16,000/tonne –2,000Palladium USD 700/tr.oz. –100Platinum USD 1,300/tr.oz. –350Cobalt USD 12/lb. –4Tellurium USD 30/kg –120USD/SEK 7.50 + 0.50EUR/SEK 8.63 – 0.12EUR/USD 1.15 – 0.10
DensityFormulas based on head grades are utilised for massive sulphide ores, which make up the majority of Boliden’s Mineral Resources and Mineral Reserves. The formu-las have been verified using density measurements. In other cases, measurements are carried out for the different ores or rock types that affect the density.
Waste rock dilutionMining usually incurs some waste rock dilution that varies, depending on the mining method used, the ore’s geometry, and other geological factors. Boliden systemati-cally monitors the waste rock dilution of the ore extracted and the experience gained thereby enables waste rock dilution to be included in all Mineral Reserve estimations.
Ore lossesSome ore may have to be left unextracted (e.g. in the form of pillar offset), depending on the mining method used, the ore’s geometry and other technical factors. The Mineral Reserve estimations take these factors into account, based on assumptions regarding mining method and the information available when the estimations were made.
Minimum ore widthThe minimum horizontal ore width is based on assump-tions regarding mining method and equipment. Ore zones that are narrower than the minimum ore width are reestimated using the average for the full width.
Regulations, codes and recommendationsBoliden’s Mineral Reserves and Mineral Resources have been estimated and compiled in accordance with recommendations for application in their respective countries by the Swedish, Finnish and Norwegian industry organisations for mining and metal com-panies – SveMin, FinnMin and Norsk Bergindustri, respectively – known as the FRB standard. This is an independent set of regulations but based on “The International Template for the public reporting of exploration results, Mineral Resources and Mineral Reserves”, produced by the Committee for Min-eral Reserves International Reporting Standards (CRIRSCO) in a bid to achieve a harmonised inter-national practice. Reporting at Tara complies with the Australasian Institute of Mining and Metallurgy’s JORC code.
The Mineral Resources and Mineral Reserves that have been compiled and presented in this report have been reviewed and approved by Gunnar Agmalm, Boliden’s Mineral Reserves and Project Evaluation Manager, who is registered as a “Qualified Person” by SveMin and as a “Competent Person” in accordance with JORC.
February 2017
Gunnar Agmalm Qualified Person SveMin
Boliden’s explora-tion costs in 2016 totalled SEK 380 m (370).
380

MINERAL RESERVES AND RESOURCES
108 | Boliden Annual Report 2016
Mineral Reserves, 31 December 2016
Quantity, ktonnes 2016
2016 2015Au
g/tAg
g/tCu%
Zn%
Pb%
Ni1)
%Co%
Ptg/t
Pdg/t
Teg/t
Aitik Proven 823,000 850,000 0.15 1.2 0.23Probable 371,000 377,000 0.14 1.2 0.23
The Boliden area
Sulphide mineralisations Kristineberg Proven 50 100 0.9 36 2.0 1.5 0.1 Probable 4,930 5,500 0.6 36 0.5 5.9 0.3
Renström Proven 200 240 3.0 172 0.5 7.7 1.5Probable 3,220 3,640 2.0 114 0.6 5.0 1.0
Maurliden Proven 510 900 1.7 59 0.3 4.6 0.4Probable
Maurliden Östra Proven
Probable 190
Total Proven 760 1,250 2.0 87 0.5 5.2 0.7Sulphide mineralisations Probable 8,150 9,300 1.1 67 0.5 5.6 0.6
Gold mineralisationsKankberg Proven 2,450 2,280 3.9 11 190
Probable 1,230 2,020 3.1 12 186
Garpenberg Proven 19,700 12,500 0.3 99 0.04 3.8 1.6Probable 56,700 27,300 0.3 96 0.05 2.9 1.4
Kevitsa Proven 79,100 0.10 0.34 0.21 0.20 0.13Probable 67,700 0.09 0.33 0.23 0.20 0.13
Kylylahti Proven 800 700 1.0 1.5 0.6 0.17 0.28Probable 1,100 2,200 1.3 1.0 0.5 0.24 0.22
Tara Proven 4,200 4,500 6.5 1.5Probable 12,300 12,500 6.2 1.6
1) Kevitsa reports sulphide-bound Ni.Figures may be rounded up or down.

Introduction Market Operations Corporate Governance Financial reports
MINERAL RESERVES AND RESOURCES
Boliden Annual Report 2016 | 109
Mineral Resources, 31 December 2016
Quantity, ktonnes 2016
2016 2015Au
g/tAg
g/tCu%
Zn%
Pb%
Ni1)
%Co%
Ptg/t
Pdg/t
Te2)
g/tMog/t
The Aitik areaAitik Measured 252,000 252,000 0.09 0.8 0.15 18
Indicated 1,313,000 1,313,000 0.09 0.8 0.16 23Inferred 281,000 281,000 0.09 0.6 0.14 20
Nautanen Measured
Indicated 8,200 9,600 0.9 5.0 1.7 86Inferred 7,500 6,400 0.6 7.0 1.5 81
The Boliden AreaSulphide mineralisationsKristineberg Measured 50 50 0.7 45 1.3 4.2 0.2
Indicated 4,630 1,930 0.4 62 1.0 4.8 0.5Inferred 7,990 9,710 0.4 56 0.8 3.0 0.4
Petiknäs N Measured 310 310 8.1 73 1.8 3.1 0.3Indicated 1,200 1,200 2.7 52 0.6 1.8 0.3Inferred 720 720 3.3 33 0.5 1.2 0.2
Renström Measured
Indicated 2,000 1,290 2.4 129 0.4 6.6 1.3Inferred 1,990 2,670 2.4 145 0.3 8.9 1.6
Maurliden Measured 670 670 1.0 30 0.5 2.2 0.2Indicated 260 260 0.7 18 0.3 1.6 0.1Inferred
Maurliden Östra Measured
Indicated 190 360 0.3 7 1.0 0.04Inferred
TotalSulphide mineralisations
Measured 1,000 1,000 3.1 44 0.9 2.6 0.2Indicated 8,300 5,000 1.2 74 0.7 4.6 0.6Inferred 10,700 13,100 0.9 71 0.7 4.0 0.6
Gold mineralisations Kankberg Measured 290 260 3.5 10 146
Indicated 850 950 6.8 9 173Inferred 1,580 3,250 6.3 7 213
Älgträsk Measured
Indicated 1,070 1,070 2.8 5Inferred 3,520 3,520 2.0 4
TotalGold mineralisations
Measured 290 260 3.5 10Indicated 1,900 2,000 4.5 7Inferred 5,100 6,800 3.3 5
Garpenberg Measured 6,600 16,800 0.3 98 0.06 3.5 1.6Indicated 34,900 54,200 0.3 94 0.05 2.7 1.3Inferred 18,100 11,700 0.5 57 0.08 2.8 1.7
Kevitsa Measured 17,900 0.08 0.34 0.22 0.16 0.10Indicated 93,900 0.07 0.37 0.23 0.13 0.08Inferred 54,400 0.06 0.33 0.21 0.12 0.07
Kylylahti Measured 1,900 1,700 0.4 0.84 0.4 0.2 0.2Indicated 3,200 3,000 0.6 0.43 0.2 0.3 0.1Inferred 100 100 0.5 1.40 0.5 0.1 0.3
Tara Measured 400 600 5.8 2.3Indicated 3,800 3,400 6.8 1.9Inferred 13,600 4,700 7.8 1.9
Laver Measured 1,100 1,100 0.11 4.4 0.20 18 18Indicated 512,400 512,400 0.13 3.1 0.22 36 36Inferred 550,600 550,600 0.10 3.1 0.21 33 33
Rockliden Measured
Indicated 800 800 0.08 102 2.1 4.4 0.9Inferred 9,200 9,200 0.06 48 1.8 4.0 0.4
1) Kevitsa reports sulphide-bound Ni. 2) Te at Kankberg only. Figures may be rounded up or down.

TEN-YEAR OVERVIEW
110 | Boliden Annual Report 2016
Ten-year overview – the Group
2007 2008 2009 2010 2011 20121) 2013 2014 2015 2016
Result, SEK m Revenues 33,204 30,987 27,635 36,716 40,323 40,001 34,409 36,891 40,242 40,316Operating profit before depreciation 6,805 2,426 5,186 7,445 6,674 6,731 4,632 6,035 7,112 9,881Operating profit excluding revaluation of process inventory 5,620 1,793 2,350 4,830 5,008 4,042 2,271 2,605 4,010 5,094Operating profit 5,428 1,004 3,623 5,643 4,748 4,171 1,803 2,759 3,590 5,682Profit after financial items 5,196 723 3,377 5,331 4,560 3,992 1,581 2,471 3,356 5,375Taxes –1,409 212 –876 –1,375 –1,171 –651 –288 –572 –715 –1,135Net profit for the year 3,787 935 2,501 3,957 3,389 3,341 1,294 1,899 2,641 4,239
Cash flow, SEK m Cash flow from operating activities 3,730 5,470 3,974 6,197 4,021 5,518 3,505 5,789 6,235 6,995Cash flow from investment activities –2,518 –4,633 –4,922 –2,995 –4,024 –4,129 –4,971 –4,206 –3,670 –9,795Free cash flow 1,212 837 –948 3,202 –3 1,389 –1,466 1,583 2,565 –2,801Cash flow from financing activities –3,532 –514 571 –3,199 –464 –730 1,060 –1,355 –2,503 3,376Cash flow for the year –2,320 323 –377 3 –467 659 –406 228 63 575
Capital structure and return, SEK m Balance Sheet total 27,231 30,252 33,258 35,128 37,615 40,080 41,841 43,865 43,022 53,877Capital employed 20,145 24,733 26,229 27,151 30,473 31,236 34,451 35,087 35,131 42,457Return on capital employed, % 29 5 14 21 17 14 5 8 10 15Shareholders’ equity 12,932 16,131 16,257 18,846 21,032 22,354 23,075 23,974 25,807 29,394Return on shareholders’ equity, % 26 7 16 23 17 16 6 8 11 16Equity/assets ratio, % 47 53 49 54 56 56 55 55 60 55Net debt 5,524 6,305 7,402 4,584 6,063 6,276 8,673 8,283 5,827 9,339Net debt/equity ratio, % 43 39 46 24 29 28 38 35 23 32
Data per share, SEK Earnings for the period
Basic 13.37 3.42 9.14 14.47 12.39 12.21 4.72 6.94 9.65 15.49Diluted 13.37 3.42 9.14 14.47 12.39 12.21 4.72 6.94 9.65 15.49
Cash flow from operating activities
Basic 13.17 20.00 14.53 22.66 14.70 20.17 12.82 21.17 22.80 25.57Diluted 13.17 20.00 14.53 22.66 14.70 20.17 12.82 21.17 22.80 25.57
Shareholders’ equity
Basic 47.28 58.98 59.44 68.90 76.90 81.68 84.31 87.63 94.33 107.44Diluted 47.28 58.98 59.44 68.90 76.90 81.68 84.31 87.63 94.33 107.44
Proposed dividend 4.00 1.00 3.00 5.00 4.00 4.00 1.75 2.25 3.25 5.25Share price, 31/12 81.25 17.80 92.1 136.7 100.5 122.1 98.45 125.5 142.9 237.9Highest price paid 165.00 86.00 95.3 137.7 143.5 125.6 126.7 129.9 201.1 258.2Lowest price paid 79.00 14.60 16.1 79.5 65.35 87.8 80.2 90.7 112.1 100P/E ratio 6.07 5.20 10.07 9.45 8.11 10.0 20.9 18.09 14.8 15.4Change in share price during the year, % –50 –78 417 48 –26 21 –19 27 14 66Dividend yield, % 4.9 5.6 3.3 3.7 4.0 3.3 1.8 1.8 2.3 2.2Total yield, % –48 –73 423 52 –23 25 –16 30 15 70
Number of shares, million Number of shares, 31/12 274 274 274 274 274 274 274 274 274 274Average number of shares 283 274 274 274 274 274 274 274 274 274No. own shares held, 31/12 16 – – – – – – – – -
Employees Number of Group employees, total2) 4,524 4,608 4,379 4,412 4,597 4,795 4,815 4,881 4,878 5,477Number of female employees2) 604 650 598 669 736 813 824 852 867 976Percentage of women on the Board/in Group management, % 25/33 25/29 27/17 27/0 27/0 27/17 27/20 27/20 36/20 36/20Accidents per one million hours worked, own personnel, frequency 9.9 9.1 5.5 8.2 4.9 6.6 7.0 5.8 6.6 6.7Accidents per one million hours worked incl. contractors, frequency 9.1 8.9 7.9 8.9 7.9Fatalities, own personnel 0 1 0 0 0 0 0 0 0 0Fatalities, contractors 0 0 0 0 1Sick leave rate, % 4.7 4.7 4.2 4.0 3.7 3.7 3.9 4.3 4.6 4.4

Introduction Market Operations Corporate Governance Financial reports
TEN-YEAR OVERVIEW
Boliden Annual Report 2016 | 111
Ten-year overview – the Group, cont. 2007 2008 2009 2010 2011 20121) 2013 2014 2015 2016
Energy consumption Total energy consumption, TJ 16,303 15,257 14,664 16,147 15,579 16,140 16,415 17,231 16,813 19,061Water withdrawal, total, km³ 0.125 0.134 0.135 0.140 0.153 0.160 0.155 0.173 0.150 0.140Emissions & Discharges Direct emissions of greenhouse gases, ktonnes 413 450 486 510 499 574 578 554 559 594Indirect emissions of greenhouse gases, electricity purchased, ktonnes 384 357 356 398 408 416 402 425 313 381Indirect emissions of greenhouse gases, heating and steam purchased, ktonnes 24 0 5 6 17 18 20 22 17 23Carbon dioxide emissions, total, ktonnes 822 807 848 913 924 1,008 1,000 1,001 889 998Emissions of metals to air, tonnes3) 35 23 21 23 23 92 75 126 88 100Sulphur dioxide emissions to air, tonnes 8,070 8,260 6,930 6,850 7,410 8,240 6,410 7,320 7,210 7,060Discharges of metals to water, tonnes3) 28 29 14 18 14 21 23 21 18 13Discharges of nitrogen to water, tonnes 294 283 225 199 205 253 219 225 261 300
1) The 2012 comparison year has been restated due to the changes to the IFRIC 20 and IAS 19 accounting principles in 2013. 2) Refers to full-time employees from 2008 onwards. The period from 2006–2007 refers to average number of employees. 3) Refers to metal equivalents (tonnes), as of 2012. The period from 2006–2011 refers to the metal’s mass (tonnes).
Ten-year overview – Mines
2007 2008 2009 2010 2011 20121) 2013 2014 2015 2016
Production of metal in concentrate Zinc, ktonnes 333 297 307 294 283 271 272 294 299 329Copper, ktonnes 63 57 55 76 81 79 79 78 85 103Lead, ktonnes 54 53 57 50 49 49 48 61 62 63Gold, kg 2,834 2,603 3,130 3,727 3,681 3,644 3,849 4,379 4,922 5,766Gold, troy oz. 91,121 83,672 100,623 119,839 118,332 117,150 123,759 140,789 158,228 185,386Silver, kg 241,701 211,683 214,120 230,756 231,388 229,791 261,804 323,325 418,489 446,826Silver, ’000 troy oz. 7,771 6,806 6,884 7,419 7,439 7,388 8,417 10,395 13,454 14,365Tellurium, kg2) – – – – – 6,791 24,457 30,917 33,000 38,680
Financial data, SEK m Revenues 7,567 5,178 6,509 9,580 10,279 9,509 8,303 9,318 9,808 12,659Operating expenses 3,578 3,716 3,652 4,535 5,189 5,008 4,924 5,417 5,842 6,833Depreciation 605 618 673 954 1,110 1,669 1,917 2,264 2,520 3,172Operating profit 3,135 734 2,159 4,113 3,913 2,974 1,598 1,299 1,429 2,804Investments 1,503 3,886 4,435 2,189 2,338 3,570 3,763 2,732 2,394 2,755Operational acquisitions3) – – – – – – – 718 – 5,961Capital employed 4,970 8,292 12,476 13,501 14,272 16,125 18,288 19,615 19,275 24,972
AITIKMilled ore, ktonnes 18,178 17,813 18,791 27,596 31,541 34,321 37,070 39,090 36,361 36,051Head grades Cu, % 0.32 0.30 0.27 0.27 0.24 0.22 0.21 0.20 0.21 0.22Au, g/tonne 0.14 0.14 0.13 0.16 0.14 0.11 0.10 0.09 0.11 0.11Ag, g/tonne 3.67 2.81 1.99 2.07 2.15 2.50 2.28 2.14 2.45 2.11Concentrate production Cu, ktonnes 185 174 171 263 267 270 292 277 307 320Concentrate grade Cu, % 27.25 27.20 26.94 25.58 25.00 24.85 24.29 24.48 21.93 22.12Production of metal in concentrate Cu, ktonnes 50 47 46 67 67 67 71 68 67 71Au, kg 1,178 1,218 1,348 2,208 2,447 1,959 1,765 1,767 2,042 2,119Au, troy oz. 37,865 39,172 43,338 70,987 78,657 62,996 56,731 56,823 65,666 68,127Ag, kg 42,301 32,087 24,701 36,468 45,040 51,698 53,612 54,854 61,452 56,602Ag, ’000 troy oz. 1,360 1,032 794 1,172 1,448 1,662 1,724 1,764 1,976 1,820Financial data, SEK m Revenues 2,305 1,949 1,997 3,996 4,549 4,170 3,593 3,427 3,292 3,273Operating profit before depreciation 1,388 1,049 1,134 2,442 2,583 2,651 1,902 1,669 1,413 1,548Operating profit 1,217 876 949 2,008 2,046 1,732 882 558 183 222Investments 760 2,994 3,674 1,210 1,178 1,2071) 1,143 1,181 1,207 1,174Cash cost USc/lb. Cu C1, Normal 129 124 86 105 120 83 131 138 105 102Proven and probable Mineral Reserves4)
Mtonnes 610 633 747 733 710 702 1,085 1,126 1,227 1,194Cu, % 0.29 0.27 0.25 0.25 0.25 0.25 0.22 0.22 0.23 0.23Au, g/tonne 0.20 0.20 0.10 0.10 0.10 0.10 0.14 0.14 0.14 0.14
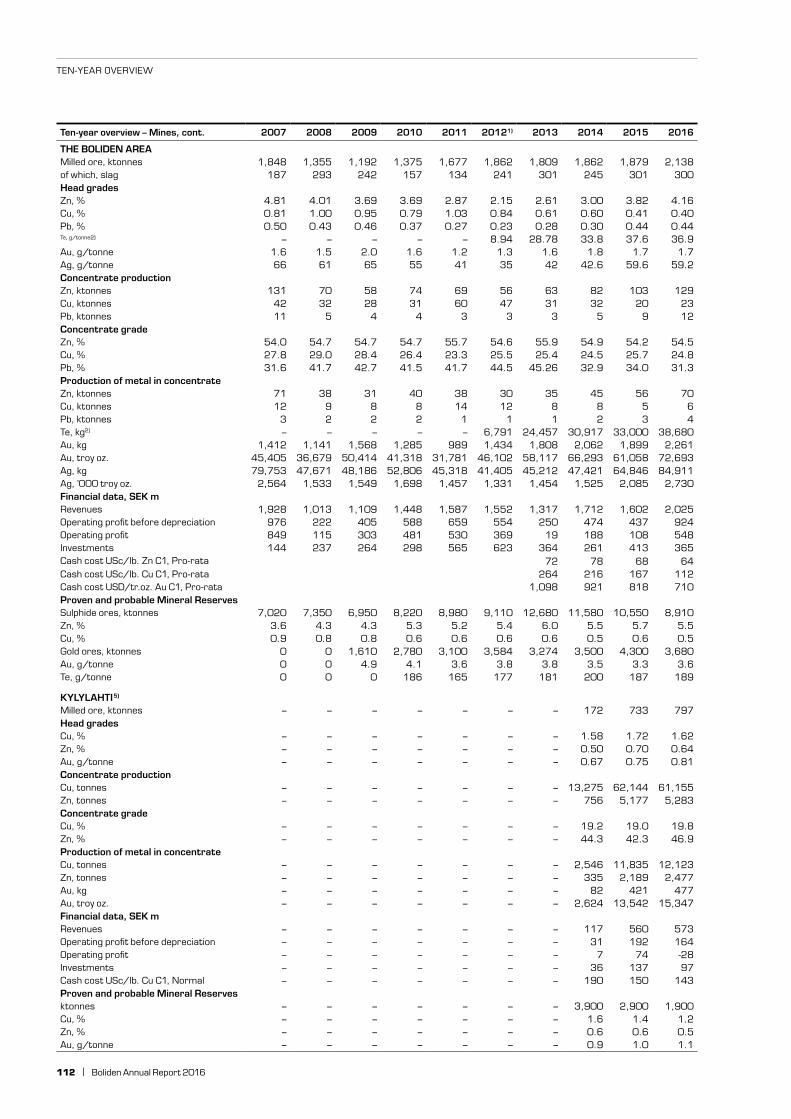
TEN-YEAR OVERVIEW
112 | Boliden Annual Report 2016
Ten-year overview – Mines, cont. 2007 2008 2009 2010 2011 20121) 2013 2014 2015 2016
THE BOLIDEN AREAMilled ore, ktonnes 1,848 1,355 1,192 1,375 1,677 1,862 1,809 1,862 1,879 2,138of which, slag 187 293 242 157 134 241 301 245 301 300Head grades Zn, % 4.81 4.01 3.69 3.69 2.87 2.15 2.61 3.00 3.82 4.16Cu, % 0.81 1.00 0.95 0.79 1.03 0.84 0.61 0.60 0.41 0.40Pb, % 0.50 0.43 0.46 0.37 0.27 0.23 0.28 0.30 0.44 0.44Te, g/tonne2) – – – – – 8.94 28.78 33.8 37.6 36.9Au, g/tonne 1.6 1.5 2.0 1.6 1.2 1.3 1.6 1.8 1.7 1.7Ag, g/tonne 66 61 65 55 41 35 42 42.6 59.6 59.2Concentrate production Zn, ktonnes 131 70 58 74 69 56 63 82 103 129Cu, ktonnes 42 32 28 31 60 47 31 32 20 23Pb, ktonnes 11 5 4 4 3 3 3 5 9 12Concentrate grade Zn, % 54.0 54.7 54.7 54.7 55.7 54.6 55.9 54.9 54.2 54.5Cu, % 27.8 29.0 28.4 26.4 23.3 25.5 25.4 24.5 25.7 24.8Pb, % 31.6 41.7 42.7 41.5 41.7 44.5 45.26 32.9 34.0 31.3Production of metal in concentrate Zn, ktonnes 71 38 31 40 38 30 35 45 56 70Cu, ktonnes 12 9 8 8 14 12 8 8 5 6Pb, ktonnes 3 2 2 2 1 1 1 2 3 4Te, kg2) – – – – – 6,791 24,457 30,917 33,000 38,680Au, kg 1,412 1,141 1,568 1,285 989 1,434 1,808 2,062 1,899 2,261Au, troy oz. 45,405 36,679 50,414 41,318 31,781 46,102 58,117 66,293 61,058 72,693Ag, kg 79,753 47,671 48,186 52,806 45,318 41,405 45,212 47,421 64,846 84,911Ag, ’000 troy oz. 2,564 1,533 1,549 1,698 1,457 1,331 1,454 1,525 2,085 2,730Financial data, SEK m Revenues 1,928 1,013 1,109 1,448 1,587 1,552 1,317 1,712 1,602 2,025Operating profit before depreciation 976 222 405 588 659 554 250 474 437 924Operating profit 849 115 303 481 530 369 19 188 108 548Investments 144 237 264 298 565 623 364 261 413 365Cash cost USc/lb. Zn C1, Pro-rata 72 78 68 64Cash cost USc/lb. Cu C1, Pro-rata 264 216 167 112Cash cost USD/tr.oz. Au C1, Pro-rata 1,098 921 818 710Proven and probable Mineral Reserves Sulphide ores, ktonnes 7,020 7,350 6,950 8,220 8,980 9,110 12,680 11,580 10,550 8,910Zn, % 3.6 4.3 4.3 5.3 5.2 5.4 6.0 5.5 5.7 5.5Cu, % 0.9 0.8 0.8 0.6 0.6 0.6 0.6 0.5 0.6 0.5Gold ores, ktonnes 0 0 1,610 2,780 3,100 3,584 3,274 3,500 4,300 3,680Au, g/tonne 0 0 4.9 4.1 3.6 3.8 3.8 3.5 3.3 3.6Te, g/tonne 0 0 0 186 165 177 181 200 187 189
KYLYLAHTI5)
Milled ore, ktonnes – – – – – – – 172 733 797Head grades Cu, % – – – – – – – 1.58 1.72 1.62Zn, % – – – – – – – 0.50 0.70 0.64Au, g/tonne – – – – – – – 0.67 0.75 0.81Concentrate production Cu, tonnes – – – – – – – 13,275 62,144 61,155Zn, tonnes – – – – – – – 756 5,177 5,283Concentrate grade Cu, % – – – – – – – 19.2 19.0 19.8Zn, % – – – – – – – 44.3 42.3 46.9Production of metal in concentrate Cu, tonnes – – – – – – – 2,546 11,835 12,123Zn, tonnes – – – – – – – 335 2,189 2,477Au, kg – – – – – – – 82 421 477Au, troy oz. – – – – – – – 2,624 13,542 15,347Financial data, SEK m Revenues – – – – – – – 117 560 573Operating profit before depreciation – – – – – – – 31 192 164Operating profit – – – – – – – 7 74 -28Investments – – – – – – – 36 137 97Cash cost USc/lb. Cu C1, Normal – – – – – – – 190 150 143Proven and probable Mineral Reserves ktonnes – – – – – – – 3,900 2,900 1,900Cu, % – – – – – – – 1.6 1.4 1.2Zn, % – – – – – – – 0.6 0.6 0.5Au, g/tonne – – – – – – – 0.9 1.0 1.1

Introduction Market Operations Corporate Governance Financial reports
TEN-YEAR OVERVIEW
Boliden Annual Report 2016 | 113
TARAMilled ore, ktonnes 2,658 2,411 2,508 2,593 2,486 2,502 2,493 2,287 2,197 2,603Head grades Zn, % 7.7 7.8 7.9 7.0 7.0 7.0 7.1 6.9 6.4 6.0Pb, % 1.5 1.5 1.5 1.4 1.4 1.4 1.5 1.6 1.3 1.2Concentrate production Zn, ktonnes 351 320 344 316 307 305 298 267 243 268Pb, ktonnes 42 40 41 34 34 41 39 42 34 37Concentrate grade Zn, % 54.5 54.7 53.9 53.0 53.3 54.4 55.9 56.0 54.8 55.2Pb, % 60.9 56.7 57.5 53.7 58.8 55.2 56.1 53.1 49.9 52.8Production of metal in concentrate Zn, ktonnes 191 175 186 167 164 166 166 150 133 148Pb, ktonnes 26 23 24 19 20 23 22 22 17 20Ag, kg 1,850 1,638 2,092 1,344 909 1,673 1,197 2,433 1,273 1,076Ag, ’000 troy oz. 59 53 67 43 29 54 38 78 41 35Financial data, SEK m Revenues 3,129 1,357 1,671 1,831 1,757 1,727 1,542 1,743 1,492 2,085Operating profit before depreciation 1,989 154 303 619 503 421 595 479 470 947Operating profit 1,796 –40 76 383 268 100 195 56 95 476Investments 277 305 338 285 372 268 201 313 274 299Cash cost USc/lb. Zn C1, Normal 65 79 64 69 72 69 68 75 76 69Proven and probable Mineral Reserves ktonnes 17,800 17,100 17,000 16,000 15,700 14,000 13,100 15,300 17,000 16,500Zn, % 7.7 7.4 7.2 7.1 7.1 7.1 7.0 6.6 6.3 6.3Pb, % 1.7 1.8 1.8 1.8 1.8 1.7 1.6 1.5 1.5 1.6
Ten-year overview – Mines, cont. 2007 2008 2009 2010 2011 20121) 2013 2014 2015 2016
GARPENBERGMilled ore, ktonnes 1,255 1,365 1,394 1,443 1,456 1,484 1,495 2,224 2,367 2,622Head grades Zn, % 6.3 6.9 7.3 6.6 6.2 5.6 5.2 5.1 5.0 4.4Cu, % 0.1 0.1 0.1 0.1 0.1 0.1 0.1 0.1 0.1 0.1Pb, % 2.5 2.6 2.8 2.5 2.4 2.1 2.1 2.1 2.1 1.8Au, g/tonne 0.3 0.3 0.2 0.3 0.3 0.3 0.3 0.3 0.3 0.3Ag, g/tonne 125 130 139 133 133 129 153 136 156 150Concentrate production Zn, ktonnes 132 158 167 160 148 136 127 182 196 200Cu, ktonnes 3 3 3 3 2 2 3 3 5 5Pb, ktonnes 36 41 44 41 39 35 36 58 60 54Concentrate grade Zn, % 54.1 53.1 53.8 53.7 55.0 54.8 55.4 54.6 55.0 54.3Cu, % 22.1 20.4 18.3 18.3 19.1 17.7 18.0 14.8 16.3 15.2Pb, % 70.1 69.0 71.3 72.0 72.4 70.7 70.3 63.1 70.7 72.7Production of metal in concentrate Zn, ktonnes 71 84 90 86 81 75 70 99 108 109Cu, ktonnes 0.7 0.6 0.5 0.5 0.4 0.4 0.5 0.4 0.8 0.7Pb, ktonnes 25 29 31 29 28 25 25 37 42 39Au, kg 244 243 214 234 246 250 277 468 559 580Au, troy oz. 7,851 7,821 6,870 7,534 7,895 8,051 8,911 15,049 17,962 18,661Ag, tonnes 118 130 139 140 140 135 162 218 288 302Ag, ’000 troy oz. 3,787 4,189 4,473 4,505 4,505 4,341 5,201 7,014 9,270 9,705Financial data, SEK m Revenues 1,710 1,163 1,490 1,902 2,155 1,876 1,675 2,318 2,862 3,491Operating profit before depreciation 1,195 598 945 1,293 1,506 1,262 1,025 1,319 1,896 2,509Operating profit 1,095 466 793 1,124 1,314 1,033 776 919 1,452 2,063Investments 323 344 157 281 660 1,459 2,045 916 336 317Cash cost USc/lb. Zn C1, Pro-rata 46 56 45 43Proven and probable Mineral Reserves ktonnes 20,800 26,000 25,800 25,100 23,600 25,600 36,300 37,600 39,800 76,400Zn, % 5.2 5.1 5.4 5.3 5.1 5.1 4.6 4.3 3.9 3.2Ag, g/tonne 116 134 142 145 144 131 132 120 113 97

TEN-YEAR OVERVIEW
114 | Boliden Annual Report 2016
Ten-year overview – Mines, cont. 2007 2008 2009 2010 2011 20121) 2013 2014 2015 2016
KEVITSA6)
Milled ore, ktonnes – – – – – – – – – 4,518Head grades Cu, % – – – – – – – – – 0.35Ni, % – – – – – – – – – 0.24Co, % – – – – – – – – – 0.01Au, g/tonne – – – – – – – – – 0.14Pd, g/tonne – – – – – – – – – 0.19Pt, g/tonne – – – – – – – – – 0.29Concentrate production Cu, ktonnes – – – – – – – – – 55 Ni, ktonnes – – – – – – – – – 80Concentrate grade Cu, % – – – – – – – – – 25.8Ni, % – – – – – – – – – 9.3Production of metal in concentrate Cu, tonnes – – – – – – – – – 14,217Ni, tonnes – – – – – – – – – 7,442Co, tonnes – – – – – – – – – 322Au, kg – – – – – – – – – 328Au, troy oz. – – – – – – – – – 10,558Pd, kg – – – – – – – – – 559Pd, troy oz. – – – – – – – – – 17,965Pt, kg – – – – – – – – – 750Pt, troy oz. – – – – – – – – – 24,118Financial data, SEK m Revenues – – – – – – – – – 1,210Operating profit before depreciation – – – – – – – – – 500Operating profit – – – – – – – – – 166Investments – – – – – – – – – 473Cash cost USc/lb. Ni C1, Normal – – – – – – – – – 150Cash cost USc/lb. Ni C1, Pro-rata – – – – – – – – – 340Cash cost USc/lb. Cu C1, Pro-rata – – – – – – – – – 155Proven and probable Mineral Reserves ktonnes – – – – – – – – – 146,800Cu, % – – – – – – – – – 0.34Ni, % – – – – – – – – – 0.22
1) Comparison figures for 2012 have been restated due to changes in accounting regulations. Investments at Aitik increased by SEK 383 million.2) Tellurium production started in 2012.3) Operational acquisitions: Kylylahti in 2014 (SEK 718 m), and Kevitsa in 2016 (SEK 5,961 m).4) Aitik’s figures for 2013 are updated in accordance with the press release published on 6 May 2014.5) The acquisition of Kylylahti was completed in October 2014.6) The acquisition of Kevitsa was completed in June 2016.

Introduction Market Operations Corporate Governance Financial reports
TEN-YEAR OVERVIEW
Boliden Annual Report 2016 | 115
Ten-year overview – Smelters
2007 2008 2009 2010 2011 2012 2013 2014 2015 2016
Metal production Zinc, ktonnes 463 443 434 456 461 467 455 468 469 461Copper, ktonnes 315 350 302 303 336 339 325 347 332 336Lead, ktonnes 26 14 13 17 11 19 24 25 26 28Lead alloys, ktonnes (Bergsöe) 44 43 39 42 41 43 45 44 45 46Nickel in matte, ktonnes1) 17 31Gold, kg 14,876 15,489 15,028 14,220 12,848 16,175 16,177 17,368 17,608 17,638 Gold, troy oz. 478,274 497,972 483,157 457,168 413,052 520,011 520,094 558,382 566,102 567,077Silver, kg2) 379,749 488,285 539,564 450,280 488,147 575,959 537,941 626,767 680,600 626,331Silver, ’000 troy oz.2) 12,209 15,699 17,346 14,476 15,964 18,517 17,294 20,151 21,881 20,137Aluminium fluoride, ktonnes 35 35 33 22 35 36 34 35 31 32Sulphuric acid, ktonnes 1,231 1,329 1,123 1,372 1,597 1,634 1,564 1,659 1,665 1,642
Financial data, SEK m Revenues 34,704 31,256 26,765 34,390 38,471 38,753 33,410 35,894 38,948 38,516Gross profit excl. revaluation of process inventory3) 7,802 6,942 6,560 7,158 7,160 7,288 6,908 7,869 9,167 9,376Operating expenses 4,618 5,076 5,281 5,247 5,358 5,330 5,346 5,370 5,536 5,696Depreciation 771 807 888 848 823 891 913 1,012 1,002 1,026Operating profit excl. revaluation of process inventory3) 2,489 1,161 451 1,134 1,051 1,095 679 1,518 2,692 2,759Operating profit 2,297 372 1,724 1,946 790 1,224 210 1,672 2,272 3,347Investments 1,008 737 473 804 1,627 993 1,200 768 1,248 1,372Capital employed 16,738 13,656 13,712 14,225 16,213 15,569 15,791 15,592 15,878 17,838
RÖNNSKÄRSmelting material Copper, ktonnes Copper concentrate 598 611 565 544 651 624 605 661 642 626 Secondary raw materials 160 173 154 155 175 221 209 184 172 171 of which, electronics4) 37 64 108 109 82 86 82Copper, total 758 784 719 699 826 844 814 845 814 798 Lead, ktonnes Lead concentrate 38 18 14 16 11 27 38 40 38 41Secondary raw materials 2 5 7 6 5 2 1 1 1 1Lead, total 40 22 21 23 17 29 39 41 39 42Production Cathode copper, ktonnes 214 228 206 190 219 214 206 217 206 207Lead, ktonnes 26 14 13 17 11 19 24 25 26 28Zinc clinker, ktonnes 36 41 39 37 36 36 36 39 36 33Gold, tonnes 12 13 13 12 11 13 12 13 13 14Gold, ‘000 troy oz. 389 432 427 400 341 403 402 419 425 443Silver, tonnes 347 430 481 386 415 448 437 479 539 508Silver, ‘000 troy oz. 11,142 13,813 15,472 12,340 13,344 14,395 14,051 15,392 17,322 16,337Sulphuric acid, ktonnes 544 557 515 502 571 553 536 564 533 503Liquid sulphur dioxide, ktonnes 50 53 36 43 42 38 39 42 37 45Palladium concentrate, tonnes 3 3 3 2 2 3 2 2 2 3Financial data, SEK m Revenues 2,131 1,882 1,669 1,799 2,226 2,398 2,029 2,417 2,678 2,759Operating profit before depreciation 846 637 338 441 715 832 374 748 1,038 1,135Operating profit 615 395 83 187 470 535 53 405 727 852Investments 228 192 199 270 1,074 481 345 147 383 398
BERGSÖESmelting material, ktonnes Secondary raw materials 61 65 57 56 57 62 63 63 64 64Production, ktonnes Lead alloys 44 43 39 42 41 43 45 44 45 46Financial data, SEK m Revenues 918 760 632 793 787 698 715 783 817 882Operating profit before depreciation 344 142 106 99 95 52 57 64 37 126Operating profit 330 127 91 82 75 34 39 45 18 109Investments 10 12 12 14 24 10 12 10 11 26

TEN-YEAR OVERVIEW
116 | Boliden Annual Report 2016
Ten-year overview – Smelters, cont. 2007 2008 2009 2010 2011 2012 2013 2014 2015 2016
HARJAVALTASmelting material, ktonnes Copper concentrate 451 529 400 434 456 516 471 551 528 552 Secondary raw materials 12 7 11 22 14 16 26 21 23 27Copper, total 462 536 411 456 471 532 497 572 551 579Nickel concentrate 262 273 211 262 259 248 251 239 282 294Production Cathode copper, ktonnes 101 122 97 113 116 125 119 130 126 129Nickel in matte, ktonnes1) 17 31Gold, tonnes 3 2 2 2 2 4 4 4 4 4Gold, ’000 troy oz. 90 66 56 57 72 117 119 139 141 124Silver, tonnes 33 59 58 65 73 128 101 142 126 101Silver, ’000 troy oz. 1,067 1,886 1,876 2,077 2,350 4,122 3,244 4,577 4,042 3,247Sulphuric acid, ktonnes 557 659 501 573 600 639 590 658 667 703Liquid sulphur dioxide, ktonnes 42 37 33 27 35 37 37 37 37 33Palladium concentrate, tonnes 0.46 0.21 0.27 0.72 0.84 0.54 1.47 1.91 2.15 2.57Financial data, SEK m Revenues 1,267 1,432 1,261 1,468 1,552 1,666 1,631 1,746 2,214 2,281Operating profit before depreciation 289 212 203 318 373 479 496 485 943 935Operating profit before depreciation, excl. PIR3) 289 339 62 318 373 479 496 485 943 935Operating profit 149 64 24 154 222 324 316 279 736 704Operating profit excl. PIR3) 149 191 –117 154 222 324 316 279 736 704Investments 366 225 148 122 229 215 246 225 396 432
KOKKOLASmelting material, ktonnes Zinc concentrate 581 576 571 587 600 589 602 577 584 547Production, ktonnes Zinc 306 298 295 307 307 315 312 302 306 291Silver in concentrate, kg 5,651 16,079 17,180Silver concentrate, ’000 troy oz. 182 517 552Sulphuric acid5) 199 302 313 319 314 343 315Financial data, SEK m Revenues 2,523 1,848 1,979 2,062 1,818 1,778 1,795 2,004 2,350 2,223Operating profit before depreciation 1,434 632 558 685 417 432 398 639 943 789Operating profit 1,273 469 362 505 246 261 248 459 739 572Investments 236 162 99 248 237 210 318 216 166 297
ODDASmelting material, ktonnes Zinc concentrate (incl. zinc clinker) 292 270 245 277 283 279 263 302 310 339Production, ktonnes Zinc 157 145 139 149 153 153 143 166 163 171Aluminium fluoride 35 35 33 22 35 36 34 35 31 32Sulphuric acid 130 113 108 123 125 128 119 123 123 121Financial data, SEK m Revenues 1,441 1,200 1,123 1,128 1,212 1,184 1,070 1,395 1,554 1,522Operating profit before depreciation 576 360 161 184 123 184 116 355 522 461Operating profit 439 210 6 39 –25 31 –26 209 390 314Investments 168 146 22 75 44 61 269 166 283 214
The operating profit per smelter excludes the revaluation of process inventory, with the exception of Harjavalta, 2008–2009.
1) Included as of 1 July 2015.2) Silver in concentrate at Kokkola is included in the production figure shown as of 2014.3) Process Inventory Revaluation.4) Electronic scrap recycling was not reported separately between 2005 and 2009.5) Investment in sulphuric acid plant, 2010.

Introduction Market Operations Corporate Governance Financial reports
Boliden Annual Report 2016 | 117
DEFINITIONS
Definitions
Balance Sheet total The sum of the assets side or the sum of the shareholders’ equity and liabili-ties side of the Balance Sheet.
Capital employed The Balance Sheet total less interest-bearing investments, tax receivables and non-interest-bearing provisions and liabilities.
Cash flow from operating activities Cash flow generated via the operating profit, adjusted for items not affecting cash flow, tax paid and change in working capital.
Cash flow per share The cash flow for the period divided by the average number of outstanding shares.
Dividend yield Dividend per share as a percent-age of the share price.
Earnings per share Net result for the period divided by the average number of outstanding shares.
Boliden uses the Wood Mackenzie’s cash cost metrics, C1 Normal costing and C1 Pro rata cost-ing, to measure the mines’ cost position in relation to other mines worldwide. The lower a mine’s cash cost, the better its cost position. Cash cost is expressed in USc/lb. of metal and can be multi-plied by 22.0462 (rounded off) to obtain the price in USD per tonne of metal.
Normal costingIn normal costing calculations, the costs are allo-cated in their entirety to one main metal and then reduced by the net revenue1) of other metals, known as by-metals.
+ Mining operations, concentration and administration costs 2)
+ Costs of freighting concentrate to smelters
+ Treatment and refining charges (TC/RC)
– Deductions for net revenue of by-metals
= Cash cost C1 Normal costing
Equity/assets ratio Shareholders’ equity as a percentage of the Balance Sheet total.
Equity per share Shareholders’ equity divided by the number of outstanding shares.
Free cash flow Cash flow from operating activi-ties including cash flow from investment activities.
FTE – Full Time Equivalent A metric that corre-sponds to one employee working full time for one year.
Net debt Interest-bearing current and long-term liabilities (including pension liabilities) less financial assets (including liquid assets).
Net debt/equity ratio Net debt divided by share-holders’ equity.
Operating profit (EBIT) Revenues less all costs attributable to the operations but excluding net financial items and taxes.
Operating profit (EBIT) excluding revaluation of process inventory Revenues minus all costs attributable to the operations but excluding the effects of the revaluation of process inventory, net financial items and taxes.
P/E ratio Share price divided by earnings per share.
Return on capital employed Operating profit divided by the average capital employed. The aver-age capital employed for each year consists of an average of the closing capital employed in the last 13 months. Measured before tax.
Return on shareholders’ equity Profit for the year as a percentage of average shareholders’ equity in the last 13 months. Measured after tax.
Total return The sum of the share’s performance during the year plus dividend paid divided by the share price at the beginning of the year.
Pro rata costingIn pro rata cash costing, the costs are divided up between the various metals on the basis of the indi-vidual metal’s share of the total net revenue.
Composite costingIn composite costing, mines are included using either normal costing or pro rata costing on the basis of criteria based on the metals’ net revenue. If a metal accounts for 65 per cent or more of the total net revenue, the cash cost is calculated using normal costing, while if a metal accounts for less than 65 per cent of the total net revenue, the cash cost is calculated using pro rata costing.
Boliden uses Wood Mackenzie’s cash margin com-pilations to measure the smelter’s cost position in relation to other smelters. The cash margin is the difference between income and cash cost, ex-pressed in USc/lb. of metal and can be multiplied by 22.0462 (rounded off) to obtain the price in USD per tonne of metal. The income comprises treatment and refining charges, free metals and income from by-products.
The income for zinc smelters includes income generated by sales of surplus energy, while for copper smelters, the income generated by the sales of sulphuric acid and surplus energy is added as a credit when calculating the cash cost.
The calculations for copper smelters are expressed as unit of metal produced from concen-trate, while for zinc smelters, it is expressed as unit of finished metal produced. Income is normally included if it is regarded as having been derived from the main process during the production of metal and the product is saleable.
1) Calculating the net revenue of mines’ metals
The net revenue is the payable income from the metal, less freight costs and treatment and refining charges.
2) Administrative costs attributable to the mine.
Financial definitions
Definition of Cash cost Definition of Cash margin
+ Income from payable metal
– The metal’s freight cost
– The metal’s treatment and refining charges
= The net revenue of the metal
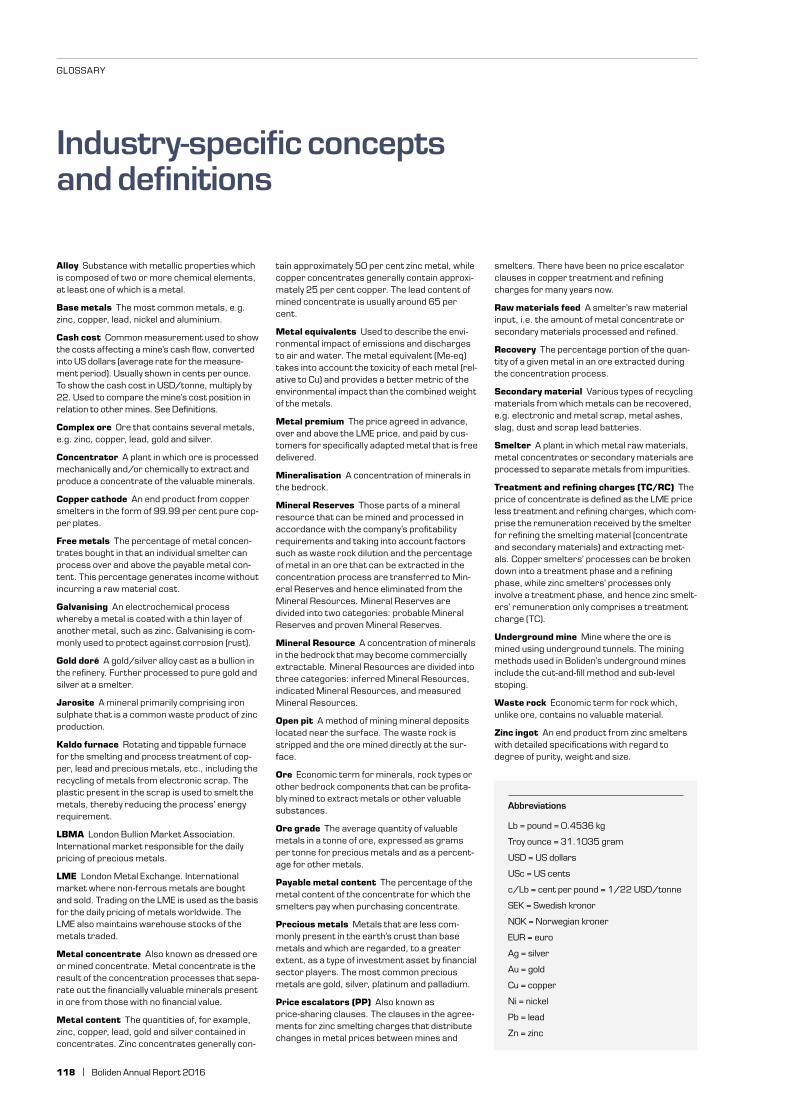
118 | Boliden Annual Report 2016
GLOSSARY
Industry-specific concepts and definitions
Alloy Substance with metallic properties which is composed of two or more chemical elements, at least one of which is a metal.
Base metals The most common metals, e.g. zinc, copper, lead, nickel and aluminium.
Cash cost Common measurement used to show the costs affecting a mine’s cash flow, converted into US dollars (average rate for the measure-ment period). Usually shown in cents per ounce. To show the cash cost in USD/tonne, multiply by 22. Used to compare the mine’s cost position in relation to other mines. See Definitions.
Complex ore Ore that contains several metals, e.g. zinc, copper, lead, gold and silver.
Concentrator A plant in which ore is processed mechanically and/or chemically to extract and produce a concentrate of the valuable minerals.
Copper cathode An end product from copper smelters in the form of 99.99 per cent pure cop-per plates.
Free metals The percentage of metal concen-trates bought in that an individual smelter can process over and above the payable metal con-tent. This percentage generates income without incurring a raw material cost.
Galvanising An electrochemical process whereby a metal is coated with a thin layer of another metal, such as zinc. Galvanising is com-monly used to protect against corrosion (rust).
Gold doré A gold/silver alloy cast as a bullion in the refinery. Further processed to pure gold and silver at a smelter.
Jarosite A mineral primarily comprising iron sulphate that is a common waste product of zinc production.
Kaldo furnace Rotating and tippable furnace for the smelting and process treatment of cop-per, lead and precious metals, etc., including the recycling of metals from electronic scrap. The plastic present in the scrap is used to smelt the metals, thereby reducing the process’ energy requirement.
LBMA London Bullion Market Association. International market responsible for the daily pricing of precious metals.
LME London Metal Exchange. International market where non-ferrous metals are bought and sold. Trading on the LME is used as the basis for the daily pricing of metals worldwide. The LME also maintains warehouse stocks of the metals traded.
Metal concentrate Also known as dressed ore or mined concentrate. Metal concentrate is the result of the concentration processes that sepa-rate out the financially valuable minerals present in ore from those with no financial value.
Metal content The quantities of, for example, zinc, copper, lead, gold and silver contained in concentrates. Zinc concentrates generally con-
tain approximately 50 per cent zinc metal, while copper concentrates generally contain approxi-mately 25 per cent copper. The lead content of mined concentrate is usually around 65 per cent.
Metal equivalents Used to describe the envi-ronmental impact of emissions and discharges to air and water. The metal equivalent (Me-eq) takes into account the toxicity of each metal (rel-ative to Cu) and provides a better metric of the environmental impact than the combined weight of the metals.
Metal premium The price agreed in advance, over and above the LME price, and paid by cus-tomers for specifically adapted metal that is free delivered.
Mineralisation A concentration of minerals in the bedrock.
Mineral Reserves Those parts of a mineral resource that can be mined and processed in accordance with the company’s profitability requirements and taking into account factors such as waste rock dilution and the percentage of metal in an ore that can be extracted in the concentration process are transferred to Min-eral Reserves and hence eliminated from the Mineral Resources. Mineral Reserves are divided into two categories: probable Mineral Reserves and proven Mineral Reserves.
Mineral Resource A concentration of minerals in the bedrock that may become commercially extractable. Mineral Resources are divided into three categories: inferred Mineral Resources, indicated Mineral Resources, and measured Mineral Resources.
Open pit A method of mining mineral deposits located near the surface. The waste rock is stripped and the ore mined directly at the sur-face.
Ore Economic term for minerals, rock types or other bedrock components that can be profita-bly mined to extract metals or other valuable substances.
Ore grade The average quantity of valuable metals in a tonne of ore, expressed as grams per tonne for precious metals and as a percent-age for other metals.
Payable metal content The percentage of the metal content of the concentrate for which the smelters pay when purchasing concentrate.
Precious metals Metals that are less com-monly present in the earth’s crust than base metals and which are regarded, to a greater extent, as a type of investment asset by financial sector players. The most common precious metals are gold, silver, platinum and palladium.
Price escalators (PP) Also known as price-sharing clauses. The clauses in the agree-ments for zinc smelting charges that distribute changes in metal prices between mines and
Abbreviations
Lb = pound = 0.4536 kg
Troy ounce = 31.1035 gram
USD = US dollars
USc = US cents
c/Lb = cent per pound = 1/22 USD/tonne
SEK = Swedish kronor
NOK = Norwegian kroner
EUR = euro
Ag = silver
Au = gold
Cu = copper
Ni = nickel
Pb = lead
Zn = zinc
smelters. There have been no price escalator clauses in copper treatment and refining charges for many years now.
Raw materials feed A smelter’s raw material input, i.e. the amount of metal concentrate or secondary materials processed and refined.
Recovery The percentage portion of the quan-tity of a given metal in an ore extracted during the concentration process.
Secondary material Various types of recycling materials from which metals can be recovered, e.g. electronic and metal scrap, metal ashes, slag, dust and scrap lead batteries.
Smelter A plant in which metal raw materials, metal concentrates or secondary materials are processed to separate metals from impurities.
Treatment and refining charges (TC/RC) The price of concentrate is defined as the LME price less treatment and refining charges, which com-prise the remuneration received by the smelter for refining the smelting material (concentrate and secondary materials) and extracting met-als. Copper smelters’ processes can be broken down into a treatment phase and a refining phase, while zinc smelters’ processes only involve a treatment phase, and hence zinc smelt-ers’ remuneration only comprises a treatment charge (TC).
Underground mine Mine where the ore is mined using underground tunnels. The mining methods used in Boliden’s underground mines include the cut-and-fill method and sub-level stoping.
Waste rock Economic term for rock which, unlike ore, contains no valuable material.
Zinc ingot An end product from zinc smelters with detailed specifications with regard to degree of purity, weight and size.

Introduction Market Operations Corporate Governance Financial reports
Boliden Annual Report 2016 | 119
ANNUAL GENERAL MEETING
Annual General Meeting
Boliden’s Annual General Meeting will be held on Tuesday, 25 April 2017 at Aitik in Gällivare.
ParticipationShareholders wishing to participate in the Annual General Me-eting must both be registered in the shareholders’ register kept by Euroclear Sweden AB on Wednesday, 19 April 2017 (for details of the re-registration process for nominee shareholders, please see below) and have notified the company of their intention to participate, either via Boliden’s website, www.boliden.com, by calling the company on tel. +46 8 32 94 29, or by writing to the company at the following address: Boliden, c/o Euroclear Sweden AB, Box 191, SE-101 23 Stockholm, Sweden. All such notifica-tions must be received by the company no later than Wednesday, 19 April 2017.
Shareholders’ notifications of their intention to attend the Annual General Meeting shall include the shareholder’s name, Civic ID no. or corporate ID no., address and telephone number, and the number of assistants who will accompany them. The information provided will be computerised and used exclusively in connection with the Annual General Meeting.
Nominee shareholdersIn order to be entitled to participate in the Annual General Meeting, nominee shareholders must, no later than Wednesday, 19 April 2017, have their shares temporarily re-registered in their own names with Euroclear Sweden AB. All such requests for registration in the shareholder’s own name must be submitted to the relevant trustee well ahead of this date.
Complete convening noticeA complete notice convening the Annual General Meeting, as well as financial and other information, can be found on Boliden’s website at www.boliden.com. Printed financial information may also be ordered via the website or from Boliden AB, Box 44, SE-101 20 Stockholm, Sweden.
Financial information25 April 2017 Interim Report for the first quarter 2017
20 July 2017 Interim Report for the second quarter 2017
24 October 2017 Interim Report for the third quarter 2017
14 February 2018 Fourth quarter Interim and Year-end Report 2017
QuestionsAny questions concerning the content of Boliden’s financial information can be submitted to:Boliden’s Investor RelationsTel. +46 8 610 15 00 ore-mail: [email protected]
Find out more at www.boliden.com

120 | Boliden Annual Report 2016
ADDRESSES
Addresses
Group
Boliden GroupBox 44SE-101 20 StockholmStreet address:Klarabergsviadukten 90Tel. +46 8 610 15 00
Boliden Mines SE-936 81 BolidenTel. +46 910 77 40 00
The Boliden AreaSE-936 81 BolidenTel. +46 910 77 40 00
Boliden AitikSakajärvi 1SE-982 92 GällivareTel. +46 970 72 90 00
Boliden GarpenbergKaspersbo 20SE-776 98 GarpenbergTel. +46 225 360 00
Boliden KylylahtiKaivostie 9FI-83700 PolvijärviFinlandTel. +358 10 271 0090
Boliden KevitsaKevitsantie 730FI-99670 PetkulaFinlandTel. +358 16 451 100
Boliden Tara KnockumberNavan Co. MeathIrelandTel. +353 46 908 2000
Boliden Smelters
Boliden Commercial ABBox 750SE-101 35 StockholmStreet address:Klarabergsviadukten 90Tel. +46 8 610 15 00
Boliden Kokkola Box 26 FI-67101 KokkolaFinlandTel. +358 6 828 6111 Boliden Odda Eitrheimsneset 1NO-5750 OddaNorwayTel. +47 53 64 91 00
Boliden Harjavalta Teollisuuskatu 1FI-29200 HarjavaltaFinlandTel. +358 2 535 8111
Boliden RönnskärSE-932 81 SkelleftehamnTel. +46 910 77 30 00
Boliden Bergsöe Box 132SE-261 22 LandskronaTel. +46 418 572 00
Boliden Marketing Office UK
No 7 Clarendon PlaceRoyal Leamington SpaWarwickshireCV32 5QLUKTel. +44 1926 833 010
Boliden Marketing Office Germany
Stresemannallee 4cD414 60 NeussTysklandTel. +49 2131 750 46 55
Boliden Marketing Office Denmark
Hvissinge vej 16DK1600 GlostrupDanmarkTel. +45 4326 8300
www.boliden.com

Production: Boliden in cooperation with Narva. Photo: Stefan Berg (p. 20, 21, 34, 68, 107), Jukka Brusila (p. b, 24), Jeanette Hägglund (p. 5, 44, 50, 64–66), Tobias Ohls/Scania (p. 49), Johanna Sjövall (p. 1, 35), Thomas Westermark (p. 28, 29, 41, 43b), Xavierarnau/Getty Images (p. 6), Tor Helge Øygarden (p. cover, 43a)Illustrations: Narva Translation: Copy Right AB Tryck: Göteborgstryckeriet, Mölndal, 2017
Boliden’s 2016 Annual ReportBoliden’s 2016 Annual Report is published in Swedish and in an English translation. The Swedish version shall take precedence in the event of any discrepancies between the two versions. The Annual Report describes Boliden’s financial performance and its work on sustainability issues, which is an integral part of Boliden’s operations. The sections of the Annual Report that have been audited in full by the Group’s auditors are the Directors’ Report on pages 25–47 and 54–57, and the financial reports and notes to the accounts on pages 68–99. The auditors have also read and issued a report on the Corporate Governance Report. Information on sustainability issues are presented on pages 4−5, 7–11 and 40–51 of the Annual Report.
The GRI Report, together with the complete GRI index Boliden has reported its sustainability work in accordance with the updated guidelines, G4, of the Global Reporting Initiatives (GRI) since 2014. The GRI Report, together with the complete GRI index, has been the subject of a limited assurance review by the company’s auditors. The GRI Report is available on www.boliden.com both in a complete online version and as a pdf.

A thin layer of zinc on steel is sufficient to counteract corrosion for 50–100 years, extending the lifespan of infra-structure and buildings, etc.
www.boliden.com
NA
RVA