Boiling Hot! Economy-wide Impacts of Climate …...Colombian Coffee Yields “International Workshop...
29
Boiling Hot! Economy-wide Impacts of Climate Change on Colombian Coffee Yields “International Workshop on Interregional Economic Modeling: Applications for the Colombian Economy” Banco de la República, Cartagena, Colombia March 19-21, 2020 Pedro Sayon
Transcript of Boiling Hot! Economy-wide Impacts of Climate …...Colombian Coffee Yields “International Workshop...

Boiling Hot! Economy-wide
Impacts of Climate Change on
Colombian Coffee Yields
“International Workshop on Interregional Economic
Modeling: Applications for the Colombian Economy”
Banco de la República, Cartagena, Colombia
March 19-21, 2020
Pedro Sayon

2
Research team – NEREUS
Eduardo Amaral Haddad (coordinator)
Inácio Fernandes Araújo
Pedro Sayon
Department of Economics, University of Sao Paulo
3
Weather vs. Climate
Department of Economics, University of Sao Paulo
“If you don’t like the weather in New England, just wait a few minutes.”
Mark Twain

Weather vs. Climate
Weather refers to atmospheric conditions that occur locally
over short periods of time – from minutes to hours or days
Familiar examples include rain, snow, clouds, winds,
floods or thunderstorms.
Climate, on the other hand, refers to the long-term regional or
even global average of temperature, humidity and rainfall
patterns over seasons, years or decades
Department of Economics, University of Sao Paulo 4

Climate change
The term “climate change” refers to a physical phenomenon in
which there are globally long lasting shifts in temperature,
precipitation, cloudiness, among other atmospheric conditions
in regard to their historical averages
Such variations may be caused by many different reasons,
such as internal Earth processes, external forces (e.g. solar
activity), or, more recently, because of human activity
Department of Economics, University of Sao Paulo 5

Global warming
Department of Economics, University of Sao Paulo 6
Source: NASA’s Goddard Institute for Space Studies
History
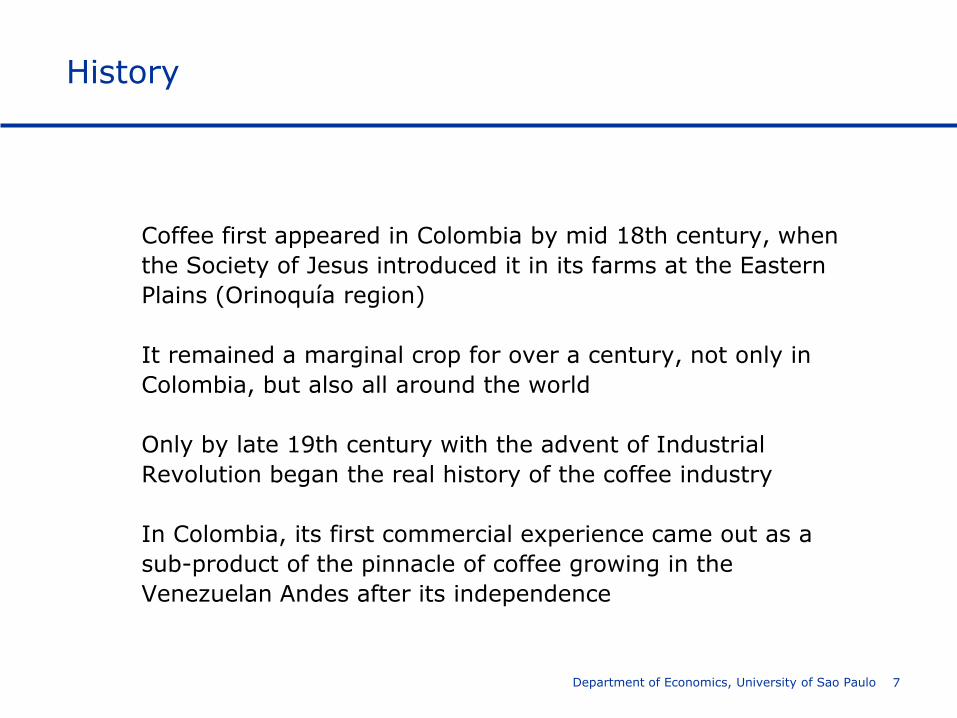
Coffee first appeared in Colombia by mid 18th century, when
the Society of Jesus introduced it in its farms at the Eastern
Plains (Orinoquía region)
It remained a marginal crop for over a century, not only in
Colombia, but also all around the world
Only by late 19th century with the advent of Industrial
Revolution began the real history of the coffee industry
In Colombia, its first commercial experience came out as a
sub-product of the pinnacle of coffee growing in the
Venezuelan Andes after its independence
Department of Economics, University of Sao Paulo 7

History
The first decade of the 20th century did not seem likely to yield
a large coffee expansion. International grain prices remained at
extremely low levels and coffee farms were unproductive and
still affected by the greatest civil conflict in Colombian history.
Nevertheless, the coffee industry took an unexpected turn,
having quintupled its yields by the end of the 1920s. Not only
did it become Colombia’s top export, but also the country
became the world’s second largest producer.
The great bonanza that the coffee economy experienced until
the crisis of 1929 was not abruptly interrupted. On the
contrary, it kept growing in later decades. In the early 1960s,
its yields reached three times what it was in the mid 1920s.
Department of Economics, University of Sao Paulo 8

The Colombian coffee industry
Colombian coffee is renowned worldwide for its quality and
delicious taste
It is one of the major crops of the country, being the world’s
third largest producer
Although coffee growing is not relevant in terms of GDP (less
than 1%), it plays an important role when it comes to
employment, with over half a million families benefiting directly
from it, potentially more indirectly
Given the importance of this commodity to the economy,
climate change has sparked the discussion about how to
overcome the coming hindrances imposed by new weather
conditionsDepartment of Economics, University of Sao Paulo 9
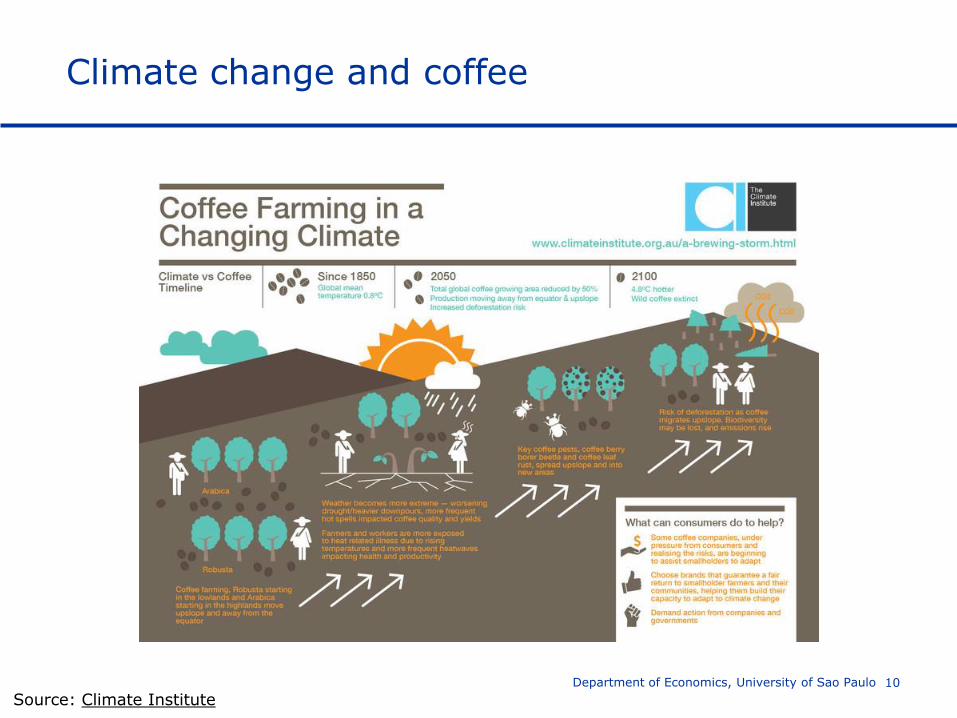
Climate change and coffee
10
Source: Climate InstituteDepartment of Economics, University of Sao Paulo

Climate change and coffee
11
Source: Climate InstituteDepartment of Economics, University of Sao Paulo
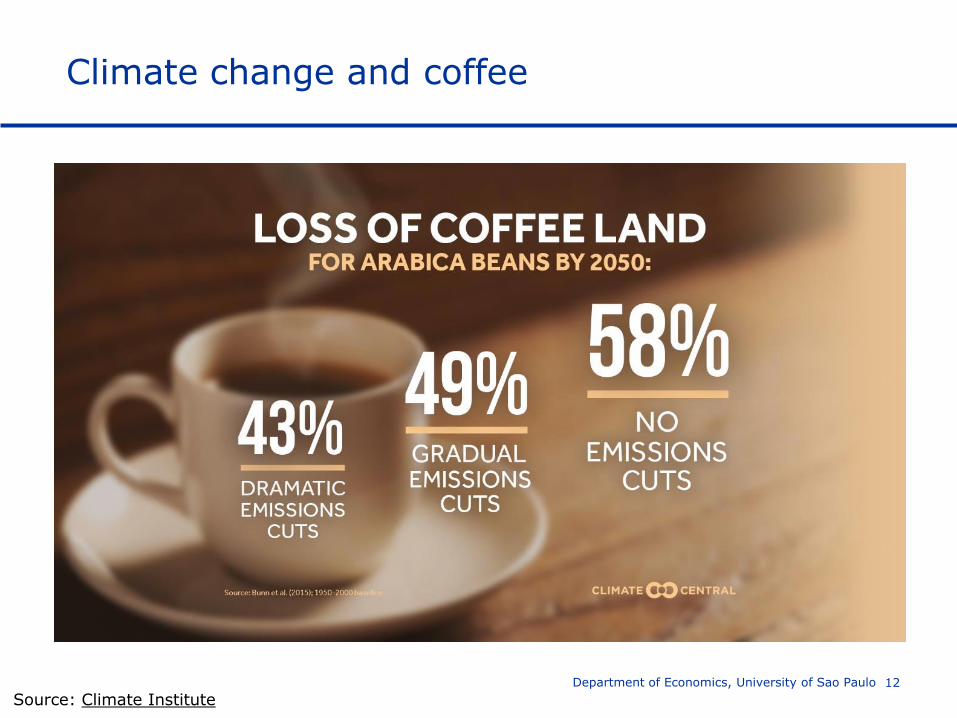
Climate change and coffee
12
Source: Climate InstituteDepartment of Economics, University of Sao Paulo

Coffee locations
13
Source: Bunn et al. (2015)
Department of Economics, University of Sao Paulo
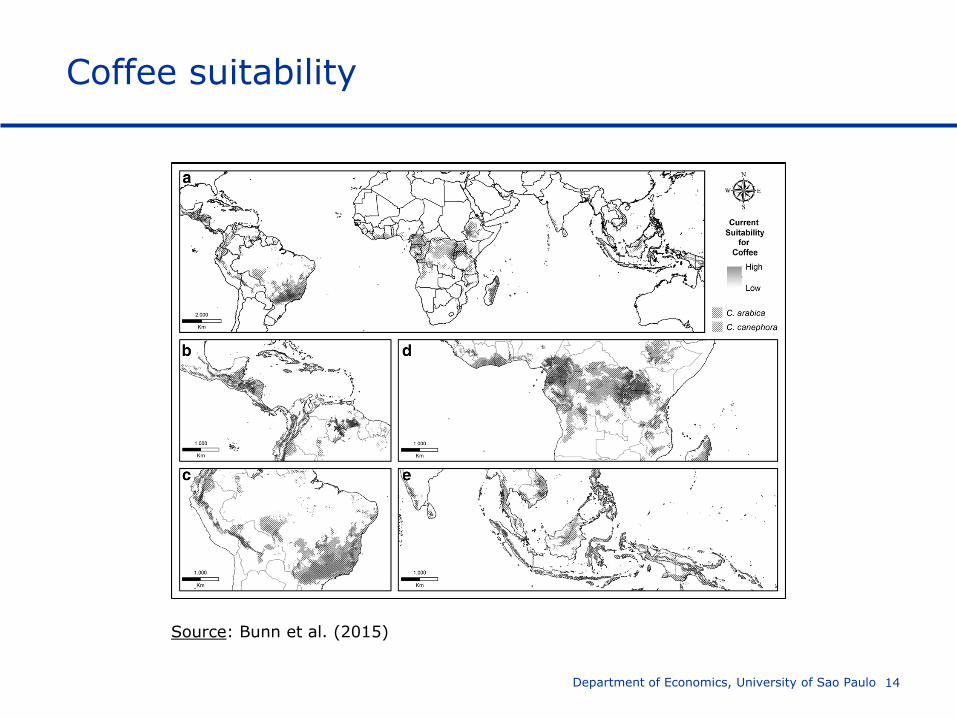
Coffee suitability
14
Source: Bunn et al. (2015)
Department of Economics, University of Sao Paulo

Suitability change
15
Source: Bunn et al. (2015)
Department of Economics, University of Sao Paulo

Suitability distribution
16
Source: Bunn et al. (2015)
Department of Economics, University of Sao Paulo
What about Colombia?
Sierra (2019) uses a multi-step model to predict the outputs
for each municipality in Colombia producing coffee (>500)
Project an increase between 4% and 24% in coffee
yields on a national level
High degree of spatial heterogeneity
Climate affects productivity (i) mainly through temperature
and precipitation; (ii) in turn, they impact water absorption,
production of photosynthate and consequently growth; (iii)
coffee borer beetle reproduction rate
Sierra (2019) integrates all these elements into the dynamics
of production, obtaining the resulting coffee yields
Department of Economics, University of Sao Paulo 17
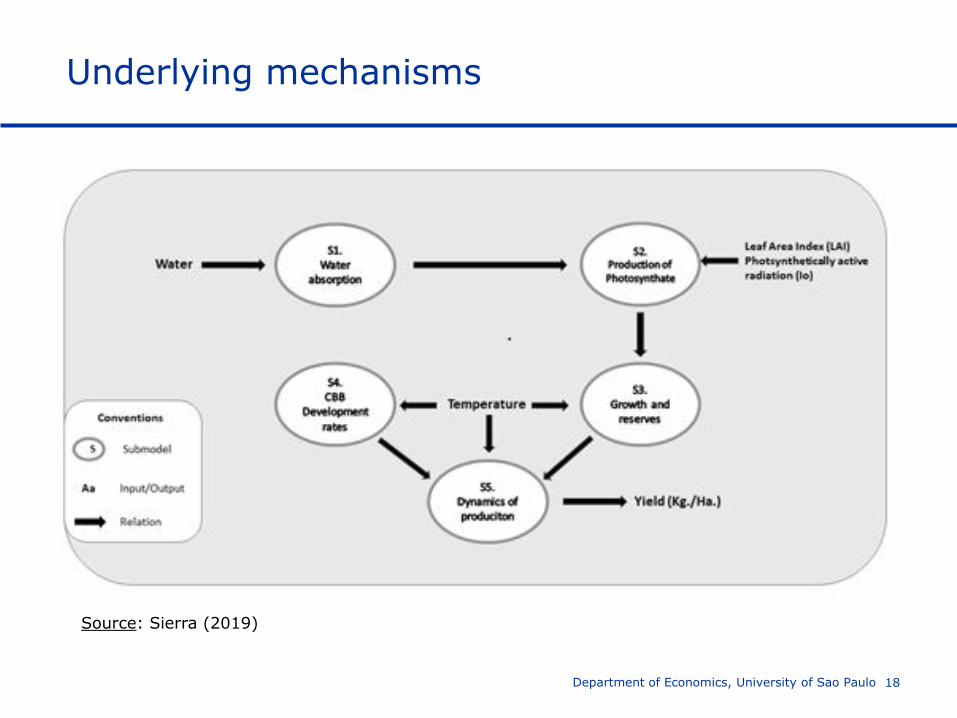
Underlying mechanisms
18
Source: Sierra (2019)
Department of Economics, University of Sao Paulo

19
What if climate change affected coffee yields in regionally-differentiated ways?
How do we implement productivity change?
Shock a1(“S2”,”R5”) = 15.275;
Department of Economics, University of Sao Paulo
All-input augmenting technical change
15.275% more inputs needed to produce same level of output
Which industry is affected?
And in which region?
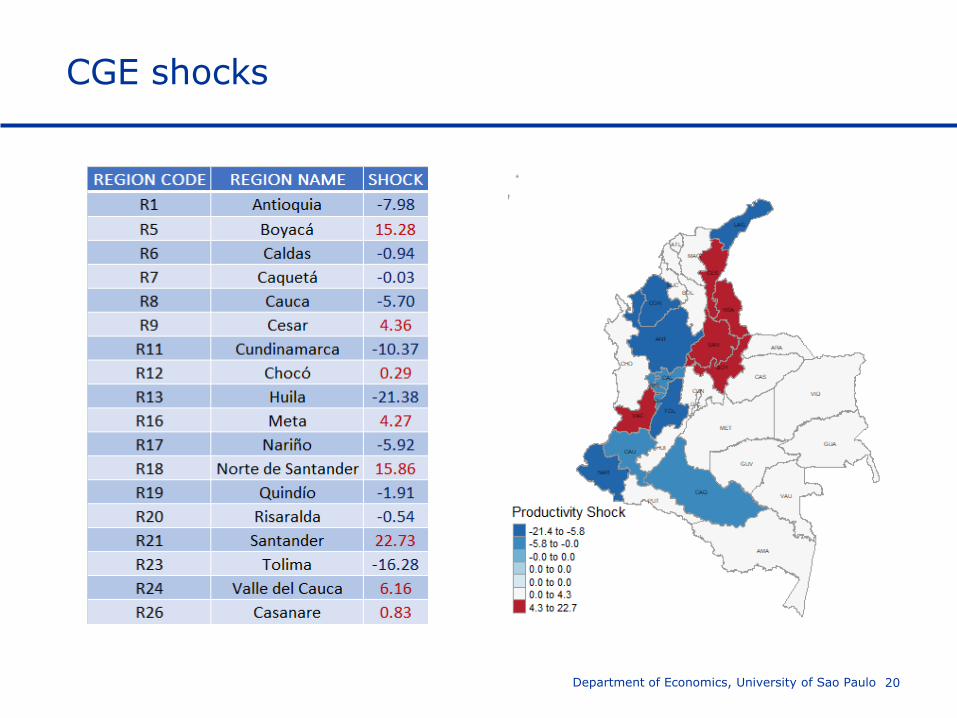
CGE shocks
20Department of Economics, University of Sao Paulo

Topology vs. Productivity shock
21
Source: World Atlas
Department of Economics, University of Sao Paulo
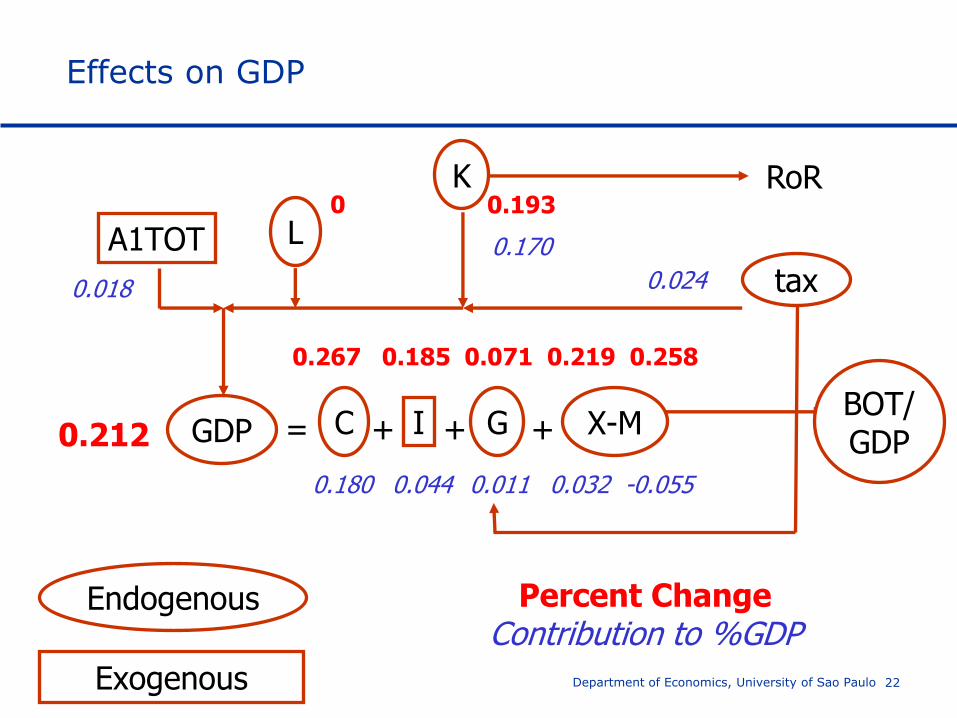
Effects on GDP
Department of Economics, University of Sao Paulo 22
GDP
LA1TOT
= +++
0.018
0.212
0.180 0.044 0.011 0.032 -0.055
0.024
0 0.193
Endogenous
Exogenous
0.170
C G
Percent ChangeContribution to %GDP
0.267 0.185 0.071 0.219 0.258
tax
I X-MBOT/GDP
RoRK

Contribution to GDP change, by source of shock
23Department of Economics, University of Sao Paulo
-0.060
-0.040
-0.020
0.000
0.020
0.040
0.060
0.080
0.100
0.120
0.140
Co
ntr
ibu
tio
n t
o G
DP
ch
ange
(in
per
cen
tage
po
ints
)
Total impact on GDP = 0.212%
Total impact on GDP = 0.271%
Total impact on GDP = -0.059%

Impact on activity level, by sector
24Department of Economics, University of Sao Paulo
-1.000 0.000 1.000 2.000 3.000 4.000 5.000
Mining of coal and lignite
Extraction of crude petroleum and natural gas
Manufacture of basic metals; Manufacture of fabricated metal…
Manufacture of electrical equipment; Manufacture of computer,…
Mining of metal ores
Manufacture of chemicals and chemical products; Manufacture of…
Manufacture of leather and related products
Agriculture
Manufacture of rubber and plastics products
Public administration and defence; compulsory social security
Human health and social work activities
Processing and preserving of meat and preserving of fish, crustaceans…
Fishing and aquaculture
Processing of grain mill products, starches and starch products
Water collection, treatment and supply
Arts, entertainment and recreation; Other service activities
Manufacture of beverages; Manufacture of tobacco products
Real estate activities
Coffee growing
Processing of coffee products
% change in activity level
Top 10
Bottom 10

Gross Regional Product
25
Top 5
Department of Economics, University of Sao Paulo
Bottom 5
# Department GRP
R13 Huila 3.295
R23 Tolima 1.286
R11 Cundinamarca 0.320
R33 Vichada 0.311
R22 Sucre 0.291
# Department GRP
R9 Cesar -0.119
R18 Norte de Santander -0.193
R19 Quindío -0.232
R6 Caldas -0.281
R21 Santander -0.305
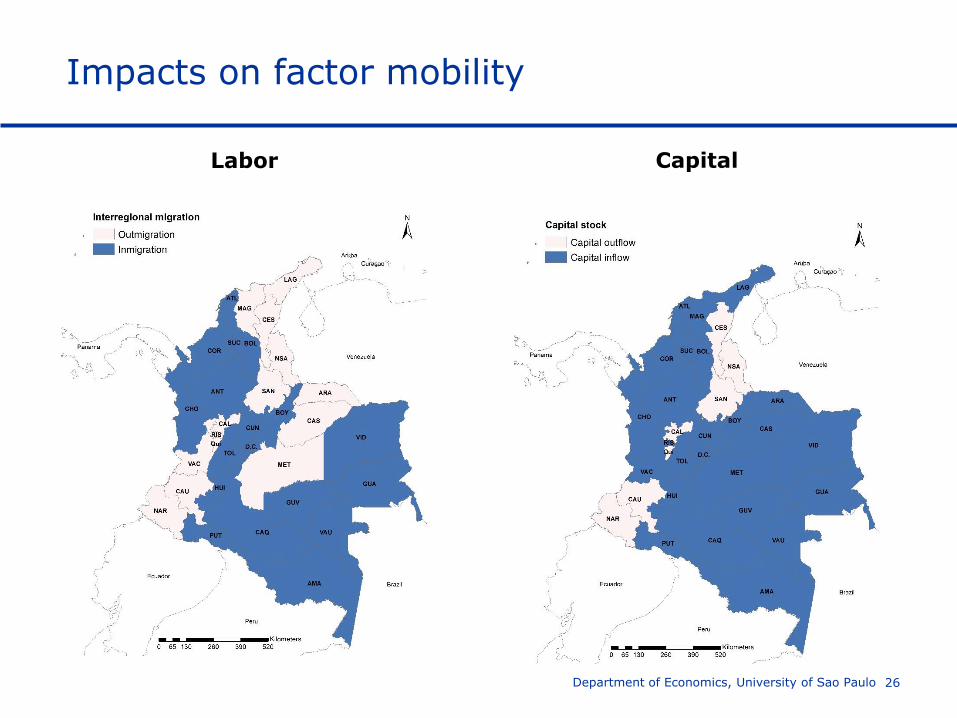
Impacts on factor mobility
26Department of Economics, University of Sao Paulo
Labor Capital

Conclusions
It is important to note that although macro results tend to be
relatively small – consistent with Sierra (2019) – they are very
heterogeneous among sectors and regions
Coffee related industries (growing and processing) were the
ones most affected by the shock, which is to be expected given
the production structure of this commodity
Height plays a major role in this simulation: lower regions may
become unsuitable for coffee, whereas Andean regions will
potentially experience a sharp increase in productivity for this
crop
Department of Economics, University of Sao Paulo 27
Next steps (room for collaboration)
Introduce a more detailed analysis regarding the difference
between production quantity and quality
What if the climate shocks also affected the quality of
Colombian coffee?
Integrate a stochastic module into the model to deal with
uncertainties
Input land as a specific primary factor
Department of Economics, University of Sao Paulo 28

www.usp.br/nereus
29Department of Economics, University of Sao Paulo