BofA Investor Presentation
30
Bank of America 4Q15 Financial Results January 19, 2016
description
BofA Investor Presentation
Transcript of BofA Investor Presentation

Bank of America 4Q15 Financial Results
January 19, 2016

Simplified and Stronger Company
$144 $146 $152 $162
$13.36 $13.79 $14.43 $15.62
$0
$5
$10
$15
$20
$0
$30
$60
$90
$120
$150
$180
4Q12 4Q13 4Q14 4Q15
Tangible common equity Tangible book value per share
$372 $376 $439
$504
33
38 39 39
20
30
40
50
$0
$200
$400
$600
4Q12 4Q13 4Q14 4Q15
Global Excess Liquidity Sources Time to Required Funding
Global Excess Liquidity Sources ($B) & Time to Required Funding (months) 2
Tangible Common Equity ($B) and Tangible Book Value per Share 3
2
$1,105 $1,119 $1,119 $1,197
$908 $928 $881 $903
$0
$200
$400
$600
$800
$1,000
$1,200
$1,400
4Q12 4Q13 4Q14 4Q15
Total deposits Total loans and leases
Deposits and Loans & Leases (EOP, $B)
____________________
1 2015 results include early adoption of new accounting guidance on the recognition and measurement of financial instruments. See note A on slide 27. 2 See note B on slide 27 for definition of Global Excess Liquidity Sources and see note C on slide 27 for definition of Time to Required Funding. 3 Represent non-GAAP financial measures. Reported common shareholders' equity was $234B, $224B, $219B and $218B for 4Q15, 4Q14, 4Q13 and 4Q12, respectively. Reported book value per share was $22.54,
$21.32, $20.71 and $20.24 for 4Q15, 4Q14, 4Q13 and 4Q12, respectively. 4 Represents a non-GAAP financial measure. Reported Legacy Assets & Servicing (LAS) noninterest expense was $4.5B, $20.6B, $12.4B and $13.2B for 2015, 2014, 2013 and 2012, respectively. 5 Includes the $1.1B provision for the Independent Foreclosure Review (IFR) acceleration agreement in 4Q12.
$14.9
$7.9
$4.4 $4.3 1.67%
0.87% 0.49% 0.50%
0%
1%
2%
3%
4%
$0
$5
$10
$15
$20
2012 2013 2014 2015
Net charge-offs Net charge-off ratio
Net Charge-offs ($B)
$4.2
$11.4
$4.8
$15.9
$0
$5
$10
$15
$20
2012 2013 2014 2015
Net Income ($B) 1
56.3 54.5 53.3 52.4
10.5 8.6 5.4 3.6
5.3 6.1 16.4
1.2
$72.1 $69.2 $75.1
$57.2
$0
$20
$40
$60
$80
2012 2013 2014 2015
All other LAS (excl. litigation & IFR) Litigation
Noninterest Expense ($B)
4 5
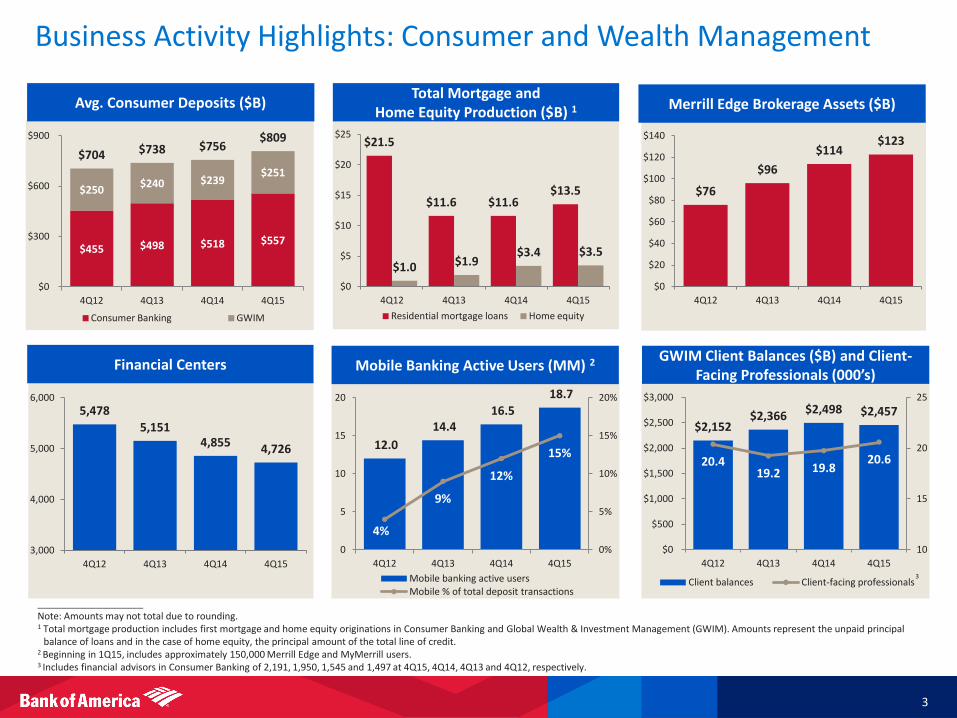
Business Activity Highlights: Consumer and Wealth Management
3
$21.5
$11.6 $11.6 $13.5
$1.0 $1.9 $3.4 $3.5
$0
$5
$10
$15
$20
$25
4Q12 4Q13 4Q14 4Q15
Residential mortgage loans Home equity
$455 $498 $518 $557
$250 $240 $239
$251
$704 $738 $756 $809
$0
$300
$600
$900
4Q12 4Q13 4Q14 4Q15
Consumer Banking GWIM
$2,152 $2,366
$2,498 $2,457
20.4 19.2 19.8
20.6
10
15
20
25
$0
$500
$1,000
$1,500
$2,000
$2,500
$3,000
4Q12 4Q13 4Q14 4Q15
Client balances Client-facing professionals 3
Avg. Consumer Deposits ($B) Total Mortgage and Home Equity Production ($B) 1
GWIM Client Balances ($B) and Client-Facing Professionals (000’s)
$76
$96
$114 $123
$0
$20
$40
$60
$80
$100
$120
$140
4Q12 4Q13 4Q14 4Q15
Merrill Edge Brokerage Assets ($B)
12.0
14.4 16.5
18.7
4%
9%
12%
15%
0%
5%
10%
15%
20%
0
5
10
15
20
4Q12 4Q13 4Q14 4Q15
Mobile banking active users Mobile % of total deposit transactions
Mobile Banking Active Users (MM) 2
5,478
5,151 4,855 4,726
3,000
4,000
5,000
6,000
4Q12 4Q13 4Q14 4Q15
____________________ Note: Amounts may not total due to rounding. 1 Total mortgage production includes first mortgage and home equity originations in Consumer Banking and Global Wealth & Investment Management (GWIM). Amounts represent the unpaid principal
balance of loans and in the case of home equity, the principal amount of the total line of credit. 2 Beginning in 1Q15, includes approximately 150,000 Merrill Edge and MyMerrill users. 3 Includes financial advisors in Consumer Banking of 2,191, 1,950, 1,545 and 1,497 at 4Q15, 4Q14, 4Q13 and 4Q12, respectively.
Financial Centers
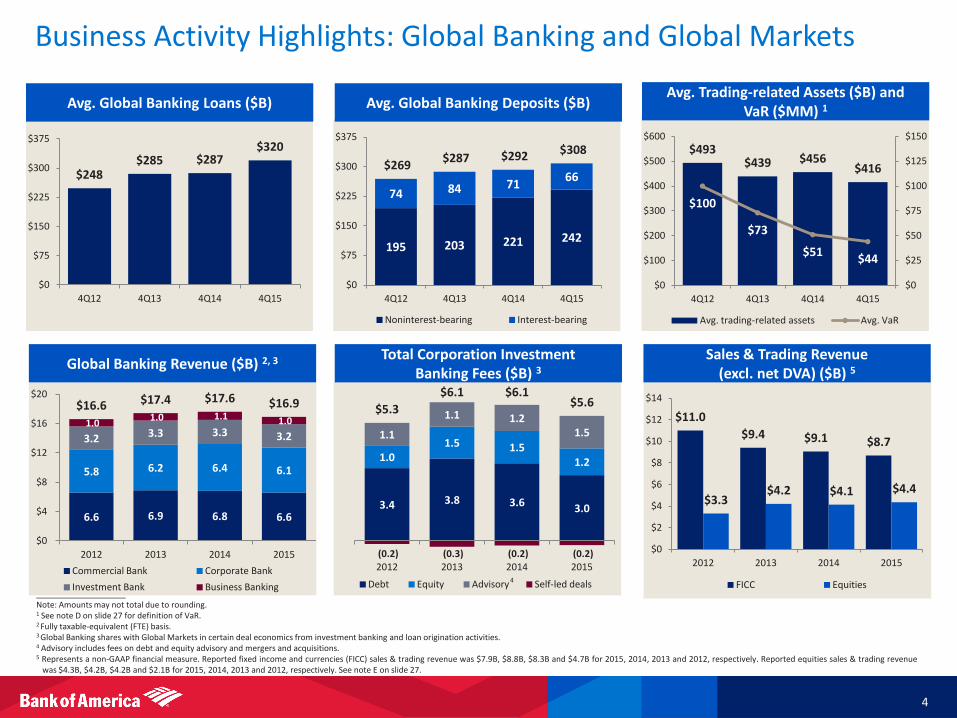
Business Activity Highlights: Global Banking and Global Markets
4
____________________ Note: Amounts may not total due to rounding. 1 See note D on slide 27 for definition of VaR. 2 Fully taxable-equivalent (FTE) basis. 3 Global Banking shares with Global Markets in certain deal economics from investment banking and loan origination activities. 4 Advisory includes fees on debt and equity advisory and mergers and acquisitions. 5 Represents a non-GAAP financial measure. Reported fixed income and currencies (FICC) sales & trading revenue was $7.9B, $8.8B, $8.3B and $4.7B for 2015, 2014, 2013 and 2012, respectively. Reported equities sales & trading revenue
was $4.3B, $4.2B, $4.2B and $2.1B for 2015, 2014, 2013 and 2012, respectively. See note E on slide 27.
$11.0
$9.4 $9.1 $8.7
$3.3 $4.2 $4.1 $4.4
$0
$2
$4
$6
$8
$10
$12
$14
2012 2013 2014 2015
FICC Equities
195 203 221 242
74 84 71 66
$269 $287 $292 $308
$0
$75
$150
$225
$300
$375
4Q12 4Q13 4Q14 4Q15
Noninterest-bearing Interest-bearing
$493 $439 $456
$416
$100
$73
$51 $44
$0
$25
$50
$75
$100
$125
$150
$0
$100
$200
$300
$400
$500
$600
4Q12 4Q13 4Q14 4Q15
Avg. trading-related assets Avg. VaR
$248 $285 $287
$320
$0
$75
$150
$225
$300
$375
4Q12 4Q13 4Q14 4Q15
Avg. Global Banking Loans ($B) Avg. Global Banking Deposits ($B) Avg. Trading-related Assets ($B) and
VaR ($MM) 1
3.4 3.8 3.6 3.0
1.0 1.5 1.5
1.2
1.1
1.1 1.2 1.5
(0.2) (0.3) (0.2) (0.2)
$5.3
$6.1 $6.1 $5.6
2012 2013 2014 2015
Debt Equity Advisory Self-led deals 4
6.6 6.9 6.8 6.6
5.8 6.2 6.4 6.1
3.2 3.3 3.3 3.2 1.0
1.0 1.1 1.0
$16.6 $17.4 $17.6 $16.9
$0
$4
$8
$12
$16
$20
2012 2013 2014 2015
Commercial Bank Corporate Bank
Investment Bank Business Banking
Global Banking Revenue ($B) 2, 3 Total Corporation Investment Banking Fees ($B) 3
Sales & Trading Revenue (excl. net DVA) ($B) 5
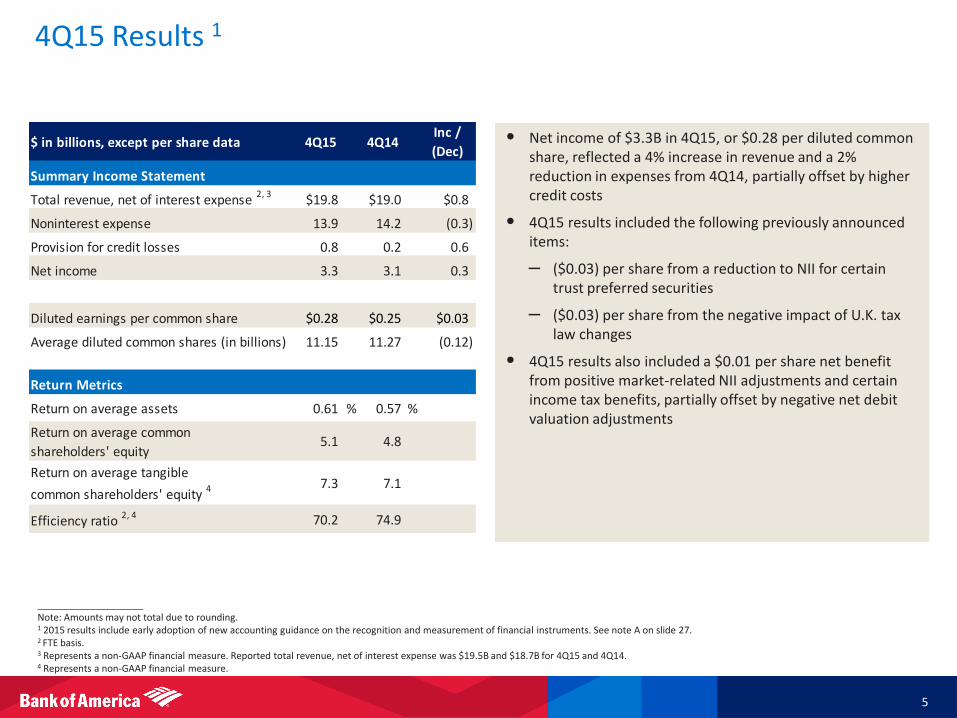
4Q15 Results 1
5
____________________ Note: Amounts may not total due to rounding. 1 2015 results include early adoption of new accounting guidance on the recognition and measurement of financial instruments. See note A on slide 27. 2 FTE basis. 3 Represents a non-GAAP financial measure. Reported total revenue, net of interest expense was $19.5B and $18.7B for 4Q15 and 4Q14. 4 Represents a non-GAAP financial measure.
$ in billions, except per share data 4Q15 4Q14Inc /
(Dec)
Summary Income Statement
Total revenue, net of interest expense 2, 3
$19.8 $19.0 $0.8
Noninterest expense 13.9 14.2 (0.3)
Provision for credit losses 0.8 0.2 0.6
Net income 3.3 3.1 0.3
Diluted earnings per common share $0.28 $0.25 $0.03
Average diluted common shares (in billions) 11.15 11.27 (0.12)
Return Metrics
Return on average assets 0.61 % 0.57 %
Return on average common
shareholders' equity5.1 4.8
Return on average tangible
common shareholders' equity 4 7.3 7.1
Efficiency ratio 2, 4 70.2 74.9
• Net income of $3.3B in 4Q15, or $0.28 per diluted common share, reflected a 4% increase in revenue and a 2% reduction in expenses from 4Q14, partially offset by higher credit costs
• 4Q15 results included the following previously announced items:
– ($0.03) per share from a reduction to NII for certain trust preferred securities
– ($0.03) per share from the negative impact of U.K. tax law changes
• 4Q15 results also included a $0.01 per share net benefit from positive market-related NII adjustments and certain income tax benefits, partially offset by negative net debit valuation adjustments
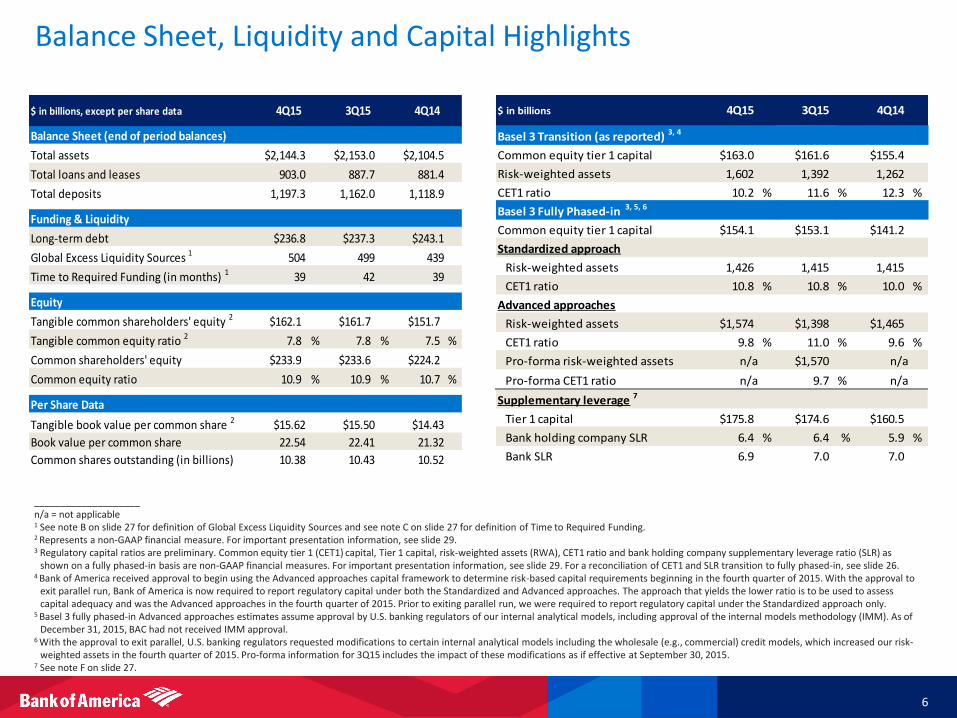
Balance Sheet, Liquidity and Capital Highlights
6
$ in billions, except per share data
Balance Sheet (end of period balances)
Total assets $2,144.3 $2,153.0 $2,104.5
Total loans and leases 903.0 887.7 881.4
Total deposits 1,197.3 1,162.0 1,118.9
Funding & Liquidity
Long-term debt $236.8 $237.3 $243.1
Global Excess Liquidity Sources 1 504 499 439
Time to Required Funding (in months) 1 39 42 39
Equity
Tangible common shareholders' equity 2 $162.1 $161.7 $151.7
Tangible common equity ratio 2 7.8 % 7.8 % 7.5 %
Common shareholders' equity $233.9 $233.6 $224.2
Common equity ratio 10.9 % 10.9 % 10.7 %
Per Share Data
Tangible book value per common share 2 $15.62 $15.50 $14.43
Book value per common share 22.54 22.41 21.32
Common shares outstanding (in billions) 10.38 10.43 10.52
4Q15 3Q15 4Q14
____________________ n/a = not applicable 1 See note B on slide 27 for definition of Global Excess Liquidity Sources and see note C on slide 27 for definition of Time to Required Funding. 2 Represents a non-GAAP financial measure. For important presentation information, see slide 29. 3 Regulatory capital ratios are preliminary. Common equity tier 1 (CET1) capital, Tier 1 capital, risk-weighted assets (RWA), CET1 ratio and bank holding company supplementary leverage ratio (SLR) as
shown on a fully phased-in basis are non-GAAP financial measures. For important presentation information, see slide 29. For a reconciliation of CET1 and SLR transition to fully phased-in, see slide 26. 4 Bank of America received approval to begin using the Advanced approaches capital framework to determine risk-based capital requirements beginning in the fourth quarter of 2015. With the approval to
exit parallel run, Bank of America is now required to report regulatory capital under both the Standardized and Advanced approaches. The approach that yields the lower ratio is to be used to assess capital adequacy and was the Advanced approaches in the fourth quarter of 2015. Prior to exiting parallel run, we were required to report regulatory capital under the Standardized approach only.
5 Basel 3 fully phased-in Advanced approaches estimates assume approval by U.S. banking regulators of our internal analytical models, including approval of the internal models methodology (IMM). As of December 31, 2015, BAC had not received IMM approval.
6 With the approval to exit parallel, U.S. banking regulators requested modifications to certain internal analytical models including the wholesale (e.g., commercial) credit models, which increased our risk-weighted assets in the fourth quarter of 2015. Pro-forma information for 3Q15 includes the impact of these modifications as if effective at September 30, 2015.
7 See note F on slide 27.
$ in billions
Basel 3 Transition (as reported) 3, 4
Common equity tier 1 capital $163.0 $161.6 $155.4
Risk-weighted assets 1,602 1,392 1,262
CET1 ratio 10.2 % 11.6 % 12.3 %
Basel 3 Fully Phased-in 3, 5, 6
Common equity tier 1 capital $154.1 $153.1 $141.2
Standardized approach
Risk-weighted assets 1,426 1,415 1,415
CET1 ratio 10.8 % 10.8 % 10.0 %
Advanced approaches
Risk-weighted assets $1,574 $1,398 $1,465
CET1 ratio 9.8 % 11.0 % 9.6 %
Pro-forma risk-weighted assets n/a $1,570 n/a
Pro-forma CET1 ratio n/a 9.7 % n/a
Supplementary leverage 7
Tier 1 capital $175.8 $174.6 $160.5
Bank holding company SLR 6.4 % 6.4 % 5.9 %
Bank SLR 6.9 7.0 7.0
4Q15 3Q15 4Q14

Loans & Leases and Deposits (EOP, $B)
7
____________________ Note: Amounts may not total due to rounding. 1 Beginning with new originations in 2014, we retain certain residential mortgages in Consumer Banking, consistent with where the overall relationship is managed; previously such mortgages were
retained in All Other. 2 Includes Consumer Banking, GWIM, Global Banking and Global Markets (GM).
Total Loans & Leases LAS and All Other Loans & Leases
$881 $878 $886 $888 $903
$0
$250
$500
$750
$1,000
4Q14 1Q15 2Q15 3Q15 4Q15
173 160 147 131 125
33 32
30 28 27
$206 $192
$177 $159 $152
$0
$50
$100
$150
$200
$250
4Q14 1Q15 2Q15 3Q15 4Q15
All Other Legacy Assets & Servicing (LAS)
390 401 416 429 444
286 286 294 300 308
$676 $686 $710 $729 $751
$0
$200
$400
$600
$800
4Q14 1Q15 2Q15 3Q15 4Q15
Commercial Consumer
524 549 547 552 573
245 244 238 246 261
280 290 292 298 296 70 70 73 66 67
$1,119 $1,153 $1,150 $1,162 $1,197
$0
$300
$600
$900
$1,200
4Q14 1Q15 2Q15 3Q15 4Q15
Consumer Banking GWIM Global Banking Other (GM, LAS, All Other)
1
Total Deposits Loans & Leases in Primary Lending Segments 2

$0.9
$1.2 $1.1
$0.9
$1.1 $1.0 $1.0 $0.9 $0.9 $1.0
0.47% 0.47% 0.43% 0.42% 0.45% 0.40%
0.56% 0.49%
0.42%
0.51%
0.0%
0.5%
1.0%
$0.0
$0.5
$1.0
$1.5
4Q14 1Q15 2Q15 3Q15 4Q15
Reported NCOs and ratio Adjusted NCOs and ratio
____________________ 1 Represents a non-GAAP financial measure. Adjusted net charge-offs exclude DoJ settlement impacts of $28MM, $53MM, $166MM, $230MM and $151MM for 4Q15, 3Q15, 2Q15, 1Q15 and 4Q14,
respectively, and recoveries from NPL sales and other recoveries of $8MM, $58MM, $27MM, $40MM and $314MM for 4Q15, 3Q15, 2Q15, 1Q15 and 4Q14, respectively, and collateral valuation adjustments of $119MM in 4Q15.
Asset Quality Trends
8
Net Charge-offs (NCOs) and Adjusted Net Charge-offs ($B)
Provision for Credit Losses ($B)
$0.2
$0.8 $0.8 $0.8 $0.8
$0.0
$0.5
$1.0
4Q14 1Q15 2Q15 3Q15 4Q15
1
• Total net charge-offs of $1.1B increased $0.2B from 3Q15
– Adjusted for certain items reserved for in prior quarters and recoveries on NPL sales 1, total net charge-offs of $1.0B increased $68MM, driven by an increase in commercial charge-offs related to the energy sector
• Provision of $0.8B was relatively stable versus 3Q15, reflecting higher net charge-offs in commercial, mostly offset by reserve releases in consumer

Asset Quality – Consumer Portfolio
9
Consumer Net Charge-offs ($MM)
$794
$1,117 $1,020
$821 $958
0.64%
0.95% 0.87%
0.71% 0.84%
0.00%
0.50%
1.00%
1.50%
$0
$500
$1,000
$1,500
4Q14 1Q15 2Q15 3Q15 4Q15
Credit Card Other Net charge-off ratio
Consumer Asset Quality Metrics ($MM) 4Q15 3Q15 4Q14
Provis ion $494 $542 $131
Nonperforming loans and leases 8,165 8,697 10,819
Al lowance for loans and leases 7,385 7,952 9,982
% of loans and leases 3 1.63% 1.75% 2.05%
# times annual ized NCOs 1.94x 2.44x 3.17x
____________________ 1 Adjustments include DoJ settlement impacts of $28MM and $53MM for 4Q15 and 3Q15, recoveries from NPL sales and other recoveries of $8MM and $58MM for 4Q15 and 3Q15, and collateral
valuation adjustments of $119MM in 4Q15. 2 Excludes FHA-insured loans and other loans individually insured under long-term standby agreements. 3 Excludes loans measured at fair value.
Consumer 30+ Days Performing Past Due ($B) 2
$4.8 $4.4 $4.2 $4.3 $4.3
$0
$2
$4
$6
4Q14 1Q15 2Q15 3Q15 4Q15
• Consumer net charge-offs increased $137MM compared to 3Q15, driven by certain items reserved for in prior quarters, primarily collateral valuation adjustments on consumer real estate ($119MM)
– Adjusted for certain items reserved for in prior quarters and recoveries on NPL sales 1, consumer net charge-offs were relatively flat compared to 3Q15 (adjusted net charge-off ratio was 0.72% for 4Q15, unchanged from 3Q15)
• Consumer provision decreased $48MM compared to 3Q15 due to continued improvement in portfolio trends
• Consumer nonperforming loans (NPLs) declined $532MM compared to 3Q15, driven by consumer real estate NPL sales
• $7.4B of allowance for consumer loans and leases provides 1.63% coverage of loans
– Allowance covers 1.94x current period annualized net charge-offs compared to 2.44x in 3Q15; adjusted for certain items reserved for in prior quarters and recoveries on NPL sales 1, allowance covers 2.27x current period annualized net charge-offs
$4.9 23%
$3.4 16%
$5.6 26%
$5.8 27%
$1.6 8%
Exploration & production (E&P)
Oil field services (OFS)
Refining & marketing
Vertically integrated
All other energy
Asset Quality – Commercial Portfolio
Commercial Net Charge-offs ($MM)
$85 $77
$48
$111
$186
0.09% 0.08% 0.05%
0.11%
0.17%
0.00%
0.10%
0.20%
0.30%
$0
$100
$200
4Q14 1Q15 2Q15 3Q15 4Q15
C&I Small Business and Other Net charge-off ratio
Commercial Asset Quality Metrics ($MM) 4Q15 3Q15 4Q14
Provis ion $316 $264 $88
Nonperforming loans and leases 1,212 1,102 1,113
Reservable cri ticized uti l i zed exposure 16,508 13,571 11,570
Al lowance for loans and leases 4,849 4,705 4,437
% of loans and leases 1 1.10% 1.10% 1.15%
# times annual ized NCOs 6.60x 10.62x 13.08x
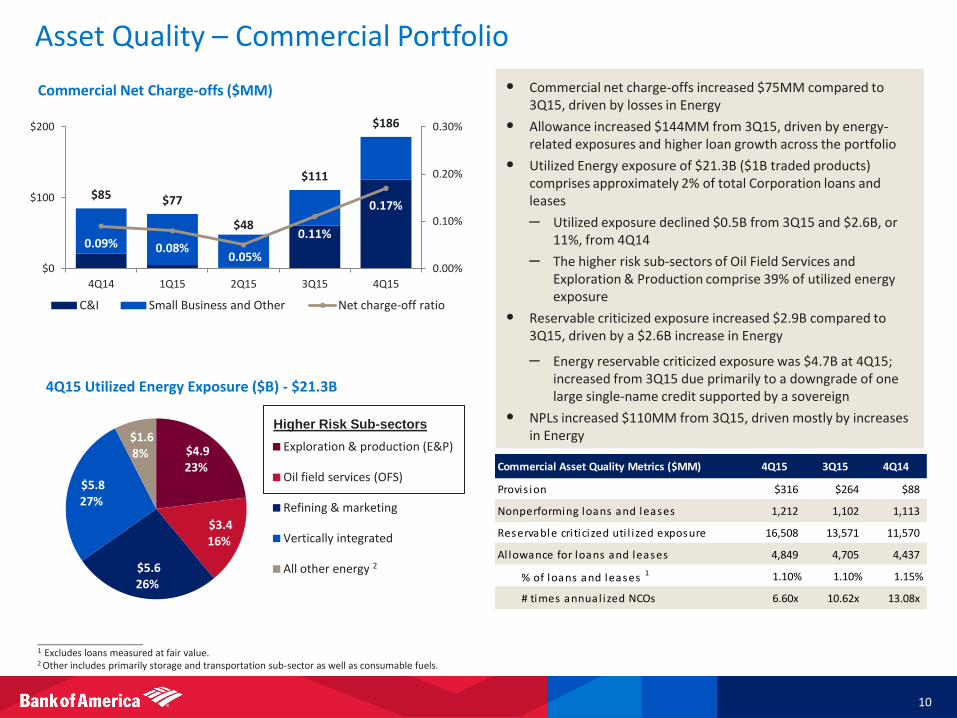
• Commercial net charge-offs increased $75MM compared to 3Q15, driven by losses in Energy
• Allowance increased $144MM from 3Q15, driven by energy-related exposures and higher loan growth across the portfolio
• Utilized Energy exposure of $21.3B ($1B traded products) comprises approximately 2% of total Corporation loans and leases
– Utilized exposure declined $0.5B from 3Q15 and $2.6B, or 11%, from 4Q14
– The higher risk sub-sectors of Oil Field Services and Exploration & Production comprise 39% of utilized energy exposure
• Reservable criticized exposure increased $2.9B compared to 3Q15, driven by a $2.6B increase in Energy
– Energy reservable criticized exposure was $4.7B at 4Q15; increased from 3Q15 due primarily to a downgrade of one large single-name credit supported by a sovereign
• NPLs increased $110MM from 3Q15, driven mostly by increases in Energy
____________________ 1 Excludes loans measured at fair value. 2 Other includes primarily storage and transportation sub-sector as well as consumable fuels.
4Q15 Utilized Energy Exposure ($B) - $21.3B
10
2
Higher Risk Sub-sectors
Net Interest Income
11
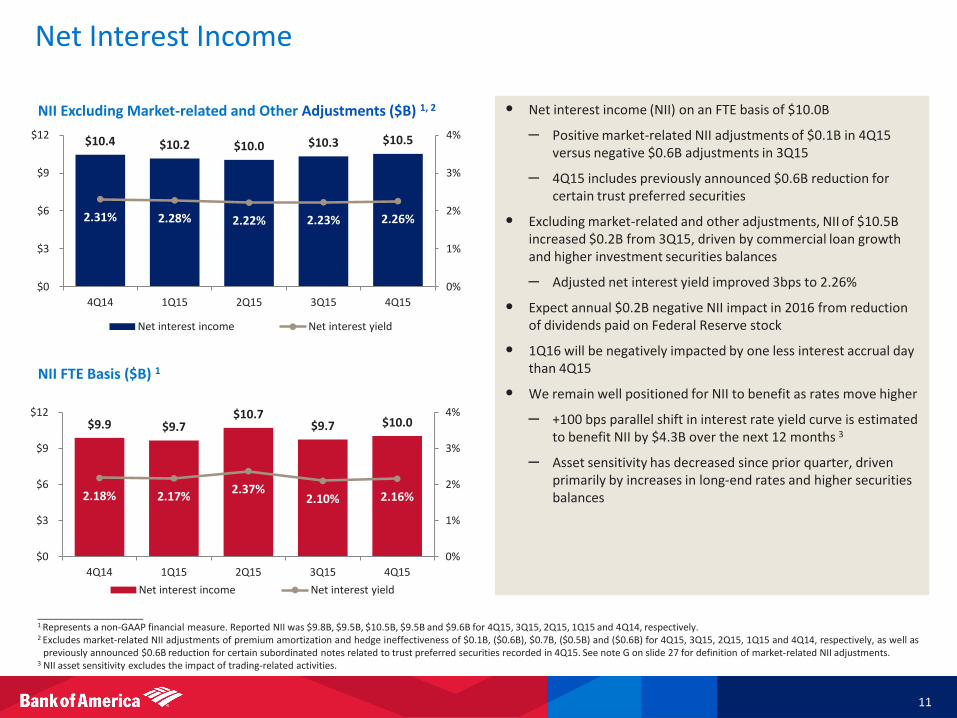
• Net interest income (NII) on an FTE basis of $10.0B
– Positive market-related NII adjustments of $0.1B in 4Q15 versus negative $0.6B adjustments in 3Q15
– 4Q15 includes previously announced $0.6B reduction for certain trust preferred securities
• Excluding market-related and other adjustments, NII of $10.5B increased $0.2B from 3Q15, driven by commercial loan growth and higher investment securities balances
– Adjusted net interest yield improved 3bps to 2.26%
• Expect annual $0.2B negative NII impact in 2016 from reduction of dividends paid on Federal Reserve stock
• 1Q16 will be negatively impacted by one less interest accrual day than 4Q15
• We remain well positioned for NII to benefit as rates move higher
– +100 bps parallel shift in interest rate yield curve is estimated to benefit NII by $4.3B over the next 12 months 3
– Asset sensitivity has decreased since prior quarter, driven primarily by increases in long-end rates and higher securities balances
____________________ 1 Represents a non-GAAP financial measure. Reported NII was $9.8B, $9.5B, $10.5B, $9.5B and $9.6B for 4Q15, 3Q15, 2Q15, 1Q15 and 4Q14, respectively. 2 Excludes market-related NII adjustments of premium amortization and hedge ineffectiveness of $0.1B, ($0.6B), $0.7B, ($0.5B) and ($0.6B) for 4Q15, 3Q15, 2Q15, 1Q15 and 4Q14, respectively, as well as
previously announced $0.6B reduction for certain subordinated notes related to trust preferred securities recorded in 4Q15. See note G on slide 27 for definition of market-related NII adjustments. 3 NII asset sensitivity excludes the impact of trading-related activities.
NII FTE Basis ($B) 1
NII Excluding Market-related and Other Adjustments ($B) 1, 2
$9.9 $9.7 $10.7
$9.7 $10.0
2.18% 2.17% 2.37%
2.10% 2.16%
0%
1%
2%
3%
4%
$0
$3
$6
$9
$12
4Q14 1Q15 2Q15 3Q15 4Q15
Net interest income Net interest yield
$10.4 $10.2 $10.0 $10.3 $10.5
2.31% 2.28% 2.22% 2.23% 2.26%
0%
1%
2%
3%
4%
$0
$3
$6
$9
$12
4Q14 1Q15 2Q15 3Q15 4Q15
Net interest income Net interest yield
12.7
12.7
12.6
1.1
0.9
0.8
0.4
0.2
0.4
$14.2
$13.8
$13.9
$0 $5 $10 $15 $20
4Q14
3Q15
4Q15
All other LAS (excl. litigation) Litigation
Expense Highlights
____________________ Note: Amounts may not total due to rounding. 1 Represents a non-GAAP financial measure. Reported LAS noninterest expense was $1.1B, $1.1B and $1.4B for 4Q15, 3Q15 and 4Q14, respectively. 2 Represents a non-GAAP financial measure.
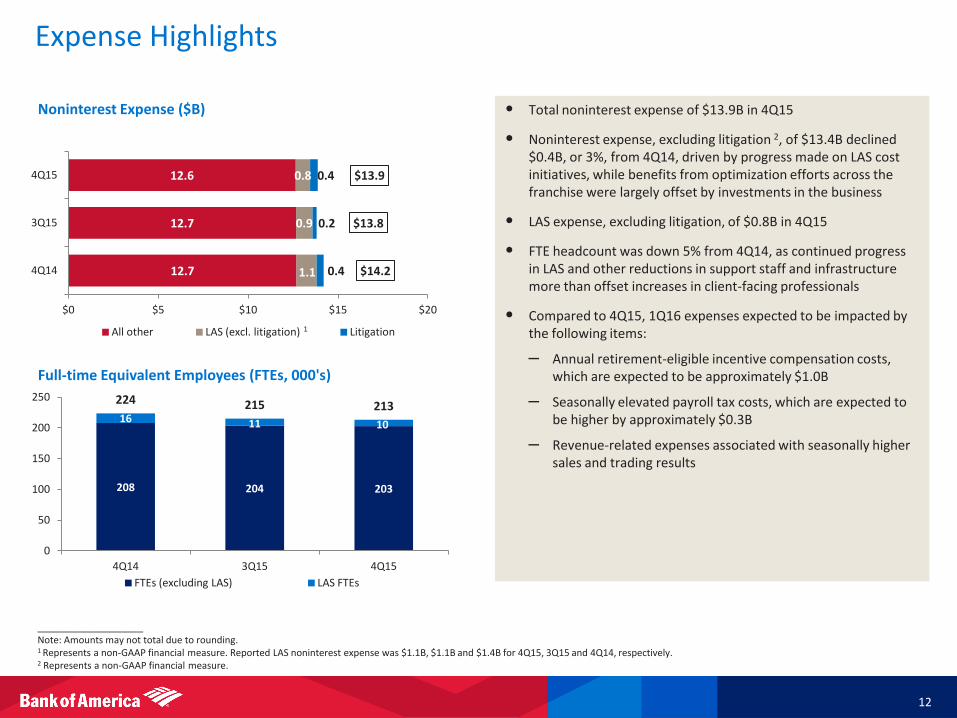
• Total noninterest expense of $13.9B in 4Q15
• Noninterest expense, excluding litigation 2, of $13.4B declined $0.4B, or 3%, from 4Q14, driven by progress made on LAS cost initiatives, while benefits from optimization efforts across the franchise were largely offset by investments in the business
• LAS expense, excluding litigation, of $0.8B in 4Q15
• FTE headcount was down 5% from 4Q14, as continued progress in LAS and other reductions in support staff and infrastructure more than offset increases in client-facing professionals
• Compared to 4Q15, 1Q16 expenses expected to be impacted by the following items:
– Annual retirement-eligible incentive compensation costs, which are expected to be approximately $1.0B
– Seasonally elevated payroll tax costs, which are expected to be higher by approximately $0.3B
– Revenue-related expenses associated with seasonally higher sales and trading results
Noninterest Expense ($B)
Full-time Equivalent Employees (FTEs, 000's)
12
1
208 204 203
16 11 10
224 215 213
0
50
100
150
200
250
4Q14 3Q15 4Q15
FTEs (excluding LAS) LAS FTEs
Consumer Banking
13
____________________ 1 FTE basis. 2 Cost of deposits calculated as annualized noninterest expense within the Deposits subsegment as a percentage of total average deposits within Consumer Banking. 3 Beginning in 1Q15, includes approximately 150,000 Merrill Edge and MyMerrill users. 4 Represents a non-GAAP financial measure. For important presentation information, see slide 29. 5 Includes average U.S. consumer credit card balances in GWIM of $3.0B, $3.0B and $3.2B in 4Q15, 3Q15 and 4Q14, respectively. 6 Represents a non-GAAP financial measure. The risk-adjusted margin in 4Q15, 3Q15 and 4Q14 is shown excluding divestiture gains; including this impact, risk-adjusted margin would have been 9.81%, 9.54% and
9.96%, respectively. 7 Total mortgage production includes first mortgage and home equity originations in Consumer Banking and GWIM. Amounts represent the unpaid principal balance of loans and in the case of home equity, the
principal amount of the total line of credit.
• [ Bullets to come ]
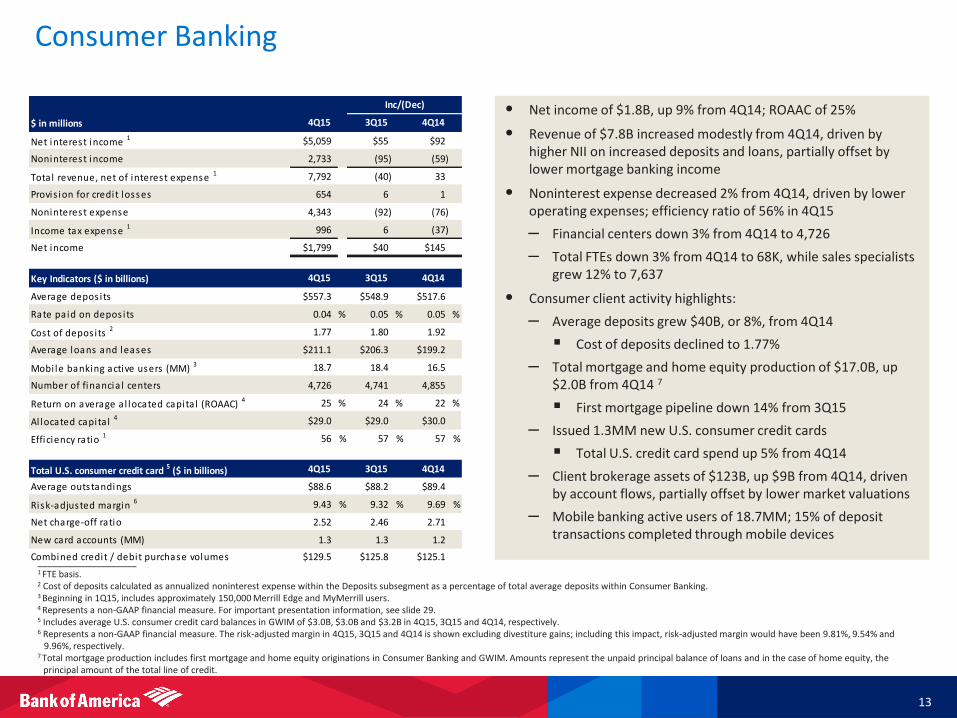
• Net income of $1.8B, up 9% from 4Q14; ROAAC of 25%
• Revenue of $7.8B increased modestly from 4Q14, driven by higher NII on increased deposits and loans, partially offset by lower mortgage banking income
• Noninterest expense decreased 2% from 4Q14, driven by lower operating expenses; efficiency ratio of 56% in 4Q15
– Financial centers down 3% from 4Q14 to 4,726
– Total FTEs down 3% from 4Q14 to 68K, while sales specialists grew 12% to 7,637
• Consumer client activity highlights:
– Average deposits grew $40B, or 8%, from 4Q14
Cost of deposits declined to 1.77%
– Total mortgage and home equity production of $17.0B, up $2.0B from 4Q14 7
First mortgage pipeline down 14% from 3Q15
– Issued 1.3MM new U.S. consumer credit cards
Total U.S. credit card spend up 5% from 4Q14
– Client brokerage assets of $123B, up $9B from 4Q14, driven by account flows, partially offset by lower market valuations
– Mobile banking active users of 18.7MM; 15% of deposit transactions completed through mobile devices
$ in millions
Net interest income 1 $5,059 $55 $92
Noninterest income 2,733 (95) (59)
Total revenue, net of interest expense 1 7,792 (40) 33
Provis ion for credit losses 654 6 1
Noninterest expense 4,343 (92) (76)
Income tax expense 1 996 6 (37)
Net income $1,799 $40 $145
Key Indicators ($ in billions)
Average depos its $557.3 $548.9 $517.6
Rate paid on depos its 0.04 % 0.05 % 0.05 %
Cost of depos its 2 1.77 1.80 1.92
Average loans and leases $211.1 $206.3 $199.2
Mobi le banking active users (MM) 3 18.7 18.4 16.5
Number of financia l centers 4,726 4,741 4,855
Return on average a l located capita l (ROAAC) 4 25 % 24 % 22 %
Al located capita l 4 $29.0 $29.0 $30.0
Efficiency ratio 1 56 % 57 % 57 %
Total U.S. consumer credit card 5 ($ in billions)
Average outstandings $88.6 $88.2 $89.4
Risk-adjusted margin 6 9.43 % 9.32 % 9.69 %
Net charge-off ratio 2.52 2.46 2.71
New card accounts (MM) 1.3 1.3 1.2
Combined credit / debit purchase volumes $129.5 $125.8 $125.1
4Q15 3Q15 4Q14
Inc/(Dec)
4Q15 3Q15 4Q14
4Q15 3Q15 4Q14

70.5 69.3 68.8 69.2 68.4
6.8 6.9 7.0 7.2 7.6
0
2
4
6
8
10
0
20
40
60
80
4Q14 1Q15 2Q15 3Q15 4Q15
FTEs Sales specialists
Consumer Banking Trends
14
• #1 Retail Deposit Market Share 1
• #3 in U.S. Credit Card Balances 2
• #1 Home Equity Lender (Inside Mortgage Finance ‘15)
• #3 in J.D. Power 2015 U.S. Primary Mortgage Origination Satisfaction Study
• #1 in Online Banking Functionality (Keynote ’15)
• #1 in Mobile Banking (Keynote ’15)
• #2 Small Business Lender (FDIC ‘15)
• #1 in Prime Auto Credit mix among peers 3
1.3 1.2 1.2 1.2 1.3
1.0 1.0 1.0 1.1 1.0
0.2 0.3 0.3 0.2 0.1
0.2 0.2 0.1 0.3 0.2
$2.8 $2.6 $2.6
$2.8 $2.7
$0
$1
$2
$3
4Q14 1Q15 2Q15 3Q15 4Q15 Card income Service charges
Mortgage banking income All other income
11.6 13.7
16.0 13.7 13.5
3.4 3.2
3.2
3.1 3.5 $15.0
$16.9 $19.2
$16.9 $17.0
$0
$7
$14
$21
4Q14 1Q15 2Q15 3Q15 4Q15
Residential mortgage loans Home equity
524 549 547 552 573
202 200 204 209 214 114 118 122 117 123
$840 $868 $874 $878 $910
$0
$250
$500
$750
$1,000
4Q14 1Q15 2Q15 3Q15 4Q15
Deposits Loans and leases Client brokerage assets ____________________ Note: Amounts may not total due to rounding. 1 Source: SNL branch data. U.S. retail deposit market share based on June 2015 FDIC deposit data, adjusted to remove commercial balances. 2 Source: Competitor 3Q15 earnings releases. 3 Largest percentage of 740+ Scorex customers among key competitors as of October 2015. Source: Total Units Experian Autocount Risk Loan Analysis Scorex + (Loans, New & Used, Franchised Dealers). 4 Beginning with new originations in 2014, we retain certain residential mortgages in Consumer Banking, consistent with where the overall relationship is managed; previously such mortgages were retained in All Other. 5 Total mortgage production includes first mortgage and home equity originations in Consumer Banking and GWIM. Amounts represent the unpaid principal balance of loans and in the case of home equity, the principal amount of the
total line of credit.
86 86 84 85 86
38 38 39 41 42
46 45 45 44 43 9 11 14 17 21 20 20 19 19 19
$199 $200 $202 $206 $211
$0
$50
$100
$150
$200
$250
4Q14 1Q15 2Q15 3Q15 4Q15 U.S. consumer credit card Auto and specialty lending Home equity Residential mortgage Other
Leading Consumer Franchise Total Mortgage Production ($B) 5 Average Loans and Leases ($B)
Consumer Client Balances (EOP, $B) Full-Time Equivalent Employees (000’s)
4
Total Noninterest Income ($B)

Global Wealth & Investment Management
15
____________________ 1 FTE basis. 2 Represents a non-GAAP financial measure. For important presentation information, see slide 29. 3 Includes financial advisors in Consumer Banking of 2,191 and 1,950 in 4Q15 and 4Q14.
• Net income of $0.6B, generating a pre-tax margin of 21% and ROAAC of 20%
• Revenue of $4.4B, down 3% from 4Q14
– NII relatively flat as the benefits from loan and deposit growth were mostly offset by the impact of the firm’s allocation of ALM activities
– Noninterest income down due to lower transactional activity and lower market valuations
• Noninterest expense increased from 4Q14, due primarily to higher amortization of previously issued stock awards and investments in client-facing professionals, partially offset by lower revenue-related incentives
• Wealth advisors grew 5% from 4Q14 to 18,167 3
• Client balances of nearly $2.5T, up $60B from 3Q15, driven by market valuations and flows
– Long-term AUM flows of $7B, positive for the 26th consecutive quarter
• Average loans of $136B, up $3B from 3Q15 and $12B, or 10%, versus 4Q14; 23rd consecutive quarter of loan balance growth
• Average deposits of $251B, up $7B from 3Q15 and $12B, or 5% versus 4Q14
$ in millions
Net interest income 1 $1,412 $35 $6
Noninterest income 3,031 (60) (166)
Total revenue, net of interest expense 1 4,443 (25) (160)
Provis ion for credit losses 15 17 1
Noninterest expense 3,478 32 36
Income tax expense 1 336 (32) (106)
Net income $614 ($42) ($91)
Key Indicators ($ in billions)
Average depos its $251.3 $244.0 $238.8
Average loans and leases 135.8 133.2 123.5
Net charge-off ratio 0.06 % 0.05 % 0.12 %
Long-term AUM flows $6.7 $4.4 $9.4
Liquidi ty AUM flows 4.8 (3.2) (0.3)
Pre-tax margin 21 % 23 % 25 %
Return on average a l located capita l 2 20 22 23
Al located capita l 2 $12.0 $12.0 $12.0
Inc/(Dec)
4Q15 3Q15 4Q14
4Q15 3Q15 4Q14

Global Wealth & Investment Management Trends
16
Market Share Positioning Average Loans and Leases ($B) Total Client-Facing Professionals (000’s) 3
• #1 U.S. wealth management market position across client assets, deposits and loans 1
• #1 in personal trust assets under management 2
• #1 in Barron’s U.S. high net worth client assets (2015)
• #1 in Barron’s Top 1,200 ranked Financial Advisors and Top 100 Women Advisors (2015)
1,221 1,218 1,218 1,136 1,154
903 917 930 877 901
245 244 238 246 261
129 131 136 138 141
$2,498 $2,510 $2,522 $2,396 $2,457
$0
$500
$1,000
$1,500
$2,000
$2,500
$3,000
4Q14 1Q15 2Q15 3Q15 4Q15
Other Assets under management Deposits Loans and leases
Client Balances (EOP, $B) 5
57 58 59 60 61
39 40 42 43 43
25 25 27 28 28 3 3 3 3 3 $124 $126 $130 $133 $136
$0
$50
$100
$150
4Q14 1Q15 2Q15 3Q15 4Q15
Consumer real estate Securities-based lending Structured lending Credit card / Other
____________________ Note: Amounts may not total due to rounding. 1 Source: Competitor 3Q15 earnings releases. 2 Source: Industry 3Q15 call reports.
3 Includes financial advisors in Consumer Banking of 2,191, 2,042, 2,049, 1,992 and 1,950 at 4Q15, 3Q15, 2Q15, 1Q15 and 4Q14, respectively. 4 FTE basis. 5 Other includes brokerage assets and assets in custody. Loans and leases include margin receivables which are classified in customer and other receivables on the Consolidated Balance Sheet.
2.1 2.1 2.1 2.1 2.1
1.1 1.1 1.1 1.0 1.0
1.4 1.4 1.4 1.4 1.4
$4.6 $4.5 $4.6 $4.5 $4.4
$0
$1
$2
$3
$4
$5
4Q14 1Q15 2Q15 3Q15 4Q15
Asset management fees Brokerage / Other Net interest income
Revenue ($B) 4
19.8 20.0 20.3 20.5 20.6
0
5
10
15
20
25
4Q14 1Q15 2Q15 3Q15 4Q15
Financial advisors Other wealth advisors Other
4

Global Banking
17
____________________ 1 FTE basis. 2 Global Banking shares with Global Markets in certain deal economics from investment banking and loan origination activities. 3 Represents a non-GAAP financial measure. For important presentation information, see slide 29. 4 Ranking per Dealogic for the fourth quarter as of January 5, 2016.
• [ Bullets to come ]
• Net income of $1.4B, generating a ROAAC of 16%
• Revenue increased 1% from 4Q14
– NII improved driven by increased loan and deposit balances, partially offset by the impact of the firm’s allocation of ALM activities including liquidity costs, as well as loan spread compression
– Noninterest income increased due to improvements in leasing and treasury services, as well as a small gain on the sale of a foreclosed property, partially offset by lower investment banking fees
• Total Corporation investment banking fees of $1.3B (excl. self-led) declined 17% from 4Q14, driven by lower leveraged finance and equity issuance, partially offset by higher advisory fees
– Ranked #3 globally in IB fees in 4Q15 4
– 2nd highest quarter in advisory fees since merger
• Provision increased from 4Q14, driven by energy-related charge-offs, as well as reserve builds for loan growth and energy exposure
• Noninterest expense decreased 2% versus 4Q14, reflecting lower litigation and incentive costs, partially offset by investments in client-facing professionals
• Average loans and leases increased 3% from 3Q15 and 12% from 4Q14, driven by growth in C&I, commercial real estate and leasing
• Average deposits grew 5% from 4Q14
$ in millions
Net interest income 1 $2,435 $89 $20
Noninterest income 2 1,918 74 19
Total revenue, net of interest expense 1, 2
4,353 163 39
Provis ion for credit losses 233 54 264
Noninterest expense 1,938 (80) (31)
Income tax expense 1
804 88 (52)
Net income $1,378 $101 ($142)
Key Indicators ($ in billions)
Average depos its $307.8 $296.3 $292.1
Average loans and leases 320.3 310.0 287.0
Net charge-off ratio 0.17 % 0.07 % 0.00 %
Total corporation IB fees (excl . sel f-led) 2 $1.27 $1.29 $1.54
Global Banking IB fees 2
0.73 0.75 0.83
Bus iness Lending revenue 2.03 1.89 1.88
Global Transaction Services revenue 1.59 1.57 1.63
Return on average a l located capita l 3 16 % 14 % 18 %
Al located capita l 3 $35.0 $35.0 $33.5
Efficiency ratio 1
44 % 48 % 46 %
Inc/(Dec)
3Q15 4Q144Q15
4Q15 3Q15 4Q14

Global Banking Trends
18
____________________ Note: Amounts may not total due to rounding. 1 Ranking per Dealogic for the fourth quarter as of January 5, 2016. 2 Global Banking shares with Global Markets in certain deal economics from investment banking and loan origination activities. 3 FTE basis. 4 Advisory includes fees on debt and equity advisory and mergers and acquisitions.
76% 77% 77% 78% 78%
24% 23% 23% 22% 22%
$292 $286 $288 $296 $308
$0
$50
$100
$150
$200
$250
$300
$350
4Q14 1Q15 2Q15 3Q15 4Q15
Noninterest-bearing Interest-bearing
883 781 887 748 617
348 345
417
188 286
340 428 276
391 408
(30) (67) (54) (40) (39)
$1,541 $1,487 $1,526
$1,287 $1,272
4Q14 1Q15 2Q15 3Q15 4Q15
Debt Equity Advisory Self-led deals
Total Corporation IB Fees ($MM) 2
• #3 in Global IB Fees 1 – Top 3 ranking by volumes in high-yield corporate
debt, leveraged loans, mortgage-backed securities, convertible debt, syndicated loans, debt and equity capital markets
• Best Global Transaction Services and Global Loan House (Euromoney ’15)
• Most Innovative Investment Bank from North America (The Banker ’15)
• Best Bank for Cash Management in North America for the 6th consecutive year (Global Finance Magazine ‘16)
• Relationships with 81% of the Global Fortune 500; 96% of the U.S. Fortune 1,000 (2015)
2.4 2.3 2.2 2.3 2.4
0.8 0.9 0.8 0.8 0.7
0.7 0.7 0.7 0.7 0.7
0.4 0.4 0.4 0.3 0.5
$4.3 $4.3 $4.1 $4.2 $4.4
$0
$1
$2
$3
$4
$5
4Q14 1Q15 2Q15 3Q15 4Q15
Net interest income IB fees Service charges All other income
Revenue ($B) 2, 3
4
Avg. Deposits ($B) Business Leadership Avg. Loans and Leases ($B)
141 142 147 150 157
130 131 137 143 146
16 16 17 17 17 $287 $290 $301 $310 $320
$0
$50
$100
$150
$200
$250
$300
$350
4Q14 1Q15 2Q15 3Q15 4Q15
Commercial Corporate Business Banking
3
Global Markets 1
19
• [ Bullets to come ]
____________________ n/m = not meaningful 1 2015 results include early adoption of new accounting guidance on the recognition and measurement of financial instruments. See note A on slide 27. 2 FTE basis. 3 In addition to sales and trading revenue, Global Markets shares with Global Banking in certain deal economics from investment banking and loan origination activities. 4 Represents a non-GAAP financial measure; see note E on slide 27. 5 Represents a non-GAAP financial measure. For important presentation information, see slide 29.
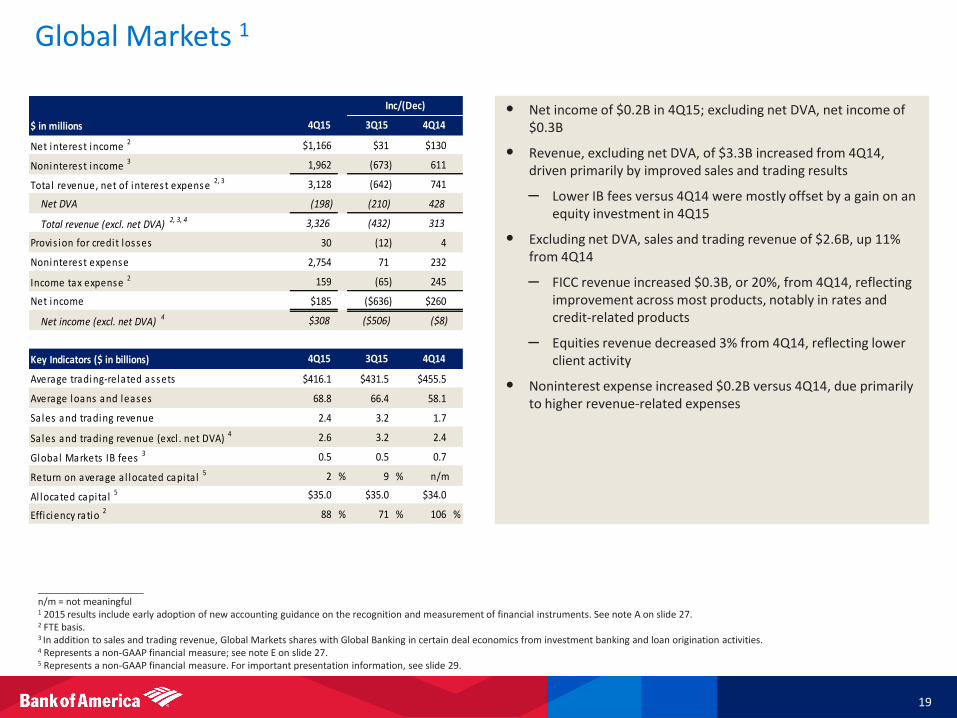
• Net income of $0.2B in 4Q15; excluding net DVA, net income of $0.3B
• Revenue, excluding net DVA, of $3.3B increased from 4Q14, driven primarily by improved sales and trading results
– Lower IB fees versus 4Q14 were mostly offset by a gain on an equity investment in 4Q15
• Excluding net DVA, sales and trading revenue of $2.6B, up 11% from 4Q14
– FICC revenue increased $0.3B, or 20%, from 4Q14, reflecting improvement across most products, notably in rates and credit-related products
– Equities revenue decreased 3% from 4Q14, reflecting lower client activity
• Noninterest expense increased $0.2B versus 4Q14, due primarily to higher revenue-related expenses
$ in millions
Net interest income 2 $1,166 $31 $130
Noninterest income 3 1,962 (673) 611
Total revenue, net of interest expense 2, 3 3,128 (642) 741
Net DVA (198) (210) 428
Total revenue (excl. net DVA) 2, 3, 4 3,326 (432) 313
Provis ion for credit losses 30 (12) 4
Noninterest expense 2,754 71 232
Income tax expense 2 159 (65) 245
Net income $185 ($636) $260
Net income (excl. net DVA) 4 $308 ($506) ($8)
Key Indicators ($ in billions)
Average trading-related assets $416.1 $431.5 $455.5
Average loans and leases 68.8 66.4 58.1
Sales and trading revenue 2.4 3.2 1.7
Sales and trading revenue (excl . net DVA) 4 2.6 3.2 2.4
Global Markets IB fees 3 0.5 0.5 0.7
Return on average a l located capita l 5 2 % 9 % n/m
Al located capita l 5 $35.0 $35.0 $34.0
Efficiency ratio 2 88 % 71 % 106 %
Inc/(Dec)
4Q15 3Q15 4Q14
4Q15 3Q15 4Q14

Global Markets Trends and Revenue Mix
20
1.5
2.8 2.2 2.0 1.8
0.9
1.1 1.2 1.2
0.9
$2.4
$3.9 $3.3 $3.2
$2.6
$0
$1
$2
$3
$4
$5
4Q14 1Q15 2Q15 3Q15 4Q15
FICC Equities
$456 $444 $443 $431 $416
$51 $62
$55 $51 $44
$0
$25
$50
$75
$100
$0
$100
$200
$300
$400
$500
4Q14 1Q15 2Q15 3Q15 4Q15
Avg. trading-related assets Avg. VaR
• #1 Global Research Firm for 5th consecutive year (Institutional Investor ’15)
• #1 All-America Research Team (Institutional Investor ’15)
• #1 in Global Equities trading commissions in 2015 (Greenwich Associates)
• Americas Derivatives House of the Year (Global Capital)
• 2015 Greenwich Quality Leader in Overall U.S. Fixed-Income Sales and Overall U.S. Fixed-Income Trading
• #2 U.S. Business Done for Fixed Income & FX 1
____________________ Note: Amounts may not total due to rounding. 1 Source: Orion. Released in December 2015 for the 12 months ended 2Q15. 2 Represents a non-GAAP financial measure. Reported sales & trading revenue was $2.4B, $3.2B, $3.1B, $3.5B and $1.7B for 4Q15, 3Q15, 2Q15, 1Q15 and 4Q14, respectively. Reported FICC sales & trading revenue was $1.6B, $2.0B, $2.0B,
$2.4B and $0.9B for 4Q15, 3Q15, 2Q15, 1Q15 and 4Q14, respectively. Reported equities sales & trading revenue was $0.9B, $1.1B, $1.2B, $1.1B and $0.9B for 4Q15, 3Q15, 2Q15, 1Q15 and 4Q14, respectively. See note E on slide 27. 3 Macro includes G10 FX, rates and commodities products. 4 See note D on slide 27 for definition of VaR.
59%
41%
Credit / other Macro
58%
42%
U.S. / Canada International
Sales & Trading Revenue (excl. net DVA) 2 ($B) Avg. Trading-related Assets ($B) and VaR ($MM) 4
Business Leadership 2015 Total FICC S&T Revenue Mix
(excl. net DVA) 2
2015 Global Markets Revenue Mix (excl. net DVA) 2
3

Legacy Assets & Servicing
21
• Net loss of $0.4B in 4Q15
• Total revenue declined from 4Q14, driven by a decrease in NII on lower loan balances, as well as a modest decline in noninterest income
– Mortgage banking income relatively stable from 4Q14 as lower servicing fees and MSR net of hedge results were offset by lower representations and warranties provision
• Provision benefit declined $0.1B from 4Q14, driven primarily by a slower pace of portfolio improvement
• Litigation expense increased from 4Q14
• LAS expenses, excluding litigation, of $0.8B in 4Q15
– 60+ days delinquent first mortgage loans serviced down 46% from 4Q14 to 103K units in 4Q15
– LAS employees declined 35% from 4Q14
____________________ 1 FTE basis. 2 Represents a non-GAAP financial measure. 3 Serviced by LAS employees. 4 Includes first mortgage and home equity. 5 Includes other FTEs supporting LAS (contractors).
$ in millions
Net interest income 1 $347 ($35) ($43)
Noninterest income 241 (217) (7)
Total revenue, net of interest expense 1 588 (252) (50)
Provis ion for credit losses (10) (16) 103
Noninterest expense 1,148 6 (212)
Litigation expense 353 125 97
Noninterest expense, excluding litigation 2 795 (119) (309)
Income tax expense (benefi t) 1 (199) (87) 31
Net income (loss ) ($351) ($155) $28
Key Indicators ($ in billions)
Average loans and leases $27.2 $29.1 $33.8
MSR (EOP) 2.7 2.7 3.3
Capita l i zed MSR (bps) 71 69 69
Loans serviced for investors (EOP) 378 391 474
Total LAS mortgage banking income 0.3 0.3 0.2
4Q15 4Q14
Inc/(Dec)
4Q15 3Q15 4Q14
3Q15
189
153 132
114 103
0
50
100
150
200
4Q14 1Q15 2Q15 3Q15 4Q15
LAS Employees 5
17.1K 15.5K 13.7K 12.3K 11.2K
$461 $430 $392
$345 $353
5,272 5,120 4,701 4,481 4,351
0
2,000
4,000
6,000
8,000
10,000
$0
$200
$400
$600
4Q14 1Q15 2Q15 3Q15 4Q15
Servicing fees Total servicing portfolio
Servicing Fees ($MM) and Servicing Portfolio (units in 000’s) 3 60+ Days Delinquent First Mortgage Loans (units in 000’s) 3
4

• Net loss of $0.3B in 4Q15
• 4Q15 NII impacted by reduction for certain trust preferred securities, as well as positive market-related adjustments on debt securities
• Noninterest income improved from 4Q14, driven primarily by the absence of a provision for U.K. payment protection insurance as well as higher gains on sale of debt securities
• Provision benefit of $112MM declined from 4Q14, driven by lower recoveries, including those on the sale of nonperforming loans
• Noninterest expense declined $0.3B from 4Q14, due primarily to lower personnel and litigation costs, partially offset by higher professional fees
• 4Q15 income tax includes the $0.3B negative impact from U.K. tax law changes
____________________ 1 All Other consists of ALM activities, equity investments, the international consumer card business, liquidating businesses, residual expense allocations and other. ALM activities encompass certain
residential mortgages, debt securities, interest rate and foreign currency risk management activities including the residual net interest income allocation, the impact of certain allocation methodologies and accounting hedge ineffectiveness. Beginning with new originations in 2014, we retain certain residential mortgages in Consumer Banking, consistent with where the overall relationship is managed; previously such mortgages were in All Other. Additionally, certain residential mortgage loans that are managed by LAS are held in All Other. The results of certain ALM activities are allocated to our business segments. Equity investments include our merchant services joint venture as well as Global Principal Investments (GPI) which is comprised of a portfolio of equity, real estate and other alternative investments.
2 FTE basis. 3 In the U.K., we previously sold payment protection insurance through our international card services business to credit card and consumer loan customers.
22
All Other 1
$ in millions
Net interest income 2 ($387) $115 ($38)
Noninterest income (158) (172) 239
Total revenue, net of interest expense 2 (545) (57) 201
Provis ion for credit losses (112) (45) 218
Noninterest expense 210 126 (274)
Income (loss ) before income taxes 2 (643) (138) 257
Income tax expense (benefi t) 2 (354) 155 171
Net income (loss ) ($289) ($293) $86
Selected Revenue Items ($ in millions)
Equity investment income (loss ) $34 ($46) ($38)
Gains on sa les of debt securi ties 269 385 161
U.K. payment protection insurance provis ion 3 - (303) (139)
Key Indicators ($ in billions)
Average loans and leases $128.5 $137.8 $183.1
Book va lue of Global Principal Investments 0.5 0.5 0.9
Total BAC equity investment exposure 11.5 10.8 11.7
Inc/(Dec)
3Q15 4Q14
4Q15 3Q15 4Q14
4Q15
4Q15 3Q15 4Q14
Key Takeaways
23
• Full year net income of $15.9B reflects improved earnings results
• Solid deposit and loan growth driven by good customer activity
• Growth in net interest income
• Managing costs while continuing to invest in the business
• Asset quality remains strong
• Strong capital and liquidity levels
• Focused on responsible growth

Appendix
____________________
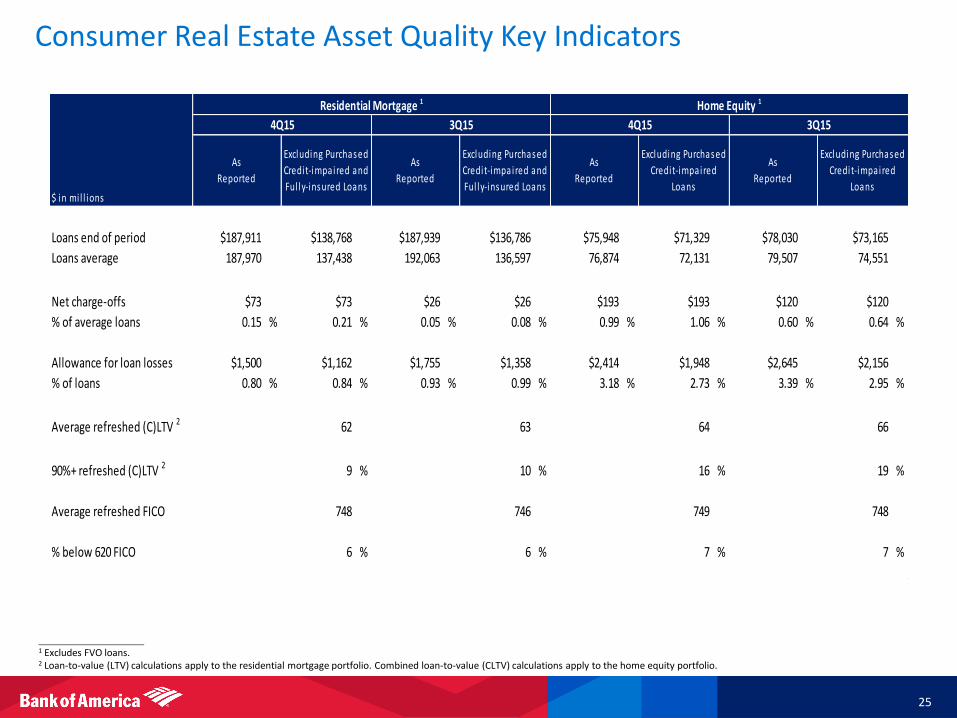
1 Excludes FVO loans. 2 Loan-to-value (LTV) calculations apply to the residential mortgage portfolio. Combined loan-to-value (CLTV) calculations apply to the home equity portfolio.
Consumer Real Estate Asset Quality Key Indicators
25
Loans end of period $187,911 $138,768 $187,939 $136,786 $75,948 $71,329 $78,030 $73,165
Loans average 187,970 137,438 192,063 136,597 76,874 72,131 79,507 74,551
Net charge-offs $73 $73 $26 $26 $193 $193 $120 $120
% of average loans 0.15 % 0.21 % 0.05 % 0.08 % 0.99 % 1.06 % 0.60 % 0.64 %
Allowance for loan losses $1,500 $1,162 $1,755 $1,358 $2,414 $1,948 $2,645 $2,156
% of loans 0.80 % 0.84 % 0.93 % 0.99 % 3.18 % 2.73 % 3.39 % 2.95 %
Average refreshed (C)LTV 2 62 63 64 66
90%+ refreshed (C)LTV 2 9 % 10 % 16 % 19 %
Average refreshed FICO 748 746 749 748
% below 620 FICO 6 % 6 % 7 % 7 %
$ in mi l l ions
Residential Mortgage 1 Home Equity 1
4Q15 3Q15 4Q15 3Q15
As
Reported
Excluding Purchased
Credit-impaired and
Ful ly-insured Loans
As
Reported
Excluding Purchased
Credit-impaired and
Ful ly-insured Loans
As
Reported
Excluding Purchased
Credit-impaired
Loans
As
Reported
Excluding Purchased
Credit-impaired
Loans
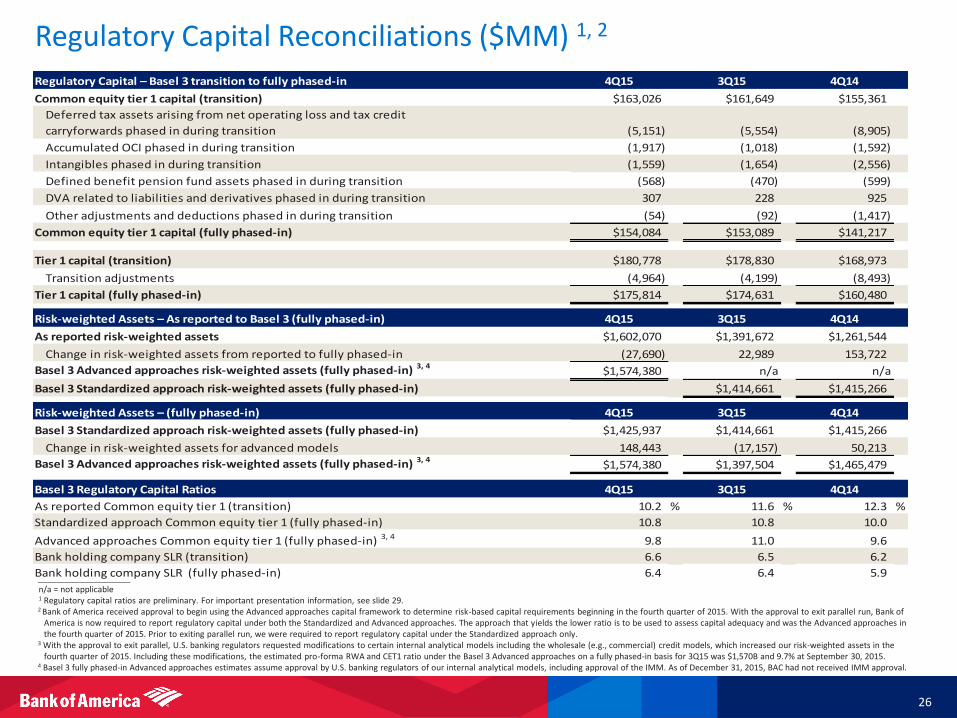
Regulatory Capital – Basel 3 transition to fully phased-in 4Q15 3Q15 4Q14
Common equity tier 1 capital (transition) $163,026 $161,649 $155,361
Deferred tax assets arising from net operating loss and tax credit
carryforwards phased in during transition (5,151) (5,554) (8,905)
Accumulated OCI phased in during transition (1,917) (1,018) (1,592)
Intangibles phased in during transition (1,559) (1,654) (2,556)
Defined benefit pension fund assets phased in during transition (568) (470) (599)
DVA related to liabilities and derivatives phased in during transition 307 228 925
Other adjustments and deductions phased in during transition (54) (92) (1,417)
Common equity tier 1 capital (fully phased-in) $154,084 $153,089 $141,217
Tier 1 capital (transition) $180,778 $178,830 $168,973
Transition adjustments (4,964) (4,199) (8,493)
Tier 1 capital (fully phased-in) $175,814 $174,631 $160,480
Risk-weighted Assets – As reported to Basel 3 (fully phased-in) 4Q15 3Q15 4Q14
As reported risk-weighted assets $1,602,070 $1,391,672 $1,261,544
Change in risk-weighted assets from reported to fully phased-in (27,690) 22,989 153,722
Basel 3 Advanced approaches risk-weighted assets (fully phased-in) 3, 4$1,574,380 n/a n/a
Basel 3 Standardized approach risk-weighted assets (fully phased-in) $1,414,661 $1,415,266
Risk-weighted Assets – (fully phased-in) 4Q15 3Q15 4Q14
Basel 3 Standardized approach risk-weighted assets (fully phased-in) $1,425,937 $1,414,661 $1,415,266
Change in risk-weighted assets for advanced models 148,443 (17,157) 50,213
Basel 3 Advanced approaches risk-weighted assets (fully phased-in) 3, 4$1,574,380 $1,397,504 $1,465,479
Basel 3 Regulatory Capital Ratios 4Q15 3Q15 4Q14
As reported Common equity tier 1 (transition) 10.2 % 11.6 % 12.3 %
Standardized approach Common equity tier 1 (fully phased-in) 10.8 10.8 10.0
Advanced approaches Common equity tier 1 (fully phased-in) 3, 4 9.8 11.0 9.6
Bank holding company SLR (transition) 6.6 6.5 6.2
Bank holding company SLR (fully phased-in) 6.4 6.4 5.9
26
Regulatory Capital Reconciliations ($MM) 1, 2
____________________ n/a = not applicable 1 Regulatory capital ratios are preliminary. For important presentation information, see slide 29. 2 Bank of America received approval to begin using the Advanced approaches capital framework to determine risk-based capital requirements beginning in the fourth quarter of 2015. With the approval to exit parallel run, Bank of
America is now required to report regulatory capital under both the Standardized and Advanced approaches. The approach that yields the lower ratio is to be used to assess capital adequacy and was the Advanced approaches in the fourth quarter of 2015. Prior to exiting parallel run, we were required to report regulatory capital under the Standardized approach only.
3 With the approval to exit parallel, U.S. banking regulators requested modifications to certain internal analytical models including the wholesale (e.g., commercial) credit models, which increased our risk-weighted assets in the fourth quarter of 2015. Including these modifications, the estimated pro-forma RWA and CET1 ratio under the Basel 3 Advanced approaches on a fully phased-in basis for 3Q15 was $1,570B and 9.7% at September 30, 2015.
4 Basel 3 fully phased-in Advanced approaches estimates assume approval by U.S. banking regulators of our internal analytical models, including approval of the IMM. As of December 31, 2015, BAC had not received IMM approval.
Notes
27
A In January 2016, the FASB issued new accounting guidance on recognition and measurement of financial instruments. The Corporation has early adopted, retrospective to January 1, 2015, the provision that requires the Corporation to present unrealized gains/losses resulting from changes in the Corporation's own credit spreads on liabilities accounted for under the fair value option (referred to as debit valuation adjustments, or DVA) in accumulated OCI. The impact of the adoption was to reclassify, as of January 1, 2015, unrealized DVA losses of $2.0B pretax ($1.2B after tax) from January 1, 2015 retained earnings to accumulated OCI. Further, pre-tax unrealized DVA gains of $301MM, $301MM and $420MM were reclassified from other income to accumulated OCI for 3Q15, 2Q15 and 1Q15, respectively. This had the effect of reducing net income as previously reported for the aforementioned quarters by $187MM, $186MM and $260MM, or approximately $0.02 per quarter. This change is reflected in consolidated results and the Global Markets segment results. Results for 2014 were not subject to restatement under the provisions of the new accounting guidance.
B Global Excess Liquidity Sources include cash and high-quality, liquid, unencumbered securities, limited to U.S. government securities, U.S. agency securities, U.S. agency MBS, and a select group of non-U.S. government and supranational securities, and are readily available to meet funding requirements as they arise. It does not include Federal Reserve Discount Window or Federal Home Loan Bank borrowing capacity. Transfers of liquidity from the bank or other regulated entities are subject to certain regulatory restrictions.
C Time to Required Funding (TTF) is a debt coverage measure and is expressed as the number of months unsecured holding company obligations of Bank of America Corporation can be met using only the BAC parent company’s Global Excess Liquidity Sources without issuing debt or sourcing additional liquidity. We define unsecured contractual obligations for purposes of this metric as maturities of senior or subordinated debt issued or guaranteed by Bank of America Corporation. For all periods shown, we have included in the amount of unsecured contractual obligations the liability, including estimated costs, for the previously announced BNY Mellon private-label securitization settlement. As of 4Q15, this amount was $8.5B.
D VaR model uses historical simulation approach based on three years of historical data and an expected shortfall methodology equivalent to a 99% confidence level. Using a 95% confidence level, average VaR was $22MM, $24MM, $23MM, $30MM, $24MM, $39MM and $48MM for 4Q15, 3Q15, 2Q15, 1Q15, 4Q14, 4Q13 and 4Q12, respectively.
E Revenue for all periods included net DVA on derivatives, as well as amortization of own credit portion of purchase discount and realized DVA on structured liabilities; periods prior to 2015 also included unrealized DVA on structured liabilities. In 4Q14, a funding valuation adjustment (FVA) on uncollateralized derivative transactions was implemented, and a transitional charge of $497MM related to the adoption was recorded and included in net DVA. Net DVA gains (losses) were ($198MM), $12MM, ($199MM), ($401MM) and ($626MM) for 4Q15, 3Q15, 2Q15, 1Q15 and 4Q14, respectively. Net DVA gains (losses) included in FICC revenue were ($190MM), $18MM, ($199MM), ($392MM) and ($577MM) for 4Q15, 3Q15, 2Q15, 1Q15 and 4Q14 and ($763MM), ($308MM), ($1.1B) and ($6.4B) for 2015, 2014, 2013 and 2012, respectively. Net DVA gains (losses) included in equities revenue were ($8MM), ($6MM), $0, ($9MM) and ($49MM) for 4Q15, 3Q15, 2Q15, 1Q15 and 4Q14 and ($23MM), $68MM, ($43MM) and ($1.2B) for 2015, 2014, 2013 and 2012, respectively. All amounts for 2015 reflect the adoption of the new accounting guidance as mentioned in note A above.
F The numerator of the SLR is quarter-end Basel 3 Tier 1 capital. The denominator is total leverage exposure based on the daily average of the sum of on-balance sheet exposures less permitted Tier 1 deductions, as well as the simple average of certain off-balance sheet exposures, as of the end of each month in a quarter. Off-balance sheet exposures primarily include undrawn lending commitments, letters of credit, potential future derivative exposures and repo-style transactions. Differences between fully phased-in and transitional supplementary leverage exposures are immaterial.
G Market-related NII adjustments include retrospective changes to debt security premium or discount amortization resulting from changes in estimated prepayments, due primarily to changes in interest rates, and hedge ineffectiveness. Amortization of premiums and accretion of discounts are included in interest income. When a change is made to the estimated lives of the securities, primarily as a result of changes in interest rates, the related premium or discount is adjusted, with a corresponding charge or benefit to interest income, to the appropriate amount had the current estimated lives been applied since the purchase of the securities. For more information, see Note 1 – Summary of Significant Accounting Principles to the Consolidated Financial Statements of the Corporation’s 2014 Annual Report on Form 10-K.

Forward-Looking Statements
28
Bank of America and its management may make certain statements that constitute “forward-looking statements” within the meaning of the Private Securities Litigation Reform Act of 1995. These statements can be identified by the fact that they do not relate strictly to historical or current facts. Forward-looking statements often use words such as “anticipates,” “targets,” “expects,” “hopes,” “estimates,” “intends,” “plans,” “goals,” “believes,” “continue” and other similar expressions or future or conditional verbs such as “will,” “may,” “might,” “should,” “would” and “could.” Forward-looking statements represent Bank of America's current expectations, plans or forecasts of its future results and revenues, and future business and economic conditions more generally, and other future matters. These statements are not guarantees of future results or performance and involve certain known and unknown risks, uncertainties and assumptions that are difficult to predict and are often beyond Bank of America's control. Actual outcomes and results may differ materially from those expressed in, or implied by, any of these forward-looking statements. You should not place undue reliance on any forward-looking statement and should consider the following uncertainties and risks, as well as the risks and uncertainties more fully discussed under Item 1A. Risk Factors of Bank of America's 2014 Annual Report on Form 10-K, and in any of Bank of America's subsequent Securities and Exchange Commission filings: the Company's ability to resolve representations and warranties repurchase and related claims, including claims brought by investors or trustees seeking to distinguish certain aspects of the ACE Securities Corp. v. DB Structured Products, Inc. (ACE) ruling or to assert other claims seeking to avoid the impact of the ACE ruling; the possibility that the Company could face related servicing, securities, fraud, indemnity, contribution or other claims from one or more counterparties, including trustees, purchasers of loans, underwriters, issuers, other parties involved in securitizations, monolines or private-label and other investors; the possibility that future representations and warranties losses may occur in excess of the Company's recorded liability and estimated range of possible loss for its representations and warranties exposures; the possibility that the Company may not collect mortgage insurance claims; potential claims, damages, penalties, fines and reputational damage resulting from pending or future litigation and regulatory proceedings, including the possibility that amounts may be in excess of the Company’s recorded liability and estimated range of possible losses for litigation exposures; the possibility that the European Commission will impose remedial measures in relation to its investigation of the Company's competitive practices; the possible outcome of LIBOR, other reference rate and foreign exchange inquiries and investigations; uncertainties about the financial stability and growth rates of non-U.S. jurisdictions, the risk that those jurisdictions may face difficulties servicing their sovereign debt, and related stresses on financial markets, currencies and trade, and the Company's exposures to such risks, including direct, indirect and operational; the impact of U.S. and global interest rates, currency exchange rates and economic conditions; the impact on the Company's business, financial condition and results of operations of a potential higher interest rate environment; the impact on the Company’s business, financial condition and results of operations from a protracted period of lower energy prices; adverse changes to the Company's credit ratings from the major credit rating agencies; estimates of the fair value of certain of the Company's assets and liabilities; uncertainty regarding the content, timing and impact of regulatory capital and liquidity requirements, including the potential adoption of total loss-absorbing capacity requirements; the potential for payment protection insurance exposure to increase as a result of Financial Conduct Authority actions; the possible impact of Federal Reserve actions on the Company’s capital plans; the impact of implementation and compliance with new and evolving U.S. and international regulations, including but not limited to recovery and resolution planning requirements, the Volcker Rule, and derivatives regulations; a failure in or breach of the Company’s operational or security systems or infrastructure, or those of third parties, including as a result of cyber attacks; and other similar matters. Forward-looking statements speak only as of the date they are made, and Bank of America undertakes no obligation to update any forward-looking statement to reflect the impact of circumstances or events that arise after the date the forward-looking statement was made.

• The information contained herein is preliminary and based on Company data available at the time of the earnings presentation. It speaks only as of the particular date or dates included in the accompanying slides. Bank of America does not undertake an obligation to, and disclaims any duty to, update any of the information provided.
• Certain prior period amounts have been reclassified to conform to current period presentation.
• Certain financial measures contained herein represent non-GAAP financial measures. For more information about the non-GAAP financial measures contained herein, please see the presentation of the most directly comparable financial measures calculated in accordance with GAAP and accompanying reconciliations in the earnings press release for the quarter ended December 31, 2015 and other earnings-related information available through the Bank of America Investor Relations web site at: http://investor.bankofamerica.com.
• The Company views net interest income and related ratios and analyses on a fully taxable-equivalent (FTE) basis, which when presented on a consolidated basis, are non-GAAP financial measures. The Company believes managing the business with net interest income on an FTE basis provides a more accurate picture of the interest margin for comparative purposes. The FTE adjustment was $231MM, $231MM, $228MM, $219MM and $230MM for 4Q15, 3Q15, 2Q15, 1Q15 and 4Q14, respectively.
• The Company’s fully phased-in Basel 3 estimates and the supplementary leverage ratio are based on the Standardized and Advanced approaches under Basel 3 and supplementary leverage ratio final rules. Under the Basel 3 Advanced approaches, risk-weighted assets are determined primarily for market risk and credit risk, similar to the Standardized approach, but also incorporate operational risk and a credit valuation adjustment component. Market risk capital measurements are consistent with the Standardized approach, except for securitization exposures, where the Supervisory Formula Approach is also permitted. Credit risk exposures are measured using internal ratings-based models to determine the applicable risk weight by estimating the probability of default, loss given default and, in certain instances, exposure at default. The internal analytical models primarily rely on internal historical default and loss experience. The calculations under Basel 3 require management to make estimates, assumptions and interpretations, including the probability of future events based on historical experience. Actual results could differ from those estimates and assumptions. Bank of America received approval to begin using the Advanced approaches capital framework to determine risk-based capital requirements beginning in the fourth quarter of 2015. As previously disclosed, with the approval to exit parallel, U.S. banking regulators requested modifications to certain internal analytical models including the wholesale (e.g., commercial) credit models, which increased our risk-weighted assets in the fourth quarter of 2015. These Basel 3 fully phased-in Advanced approaches estimates assume approval by U.S. banking regulators of our internal analytical models, including approval of the internal models methodology (IMM). As of December 31, 2015, BAC had not received IMM approval. Our estimates under the Basel 3 Advanced approaches may be refined over time as a result of further rulemaking or clarification by U.S. banking regulators.
• The Company allocates capital to its business segments using a methodology that considers the effect of regulatory capital requirements in addition to internal risk-based capital models. The Company's internal risk-based capital models use a risk-adjusted methodology incorporating each segment's credit, market, interest rate, business and operational risk components. Allocated capital is reviewed periodically and refinements are made based on multiple considerations that include, but are not limited to, risk-weighted assets measured under Basel 3 Standardized and Advanced approaches, business segment exposures and risk profile and strategic plans. As a result of this process, in the first quarter 2015, the Company adjusted the amount of capital being allocated to its business segments, primarily LAS.
Important Presentation Information
29