Body Weight and Mortality: New Population Based Evidences Body Weight and Mortality: New Population...
33
Body Weight and Body Weight and Mortality: Mortality: New Population Based New Population Based Evidences Evidences Dongfeng Gu, Dongfeng Gu, MD MD Fu Wai Hospital and CVD Institute hinese Academy of Medical Sciences, Beijing, PR Chi National Center of CVD, China
-
Upload
lorena-barton -
Category
Documents
-
view
225 -
download
0
Transcript of Body Weight and Mortality: New Population Based Evidences Body Weight and Mortality: New Population...

Body Weight and Mortality:Body Weight and Mortality: New Population Based New Population Based EvidencesEvidences
Dongfeng Gu, MDDongfeng Gu, MD
Fu Wai Hospital and CVD Institute Chinese Academy of Medical Sciences, Beijing, PR China,
National Center of CVD, China
22
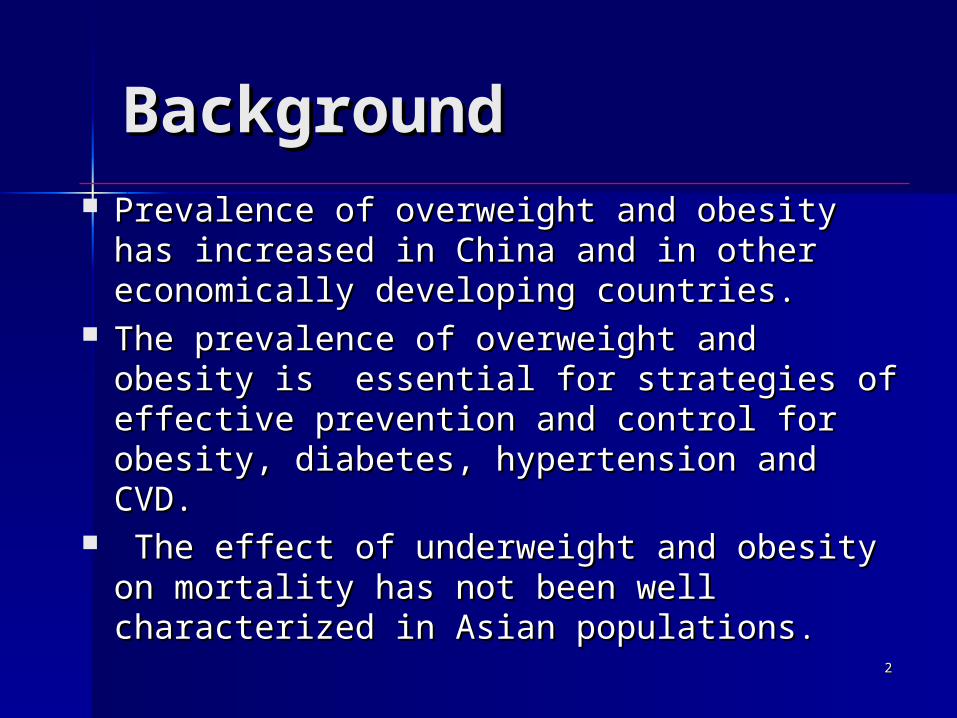
BackgroundBackground Prevalence of overweight and obesity has increased Prevalence of overweight and obesity has increased
in China and in other economically developing in China and in other economically developing countries.countries.
The prevalence of overweight and obesity is The prevalence of overweight and obesity is essential for strategies of effective prevention and essential for strategies of effective prevention and control for obesity, diabetes, hypertension and CVD.control for obesity, diabetes, hypertension and CVD.
The effect of underweight and obesity on mortality The effect of underweight and obesity on mortality has not been well characterized in Asian has not been well characterized in Asian populationspopulations..
33
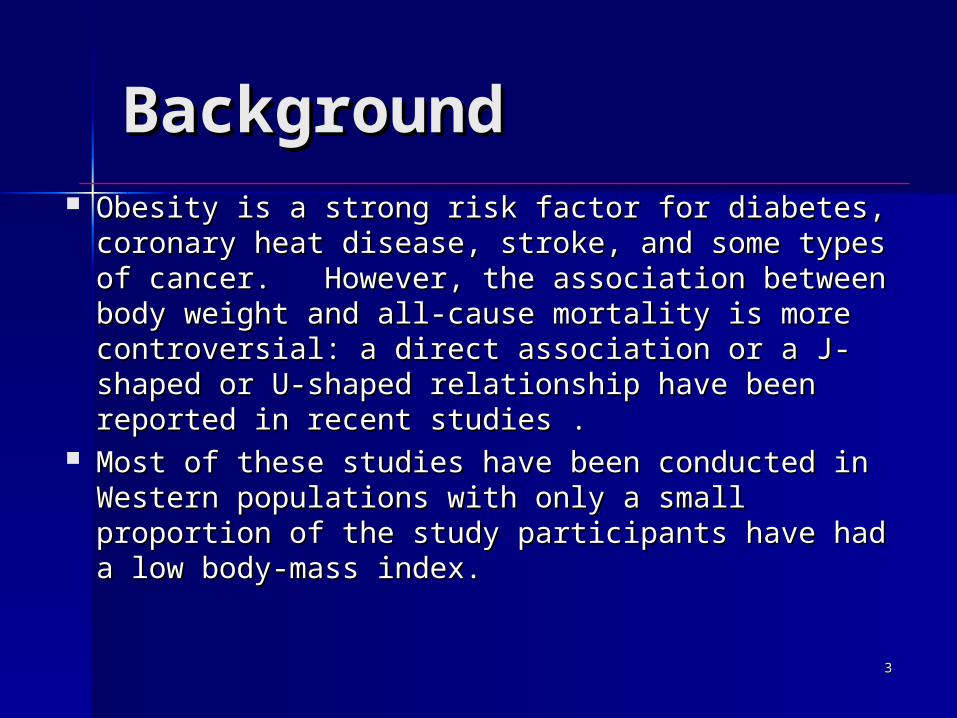
BackgroundBackground Obesity is a strong risk factor for diabetes, coronary heat Obesity is a strong risk factor for diabetes, coronary heat
disease, stroke, and some types of cancer. However, the disease, stroke, and some types of cancer. However, the association between body weight and all-cause mortality association between body weight and all-cause mortality is more controversial: a direct association or a J-shaped or is more controversial: a direct association or a J-shaped or U-shaped relationship have been reported in recent U-shaped relationship have been reported in recent studiesstudies . .
Most of these studies have been conducted in Western Most of these studies have been conducted in Western populations with only a small proportion of the study populations with only a small proportion of the study participants have had a low body-mass indexparticipants have had a low body-mass index..

44
BackgroundBackground Several epidemiological studies have suggested that Several epidemiological studies have suggested that
Asian populations have higher amounts of body fat and Asian populations have higher amounts of body fat and prevalence of cardiovascular disease risk factors at lower prevalence of cardiovascular disease risk factors at lower levels of body-mass index compared to their counterparts levels of body-mass index compared to their counterparts in Western populationsin Western populations..
WHO, IASO, and IOTF have suggested lower BMI WHO, IASO, and IOTF have suggested lower BMI cutoffs for overweight (23.0-24.9 kg/mcutoffs for overweight (23.0-24.9 kg/m22) and for obesity ) and for obesity (≥25.0 kg/m(≥25.0 kg/m22) in Asian populations, labeling these ) in Asian populations, labeling these recommendations as provisional and calling for their recommendations as provisional and calling for their validation in clinical and epidemiologic studies.validation in clinical and epidemiologic studies.
55
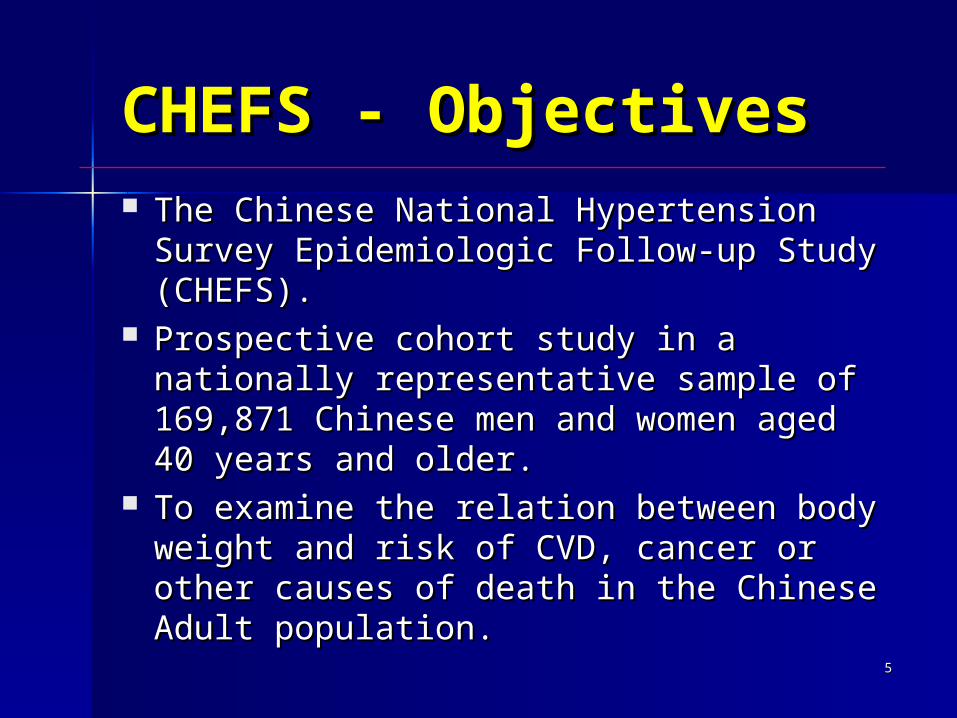
CHEFS - ObjectivesCHEFS - Objectives The Chinese National Hypertension The Chinese National Hypertension
Survey Epidemiologic Follow-up Study Survey Epidemiologic Follow-up Study (CHEFS).(CHEFS).
Prospective cohort study in a nationally Prospective cohort study in a nationally representative sample of 169,871 representative sample of 169,871 Chinese men and women aged 40 years Chinese men and women aged 40 years and older. and older.
To examine the relation between body To examine the relation between body weightweight and risk of CVD, cancer or other and risk of CVD, cancer or other causes of death in the Chinese Adult causes of death in the Chinese Adult population. population.

66
Methods Methods –– Definitions Definitions
Multivariate-adjusted relative risk was calculated Multivariate-adjusted relative risk was calculated using study participants with a body-mass index of using study participants with a body-mass index of 24.0-24.9 kg/m24.0-24.9 kg/m22 as the reference because this group as the reference because this group had the lowest mortality.had the lowest mortality.
Cox proportional hazards models were used to adjust Cox proportional hazards models were used to adjust for baseline age, gender, cigarette smoking, alcohol for baseline age, gender, cigarette smoking, alcohol consumption, physical activity, education, geographic consumption, physical activity, education, geographic region (north vs. south) and urbanization (urban vs. region (north vs. south) and urbanization (urban vs. rural)rural)..
77
ResultsResults
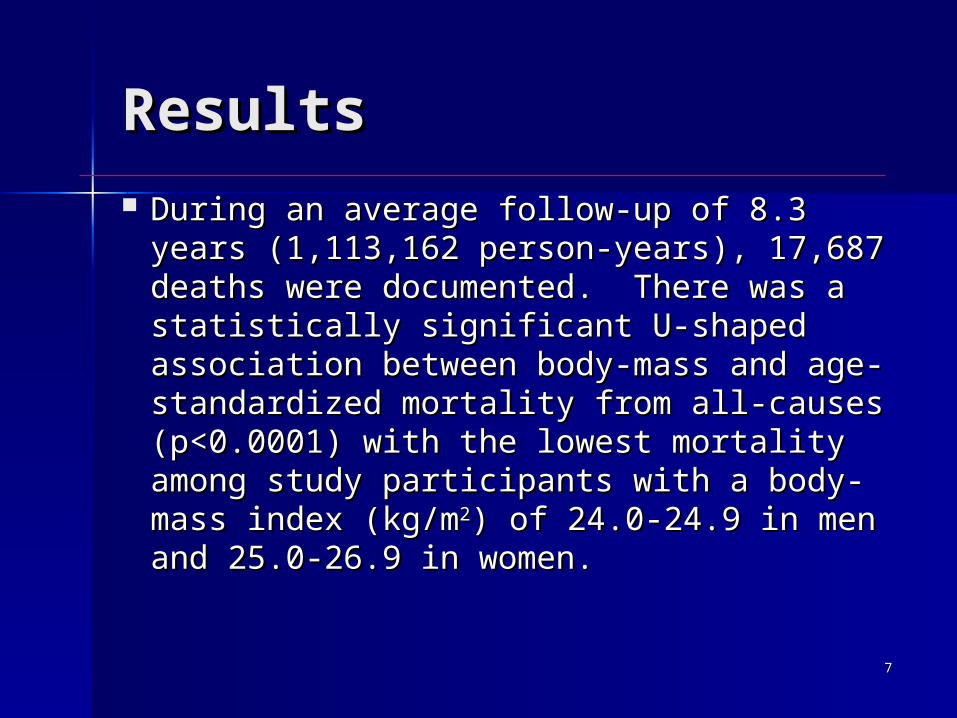
During an average follow-up of 8.3 years During an average follow-up of 8.3 years (1,113,162 person-years), 17,687 deaths were (1,113,162 person-years), 17,687 deaths were documented. There was a statistically documented. There was a statistically significant U-shaped association between significant U-shaped association between body-mass and age-standardized mortality body-mass and age-standardized mortality from all-causes (p<0.0001) with the lowest from all-causes (p<0.0001) with the lowest mortality among study participants with a mortality among study participants with a body-mass index (kg/mbody-mass index (kg/m22) of 24.0-24.9 in men ) of 24.0-24.9 in men and 25.0-26.9 in women.and 25.0-26.9 in women.
88

99

1010
0.0
0.5
1.0
1.5
2.0
2.5
Body Mass Index, kg/m2
Rel
ativ
e R
isk
Age <65 Years (7621 deaths)
1111
0.0
0.5
1.0
1.5
2.0
2.5
Body Mass Index, kg/m2
Rel
ativ
e R
isk
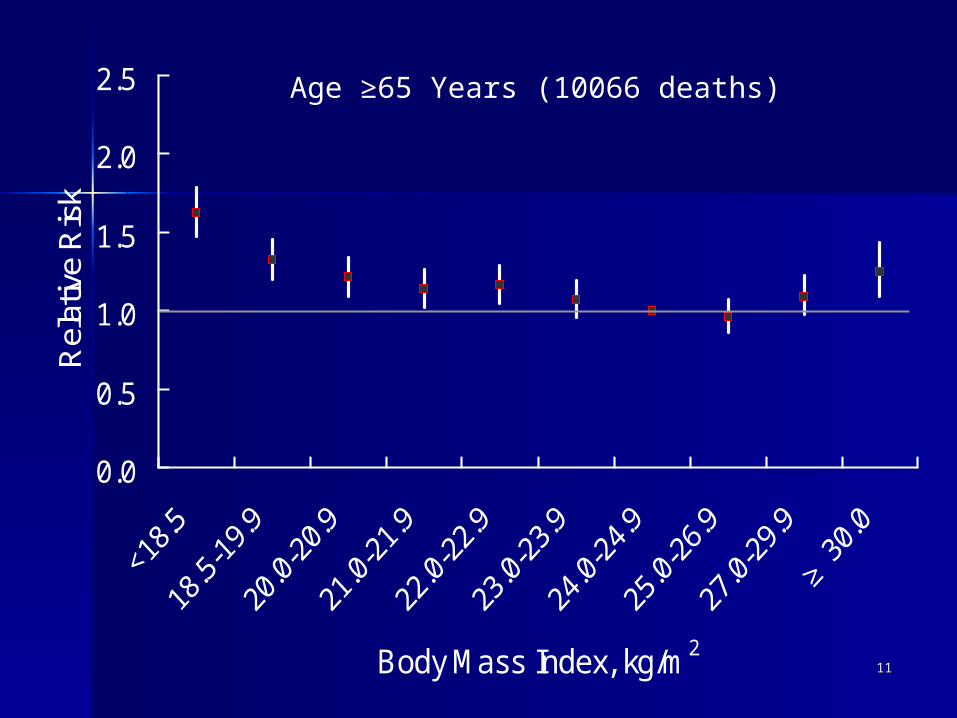
Age ≥65 Years (10066 deaths)

1212
0.0
0.5
1.0
1.5
2.0
2.5
<18.5
18.5
-19.
9
20.0
-20.
9
21.0
-21.
9
22.0
-22.
9
23.0
-23.
9
24.0
-24.
9
25.0
-26.
9
27.0
-29.
9
≥30
.0
Body Mass Index, kg/m2
Rel
ativ
e R
isk
Never-Smokers (9894 deaths)
1313
0.0
0.5
1.0
1.5
2.0
2.5
<18.5
18.5
-19.
9
20.0
-20.
9
21.0
-21.
9
22.0
-22.
9
23.0
-23.
9
24.0
-24.
9
25.0
-26.
9
27.0
-29.
9
≥30
.0
Body Mass Index, kg/m2
Rel
ativ
e R
isk
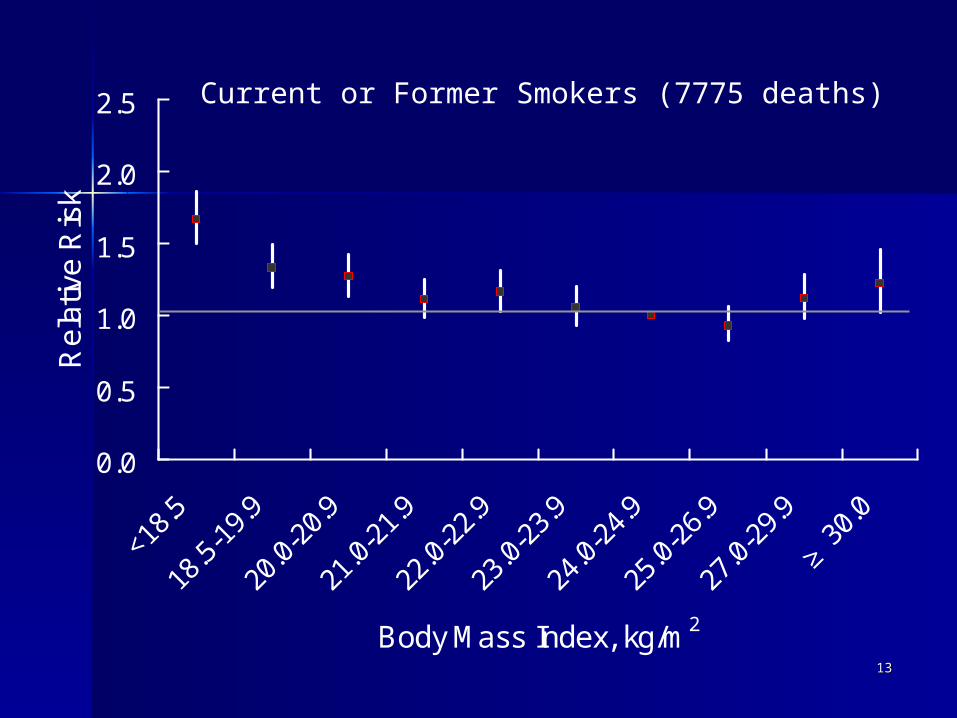
Current or Former Smokers (7775 deaths)
1414
0.0
0.5
1.0
1.5
2.0
2.5
Body Mass Index, kg/m2
Rel
ativ
e R
isk
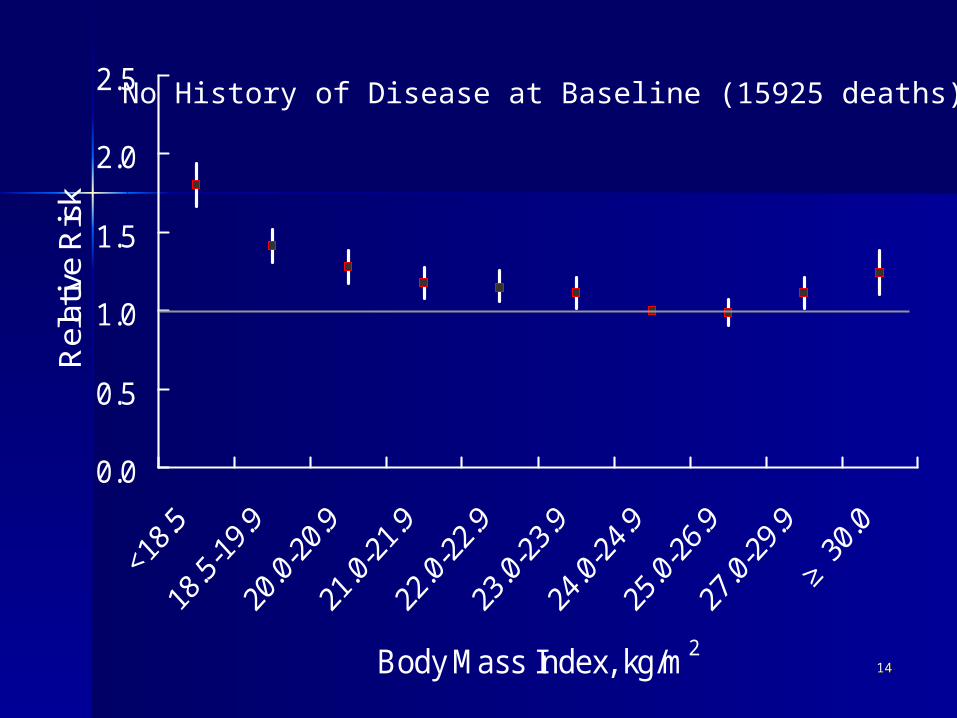
No History of Disease at Baseline (15925 deaths)

1515
0.0
0.5
1.0
1.5
2.0
2.5
Body Mass Index, kg/m2
Rel
ativ
e R
isk
Not Died in First 3-Years of Follow-up (12473 deaths)
1616
0.0
0.5
1.0
1.5
2.0
2.5
<18.5
18.5
-19.
9
20.0
-20.
9
21.0
-21.
9
22.0
-22.
9
23.0
-23.
9
24.0
-24.
9
25.0
-26.
9
27.0
-29.
9
≥30
.0
Body Mass Index, kg/m2
Rel
ativ
e R
isk
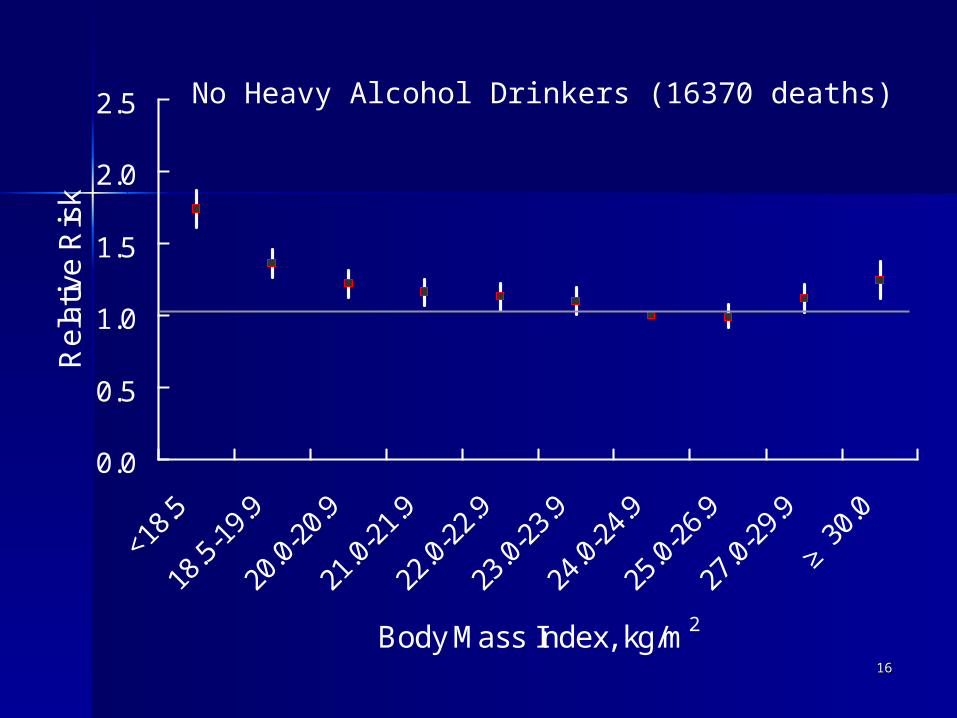
No Heavy Alcohol Drinkers (16370 deaths)

1717
0.0
0.5
1.0
1.5
2.0
2.5
<18.5
18.5
-19.
9
20.0
-20.
9
21.0
-21.
9
22.0
-22.
9
23.0
-23.
9
24.0
-24.
9
25.0
-26.
9
27.0
-29.
9
≥30
.0
Body Mass Index, kg/m2
Rel
ativ
e R
isk
Cardiovascular Mortality (8079 deaths)

1818
0.0
0.5
1.0
1.5
2.0
2.5
<18.5
18.5
-19.
9
20.0
-20.
9
21.0
-21.
9
22.0
-22.
9
23.0
-23.
9
24.0
-24.
9
25.0
-26.
9
27.0
-29.
9
≥30
.0
Body Mass Index, kg/m2
Rel
ativ
e R
isk
Cancer Mortality (3929 deaths)

1919
0.0
0.5
1.0
1.5
2.0
2.5
<18.5
18.5
-19.
9
20.0
-20.
9
21.0
-21.
9
22.0
-22.
9
23.0
-23.
9
24.0
-24.
9
25.0
-26.
9
27.0
-29.
9
≥30
.0
Body Mass Index, kg/m2
Rel
ativ
e R
isk
Other Cause Mortality (5679 deaths)

2020

2121
Prospective Studies Collaboration in Prospective Studies Collaboration in China China
Cohorts profileCohorts profile MenMen WomenWomen
No. of cohortsNo. of cohorts 2424 1919
No. of participantsNo. of participants 5491454914 3828038280 F-U,YearF-U,Year 7.17.1 6.36.3
Total person-yearsTotal person-years 387256387256 241250241250
No. of deathNo. of death 30443044 15761576
Age (years)Age (years) RangeRange 20-9420-94 20-9820-98

2222
Relative risk of all-cause mortality and BMI with 628364 person-years FUH
R&
95%
CIH
R&
95%
CI
40-59y 60y+
BMI BMI BMI
20-39y
1
2
3
17 19 21 23 25 27 29 3117 19 21 23 25 27 29 31
0
1
2
3
17 19 21 23 25 27 29 31
Adjusted for age, cohort, smoking, alcohol drinking and SBP, follow-up<1y excluded
Female
Male

2323
Accumulated mortality (1/100 participants in 7 yrs) and BMI in men, by age group
All-cause
0
5
10
15
20
25
30
CVD
0
2
4
6
8
10
12
14
cancer
0
1
2
3
4
5
6
7
Other causes
0
2
4
6
8
10
20-39y 40-59y 60y+20-39y 40-59y 60y+
Only those FU>1y included
12=BMI<18 18=<BMI<20 24=<BMI<2822=<BMI<2420=<BMI<22 BMI>=28
Mor
talit
y

2424BMI and CVD in the Asia-Pacific Region: 33 cohorts involving 310 000 participants
Asia Pacific Cohort Studies Collaboration Int J Epidem, 2004

2525
0.0
0.5
1.0
1.5
2.0
2.5
<18.5
18.5
-19.
9
20.0
-20.
9
21.0
-21.
9
22.0
-22.
9
23.0
-23.
9
24.0
-24.
9
25.0
-26.
9
27.0
-29.
9
≥30
.0
Body Mass Index, kg/m2
Rel
ativ
e R
isk
Other Cause Mortality (5679 deaths)
2626
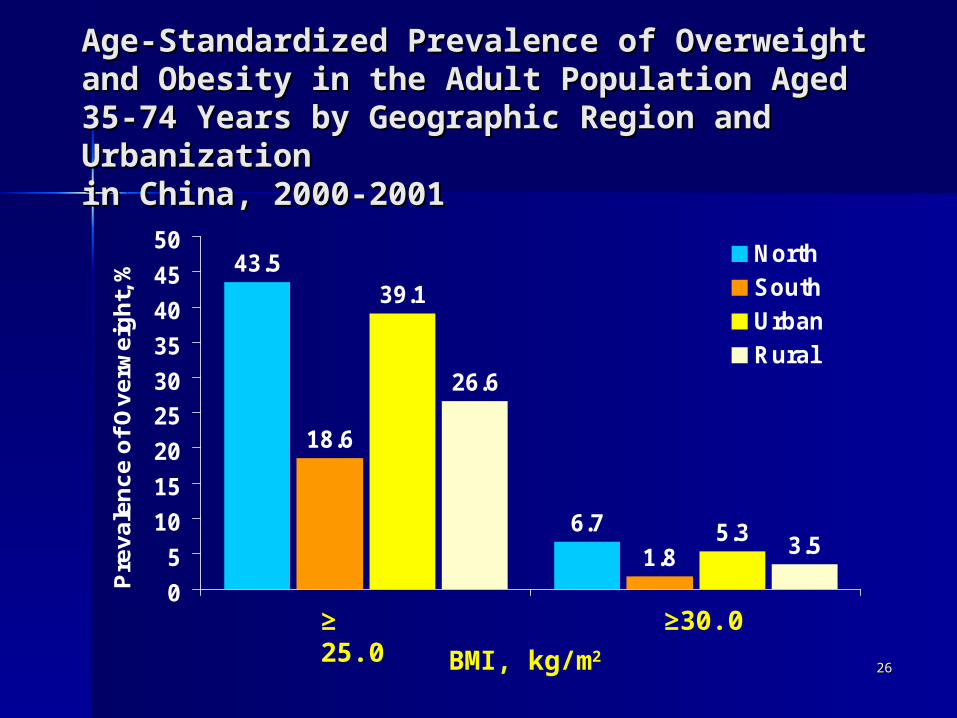
Age-Standardized Prevalence of Age-Standardized Prevalence of Overweight and Obesity in the Adult Overweight and Obesity in the Adult Population Aged 35-74 Years by Geographic Population Aged 35-74 Years by Geographic Region and Urbanization Region and Urbanization in China, 2000-2001in China, 2000-2001
43.5
6.7
18.6
1.8
39.1
5.3
26.6
3.5
0
5
10
15
20
25
30
35
40
45
50
Pre
va
len
ce
of
Ov
erw
eig
ht,
%
North
South
Urban
Rural
≥ 25.0
BMI, kg/m2
≥30.0

2727
Age-Standardized Prevalence of BMI Age-Standardized Prevalence of BMI Cut-points Among Men and Women Cut-points Among Men and Women Aged 35-74 Years in China, 2000-Aged 35-74 Years in China, 2000-20012001
46.9
36.4
26.9
8.2
2.8
51.7
40.2
31.0
11.6
5.0
0
10
20
30
40
50
60
Pre
va
len
ce
of
Ov
erw
eig
ht,
% Men
Women
23.0
BMI, kg/m2
24.0 25.0 28.0 30.0
2828
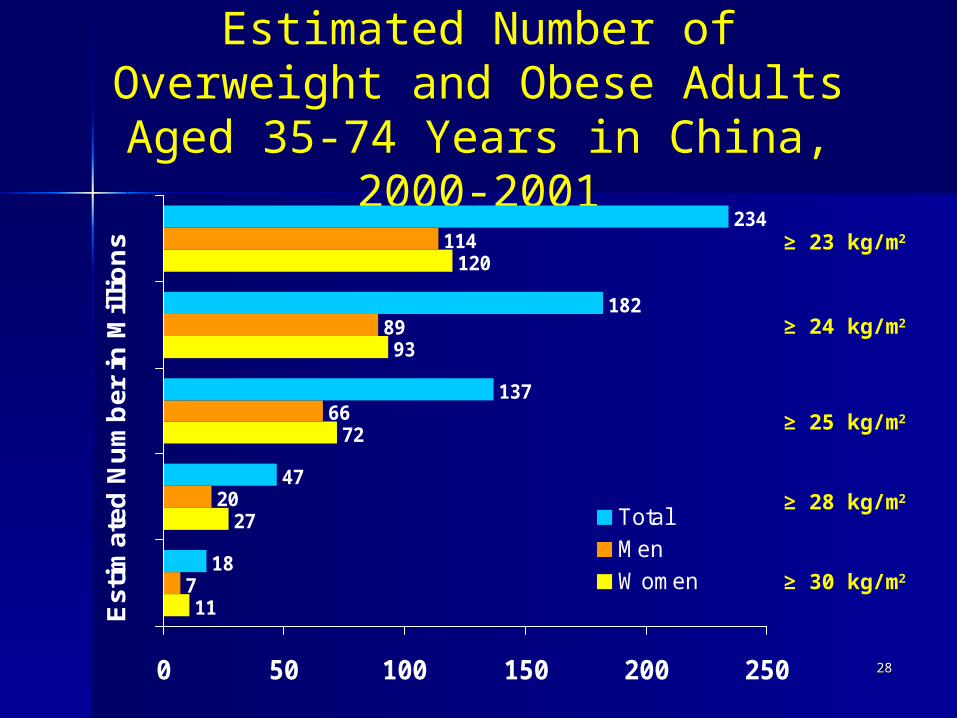
Estimated Number of Overweight and Obese Adults Aged 35-74 Years in China,
2000-2001
11
27
72
93
120
7
20
66
89
114
18
47
137
182
234
0 50 100 150 200 250
Est
imat
ed N
um
ber
in
Mil
lio
ns
TotalMenWomen ≥ 30 kg/m2
≥ 23 kg/m2
≥ 25 kg/m2
≥ 24 kg/m2
≥ 28 kg/m2

2929
ResultsResults
During an average follow-up of 8.3 years During an average follow-up of 8.3 years (1,113,162 person-years), 17,687 deaths were (1,113,162 person-years), 17,687 deaths were documented. There was a statistically documented. There was a statistically significant U-shaped association between significant U-shaped association between body-mass and age-standardized mortality body-mass and age-standardized mortality from all-causes (p<0.0001) with the lowest from all-causes (p<0.0001) with the lowest mortality among study participants with a mortality among study participants with a body-mass index (kg/mbody-mass index (kg/m22) of 24.0-24.9 in men ) of 24.0-24.9 in men and 25.0-26.9 in women.and 25.0-26.9 in women.

3030
ConclusionConclusion
The lowest rates of death from all-causes were at a body-mass index between 24.0-24.9 kg/m2 in Chinese men and 25.0-26.9 kg/m2 in Chinese women.
BMI <18.5 or 18.5-22.9 kg/m2) had a significantly increased all-cause mortality.
BMI > 27.0 in men and >30.0 in women was associated with an increased all-cause mortality.
3131
ConclusionConclusion
It certainly indicate that BMI <18 at the highest risk of any kind of death. The risk of cancer, CVD and other causes of death decreased with BMI from 18-27.9. The risk only increased after BMI>=28, but is still lower than BMI at 18-22, for CVD, cancer and other causes of death.
Western populations have identified the lowest all-cause mortality among persons with a body-mass index between 23 and 27.
3232
ConclusionConclusion
The U-shaped association was observed between The U-shaped association was observed between body weight and mortality from cardiovascular body weight and mortality from cardiovascular disease, cancer, and other causes.disease, cancer, and other causes.
The current studies indicates that both underweight The current studies indicates that both underweight and obesity were associated with increased mortality and obesity were associated with increased mortality in the Chinese adult population. Furthermore, our in the Chinese adult population. Furthermore, our findings support the use of a single common findings support the use of a single common recommendation for defining overweight and recommendation for defining overweight and obesity among all race and ethnicity groups.obesity among all race and ethnicity groups.

3333
AcknowledgementAcknowledgement Participating InstitutesParticipating Institutes
– Cardiovascular Institute of Chinese Academy Cardiovascular Institute of Chinese Academy of Medical Sciences, Beijing, Chinaof Medical Sciences, Beijing, China
– 10 Provinces including10 Provinces including– Fujian, Guangxi, Jiangsu, Hubei, Fujian, Guangxi, Jiangsu, Hubei,
Sichuan,Sichuan,– Shandong, Beijing, Jilin, Shanxi, Qinghai Shandong, Beijing, Jilin, Shanxi, Qinghai – Tulane University School of Public Health and Tulane University School of Public Health and
Tropical Medicine, New Orleans, LA, USATropical Medicine, New Orleans, LA, USA– Institute for International Health, University Institute for International Health, University
of Sydney, Sydney, Australiaof Sydney, Sydney, Australia– National Health Foundation, Mahidol National Health Foundation, Mahidol
University, Bangkok, ThailandUniversity, Bangkok, Thailand