Body of Evidence
64
Body of Evidence Alliance for a Clean and Healthy Maine | June 2007 A STUDY OF POLLUTION IN MAINE PEOPLE
Transcript of Body of Evidence

Bodyof Evidence
Alliance for a Clean and Healthy Maine | June 2007
A STUDY OF POLLUTIONIN MAINE PEOPLE


1
Body of Evidence—A Study of Pollution in Maine People
Project Sponsor: Alliance for a Clean and Healthy Maine
Organizational Sponsors: Environmental Health Strategy CenterPhysicians for Social Responsibility, Maine ChapterNatural Resources Council of Maine
Report Writers & Editors: Catherine SchmittMike Belliveau, Environmental Health Strategy CenterRick Donahue, MD, Physicians for Social ResponsibilityAmanda Sears, Environmental Health Strategy Center
Project Manager: Steve Taylor, Environmental Health Strategy Center
Principal Investigators: Rick Donahue, MD, Visiting Scientist, Harvard School of Public HealthVincent Markowski, PhD, Assistant Professor, University of Southern Maine
Research Assistants: Melissa Boyd, Physicians for Social ResponsibilityMatt Prindiville, Natural Resources Council of MaineSharon Tisher, University of Maine
Layout & Design: Jessica Renner, Studiohatch
Study Participants with occupation and Maine residence:
Regina Creeley Special education teacher HudsonPaulette Dingley Health & safety instructor AuburnDana Dow State Senator WaldoboroAmy Graham Children’s author FarmingtonBettie Kettell Nurse DurhamRussell Libby Organic farmer Mount VernonHannah Pingree State Representative North HavenLauralee Raymond Lobbyist HallowellViolet Raymond Community organizer WinthropElise Roux High school student WindhamCharlie Schmidt Science writer South PortlandEric Stirling Sporting camp owner TA R12 WELSDenyse Wilson Writing instructor Bangor
2
Acknowledgements
This study of the pollution in Maine people wasfunded through grants awarded by the John MerckFund and the Beldon Fund to member organizationsof the Alliance for a Clean and Healthy Maine. Wegreatly appreciate the support of these funders aswell as Bingham Program, Betterment Fund, New YorkCommunity Trust, Marisla Foundation and JohnsonFamily Foundation for their commitment to improvingenvironmental health and promoting safer alternativesto toxic chemicals.
We are indebted to the Institutional Review Boardand the Office of Research Compliance at the Universityof Southern Maine for their review and approval ofall study protocols and procedures.
We are deeply thankful for the support and hardwork of the Principal Investigators, Richard Donahue,MD and Vincent Markowski, PhD, without whom thisstudy would not have been possible. Dr. Donahue, afamily physician who practiced in Maine for ten years,is currently a Visiting Scientist at Harvard School ofPublic Health and a contractor to the Maine Chapterof Physicians for Social Responsibility. Dr. Markowskiis Assistant Professor of Psychopharmacology at theCenter for Integrated and Applied Toxicology at theUniversity of Southern Maine.
We appreciate the advice, support and assistanceprovided by Sharyle Patton, Commonweal; ErikaSchreder, Washington Toxics Coalition; and JaneHoulihan, Environmental Working Group.
Thank you to Environmental Working Group whoinspired and supported this project through itspioneering studies and methods for raising publicawareness of our chemical body burden. Specialthanks to Washington Toxics Coalition for itscommunications and research support and toCommonweal’s Biomonitoring Resource Center forinformation resources.
Our biggest thanks go to the more than 20 Mainerswho volunteered for this study and especially for the13 who participated in the sampling and analysis.They donated several vials of blood, a lock of hairand a urine sample. They also consented to sharingtheir results with the public so as to advance ourknowledge of the chemical pollutants in Maine people.You are environmental health heroes!
The conclusions and recommendations in thisreport are those of the authors and sponsoringorganizations and do not necessarily reflect the viewsand opinions of the project funders, University ofSouthern Maine, principal investigators, advisors, orparticipants. The authors and sponsors accept allresponsibility for any errors or omissions in this work.
This study was sponsored by the Alliance for aClean and Healthy Maine, a diverse coalition of Maine-based organizations committed to protecting humanhealth from toxic chemical exposure. Forty-fiveorganizations have endorsed the Alliance, representinghealth-affected children, workers, doctors, publichealth professionals, environmentalists, and impactedcommunities.

3
Table of Contents
Executive Summary . . . . . . . . . . . . . . . . . . . . . . . . . . . . . . . . . . . . . . . . . . . . . . . . . 4
The People . . . . . . . . . . . . . . . . . . . . . . . . . . . . . . . . . . . . . . . . . . . . . . . . . 5
Introduction . . . . . . . . . . . . . . . . . . . . . . . . . . . . . . . . . . . . . . . . . . . . . . . . . 8
Project Findings . . . . . . . . . . . . . . . . . . . . . . . . . . . . . . . . . . . . . . . . . . . . . . . . 12
The Chemicals . . . . . . . . . . . . . . . . . . . . . . . . . . . . . . . . . . . . . . . . . . . . . . . . 16
Conclusions and Recommendations . . . . . . . . . . . . . . . . . . . . . . . . . . . . . . . . 38
Project Methodology . . . . . . . . . . . . . . . . . . . . . . . . . . . . . . . . . . . . . . . . . . . . . . 40
Appendix . . . . . . . . . . . . . . . . . . . . . . . . . . . . . . . . . . . . . . . . . . . . . . . . 43
Table 1—The Chemicals Tested in Thirteen Mainers . . . . . . . . . . . . . . . . . . . . . . . . . . . 44
Table 2—Complete Results of Chemical Screening of Thirteen Mainers . . . . . . . . . . . . . . . 45
Table 3—Summary of Results of Maine Body Burden Study . . . . . . . . . . . . . . . . . . . . . 48
References . . . . . . . . . . . . . . . . . . . . . . . . . . . . . . . . . . . . . . . . . . . . . . . . 50
Alliance for a Clean and Healthy Maine, Steering Committee:
Environmental Health Strategy Center, Learning Disabilities Association of Maine, Maine Labor Group onHealth, Maine Organic Farmers and Gardeners Association, Maine People’s Alliance, Maine Public HealthAssociation, Natural Resources Council of Maine, Physicians for Social Responsibility—Maine Chapter, andToxics Action Center Campaigns
Visit the Alliance for a Clean and Healthy Maine at www.cleanandhealthyme.org or contact us at(207) 772-2181, One Pleasant Street, Fourth Floor, Portland, Maine 04101.

Maine people are polluted with dozens of hazardousindustrial chemicals, according to a new studyconducted by the Alliance for a Clean and HealthyMaine with help from the University of SouthernMaine. In 2006, thirteen Maine men and womenvolunteered to have their bodies tested in the first-ever study of chemical pollution in Maine people. Thisstudy found a total of 46 different chemicals (of 71tested) in samples of blood, urine, and hair. On average,each participant had measurable levels of 36 toxicchemicals in their bodies.
These findings show that Maine people areroutinely exposed to hazardous industrial chemicalsincluding phthalates from cosmetics and vinyl plastic,brominated flame retardants (PBDEs) from televisionsand furniture, Teflon chemicals from stain-resistantand non-stick coatings, bisphenol A from reusablewater bottles and baby bottles, and toxic metals suchas lead, mercury and arsenic.
These chemicals are found in products we useevery day: plastic containers, toys, furniture, fabric,automobiles, TVs and stereos, water bottles, medicalsupplies, and personal products like shampoo, hairspray,and perfume. They are in our homes and offices, foodand water, and the air we breathe.
Scientific research shows that these chemicalsare hazardous and that even tiny amounts maythreaten human health. They are toxic or harmful tolife and many are slow to degrade and also build upto high levels in the food chain. Babies in the womb
and young children are especially vulnerable becausethey are still growing. Animal and human studieshave linked these chemicals to learning anddevelopmental disabilities, endocrine system damage,changes in sexual development, reproductive harm(including decreased sperm count in men), low birthweight and some cancers.
Despite proven and suspected dangers to our health,industry is not required to demonstrate the safety ofchemicals before adding them to consumer products,nor are they required to use safer alternatives tochemicals known to be hazardous. Recognizing thatthe safety system for industrial chemicals is broken,the Alliance for a Clean and Healthy Maine recommendsthat a comprehensive safer chemicals policy should bedeveloped and adopted by government to:
CLOSE THE SAFETY GAP by phasing out the mostharmful chemicals in favor of safer alternatives,searching for safer substitutes for all chemicals shownto be hazardous, and requiring that all industrialchemicals are proven safe, especially for children;
CLOSE THE DATA GAP by honoring the public’s right-to-know which hazardous chemicals are in whatproducts, and by requiring manufacturers to providehealth and safety data on all chemicals;
CLOSE THE TECHNOLOGY GAP by investing in greenchemistry research and development (R&D) to makebio-based plastics from Maine potatoes and othercrops to boost the state’s economy through productionof safer alternatives to toxic petroleum-based plastics.
4
Executive Summary

5
Regina Creeley, 54, lives in Hudson. She is married with two grown children. Reginabegan working as a classroom assistant when she was 14 years old. Now a specialeducation instructor, Regina says she has noticed a dramatic increase in the numberof students in her school with special needs.
Regina had the highest total arsenic levl of all study participants, which was probablydue to her recent meal of shellfish, which contain a non-toxic form of arsenic. She hadthe lowest mercury level.
Paulette Dingley, 48, has spent much of her life working to provide home care for adultswith disabilities. She now works with the American Red Cross as a health and safetyinstructor. She lives in Auburn.
Paulette had the highest level of two types of phthalates. She was one of three participantswho had bisphenol A chemicals in their bodies at levels several times higher than thenational average.
Dana Dow, 56, is a Republican state senator who represents his hometown of Waldoboroand 20 other towns in midcoast Maine. He is serving his second legislative term and sitson the Marine Resources and Labor committees. Married with four children, Dana alsoowns a furniture store.
Dana had the highest levels, and most different types, of perfluorinated chemicals (PFCs),the Teflon chemicals. Senator Dow’s levels were more than twice the national averagelevel for PFOA and several other PFCs.
Amy Graham, 35, works out of her home in Farmington and splits her time betweenwriting children’s books and being a homemaker. She and her husband have two youngdaughters, Phoebe and Sylvie. Amy works to make the safest choices for her family. Shebreastfed both of her daughters, makes her own non-toxic cleaners, and includes manyorganic fruits and vegetables in her family’s diet.
Amy had the second-highest level of one of the PBDEs which is a breakdown product ofDeca, the toxic fire retardant, but the rest of her results were low to medium comparedto the other participants.
Bettie Kettell, 60, is a nurse who lives in Durham. Bettie worked with her hospital’sadministration to implement pollution prevention goals to eliminate the use of unnecessarychemicals.
Bettie had the highest total level of PBDE flame retardants compared to the other Maineparticipants and was third highest in the PFCs. Of the 71 chemicals that were tested inthis study, 41 were detected in Bettie, a tie for the most chemicals found.
The People

6
Russell Libby, 50, is an organic farmer and executive director of MOFGA, the MaineOrganic Farmers and Gardeners Association. He became involved with MOFGA after thefirst Common Ground Fair in 1977, where he saw a connection between local, organicfood and a strong Maine economy. Russell lives on his farm in Mount Vernon.
Russell was tied for the most chemicals detected (41 of the 71 that were tested). He alsohad the greatest number of PBDEs detected (27 of 46) and higher levels of individual PBDEs.
Hannah Pingree, 30, is serving her third term in the Maine Legislature, and first asHouse Majority Leader, representing her hometown of North Haven and ten other islandsand coastal towns. After learning that PBDE flame retardants were being found in breastmilk, Hannah sponsored a bill that successfully phased out two hazardous flame retardantsin 2004. She continues to be a strong voice for the phase-out of unnecessary dangerouschemicals in Maine.
Hannah had the second highest level of total phthalates and second highest level ofmercury in the Maine study group. Her mercury levels were above the safety standardfor protection of a developing fetus from subtle but permanent brain damage.
Lauralee Raymond, 28, grew up in Aroostook County and attended Bates College. Shecurrently lives in Winthrop, but lived in Hallowell at the time of our study. She works asa lobbyist. Lauralee and her mother Vi both participated in the Body of Evidence study.
When she received her results, Lauralee was struck by the fact that many of her chemicallevels were higher than her mother’s. She expected the opposite, since her mother isolder and has had more time to build up her levels of contaminants. Lauralee had higherlevels of mercury, arsenic, and each of the PBDE flame retardants than her mother.
Vi Raymond, 51, moved to Winthrop after spending 40 years in Fort Kent. Marriedwith five grown children, including fellow participant Lauralee, Vi has long advocatedfor safer workplaces in her jobs with PACE, the paperworker’s union, and the AFL-CIO.
Vi had the highest phthalates total, and the highest level of BADGE-4OH, one ofthe bisphenol A chemicals tested. Her bisphenol A levels were several times thenational average.
Elise Roux, 18, is a senior at Cheverus High School in Portland. She lives in Windham.A soccer goalie and cancer survivor, Elise is active in Kids Against Toxins, a Portlandarea group of students working to reduce pollution and eliminate unnecessary uses oftoxic chemicals.
Elise had the highest level of bisphenol A, which was about ten times the national average,and the second-highest level of the related compound BADGE-4OH.

Charlie Schmidt, 42, is an award-winning freelance science writer from South Portland.Charlie has a master’s degree in public health, and also has worked as a toxicologist.
Charlie brings a professional appreciation to the growing interest in the human chemicalbody burden, and the challenging implications for public health.
Eric Stirling, 32, owns and operates a sporting camp on First West Branch Pond,near the Appalachian Trail in the unorganized territory TA-R12. Except for his fouryears of college at Bates, Eric spent almost his entire life at the camp, which hasbeen in his family for four generations and is thought to be Maine’s oldest continuouslyoperated sporting camp.
Eric had the highest level of mercury found among the study participants, and his totalarsenic amount was above the normal exposure level.
Denyse Wilson, 39, is a writing instructor. She is married with two children, Cecil (sixyears old) and Francine (four years). While renovating their 85-year-old home in downtownBangor, Denyse and her family were exposed to lead dust from old paint. Since then,her family’s lead levels have decreased, and Denyse has spoken out to improve educationabout lead poisoning prevention.
Denyse had the highest inorganic arsenic and arsenic(III) levels of all study participants,and the total arsenic measured was higher than normal exposure.
7

Pollution of our air, water, and land has beenstudied for years, prompting laws to protect publichealth and the environment. Now scientists are findingpollution in people. Much of it comes from theunnecessary use of toxic chemicals in commonconsumer products and plastics. Yet no effectivepolicies are in place to keep hazardous chemicals outof our bodies. It’s time that these new studies motivategovernment to act once again.
Until now, the level of dangerous chemical pollutionin Maine people has not been known. Through acooperative effort with the University of SouthernMaine led by Dr. Rick Donahue, 13 men and womenfrom Maine volunteered in 2006 to be tested forchemicals encountered in their everyday lives.
The results represent the first-ever report of nearly50 toxic pollutants found in Maine people. By releasingthese findings, the Alliance for a Clean and HealthyMaine seeks to elevate the public discussion aboutpollution in Maine people and promote action to fixour broken safety system that allows chemicals tobuild up in our bodies.
Chemicals are all around us—in the air we breathe,the water we drink, the food we eat, and the productsthat fill our homes, schools and workplaces. While someof these substances are harmless, other chemicals stillin widespread use are known to be hazardous to ourhealth and environment. The effects of most chemicalsin commerce are largely unknown, since the chemicalindustry is not required to test their products for healthand safety threats. Medical research is revealing thatcommon chemicals can disrupt the normal functioningof our cells and organs and damage our health. Somechemicals also accumulate over time, building up andcombining with each other inside our bodies.
Together, the chemicals inside of a living beingadd up to a total “body burden” of contamination.Each of us carries a chemical burden; for some, this
burden can be more risky than for others, dependingon our genetic makeup, health status, and socio-economic background. Some groups such as babies inthe womb are especially vulnerable.
These 13 Maine residents join others across theUnited States, Canada and Europe who have volunteeredfor testing so that we may begin to understand ourrelationship with the chemicals in the world aroundus. By comparing the levels found in Maine people toother, similar populations in the U.S., we can track ourexposure to toxic chemicals, while we work with othersto change government policy and business practices toswitch to safer alternatives.
This study focused on five groups of chemicalsthat have been linked to harmful effects:
• Phthalates, chemicals added to nail polish andmany other beauty products, and to PVC plastic(vinyl) to make it more flexible for shower curtainsand other soft plastics;
• Polybrominated diphenyl ethers (PBDEs), thetoxic flame retardants added to the plastic casesof televisions, and the fibers in draperies, furnitureand other textiles;
• Perfluorinated chemicals (PFCs), the extremelypersistent Teflon chemicals used as protectivecoatings for fabrics, furniture, carpets, cookwareand fast-food packaging;
• Bisphenol A (BPA), a chemical used to makereusable plastic water bottles and baby bottles, thelinings in metal food cans and dental sealants;
• Metals, including lead, found in old paints andplumbing, and in batteries, electronics, electricalwiring, ammunition, wheel weights, and otherproducts; mercury, released from products andpower plants into air and water, where it builds upin fish; and arsenic, a former pesticide that occursnaturally in soils and some Maine well water.
8
Introduction

These particular chemicals were chosen becausethey are found in common products that are part ofour modern lifestyle and have come under increasingscrutiny as potential threats to human health. Someare also known to be very long-lived in the environment(or persistent) and to build up in the food chain (orbioaccumulate). More and more, these chemicals arebeing shown to have adverse health effects at extremelylow levels, in some cases levels below what waspreviously considered safe, especially at crucial momentsin human growth. For example, we know that low-level exposures to lead and mercury harm the developingbrain, causing lowered intelligence and learning andbehavior problems.1 How might exposure to other, lesswell-studied chemicals be harming our health?
Only in the last decade have scientists and doctorsdiscovered that some chemicals, like brominated flameretardants and fluorinated stain-resistant coatings,move from the products in which they are used intothe environment and into humans and wildlife. Weknow that these chemicals are harmful from animalstudies. We don’t understand very well the combinedeffects of these chemical exposures on human health,especially on fetuses and children who are moresensitive to toxic effects. We do know that humanexposure levels for some of these chemicals approachor exceed toxic levels in animals.
Chemicals that interrupt the intricate processesof developing life can, at high levels, wreak havoc inthe form of severe birth defects, or at lower levelscause subtle but important changes in developmentthat surface later in childhood as learning or behavioralproblems, or in adulthood in the form of certaincancers or deteriorating brain function. Researchersare only just beginning to understand theseconnections. Monitoring levels of toxic chemicals inpeople’s bodies (or biomonitoring) can help setpriorities for policy, substitution with safer alternatives,and further research.
Sources of potential exposure vary with ourindividual day-to-day routine activities. In this survey,information gathered from interviews with participantswas used to develop possible routes of chemicalexposure. Because of the multitude of chemicals weface every day, such exposure pathways are difficultto establish, but participants were provided withinformation about possible sources such as foodconsumption and product use.
Moving from the sources of chemicals inside us towhat effects they might have on our health is aformidable, sometimes impossible task forenvironmental health professionals. It can be difficultto come up with easy answers to questions on thehealth impact of chemicals.2 The results of this pilotstudy cannot be used to predict how a participant’shealth will be affected by his or her chemical bodyburden. Many factors influence whether or not exposureto toxic substances will result in a health problem,including:
• the type and nature of the chemical;
• when in his or her lifetime a person was exposed;
• how often a person was exposed, and for how long;
• the amount of the chemical exposure;
• the individual’s genetic makeup and physicalcondition;
• the person’s health and nutrition, and their accessto quality health care; and
• the person’s socio-economic status.
While we cannot make direct links to the health ofMaine people, we can place the Maine results in thecontext of other national and regional biomonitoringstudies and surveys, particularly the Centers for DiseaseControl and Prevention’s Third National Report on HumanExposure to Environmental Chemicals,3 and similar smallstudies in Washington,4 California,5 Canada,6 and in six
9

studies in the U.S. conducted by the Environmental WorkingGroup, an early pioneer in the use of biomonitoring.7 However,it is important to note that this is not a statistical study (seeBox on page 11) and comparisons should be made cautiously.
Reviewing laboratory reports that describe themeasurements of chemicals in humans can be overwhelming.The units are so small—parts per billion—they can beincomprehensible. As improved laboratory technology allowsfor the detection of smaller and smaller amounts of substances,we now can find all kinds of substances we never knew wereinside of us. This creates a dilemma for both healthprofessionals and the public, who are trying to understandwhether they are at risk from the chemicals inside of them(see Sidebar). Yet absence of knowledge is not proof of safety.
The findings presented in this report beg us to err onthe side of caution, for our health and the sake of ourchildren’s future. The history of widespread harm caused bytoxic substances like lead, PCBs, and mercury demonstratesthe need to act on early warnings. And when controlledlaboratory experiments reveal a connection between exposureto these chemicals and brain damage or chronic diseases,our concern only increases. When there is plausible concernabout serious environmental public health hazards, andscientific uncertainty about the cause-and-effect relationship,then precautionary action should be taken to prevent exposureand possible harm.
About this ReportAll of the protocols for this project were approved by the
University of Southern Maine, with oversight of methodology,data collection, laboratory testing, and data analyses providedby Dr. Rick Donahue and Dr. Vincent Markowski. Samples ofblood, urine, and hair were analyzed by two accreditedlaboratories, AXYS Analytical Services in Victoria, BritishColumbia and Brooks Rand Labs in Seattle, Washington. Seethe Project Methodology section at the end of this report forfurther details.
The next section of this report discusses the overall
10
Do Low Doses Posea Danger?
A common argument againstconcerns about chemicals inpeople is that the presence ofminute amounts of chemicalsin our bodies is not necessarilya threat. Our technologicalability to detect trace amountsof substances—parts per billionor trillion—is advancing fasterthan our scientific ability todetermine the effects of suchsmall amounts of chemicals. Wecan prove that a person wasexposed, but we can not aseasily pinpoint the source ofthe exposure, or say what thehealth effects might be, or whatthe person should do about it.8
Just because we haven’t foundconclusive evidence in humansthat a chemical causes someeffect does not mean it isharmless. Many prescriptiondrugs aimed at addressing ahost of medical conditions causethe intended biological effectsat effective doses similar to thelow levels found for the chemicalpollutants in this study. Andemerging science reveals thatmany chemicals mimic naturalhormones in the body that actat extremely low levels toregu la t e deve l opment ,reproduction, immune functionand many other biologicalsystems.

findings. Following sections provide more detailedinformation on each group of chemicals found in the13 Maine participants. The Conclusions andRecommendations place the report’s findings in alarger context and identify the actions thatgovernment, businesses, and individuals can take toprevention pollution in people.
At the end of the report, the project and analyticalmethods are described, followed by a series of tablesin the Appendix that report on the detailed resultsof every chemical tested for every participant. Thereport closes with authoritative references to thescientific journal articles, government reports, andother information sources that support the growingconcern about pollution in people.
11
This is not a controlled research study. Becauseof the small sample size, the study resultscan not be used to draw statistical conclusionsabout chemical exposures for variouspopulation sectors or the Maine public as awhole. The data from these tests provide asnapshot of the accumulation of and exposureto some chemicals in some long-time Maineresidents. The only statistically-basedcompilation of nationwide measurements isthe National Health And Nutrition ExaminationSurvey (NHANES), conducted by the U.S.Centers for Disease Control and Prevention(CDC), which does not test for all thechemicals assessed in our project.

Our study reveals that Maine people are polluted.We found a total of 46 different toxic chemicals of the71 that we tested for in the bodies of 13 Maine people.The average body burden was 36 toxic chemicals detectedin the blood, urine and hair of each participant. Thechart below visually displays these results.
These findings show that Maine people are routinelyexposed to many industrial chemicals.
These chemicals have hazardous properties such astoxicity (ability to harm life), and in some casespersistence (being slow to degrade) and bioaccumulation(building up in the food chain). Therefore, the routineexposure of Maine people to these chemicals poses apotentially serious health threat.
Many of the chemicals we found in Maine peopleare added to everyday consumer products, rangingfrom cosmetics and personal care products, televisionsand electronics, furniture and carpeting, to cookwareand clothing. They are found in common materialssuch as plastics, coatings, and adhesives. People areexposed during the use and disposal of theseproducts, the ingestion of household dust, indoorair pollution, contaminants in the food supply, anddrinking water.
The finding of dozens of mostly unregulated toxicchemicals in average Maine people shows that thesafety system for industrial chemicals is broken andneeds to be fixed. Current laws and practices do notprevent routine exposure to hazardous chemicals inour daily lives.
For detailed results for all chemicals measured ineach participant, see the tables in the Appendix atthe end of this report. Table 1 identifies the 71chemicals tested, which fall into five chemical groups:phthalates, PBDEs (a group of brominated flameretardants), PFCs (the Teflon chemicals), bisphenol Achemicals (BPA), and metals (lead, mercury, andarsenic). Every one of the five groups of chemicals
tested was detected in Maine people, although notevery chemical was found in every participant.
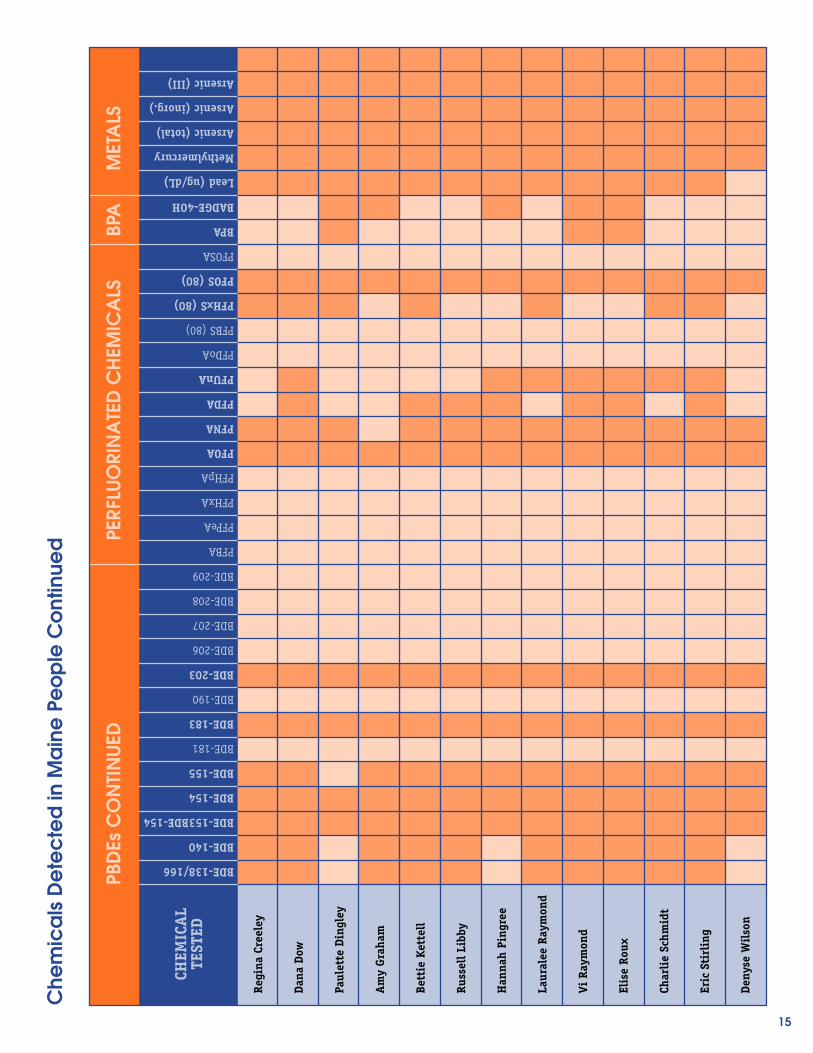
Table 2 reports all of the chemical testing resultsfor each individual participant. It shows which chemicalswere found and at what level. It also indicates whichchemicals were not detected and the lowest levelmeasurable (i.e., the limit of detection). Table 3summarizes the results for the whole group of Mainersand compares them to similar results from the nationalbiomonitoring program or similar body burden studiesconducted in certain states or nationally.
The findings for each of the five chemical groupsare summarized on the following pages. The sectionsof the report that follow provide more details on eachgroup of chemicals, along with citations to authoritativesources of information.
Phthalates—from Beauty Products to Beastly Vinyl.
These chemicals are ubiquitous and unregulated inthe United States. All seven of the phthalatecompounds were detected in nearly every persontested. The levels of six of the seven phthalatesdetected in the participants were higher than thenational average. For one phthalate, the median Mainevalue was higher than 95% of all Americans tested.Three phthalates were found in Maine people at levelshigher than 75% of all Americans. Phthalates areadded to thousands of personal care products and softpolyvinyl chloride (PVC) plastic used in everythingfrom shower curtains and packaging to inflatable toysand IV bags in hospitals.
PBDEs—the Toxic Fire Retardants.
These chemicals are found everywhere we look. Maineand others have recently banned two commercial PBDEproducts known as Penta and Octa, and is consideringlegislation to replace the most widely used PBDE mixcalled Deca with safer alternatives. We found 28 ofthe PBDEs in Maine people out of the 46 that we
12
Discussion of Project Findings

tested for (out of the 209 PBDEs known to science).The PBDE levels found in Maine people were generallycomparable to those found in other studies. Two ofthe PBDEs that are known breakdown products ofDeca, BDE-153 and BDE-183, were higher than levelsfound in Washington and California residents. Eightypercent of Deca is added to the plastic casing oftelevisions to slow the spread of flames in a fire, withadditional uses in textiles (commercial drapes andfurniture) and electrical wires and cables.
PFCs—the Stain-Resistant Teflon Chemicals.
Of the 13 perfluorinated chemicals (PFCs) tested, wefound six in Maine people. These persistent chemicalsare found everywhere in the environment. They arelargely unregulated, although voluntary actions arebeing taken to reduce the use of PFOS and PFOA, thetwo most studied of the PFCs. Three of the PFCsdetected in Maine people were found at levels abovethe average or median levels reported in other studies.The PFCs are used as stain- and water-resistant coatingson furniture, clothing, and carpets; grease-resistantcoatings in fast-food packaging; non-stick coatingsfor cookware; and other Teflon products including thebreathable, water-resistant fabric known as Gore-Tex.
Bisphenol A—the Hormone-Disrupting PlasticBuilding Block.
Three Maine women had blood levels of bisphenol Athat were six to ten times higher than the averagereported for women in the scientific literature. Infive women of the 13 Mainers tested, we found ametabolite of a related chemical known as bisphenol
A diglycidyl ether (BADGE). Bisphenol A is widelyused and totally unregulated. BPA mimics the actionsof naturally occurring hormones in the body, soexposure to very low doses may adversely affectreproduction, sexual development, and otherbiological systems. Early fetal exposure in the wombmay predispose adults to breast cancer, obesity, andother chronic diseases. BPA is a basic building blockchemical used to make polycarbonate plastics usedin baby bottles, reusable water bottles, and manyother products. BPA and BADGE exposure also resultsfrom the epoxy resins used in the plastic linings ofcanned foods and in dental sealants.
Toxic Metals—the Age-Old Poisons.
Every one of the 13 Mainers tested had measurablelevels of lead, mercury, and arsenic in their bodies.Blood lead levels were generally below the nationalaverage, although no safe level may exist. Leadexposure results from renovating lead-painted houses,old drinking water pipes, and handling productscontaining lead, such as ammunition and electricalwire. The methylmercury levels measured in hairalmost certainly resulted from consumption of mercury-contaminated fish, such as canned tuna and tunasushi. Total arsenic levels were relatively high in afew of the Mainers tested, although this may be dueto relatively non-toxic forms of organic arsenic foundin shellfish. Detections of the highly toxic inorganicform of arsenic probably resulted from natural drinkingwater contamination. Arsenic was formerly widelyused as pesticide in pressure-treated wood and fororchards and along roadways.
13

14
Che
mic
als
De
tec
ted
in M
ain
e P
eo
ple
PHTH
ALA
TES
Regi
na C
reel
ey
Dana
Dow
Paul
ette
Din
gley
Am
y Gr
aham
Bett
ie K
ette
ll
Russ
ell L
ibby
Han
nah
Ping
ree
Laur
alee
Ray
mon
d
Vi R
aym
ond
Elis
e Ro
ux
Char
lie
Schm
idt
Eric
Sti
rlin
g
Deny
se W
ilso
n
CHEM
ICA
LTE
STED
POLY
BRO
MIN
ATE
D D
IPH
ENYL
ETH
ERS
(PBD
Es)
mMEP
mEtP
mBuP
mBzP
mEHP
mEOHP
mEHHP
BDE-7
BDE-8/11
BDE-10
BDE-12/13
BDE-15
BDE-17/25
BDE-28/33
BDE-30
BDE-32
BDE-35
BDE-37
BDE-47
BDE-49
BDE-51
BDE-66
BDE-71
BDE-75
BDE-77
BDE-79
BDE-85
BDE-99
BDE-100
BDE-105
BDE-116
BDE-119/120
BDE-126
BDE-128
15
Che
mic
als
De
tec
ted
in M
ain
e P
eo
ple
Co
ntin
ued
PBD
Es C
ON
TIN
UED
Regi
na C
reel
ey
Dana
Dow
Paul
ette
Din
gley
Am
y Gr
aham
Bett
ie K
ette
ll
Russ
ell L
ibby
Han
nah
Ping
ree
Laur
alee
Ray
mon
d
Vi R
aym
ond
Elis
e Ro
ux
Char
lie
Schm
idt
Eric
Sti
rlin
g
Deny
se W
ilso
n
CHEM
ICA
LTE
STED
BPA
BDE-138/166
BDE-140
BDE-153BDE-154
BDE-154
BDE-155
BDE-181
BDE-183
BDE-190
BDE-203
BDE-206
BDE-207
BDE-208
BDE-209
PFBA
PFPeA
PFHxA
PFHpA
PFOA
PFNA
PFDA
PFUnA
PFDoA
PFBS (80)
PFHxS (80)
PFOS (80)
PFOSA
BPA
BADGE-4OH
Lead (ug/dL)
Methylmercury
Arsenic (total)
Arsenic (inorg.)
Arsenic (III)
MET
ALS
PERF
LUO
RIN
ATE
D C
HEM
ICA
LS

Phthalates—Beauty Products andBeastly Vinyl
Phthalates (pronounced THAL-ates) are widelyused industrial chemicals that are found everywhere.They are added to PVC plastic products to makethem softer or more flexible, such as toys, carinteriors, medical devices like blood IV bags andtubing, vinyl flooring, vinyl wallpaper, and vinylshower curtains. Phthalates are also added to manycosmetics and personal care products includingscented lotion, shampoo, perfume, aftershave, nailpolish, and hair spray. Phthalates can make up amajor portion of a product by weight, but sincethey are not chemically bound, the chemicals leachout over time.9 For example, a new vinyl showercurtain can elevate indoor air toxics concentrationsfor over a month.10
According to the federal Centers for Disease Control,phthalates are found in Americans of all ages, sizes,and races.11 Phthalates are present in breast milk andcan cross the placenta to enter a growing fetus.Humans are exposed by ingesting contaminated foodand water, and to a lesser extent through inhalationand skin contact.12 In one study, babies in neonatalintensive care units using phthalate-containing vinylmedical products had levels of phthalates seven timeshigher than babies in a hospital not using phthalate-containing products.13 Infants and children areespecially vulnerable to phthalate exposure becausethey put plastic objects in their mouths.
Phthalates in Maine People
Phthalates were detected in all 13 participants,and those who reported using certain products hadhigher levels than others. Phthalates do not buildup in the body (or bioaccumulate), so internal levelsmay fluctuate throughout the day reflecting recentor continuous exposure. We tested for seven phthalatemonoesters, which are metabolites (breakdown
products) of five phthalate diesters added toconsumer products. (See Table 2 in the Appendixfor complete results).
All seven of the phthalate compounds weredetected in nearly every Maine person tested. Themedian (or middle) levels of six of the sevenphthalates measured in the participants were greaterthan the national median (the middle value of morethan 2,500 Americans randomly tested). For onephthalate, a metabolite of dimethyl phthalate (DMP),the median Maine value was higher than 95% of allAmericans tested. DMP is used in hair sprays, insectrepellants, and soft plastics. (A metabolite is thechemical that forms from the biological breakdownof the original chemical).
Three phthalates were found in Maine people atlevels greater than 75% of all Americans tested. Twoof these are metabolites of DEHP or di-(2-ethyl hexyl)phthalate. The levels of another DEHP byproduct werehigher than the national median. DEHP is widely usedin PVC (vinyl) products such as medical IV bags andtubes, auto interiors, diaper covers, shower curtains,and other consumer items.
A byproduct of benzylbutyl phthalate (BBzP) wasthe other phthalate found in Maine people at levelshigher than 75% of all Americans. BBzP is added tovinyl flooring, car care products, personal care products,adhesives, and sealants.
In the bodies of the Mainers tested, levels of aphthalate found in nail polish and other personalcare products, dibutyl phthalate (DBP), was foundhigher than the national median and approachingthe 75th percentile level for all Americans, as indicatedby DBP metabolite measured.
Figure 1 shows the sum total of the seven phthalatecompounds measured in each of the Maine studyparticipants. Six people had total phthalate levelsthat exceeded the national median for the same seven
16
The Chemicals

phthalate compounds. The data in Figure 1 arecreatinine-corrected. That means they are normalizedto the levels of a protein normally found in urine sothat the results are not biased by dilution fromdrinking lots of fluids before the test.
In our study, the seven women who reportedusing perfume at least once every three days hadhigh levels of phthalates in their urine. Perfume andother scented products are known to containphthalates. An independent testing of name-brandbeauty products in 2002 found phthalates in 52 of72 products, none of which listed phthalates as aningredient, although all 17 products labeled with“fragrance” contained phthalates.14
Vi Raymond’s total phthalate level was over twicethe group median. She reported using perfume atleast every three days. In contrast, Amy Graham, whohad the lowest total phthalate level of the nine womentested, did not report using perfume or any productsthat are known to contain phthalates.
HEALTH EFFECTS: Male Reproductive DamageTops Concerns
Phthalates are hormone-disrupting chemicals thatthreaten reproductive health, especially in males. In2004, a scientist at University of Rochester found thatbaby boys whose mothers were exposed to high levelsof phthalates during pregnancy were more likely tohave altered genital development.15 Animal tests showthat phthalate exposure leads to small or otherwiseabnormal testes, hypospadias (abnormal urinaryopenings on the penis) and undescended testes inyoung males.16 Researchers believe that the phthalatesthat have these effects, such as DEHP and DBP, act byreducing levels of testosterone and important growthfactors in young males. In adult males, phthalateexposure has been linked to lower sperm counts, reducedsperm motility, and damaged sperm.17
Other potential effects include reduced femalefertility18 and premature breast development in younggirls,19 liver and kidney damage and asthma.20 EPA classifiesthe phthalate DEHP as a probable human carcinogen.21
17
Figure 1: Phthalate monoester levels, measured in urine and creatinine-corrected
Phthalates in Maine People
CRE
ELEY
DO
W
DIN
GLE
Y
GRA
HA
M
KETT
ELL
LIBB
Y
PIN
GRE
E
L. R
AYM
ON
D
V. R
AYM
ON
D
ROU
X
SCH
MID
T
STIR
LIN
G
WIL
SON
tota
l pht
hala
tes
(pp
b in
urin
e)
800
600
400
200
0
national median(CDC 2005)

Policy Changes Needed
Given widespread human exposure to phthalatesand the threat of reproductive harm, government andindustry action is needed to eliminate their use inPVC plastics and beauty products.
A large number of hospitals, consumer productcompanies, and government purchasers have takenfirst steps to replace PVC plastics containing phthalateswith safer alternatives. Revlon, L’Oreal and other majorcompanies are phasing out phthalates in nail polish,and 300 cosmetic companies have pledged to eliminatephthalates in their products in response to consumerdemands from the Campaign for Safe Cosmetics.
In 2005, the European Union banned six phthalatesofteners in PVC plastic toys that can be placed inchildren’s mouths, following restrictions on threephthalates in toys imposed in 1999, and prohibitedthe use of some phthalates in cosmetics in 2003.Mexico, Japan, and Canada have also taken actionon the chemicals.
In contrast, phthalates remain largely unregulatedin the United States. The U.S. Food and DrugAdministration (FDA) has failed to take action oncosmetic and medical uses of phthalates, citing a lackof compelling evidence that phthalates pose a safetyrisk.22 FDA has, however, encouraged medical providersto voluntarily switch to alternative products that donot contain phthalates. The City and County of SanFrancisco adopted an ordinance to restrict the use of
phthalates in children’s products. Similar statewidelegislation is under consideration in California, Maine,and other states.
Reducing Your Exposure to Phthalates
While market trends and personal actions byconsumers are not likely to dramatically reducephthalate exposure without coordinated policy actionby state and federal governments, there are ways youcan reduce your family’s exposure to phthalates.
Avoid PVC plastic. Unless made by a U.S.manufacturer who has indicated the product isphthalate-free, avoid soft plastic toys and soft vinylproducts with a strong plastic smell such as plasticshower curtains. For information on PVC-free productsfor the home, office, and building materials, check outthe resources available at: http://www.preventharm.org/take.buyg.shtml#pvc.
Purchase phthalate-free beauty products. Avoidnail polish, perfumes, colognes, and other scentedproducts that are labeled as containing phthalates.Since many products simply list “fragrance” as aningredient, avoid those products or do more research.For more information on phthalate-free cosmetics andpersonal care products, visit these Web sites:http://www.safecosmetics.org, by the national Campaignfor Safe Cosmetics, and http://www.ewg.org/issues/cosmetics/virtualdrugstore.php, a database oncosmetic products and their ingredients byEnvironmental Working Group.
18

PBDEs—the Toxic Flame RetardantsPolybrominated diphenyl ethers (PBDEs), a major
class of brominated flame retardants (BFRs), are addedto plastics and synthetic fibers in TVs, computers andother plastic-encased electronics, mattresses,upholstered furniture, foam cushions, curtains, andhair dryers, to slow the spread of fire. Maine and otherstates have recently banned two commercial PBDEproducts known as Penta and Octa, and Maine isconsidering legislation to replace the most widelyused PBDE mix called Deca with safer alternatives.
About 49 million pounds of Deca, or nearly halfthe world’s production, was added to consumer productsin North America in 2001. Deca can make up 10 to15% of the plastic casing of a television and 18 to27% of upholstery fabrics by weight.23 Because PBDEsare not chemically bound to plastics, they leach outof the products over time. For example, older computersand automobiles can release PBDEs into the air.24 WhenDeca leaches out of products, it is converted bysunlight into more toxic forms.25
The alarm on PBDEs was sounded in 1998 whenSwedish scientists first determined that these chemicalswere increasing rapidly in human breast milk.26
(Breastfeeding is still best—see Box.) Today, PBDEsare being found virtually everywhere scientists look—in indoor air and household dust,27 in food,28 breastmilk29 and umbilical cord blood.30 Children and adultsin the United States have 10 to 40 times more PBDEsin their bodies than people living in Europe31 or Japan,32
because the U.S. is the largest consumer of PBDEflame retardants in the world.33
PBDEs in Maine People
Figure 2 shows that a wide range of PBDEs weredetected in all 13 Maine participants, from 6.8 partsper billion (ppb) to 59 ppb. We found 28 differentcongeners of PBDEs out of the 46 that we tested for
in blood. (Congeners are similar types of chemicalcompounds; there are 209 possible PBDE congeners).The PBDE levels found in Maine people were generallycomparable or somewhat lower than those found inother studies. Two of the PBDEs that are breakdownproducts of Deca, known as BDE-153 and BDE-183,were higher in Maine participants than in similarsmall studies in Washington and California.
Bettie Kettell had the highest individual bloodlevel of total PBDEs, at three times the group median.She works in Surgical Services in a recently constructedcommunity hospital containing new rugs, drapes, andfurniture. Her department has a large amount ofequipment, including computers and monitors. Thismight explain her exposure levels since commercial
19
Breastfeeding is Still the Best for Babies
While researchers have found PBDEs and otherchemicals in breast milk, mothers should notbe discouraged from breastfeeding. Breastmilk is still the best food for babies. Infants whodo not breastfeed or do so for only a shorttime have more acute illness such as ear, lung,and urinary infections. Exposure to foods otherthan human milk in the first few months of lifecan increase the risk of life-long autoimmuneillnesses. Without breastfeeding, infants do notreceive optimal nutrition, important hormones,protective immune factors, and promoters ofbrain development. Formula feeding doesnot eliminate children’s exposure to toxicchemicals and may increase exposure dueto contaminants and leaching of chemicalsfrom plastic baby bottles.
For more information, see Why Breast-Feedingis Still Best for Baby, by Physicians for SocialRespons ib i l i ty at ht tp://psr. igc.org/BFeasyeng2pg.10.18.pdf. Adapted fromWashington Toxics Coalition.
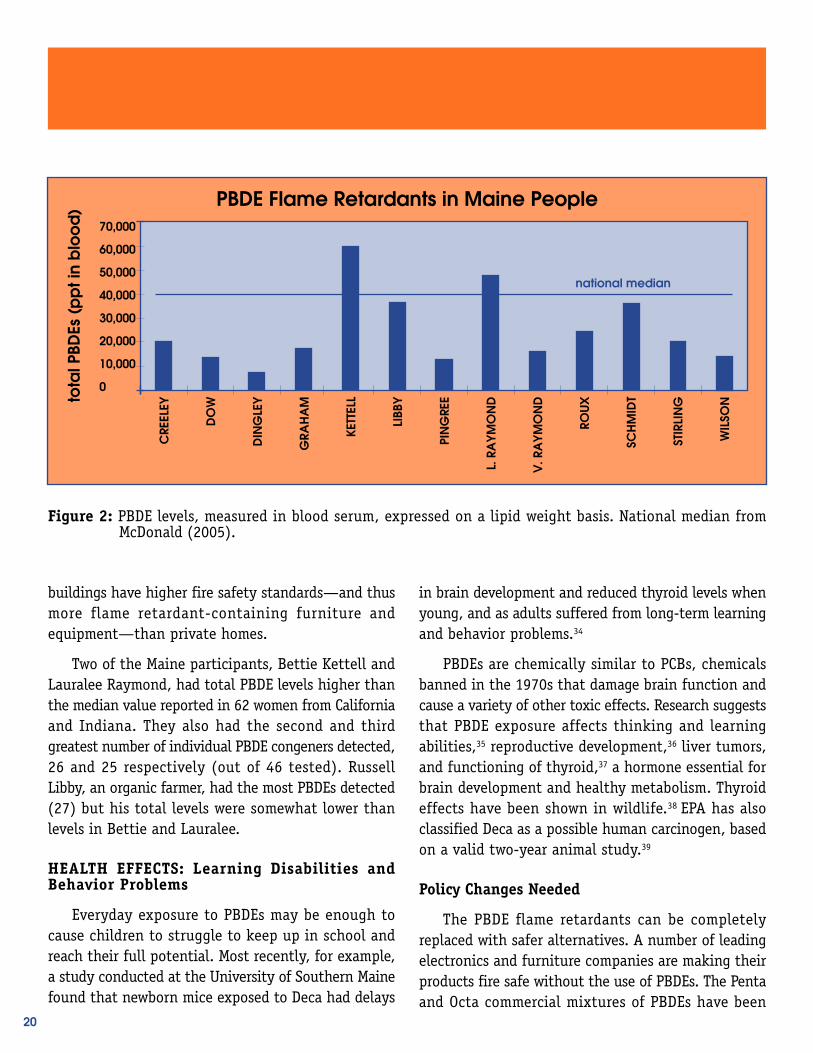
buildings have higher fire safety standards—and thusmore flame retardant-containing furniture andequipment—than private homes.
Two of the Maine participants, Bettie Kettell andLauralee Raymond, had total PBDE levels higher thanthe median value reported in 62 women from Californiaand Indiana. They also had the second and thirdgreatest number of individual PBDE congeners detected,26 and 25 respectively (out of 46 tested). RussellLibby, an organic farmer, had the most PBDEs detected(27) but his total levels were somewhat lower thanlevels in Bettie and Lauralee.
HEALTH EFFECTS: Learning Disabilities andBehavior Problems
Everyday exposure to PBDEs may be enough tocause children to struggle to keep up in school andreach their full potential. Most recently, for example,a study conducted at the University of Southern Mainefound that newborn mice exposed to Deca had delays
in brain development and reduced thyroid levels whenyoung, and as adults suffered from long-term learningand behavior problems.34
PBDEs are chemically similar to PCBs, chemicalsbanned in the 1970s that damage brain function andcause a variety of other toxic effects. Research suggeststhat PBDE exposure affects thinking and learningabilities,35 reproductive development,36 liver tumors,and functioning of thyroid,37 a hormone essential forbrain development and healthy metabolism. Thyroideffects have been shown in wildlife.38 EPA has alsoclassified Deca as a possible human carcinogen, basedon a valid two-year animal study.39
Policy Changes Needed
The PBDE flame retardants can be completelyreplaced with safer alternatives. A number of leadingelectronics and furniture companies are making theirproducts fire safe without the use of PBDEs. The Pentaand Octa commercial mixtures of PBDEs have been
20
PBDE Flame Retardants in Maine People
CRE
ELEY
DO
W
DIN
GLE
Y
GRA
HA
M
KETT
ELL
LIBB
Y
PIN
GRE
E
L. R
AYM
ON
D
V. R
AYM
ON
D
ROU
X
SCH
MID
T
STIR
LIN
G
WIL
SONto
tal P
BDEs
(p
pt i
n b
loo
d)
national median
70,000
60,000
50,000
40,000
30,000
20,000
10,000
0
Figure 2: PBDE levels, measured in blood serum, expressed on a lipid weight basis. National median fromMcDonald (2005).
banned in Maine and eight other U.S. states andthroughout the European Union, and manufacturershave withdrawn them from production.
Government action is needed to phase out the useof Deca-BDE. In the European Union, the commercialDeca formulation can not be sold because it containsbanned PBDEs and is therefore in violation of theRestriction on Hazardous Substances for electronicsand electrical equipment, which went into effect onJuly 1, 2006. The temporary regulatory exemptiongranted to pure Deca has been challenged in theEuropean Court of Justice by the European Parliamentbecause the European Commission failed to considerthe availability of safer alternatives.
Sweden has banned the use of Deca in textiles(furniture, mattresses, drapes, etc.) and for other usesnot covered by European-wide directives on electronicsand automobiles. Other European countries areconsidering a similar approach.
The use of Deca in electronic casings, mattresses,and home furniture will be prohibited in Washingtonstate under a new law enacted in 2007. Legislationin Maine, LD 1658, will implement the goal adoptedby law in 2004 to phase out similar uses of Deca infavor of safer alternatives. Deca phase-out legislationhas also been introduced in California, Illinois,Michigan, Montana, Hawaii, Minnesota, andMassachusetts.
It is encouraging that PBDE levels in Swedishbreast milk began to decrease after PBDE use wasreduced. Following this lead, Maine law now prohibitsthe sale of products containing the highly toxic Pentaand Octa PBDEs and requires the state to phase outsales of Deca if safer alternatives are available. Becauseflame retardants can reduce the risk of some householdfires, finding safer flame retardants is an importantstep in eliminating PBDEs from the market.
A report by the University of Massachusetts
concluded that non-halogenated alternatives to Deca-BDE (i.e., those not containing bromine or chlorine)are widely available, effective, and affordable forelectronic enclosures (e.g., the plastic cases of TVs)and textiles.40 The phosphate-based flame retardantssuch as RDP enable televisions to meet the highestfire safety standard without Deca, and are alreadyused by leading TV and computer manufacturers. Arecent independent analysis of three flame retardantchemicals concluded that RDP is safer than Deca, andis preferable as we search for even greener solutionsthat ensure fire safety and environmental publichealth protection.41
The Maine Department of Environmental Protection(DEP) recently noted in a report to the Legislaturethat safer alternatives are available for TV cabinetsand textiles, the applications that consume mostDeca, and that there are no significant costs ortechnological barriers preventing this change. TheDEP recommends that the state ban the sale oftelevisions and other consumer electronics thathave plastic casings containing Deca effectiveJanuary 1, 2012, and should ban the sale ofmattresses and upholstered furniture that containDeca after January 1, 2008.42
Reducing Your Exposure to PBDEs
You can take steps to reduce your family’s exposureto PBDEs, including:
Buy PBDE-free furniture and electronics. Sinceproducts do not have to be labeled, it is difficult toknow what individual items are free of PBDEs. Furniturewithout brominated flame retardants is available fromIKEA and Herman Miller. Many of the leading electronicscompanies are using alternative flame retardantchemicals. For example, televisions made by Sony,Phillips, Panasonic/Matsushita, and Samsung arenow all Deca-free. For further information, visithttp://www.safer-products.org.
21

Consider housecleaning with a high efficiencyvacuum. These are expensive but filter out dust muchbetter than conventional vacuum cleaners. About 80%to 90% of PBDE exposure of Americans is thought tocome from household dust contamination.
Reduce animal fats and avoid farmed salmon. MostPBDEs are fat-loving food chain contaminants. Chooselean cuts of meat and low-fat or non-fat dairy products.Choose wild salmon over farmed salmon since it islower in PBDEs and other contaminants such as PCBsand dioxins.
22

PFCs—The Stain-Resistant TeflonChemicals
Perfluorinated chemicals (PFCs) are syntheticchemicals designed to repel grease and water. Usedsince the 1950s in a wide range of consumer products,PFCs have been used more recently as stain- resistantcoatings such as Scotchgard and Stainmaster forcarpets, couches, and other upholstered furniture andautomobile seats; to make water-repellent fabrics likeGore-Tex; and now in popular clothing lines like GapKids, Dockers, and Levis.44 They are also used to makeTeflon coatings for non-stick cookware and grease-resistant food packaging and paper products (foodwrap, microwave popcorn bags, French fry boxes,candy wrappers, etc.). Personal care products includingmakeup, moisturizers, and dental floss may alsocontain PFCs.
The most widely used and studied among the manydifferent PFCs are the chemicals known as PFOS(perfluorooctane sulfonate) and PFOA (perflurooctanoicacid). The use of these two chemicals has led towidespread contamination of people and theenvironment. Perfluorinated chemicals are extremelypersistent. PFOA, which is used to make Teflon andis a breakdown product of stain- and grease-proofcoatings, does not degrade at all. It has a half-life inthe human body of more than four years. Other PFCsbreak down and turn into PFOA. PFOS, which was inthe Scotchgard formulation until 2000, has a half-life of more than eight years. Exposure appears to becontinually renewed through daily contact.
Humans are exposed through contaminated water andfood, including fish,45 and by breathing contaminated air.46
When Teflon pans are heated, such as during cookingor when discarded products are burned in incinerators,toxic greenhouses gases are produced.47 The PFCs buildup in the bloodstream and liver,48 umbilical cord blood,49
and breast milk.50 In a 2001 study by 3M company,PFOA was found in 96% of 598 children tested in 23
states and the District of Columbia.51 3M discontinuedproduction of PFOS in 2001, though other PFCs maydegrade into PFOS over time.
PFCs in Maine People
Figure 3 shows that all of the Maine participantswere found to have perfluorinated chemicals in theirblood. We found six different perfluorinated chemicalsof the 13 PFCs that we tested. PFOS and PFOA werethe only PFCs that were detected in every Mainer. SeeTable 2 in the Appendix for complete results.
PFOS was detected at the highest level amongMaine participants, with a median value of 14.2 ppb.This is lower than the mean estimate for PFOS in anational study of more than 900 people tested in2001 and 2002. This could reflect a decline in PFOSexposure since production and its use in Scotchgardceased in 2001. See Table 3 for comparisons.
The median PFOA level among the tested Mainersfalls within the national average range for men andwomen. Three of the other PFCs related to PFOA werefound at levels above the average or median levelsreported in other studies, while PFOA levels wereabout average.
State Senator Dana Dow had the highest total PFClevel, which was over three times the group median,and the greatest number of PFCs detected—sixcompounds. Senator Dow’s levels were more than twicethe national average levels for PFOA and relatedcompounds, and for PFHxS (used in carpet treatment).Dana owns a furniture store, and he says that in thepast he would spray some furniture in his store withPFC-containing stain-repellent products. He also sayshe often has new furniture in his home.
HEALTH EFFECTS: Persistent Chemicals PoseMultiple Health Risks
These stain-resistant, non-stick chemicals have
23

been around for decades but have been under scrutinyonly recently, and there are few studies of whetherlow doses of PFCs cause health effects in people. Astudy of men who had worked in jobs where theywere exposed to PFOS found a high rate of deaths dueto bladder cancer.52 Laboratory animal studies showthat PFOA and PFOS damage the liver and otherorgans, cause immune disruption, endocrine effects,reproductive harm, and developmental defects.53
However, unlike humans, laboratory rats rid theirbodies of the chemical in days rather than years.
In response to evidence that PFOA causes testicular,pancreatic, mammary and liver tumors in rats, andincreases worker risks of cancer, in January 2006 anexpert panel of the Environmental Protection Agency(EPA) upgraded PFOA to a “likely human carcinogen.”They described the chemical as an indestructible toxicchemical group that pollutes nearly every American'sblood. The panel urged the EPA to adopt stricterguidelines to protect human health.54
Policy Changes Needed
Under pressure from the EPA, the 3M Companyhalted production of PFOS-containing products in2001, reformulating their Scotchgard product tominimize the release of PFCs into the environment.However, non-U.S. producers continue to manufacturePFOS. In 2006, the EPA signed a non-binding voluntaryagreement with DuPont, 3M, and six other chemicalcompanies to reduce PFOA from emissions and productcontent by 95% by 2010, with the ultimate goal oftotal elimination by 2015. PFOA and related chemicalsare still used to manufacture Teflon and Gore-Tex.
While these steps represent tremendous progress,they will not by themselves fully protect public healthand the environment from PFCs. Scientific evidencereveals that a wide variety of PFCs that remain in usebreak down over time into both PFOA and otherpersistent PFCs. For example, EPA cites a growing bodyof data indicating that PFCs known as fluorotelomeralcohols degrade or breakdown into PFOA.55
24
Perfluorinated Chemicals in Maine People
CRE
ELEY
DO
W
DIN
GLE
Y
GRA
HA
M
KETT
ELL
LIBB
Y
PIN
GRE
E
L. R
AYM
ON
D
V. R
AYM
ON
D
ROU
X
SCH
MID
T
STIR
LIN
G
WIL
SONto
tal P
FCs
(pp
b in
blo
od
)
80
60
40
20
0
men
National mean,(CDC 2001 - 2001)
women
Figure 3: Total PFC levels, measured in blood serum.

Government should review all remaining PFCs andtake action to replace any found to be persistent orthat break down into persistent PFCs. Health andsafety testing should be required for all PFCs andbiomonitoring expanded to determine the extent ofhuman exposure.
Reducing Your Exposure to PFCs
To reduce personal exposure, which has not beenwell studied, avoid purchasing or at least minimizeuse of products containing PFCs. Consider these tips:
Reduce greasy packaged foods and fast foods inyour diet. The packaging for food like microwavepopcorn, French fries, and pizza are often treatedwith grease-resistant coatings.
Avoid stain-resistant furniture and carpets. Decline
optional treatments and ask for products that havenot been pretreated.
Avoid Teflon or non-stick cookware. If you chooseto use non-stick cookware, do not overheat or burnpans, as chemicals can be released when they reach450ºF,56 and discard pans when they get scratched.The fumes from overheated Teflon are deadly topet birds.
Choose alternatives to clothing with Teflon labelsor treated for water or stain-resistance. Many of thetreated outerwear and gear are coated with PFCs.
Look out for personal care products. PFCs are addedto some cosmetics (nail polish, moisturizers, and eyemakeup), shaving cream, and dental floss. Avoid thosethat have ingredients that include the words “fluoro”or “perfluoro.”
25

Bisphenol A—the Hormone-DisruptingPlastic Building Block
Bisphenol A (or BPA) is a high-volume industrialchemical used as a monomer (or chemical backbone)to make polycarbonate plastic, which is widely usedin reusable water bottles, baby bottles, pacifiers,plastic utensils, children’s toys, compact discs, andcertain microwaveable and reusable plastic containers.BPA is also used in some dyes, enamels, varnishes,flooring, adhesive, fungicides, antioxidants, dentalsealants and artificial teeth. A chemical derivativeof BPA called bisphenol A diglycidyl ether (BADGE)is used to make epoxy resins which are widely usedin many applications. Human exposure to bisphenolA (and BADGE) results from the use of BADGE in theclear lining of metal food and drink cans, and fromsome dental sealants and composite dental fillings.
Over time, bisphenol A migrates from cans intofood57 and leaches from polycarbonate plastic bottles,especially when the plastic is heated or as it ages.58
As evidence of the chemical’s “leaky” nature, BPA hasbeen found in 40% of stream water samples surveyedby the U.S. Geological Survey.59 Humans are exposedthrough ingesting contaminated food, liquids andbreast milk, and during some dental procedures.
Bisphenol A in Maine People
We tested the blood of our Maine participants forboth bisphenol A and for a metabolite of BADGEknown as BADGE-4OH which forms in the body. SinceBPA and BADGE are not persistent in the body,detection reflects recent exposure.
Figure 4 shows that bisphenol A was found inthree women of the Mainers tested, at levels rangingfrom 3.75 to 6.64 parts per billion. These results rangefrom six to ten times greater than the average bloodlevels of BPA reported in one study of 14 womenpublished in the scientific literature, and were also
higher than the median and average in two othersmall studies (see Table 3 in the Appendix).
The related BADGE metabolite was found in fiveof the Maine participants, including the same threepeople with detectable levels of BPA in their blood.The two highest of the five reported Maine levels forBADGE-4OH (59.7 ppb and 119 ppb) were more thanfive to ten times greater than the geometric meanlevel of about 9.33 parts per billion resulting fromone other small study (see Table 3).
Vi Raymond and Elise Roux had the highest levelsof bisphenol A and BADGE exposure. Their resultswere significantly higher than the average levelsreported elsewhere. We cannot explain their elevatedlevels of bisphenol A and its related compound basedon their exposure surveys. The fact that these chemicalshave been used in a multitude of products makes itdifficult to determine the source of exposure.
HEALTH EFFECTS: Ultra Low-Dose Hormone Disruptor
Bisphenol A is a potent endocrine disruptingchemical in lab animals at very low doses60 that issuspected of causing reproductive damage61 and birth
26
High school soccer goalie Elise Roux (left) had the highest level ofBisphenol-A detected in this study—ten times the national average.

Figure 4: Bisphenol A and BADGE levels, measured in blood serum. The horizontal line is the mean BPA levelfor women (Takeuchi, 2002). ND = none detected.
defects62 that may lead to prostate63 and breast cancer.64
Studies have found that BPA can have adverse healtheffects at levels thousands of times lower than whatthe EPA considers safe. According to the low dosehypothesis, small and repeated exposures to bisphenolA can have an amplified effect on the human bodyby mimicking human sex hormones, or promoting cellproliferation.65 Bisphenol A has been found to causeestrogenic changes in animal cells at the sameconcentrations that are found in pregnant womenand their fetuses.
Controversy over toxicity exists between publichealth advocates and the plastics industry, whichdescribes bisphenol A as a weak estrogen, and saysthere is little concern with human exposure levels.Between 1998 and 2005, 115 studies of BPA werepublished. None of the 11 studies funded by industryreported adverse effects at low level exposures, whereas94 of 104 government-funded studies found statisticallysignificant effects on animals. Adverse effects were
found at levels to which many people in the U.S. arecurrently exposed, levels much lower than the EPA'scurrent acceptable level.66
Much less is known about the risks of exposureto BADGE. Environmental Working Group cites researchsuggesting strong evidence of hormone activity withlimited evidence of other health concerns. They alsocite a study showing that in the human body, BADGEcan break down into BPA, which raises concerns aboutthe compound’s toxicity.67
Policy Changes Needed
Growing scientific evidence on the health effectsof very low doses of bisphenol A merits a much moreprotective Reference Dose (like a safety standard)than currently supported by U.S. EPA. It will benecessary to further reduce public exposure tobisphenol A.
The City and County of San Francisco banned the
27
Bisphenol A and BADGE in Maine People
CRE
ELEY
DO
W
DIN
GLE
Y
GRA
HA
M
KETT
ELL
LIBB
Y
PIN
GRE
E
L. R
AYM
ON
D
V. R
AYM
ON
D
ROU
X
SCH
MID
T
STIR
LIN
G
WIL
SON
BPA
(p
pb
in b
loo
d)
BAD
GE-
4OH
(p
pb
in b
loo
d)
140
120
100
80
60
40
20
0
7
6
5
4
3
2
1
0
ND ND ND ND ND ND ND ND
BPA
BADGE-4OH

manufacture, sale, and distribution of child carearticles and toys containing bisphenol A and somephthalates for children under three years old as ofDecember 1, 2006.68 Under the ordinance, San Franciscomanufacturers of baby bottles, pacifiers, and toys foryoung children must replace BPA and phthalates withthe least toxic alternatives. A similar measure wasintroduced in the California Legislature in 2006 but failedto pass. Similar legislation is pending in several statesincluding Maine. All of these policy initiatives have beenaggressively challenged by the chemical industry.
A similar concerted effort is needed by governmentand product manufacturers to switch to safersubstitutes for uses of polycarbonate plastic and epoxyresins that may expose the fetus and young childrento bisphenol A and BADGE.
Reducing Your Exposure to BPA
Bisphenol A has been used as an ingredient inconsumer products for a long time, and is difficult toavoid. In some cases, alternatives are available.69
Consider these tips, especially if you are or maybecome pregnant or are parents choosing for a child:
Avoid reusable plastic water and baby bottles.Most Nalgene reusable water bottles are made of
polycarbonate plastic that leaches bisphenol A intothe water. Use polyethylene or aluminum bottlesinstead. Use glass baby bottles instead of plastic.Discard old or damaged bottles.
Avoid polycarbonate plastic food containers andtable ware. These may be labeled ‘PC’ underneath aplastic code #7 in the recycling triangle on the bottomof the container. (The #7 means ‘other’, so you need tosee the ‘PC’ to confirm that the plastic is polycarbonate).
Minimize the use of canned foods and canneddrinks. Until industry reformulates the laquer liningof metal cans (as is being done in Japan), choosefresh or frozen foods or glass containers or bottles.A recent study by Environmental Working Group foundbisphenol A in more than half of 97 cans of brand-name fruit, vegetables, soda, and other commoncanned goods.70
Ask your dentist for BPA-free sealants and compositefillings. Some dental resins are free from or low inBPA and BADGE. Ask your dentist if they know aboutBPA and request the MSDS sheet (Material Safety DataSheet) for the sealants or composite fillings to lookfor BADGE in the list of ingredients. Make sure yourfamily brushes and flosses regularly to prevent theneed for dental work!
28

METALS—The Age-Old Poisons
LEADLead is a natural metallic element that occurs in
rocks and soils and has been put to industrial use fora few thousand years. Lead has been used in metalalloys, paint, batteries, solders, ceramic glazes, bullets,metal toys, and building materials. Currently, mostlead exposure comes from old lead paint dust fromMaine homes built before 1978. Sanding or burningold paint during renovations dramatically increasesexposure, which also results from normal wear andtear around lead-painted window frames and doorways Water pipes in some older homes may contain leadsolder that can leach out into the water. Other sourcesof lead exposure include making and firing ammunition,handling lead-containing plastics, metal products, andlead acid batteries. Some cosmetics and folk remedieshave been found to contain lead. Many PVC (vinylplastic) products can contain lead, including electricalwires and cables, mini-blinds and children’s lunch boxes.Handling these products can result in lead exposure.Lead can also be released to the environment fromdisposal of PVC products, television sets, and oldercomputer monitors in landfills and incinerators.
Exposure to lead can occur from breathingcontaminated air or dust, eating contaminated foods,or drinking contaminated water. Children can be exposedfrom eating lead-based paint dust or playing incontaminated soil. Children from low-income familiesor who live in older homes are especially at risk.
Lead in Maine People
Lead was measured in the blood of twelve of theMaine participants (one sample was lost). The Maineresults were generally below or near the median (ormiddle value) of the blood lead results for nearly 9,000randomly selected Americans tested by the federalCenters for Disease Control and Prevention (CDC).
The blood lead level tends to indicate an exposurethat occurred during the previous three to five months.However, these results could reflect recent exposuresto lead or residual exposure from cumulative exposureto lead over a lifetime.
Lead bioaccumulates in bone as a result of exposureto multiple sources over time. Lead in the blood istaken up by the bones or is very slowly excreted, soonce exposure to lead stops, the blood lead level willdecrease gradually over the following months. Adultswho were exposed to high levels of lead as childrenwhen leaded gasoline and paint were in widespreaduse still have lead stored in their bones. Bone leadleaches out over a period of years or less duringpregnancy and in conditions of high bone turnoversuch as osteoporosis. This lead leaching from bonemay be a factor in the lead levels seen in this survey.
HEALTH EFFECTS: Lowered Intelligence and LifelongHealth Threats
The toxic nature of lead has been well known forhundreds of years, with childhood lead poisoning
29
While renovating their 85-year-old home in downtown Bangor,Denyse and her family were exposed to lead dust from old paint.Since then, her family's lead levels have decreased, and Denyse hasspoken out to improve education about lead poisoning prevention.

from lead paint first documented a century ago. Yetadults and especially children continue to be exposedto this dangerous metal. The toxic effects of lead arewell documented in both children and adults.
Lead causes damaging health effects at extremelylow doses, and the main target is the central nervoussystem. Recent research shows that accumulated bonelead also leaches out faster during pregnancy andbreastfeeding, exposing the fetus and infant to higherlead levels. Proven harmful effects include impairedbrain development, premature births, smaller babies,learning difficulties, and reduced growth in youngchildren. Children exposed to lead at a young age aremore likely to suffer from shorter attention spansand are less able to read and learn than their peers.71
Studies in children show that reducing blood leadlevels by 10 ug/dL significantly raises the IQ by anaverage of 2.6 points, which across a large populationhas a huge effect.72
Lead in adult bones leaches out over years and is
one of the risks for hypertension. Long-term exposureof adults can result in decreased mental performance,or cause weakness in fingers, wrists, or ankles. Besidesaffecting the brain, lead exposure also causes kidneydamage, anemia, increased blood pressure in olderadults, and ultimately death. High-level exposure inmen can damage the organs responsible for spermproduction, and in pregnant women may causemiscarriage.73 Workers in construction, police protection,and other industries are at especially high risk of adultlead poisoning.74
The federal government has concluded that leadand lead compounds are “reasonably anticipated tobe human carcinogens,” due to increased lung andstomach cancer in humans and cancer of the kidney,brain and lung in lab animals.75
Policy Changes Needed
Had the warnings of public health scientists beenheeded in the 1920s, leaded gasoline would have never
Figure 5: Lead levels, measured in whole blood.
30
Lead in Maine People
CRE
ELEY
DO
W
DIN
GLE
Y
GRA
HA
M
KETT
ELL
LIBB
Y
PIN
GRE
E
L. R
AYM
ON
D
V. R
AYM
ON
D
ROU
X
SCH
MID
T
STIR
LIN
G
WIL
SON
lea
d (
ug/d
L in
blo
od
) 4
3
2
1
0
national median(CDC 2005)
entered the marketplace and the use of leaded paintwould have ended 50 years earlier in the United States.76
In a triumph of politics and profits over public health,an epidemic of lead poisoning ensued through thetwentieth century, resulting in many deaths anddisabilities in both children and adults. Althougheliminating the use of lead in gasoline and paint bythe late 1970s also marked one of the great publichealth successes of the last century, the toxic legacyof low-level lead poisoning continues to this day.
Average blood lead levels in American children havedropped by 85% since unleaded gasoline was firstintroduced in 1979, when the average U.S. child leadlevel was 16 ug/dL. Still, the U.S. Centers for DiseaseControl and Prevention estimates that more than300,000 American children remain at risk of beingexposed to harmful lead levels.77 And the latest scienceshows toxic effects on childhood brain development atlevels much lower than the current federal action levelof 10 ug/dL of lead in blood, suggesting that there isno safe level of exposure to lead.78
Therefore, policy action is needed to eliminatecurrent exposures to lead and remaining uses of leadin commerce. Maine has begun to make recent progressto further reduce lead. Legislation enacted in 2005creates a lead-poisoning prevention fund for educationand outreach programs aimed at reducing lead exposure.And, as of January 1, 2006, cathode ray tubes fromcomputer monitors and televisions, which can containfour to eight pounds of lead, can no longer be thrownin Maine landfills and incinerators. Tubes must becollected and recycled instead.
Much more is needed. Maine should follow theexample of Rhode Island’s successful lawsuit to forcelead pigment manufacturers to pay the enormouscosts of lead cleanup at the 240,000 homes in the
state that still have lead paint. In the interim, allrenovations of lead-painted houses should be requiredto use lead-smart procedures to minimize leadexposures. Unnecessary uses of lead in wheel weights,PVC plastic, ammunition, and other sources shouldbe phased out by law in favor of safer alternatives.
Reducing Your Exposure to Lead
Test for Lead. Children should be tested for lead atage one and two years, and at any age under six yearsof age if they have never been tested. Test soil within20 feet of your house for lead before growing edibleplants. If you have an older home (pre-1978), test yourpainted surfaces and drinking water for lead.
Make your home lead-safe. In a lead-painted home,consider replacing window frames and door frameswhich are a constant source of lead dust. Allrenovations should be done using lead-safe methodspreferably by a certified contractor and at a timewhen young children or pregnant women are notliving in the home. Do not allow children to chew ormouth painted surfaces. If you believe your homecontains lead-based paint, clean the house regularlyof dust and tracked in dirt and wash children’s handsand faces often to remove lead dust. If you have awater lead problem, run water that has been standingovernight before drinking or cooking with it.
Avoid lead-containing products. Some types ofpaints and pigments used in makeup or hair coloringcontain lead. Keep these away from children. Do notuse imported glazed ceramic containers for eating ordrinking. Avoid PVC plastic products. Watch out forcheap jewelry and kids toys that may contain lead.For more information on avoiding lead hazards,see resources at http://www.preventharm.org/take.redu.shtml#aroundthehome.
31

MERCURYLike lead, mercury is another natural metal that
has significantly increased in our environment as aresult of human activities. Most of the mercury inMaine comes from emissions from coal-fired powerplants both near and far. Sources of mercury withinthe state include trash waste incinerators, wood andfuel oil boilers, the breakage and disposal of mercury-containing products such as fluorescent light bulbs(including compact fluorescents), thermostats andthermometers, and dental amalgam fillings. Mercury isreleased into the air, where it drifts with prevailingwinds and falls out of the sky in dust, rain, and snow,and settles onto land or the ocean. Once on land,mercury is washed into streams and lakes, where it isconverted to its more toxic and available form,methylmercury, and builds up in the food chain.
We are exposed to mercury mainly by eatingcontaminated fish, especially tuna but also shark,swordfish, tilefish, and king mackerel, which have thehighest concentrations of mercury. Elemental mercurycan also be directly inhaled from broken thermometers,dental fillings, and fluorescent bulbs.
Mercury in Maine People
Mercury was detected in the hair of all 13 Maineparticipants, indicating exposure to mercury over thepast four to six months. Fish consumption is thelargest source of individual mercury exposure, andthis fact may shed some light on the study results.
Mercury levels in these Mainers (median 396 ppb)were generally higher than the national median (200ppb) reported for 702 women of childbearing age (seeFigure 6). Every one of the five Maine women ofchildbearing age had mercury hair levels greater thanthe national median level (see Tables 2 and 3).
The amount of methylmercury measured in thehair of House Majority Leader Hannah Pingree was
above the U.S. EPA-established reference dose formercury, which is the level above which the developingbrain of the fetus may be harmed due to maternalmercury exposure. Hannah Pingree, Elise Roux, andLauralee Raymond all reported eating tuna in sushior swordfish at least twice a month, which may explaintheir elevated mercury levels.
Eric Stirling had the highest mercury level in thegroup, a level much greater than the national median.Eric reported that he commonly ate fresh-caughtbrook trout. While brook trout are not usuallyconsidered to be high in mercury, it is possible thatEric’s lifestyle as a sporting camp owner means heeats more local, freshwater fish than the averageMainer. It’s also possible that Eric fishes in streamsor ponds that are particularly polluted with mercury,but such analysis was not part of this study.
HEALTH EFFECTS
Mercury is a potent neurotoxin. Responsible for“mad hatter” syndrome, mercury can cause birthdefects and brain damage, learning disabilities, lossof vision and blindness, kidney damage, numbness,
32
Eric had the highest mercury level in the group, a level much greaterthan the national median.

and lack of coordination. The developing brain ofbabies in the womb, nursing infants and children areespecially vulnerable to mercury. The adverse effectsof prenatal mercury exposure, even at low levels,include deficits in memory, attention span, motorcontrol, and the ability to learn.79 According to theEPA, eight percent of women of childbearing age inthe U.S. have elevated blood mercury levels of concernfor fetal development.80 The EPA estimates that 630,000infants born each year in the United States are atrisk for neurological damage from exposures tomethylmercury.81
Policy Changes Needed
The policy goal to virtually eliminate mercuryfrom manmade sources was adopted by the NewEngland Governors and Eastern Canadian Premiers in1998. Since then a number of medical wasteincinerators and trash combustors have been closedand many of those remaining have upgraded airpollution controls. Maine has also banned the sale of
many mercury-containing products including bloodpressure monitors, thermostats, and electrical switches;and required that mercury products be labeled andrecycled at the end of their useful life.
Aggressive actions are needed to reduce mercuryemissions from coal-burning power plants and toreduce reliance on coal and fuel oil in favor of low-or no-mercury power and heat sources. More effortsare needed to warn people of hazardous levels ofmercury in swordfish, canned and raw tuna, and otherfish that are higher in mercury or consumed in largequantities. Restaurants and grocery stores should berequired to advise women who may become pregnantand young children to avoid fish high in mercury.
Manufacturer responsibility to pay incentives formercury product recycling needs to be extendedbeyond old automobile switches and thermostats toinclude fluorescent light bulbs and other mercuryproducts. Efforts to replace mercury-containingfluorescent lighting with even more energy efficientdigital lighting should be accelerated.
Figure 6: Methylmercury levels measured in hair
33
Mercury in Maine People
CRE
ELEY
DO
W
DIN
GLE
Y
GRA
HA
M
KETT
ELL
LIBB
Y
PIN
GRE
E
L. R
AYM
ON
D
V. R
AYM
ON
D
ROU
X
SCH
MID
T
STIR
LIN
G
WIL
SON
me
thyl
me
rcur
y (p
pm
in h
air)
2
1
0
Federal risk level for fetal brain development
national median (CDC 1999)

Reducing Your Exposure to Mercury
Eat fish that are low in mercury. Nearly all fishand shellfish contain traces of mercury, but somehave more mercury than others. Women who are ormay become pregnant should avoid eatingswordfish and tuna (canned, steaks or in sushi).(See Maine’s fish consumption advisory and visithttp://www.preventharm.org/take.redu.shtml#eatingfish).
Recycle old mercury products. Contact your townabout the hazardous waste collection schedule forrecycling fluorescent light bulbs, thermostats, andother mercury-containing products. Carefully handlethermometers, fluorescent light bulbs and othermercury products to avoid breakage prior to recycling.Do not vacuum up spilled mercury, because it willvaporize and your exposure will increase drastically.
Support mercury-free dentistry. Ask for compositefillings instead of “silver” fillings or amalgam,which are about 50% mercury. If you have metalamalgam fillings, consider having them replacedwith composite fillings.
Demand that utilities slash mercury from coal burning.Support Maine legislative efforts in conjunction withother New England states to force the federal governmentto reduce mercury emitted by coal fired power plants,as required by the Clean Air Act.
Fish Consumption Advisory
All of Maine's lakes, ponds, and rivers areunder a fish consumption advisory due tomercury pollution. According to the MaineCenter for Disease Control and Prevention,women who are pregnant, nursing, or maybecome pregnant, and children under age8 should eat no freshwater fish from Maine'sinland waters except for one meal per monthof brook trout or landlocked salmon. All otheradults and children older than 8 can eatone to two fish per month from Maine lakesand rivers.82
The State also advises that pregnant andnursing women, women who may getpregnant, and children under age 8 limit theirconsumption of canned light tuna to 2 mealsper week or white tuna to 1 meal per week;all other adults and children age 8 and oldercan eat 2 meals per week of canned tuna.83
Other public health advocates suggest thatpregnant and nursing women should avoidall canned tuna (and tuna in sushi) becausethe advice above will result in mercuryexposures to the fetus that exceed the federalreference dose or safety level establishedto protect the children’s health fromneurotoxicity.84
34

ARSENICArsenic is a common element in the earth’s crust,
occurring naturally in soil and bedrock. Many peoplein Maine are exposed to arsenic by drinkingcontaminated water from bedrock wells. In easternNew England, 20-30% of private wells exceed thearsenic drinking water standard of 10 microgramsper liter.85 Arsenic has also been used in pressure-treated lumber, is still used in industrial applications,and can still be found in decks, playgrounds, and otherstructures. Arsenic was used as a pesticide in Mainebetween 1920 and the late 1960s, and high arseniclevels can still be found in areas of Maine where arsenic-containing pesticides were applied to apple orchards,potato and blueberry fields, and along roadways.
Arsenic in Maine People
The Maine participants exhibited a wide rangeof arsenic levels in urine. The median level of totalarsenic in Mainers (30.7 ppb) was about three timeshigher than the median level reported in a studypublished in the scientific literature (see Table 3).This might be due to relatively greater reliance inMaine on drinking water wells contaminated withhighly toxic inorganic arsenic, or could representrecent consumption of seafood, which contains anessentially nontoxic, organic form of arsenic. (SeeBox on Arsenic’s Complex Chemistry).
Five of the Mainers exhibited above normal totalarsenic exposure levels of greater than 50 ppb inurine (see Figure 7 and Table 2). One of the participantsapproached the total arsenic exposure level consideredexcessive (without consumption of seafood) at 100ppb in urine.
Another participant, Regina Creeley, had the highestlevel of total arsenic at 839 ppb. Regina reported thatshe ate a large meal of mussels prior to her test. Certainseafood including shellfish contributes large amounts
of a non-toxic organic form of arsenic to a total arsenicmeasurement in urine. (See discussion in Box).
Arsenic’s Complex Chemistry
The arsenic story is complicated. We measuredtotal arsenic, which includes at least fivedifferent types of arsenic: the two most toxicforms of inorganic arsenic—arsenic(III)and arsenic(V); two somewhat less toxic,organic forms of arsenic formed in thebody after exposure to inorganic arsenic,monomethylarsinic acid (MMA) anddimethylarsinic acid (DMA); and arsenobetaine—the nontoxic form of organic arsenic foundin shellfish and some other seafood. We alsomeasured total inorganic arsenic, arsenic(III)plus arsenic(V), and we separately tested forthe most toxic form of inorganic arsenic,arsenic(III). We did not measure for MMA,DMA, or arsenobetaine.
When people are exposed to highly toxicinorganic arsenic (from well water or oldpressure treated wood, for example), thatarsenic is metabolized in the body. In just afew days, this biologically transformed arsenicis mostly excreted in urine as, on average, 10to 30 percent inorganic arsenic As(III) andAs(V), 10 to 20 percent MMA and 55 to 76percent DMA.86 [Note: As(III) is the abbreviationfor arsenic(III) and As(V) is short for arsenic(V)].
This complex biochemistry and the limits ofour testing mean that our results underestimateexposure to toxic inorganic arsenic by a factorof three-fold to ten-fold. And, we can’t tellhow much of the exposure to organic arsenic,which is high for several Mainers, is due toMMA and DMA (reflecting exposure to toxicinorganic arsenic) and how much is due tothe nontoxic organic arsenic from seafood,arsenobetaine, which is passed through thebody without being absorbed.
35

While three participants obtained more than 90%of their drinking water from a private well, this wastoo small a group to show a relationship betweenurinary arsenic levels and well water consumption bygeographic area, and participant wells were not testedfor this project.
Denyse Wilson had the highest inorganic arseniclevel in the group, and her total arsenic level was alsoabove the normal exposure level. Denyse does not usewell water, but she does eat herbs and vegetables froma raised-bed garden built in the spring of 2006 usingpurchased soil and older pressure-treated wood. Follow-up testing of arsenic in the soil and municipal watersupply is pending. Lauralee Raymond also had a relativelyhigher inorganic arsenic and total arsenic result.
HEALTH EFFECTS: Potent Cancer-Causing Agent
Long-term exposure to low levels of arsenic in
drinking water has been linked to bladder, lung,kidney, liver, prostate, and skin cancer. The higherthe level of arsenic in the water, the greater the cancerrisk, and cigarette smokers who drink arsenic-contaminated water are the most at risk.87 Maine hasone of the highest rates of bladder cancer in theUnited States. Arsenic can also harm the nervoussystem, heart and blood vessels. EPA classifies arsenicas a human carcinogen.88 Because their bodies areless efficient at processing arsenic, children may bemore susceptible. Arsenic can cross the placenta andhas been found in fetal tissues. Research suggestslong-term exposure to arsenic in children may resultin lower IQ scores.89
Policy Changes Needed
Maine needs a law to require routine testing ofprivate well water for arsenic, especially when a homeis sold or rented. The prevalence of arsenic in Maine
Figure 7: Total arsenic and inorganic arsenic levels, measured in urine. The top horizontal line is the abovenormal exposure of total As (50 ppb; Klaassen 2001); the bottom line is the national median fortotal As (10.23 ppb).
36
Arsenic in Maine People
CRE
ELEY
DO
W
DIN
GLE
Y
GRA
HA
M
KETT
ELL
LIBB
Y
PIN
GRE
E
L. R
AYM
ON
D
V. R
AYM
ON
D
ROU
X
SCH
MID
T
STIR
LIN
G
WIL
SONin
org
ani
c A
s (p
pb
in u
rine
)
tota
l As
(pp
b in
urin
e)120
100
80
60
40
20
0
1.4
1.2
1.0
0.8
0.6
0.4
0.2
0
inorganic AS
total AS
843

groundwater, the potent carcinogenicity of arsenicand the unacceptably low level of public awarenessof the arsenic threat, make this an urgent publichealth issue.
Publicly accessible institutions with old pressure-treated wood structures, such as decking, railingsand playground structures, should be required toreplace them with arsenic-free construction. Ifreplacement is not economically feasible, then thearsenic-treated wood should be coated with a sealanton an annual basis to reduce arsenic exposure oncontact with the wood.
Reducing Your Exposure to Arsenic
Test your well water. Well water is a major sourceof arsenic exposure in Maine. Arsenic-contaminateddrinking water does not smell, taste, or look different;the only way to find out if your well has arsenic isto have your water tested by a certified laboratory.The longer water sits in a well, the more time thereis for arsenic to dissolve into drinking water, so wellsused by seasonal homes and camps may have higher
levels of arsenic. If your water comes from a publicsupply, contact your local water district for the mostrecent arsenic test results. Treatment (or even drillinga new well) is required to remove arsenic fromdrinking water. As of January 2006, the maximumamount of arsenic allowed in public drinking watersystems is 10 parts per billion (0.010 mg/L), a levelprobably not sufficiently protective of public health.
Replace old pressure-treated wood structures. Mainewas among the first states to ban the sale of arsenic-treated wood used in playgrounds and decks in 2003,around the time that a national voluntary ban wasnegotiated. If you can afford it, remove and replacepressure-treated wood structures installed before 2004.These include boards used for vegetable gardens,playgrounds, decks and railings.
Avoid sawing pressure-treated wood. Paint or seal allarsenic-treated wood with a penetrating oil decktreatment. To learn more about what to do if youhave pressure treated wood at home, visit http://www.healthybuilding.net/arsenic.
37

Maine people can now join others across the nationwhose bodies are testament to a chemically-saturatedworld. While Maine seems remote and at times pristine,the Maine people who participated in this survey haveprovided evidence that the byproducts of modern lifepervade our air, water, and food.
What is most unsettling for the projectparticipants is that no one, not even the doctorsleading the study, can explain with any certaintywhy particular chemicals were found in their bodies,why levels of some chemicals are higher than others,or how the chemicals are affecting their health nowor in the future.
However, based on these findings of this surveyof pollution in Maine people and similar studies,we draw a few conclusions:
1. People are routinely exposed to manyhazardous chemicals. All five of the chemicalgroups surveyed were detected in the bodies ofMaine participants, although all chemicals werenot found in all of the people. This representsa partial first snapshot of what chemicals mightbe found in Maine people.
2. These chemicals pose a potentially seriousthreat to human health. While more needs tobe learned about the health effects of chemicalsin humans, review of the latest scientific andmedical research reveals mounting evidencethat these chemicals can harm the health ofadults, children, and the unborn. Several ofthese chemicals are not only toxic but alsopossess other troubling hazardous propertiessuch as being long-lived in the environment(persistent) and building up to high levels inthe food web and our bodies (bioaccumulative).
3. Everyday products and materials are a majorsource of chemical exposure. The chemicalsthat are present in Maine people are also common
ingredients in the products, plastics, and syntheticmaterials that fill our homes and workplaces.From the morning’s shower, through the workday, to the meals we eat and the beds we sleepin at night, we are surrounded by chemical-laden man-made products. Unfortunately, thesechemicals do not stay inside the product. Theyget into the dust, the air and water, the foodsupply, and—as we now know—our bodies.
4. The safety system for industrial chemicalsis broken. Most of these chemicals that enterour environment are manufactured by thechemical industry and added to the thousandsof items in daily commerce that support ourmodern lifestyle. Yet industry is not requiredto prove that a chemical is safe before it ismanufactured, sold, or used in consumerproducts. Nor are product makers required touse the safest alternatives, even when non-toxic substitutes are effective, available andaffordable. Under our current system,thousands of toxic chemicals have been“grandfathered” in without adequate healthand safety testing. And government ishandcuffed with undue burden to prove harmbefore any precautionary actions can be takento prevent chemical exposure. If this systemwere working, we would not find hazardouschemicals in people’s bodies.
RecommendationsTo prevent pollution in Maine people, governmentshould enact comprehensive safer chemicals policyat the state and federal level. Three actions areneeded to close the gaps in our broken chemicalsystem to ensure chemical safety, provide usefuldata, and promote innovative technology. Together,these reforms will revitalize our toxic-dependenteconomy through green chemistry.
38
Conclusions and Recommendations

CLOSE THE SAFETY GAP
• Phase out the most harmful chemicals in favor ofsafer alternatives, for example Deca-BDE inelectronics and furniture, and phthalates andbisphenol A in baby products.
• Search for safer substitutes for all chemicals shownto be hazardous.
• Require that all industrial chemicals be provensafe, especially for children.
CLOSE THE DATA GAP
• Honor the public’s right-to-know which hazardouschemicals are in what products.
• Require manufacturers to provide health and safetydata on all industrial chemicals.
• Require that chemical manufacturers test andprove the safety of all industrial chemicals incommerce.
CLOSE THE TECHNOLOGY GAP
• Invest in research and development (R&D) of bio-based plastics from Maine potatoes and other“green chemistry” solutions that will boost thestate’s economy.
• Establish a Green Chemistry Center for SustainableProduction within the University of Maine Systemto assess hazards and alternatives for harmfulchemicals
Chemical policy reforms at the state and federallevel should allow the continued sale of products andproduction of chemicals only if these safety, data,and technology gaps are effectively closed for industrialchemicals. A safer chemical policy will protect thehealth of the most vulnerable among us.
The Governor’s Task Force on Safer Chemicals inConsumer Products is charged with developing
recommendations for a more comprehensive chemicalpolicy for the State of Maine. The Task Force will issuefinal recommendations to the Governor by October 1,2007. In Maine, this Task Force should advance meaningfulchemical policy reform to ensure that no product soldin the state contains a hazardous chemical for whichsafer alternatives are available, affordable, and effective.
39
What Action Can Individuals Take?
Besides supporting chemical policy reform,consumers can take immediate action toprotect their family’s health. Maine people cantake personal action to reduce exposure to toxicchemicals by using safer products for homesand businesses, where available. Low-costsolutions can help reduce toxic exposure untilour broken chemical safety system is fixed bypolicy makers; for example, eating fish low inmercury, testing well water for arsenic, andavoiding personal care products containingphthalates and other toxics. For specific resourcesto help you choose safer products and smarterpractices that reduce chemical exposure, visitwww.protectmainefamilies.org/saferproducts.shtml.
Institutional consumers, such as businesses,schools, state government, and hospitals,should take action too. They can purchasesafer alternatives and adopt policies to avoidhazardous chemicals in products andmaterials. One positive example was set whenMaine Governor John Baldacci issued anExecutive Order in February 2006 calling onstate government to reduce pesticide use onthe grounds of state office buildings, replacelead wheel weights in the state fleet with lead-free alternatives, avoid dry-cleaning of stateuniforms with perchloroethylene and avoidother state purchasing of products andservices containing carcinogens or persistent,bioaccumulative and toxic chemicals.90

All project protocols were approved by theUniversity of Southern Maine Office of ResearchCompliance and Institutional Review Board. Dr. VincentMarkowski and Dr. Richard Donahue, the project’sPrincipal Investigators, provided oversight of the studymethodology, data collection, laboratory testing, anddata analyses.
The 13 participants in this pilot survey wereselected for diversity in occupations, geography, age,and gender. Trained research assistants met withpotential subjects to review project goals andmethodologies, answer questions, and complete formalconsent documents, including a biographical anddemographic questionnaire to provide informationabout their residences, occupations, diet, and potentialtoxic exposures.
Samples were collected in June, July and Augustof 2006 using containers and procedures supplied bythe analytical laboratories and NorDx clinicallaboratories. Phlebotomists at professional collectioncenters drew blood samples into vacutainers.Approximately 125 ml of blood was collected fromeach participant following all necessary safety andsample collection protocols. After clotting, serum wasobtained by centrifuging tubes and pouring off orpipetting serum into storage vials. One vacutainer ofwhole blood was maintained for each participant forlead testing. Staff were present to ensure properhydration. Samples were processed as necessary,frozen, placed upright in appropriate containers withice packs, and mailed via overnight courier to theanalytical laboratories.
Participants provided first morning void urinesamples for phthalate, arsenic and creatinine clearancetesting. Urine samples were collected in appropriatecontainers. Samples were transferred to chemicallyclean 60 ml glass jars for analysis of phthalates andsterile plastic containers for arsenic testing. Urinesamples were refrigerated and mailed overnight by
the medical facility to the analyzing laboratory. Theanalytical laboratories provided collection materialsand shipping instructions. Hair samples, used tomeasure long-term mercury exposure, were cut fromthe base of the scalp (or beyond, if necessary).
All samples were coded to preserve anonymity ofthe participants. All samples collected were used solelyfor this project and will be destroyed at its conclusion.
Chemicals Analysis
AXYS Analytical Services, LTD, a private laboratoryin Victoria, British Columbia that specializes in traceand ultra-trace detection of environmentalcontaminants, analyzed urine samples for phthalatesand blood serum samples for PBDEs, perfluorinatedchemicals, and BPA.
Phthalates. Urine samples were analyzed for phthalatemonoesters by AXYS Method MLA-059, Analysis ofBisphenol A and Phthalate Metabolites in Urine byLC/MS/MS. Because phthalate esters in humans aremetabolized to their respective monoesters, which inturn may be glucuronidated, urine samples wereenzymatically hydrolyzed prior to extraction to convertany monoester glucuronides to their respective freemonoesters. Samples were extracted on SPE cartridges,eluted, and analyzed by liquid chromatography tandemmass spectrometry (LC/MS/MS). 1 mL samples werebuffered with ammonium acetate, and spiked with13C-labeled phthalate monoesters, 13C-labeled 4-methylumbelliferone, native 4-methylumbelliferoneglucuronide, and _-glucuronidase enzyme. The treatedsamples were then incubated to hydrolyze theglucuronides (the completeness of hydrolysis wasmonitored by the ratio of native to labeled 4-methylumbelliferone). The incubated urine was dilutedwith high purity water, pH adjusted, and loaded ontopre-conditioned Waters Oasis HLB SPE cartridges,which were washed and then eluted with methanol.Extracts were reduced in volume and spiked with a
40
Project Methodology

13C-labeled recovery standard. Analysis was performedon a Micromass Quattro Ultima MS/MS coupled to aWaters 2795 HPLC equipped with a reverse-phase C18column (7.5 cm, 2.1 mm i.d., 3.5µm particle size).The LC/MS/MS was operated in the MRM mode at unitresolution, using Negative Ion Electrospray ionization.Phthalate monoester concentrations were determinedby the isotope dilution method.
PBDEs. Serum samples were analyzed forpolybrominated diphenyl ethers (PBDE) viaEPA Method 1614, an HRGC/HRMS method that usesisotope dilution internal standard quantification. 6mL samples were spiked with 13C-labeled PBDEsurrogates and extracted with formic acid. Theextracts were loaded onto pre-conditioned WatersOasis HLB SPE cartridges, which were washed andthen eluted with DCM. Extracts were further cleaned-up on silica, reduced in volume, and spiked with13C-PCB recovery standards. Analysis of the extractswas performed on a Micromass Ultima or VG70 massspectrometer (MS) coupled to a Hewlett Packard 5890or 6890 gas chromatograph equipped with a DB-5HTchromatography column (30 m, 0.25 mm i.d., 0.10µm film thickness). The HRMS was operated at astatic (5000) mass resolution in the electronionization (EI) mode using voltage selected ionrecording. PBDE concentrations were determined byisotope dilution or internal standard quantificationagainst the labeled surrogates added at the beginningof analysis using Micromass OPUSQUAN software.
PFCs. Serum was analyzed for PFCs by AXYS MethodMLA-042, Analysis of Perfluorinated Organic Compounds(PFC) in Blood Serum by LC-MS/MS. 0.5 mL sampleswere spiked with 13C-labeled PFCs and extracted withformic acid. Extracts were loaded onto pre-conditionedWaters Oasis WAX SPE cartridges, which were washedand then eluted with basic methanol. The cleaned-up extracts were spiked with 13C-labeled PFC recoverystandards, diluted to final volume with methanol,
and analyzed by LC/MS/MS. Analysis was performedon a Micromass Quattro Ultima MS/MS coupled to aWaters 2795 HPLC equipped with a reverse-phase C18column (7.5cm, 2.1mm i.d., 3.5µm particle size). TheLC/MS/MS was operated in the MRM mode at unitresolution, using Negative Ion Electrospray ionization.PFC concentrations were determined by isotope dilutionor internal standard quantification against the labeledsurrogates added at the beginning of the analysis.
BPA. Serum was analyzed for Bisphenol A (BPA) andBisphenol A diglycidyl ether (BADGE), according toprocedures documented in AXYS Method MLA-0056,Analysis of Bisphenol A and Bisphenol A Diglycidyl Etherin Human Blood Serum by Liquid Chromatography–MassSpectrometry. BPA and BADGE may be present in serumas both the free phenol and glucuronated conjugate.Samples were therefore enzymatically hydrolyzed toconvert any glucuronates to the free phenol. BADGEis unstable in aqueous solutions due to hydrolyticring opening of the two epoxide rings and for thisreason BADGE was analyzed as its hydrolyzed product,BADGE-4OH. 1mL samples were spiked with deuteratedBPA and 13C-labeled 4-methylumbelliferone,buffered with ammonium acetate, and further spikedwith native 4-methylumbelliferone glucuronide, and_-glucuronidase enzyme. The treated samples werethen incubated to hydrolyze the BPA and BADGEglucuronides (the completeness of hydrolysiswas monitored by the ratio of native to labeled4-methylumbelliferone). The incubated samples werediluted with high-purity water and loaded ontopreconditioned Waters Oasis HLB SPE cartridges. Thecartridges were washed with a series of solutions, andthen eluted with ethyl acetate. The cleaned extractswere reduced in volume, reconstituted with methanol,filtered, spiked with recovery standard, and analyzedby LC/MS/MS. Analysis was performed on a MicromassQuattro Ultima MS/MS coupled to a Waters 2795 HPLCequipped with a reverse-phase C18 column (7.5cm,2.1mm i.d., 3.5µm particle size). The LC/MS/MS was
41

operated in the MRM mode at unit resolution,using Negative Ion Electrospray ionization. BPAconcentrations were determined by isotope dilution,while BADGE-4OH was determined by internal standardquantification against the labeled BPA added at thebeginning of the analysis.
For phthalates, PFCs, and PBDEs, medians werecalculated setting non-detectable values at thedetection limit divided by the square root of two.Total PBDEs were calculated in the same manner.
Metals Analysis
Lead in blood samples, methyl mercury in hairsamples, and both total arsenic and arsenic speciesin urine samples were performed by Brooks Rand Labs,a private laboratory located in Seattle, Washington,which specializes in trace level metals analysis.
Arsenic. For total arsenic (As), urine samples wereclosed-vessel oven digested with nitric acid. Digestswere then analyzed by Inductively Coupled Plasma-Dynamic Reactive Cell-Mass Spectrometry (ICP-DRC-
MS). For inorganic arsenic species, urine samples wereextracted with HCl. Aliquots for inorganic arsenicwere adjusted to pH 1.5. Sample aliquots for As(III)were adjusted to pH 6. Samples were then analyzedby hydride generation with NaBH4 reduction, cryogenictrap precollection, H2/Air flame quartz furnacedecomposition and atomic absorption detection.
Lead:. Whole blood samples were diluted 50x with adiluent comprised of EDTA, TMAH, ethanol, and Triton X-100 in DI water. Digests were then analyzed by InductivelyCoupled Plasma-Mass Spectrometry (ICP-MS).
Methylmercury. Hair samples were cut into ~1 cmsegments and then washed to remove contaminantsdeposited on the surface of the hair. Successive washand filtering cycles were done with Triton-X, acetoneand deionized water, followed by oven drying. Washedhair samples were then digested in a KOH/methanolsolution. Digestates were then analyzed by ethylation,Tenax trap pre-concentration, gas chromatographyseparation, pyrolytic combustion and atomicfluorescence spectroscopy.
42

APPENDIX
Table 1—The Chemicals Tested in Thirteen Mainers
Table 2—Complete Results of Chemical Screening of Thirteen Mainers
Table 3—Summary of Results of Maine Body Burden Study
43

44
Table 1—The Chemicals Tested in Thirteen Mainers
Chemical GroupMedium Tested
Units of Measurement
Chemical Tested Chemical Description
Phthalates
Tested in Urine
Results reported asnanograms per milliliter(ng/ml) or parts perbillion (ppb)
MMP
MEP
MBP
MBzP
MEHP
MEOHP
MEHHP
Mono-methyl phthalate
Mono-ethyl phthalate
Mono-butyl phthalate
Mono-benzyl phthalate
Mono-2-ethylhexyl phthalate
Mono-(2-ethyl-5-oxohexyl) phthalate
Mono-(2-ethyl-5-hydroxyhexyl) phthalate
A metabolite of DMP (dimethyl phthalate)
A metabolite of DEP (diethyl phthalate)
A metabolite of DBP (dibutyl phthalate)
A metabolite of BzBP (benzylbutyl phthalate)
All three are metabolites of DEHP, which isdi-(2-ethylhexyl) phthalate
Polybrominated diphenyl ethers
46 different PBDEs were measured of the 209congeners that exist. See Table 2 for full list.
PBDE congeners are named from BDE-1to BDE-209. They differ only by the locationand number of the bromine atoms, whichvaries from 1 to 10. Congeners are chemicalcompounds that share the same basicstructure.
PFBA
PFPeA
PFHxA
PFHpA
PFOA
PFNA
PFDA
PFUnA
PFDoA
PFBS
PFHxS
PFOS
PFOSA
Perfluorobutanoic acid
Perfluoro-n-pentanoic acid
Perfluorohexanoic acid
Perfluoroheptanoic acid
Perfluorooctanoic acid
Perfluorononanoic acid
Perfluorodecanoic acid
Perfluoroundecanoic acid
Perfluorododecanoic acid
Perfluorobutanesulfonate
Perfluorohexanesulfonate
Perfluorooctanesulfonate
Perfluorooctanesulfonamide
PBDEs Tested in bloodResults reported as picogramsper gram (pg/g) on a lipidweight basis or parts pertrillion (ppt)
PFCsor perfluorinatedchemicalsTested in bloodResults reported asnanograms per milliliter(ng/mL) or parts per billion
PFOA is the most prominent among this groupof perfluorinated carboxylic acids. It haseight carbon atoms. The related compoundsin this group range from having four totwelve carbon atoms. While PFOA is beingphased out of some products, all of thesecompounds are possible breakdown productsor manufacturing intermediates of othercommercial PFCs.
A metabolite of BADGE (bisphenol A diglycidylether) used in epoxy resins
A soft metal that readily escapes from productswith skin contact, as a dust that can be ingestedor inhaled, or dissolved in drinking water.
A highly toxic form of mercury produced bybacteria in wetland environments frommercury pollution of the air and water, whichbuilds up to high levels in fish and wildlife.
Total arsenic includes organic arsenic whichis relatively low in toxicity as well as highlytoxic inorganic arsenic. Arsenic(III) is themost toxic form of inorganic arsenic.
Monomer for polycarbonate plastic
BADGE-4OH
LeadMetals
LEAD: tested in blood
Results in ug/dL
METHYLMERCURY: testedin hair
Results in ng/g or ppb
ARSENIC: tested in urine
Results in ug/L or ppb
Arsenic (total, inorganic and As(III)
BPATested in bloodResults in ng/mL or ppb
BPA Bisphenol A
Methylmercury
Among these perfluorinated sulfonates, PFOSwas phased out of Scotchgard in 2000 andreplaced with PFBS. PFHxS is still used.
A breakdown product of PFCs, which breaksdown itself into PFOS

45
Tab
le 2
—C
om
ple
te R
esu
lts o
f Che
mic
al S
cre
eni
ng o
f Thi
rtee
n M
ain
ers
Che
mic
al
Cla
ssC
hem
ica
lTe
ste
dRe
gin
aC
ree
ley
Da
naD
ow
Paul
ette
Din
gle
yA
my
Gra
ham
Betti
eKe
ttell
Russ
ell
Lib
by
Ha
nna
hPi
ngre
eLa
ura
lee
Raym
ond
Vi
Raym
ond
Elis
eRo
uxC
harli
eSc
hmid
tEr
icSt
irlin
gD
eny
seW
ilso
n
Che
mic
al
Cla
ssC
hem
ica
lTe
ste
dRe
gin
aC
ree
ley
Da
naD
ow
Paul
ette
Din
gle
yA
my
Gra
ham
Betti
eKe
ttell
Russ
ell
Lib
by
Ha
nna
hPi
ngre
eLa
ura
lee
Raym
ond
Vi
Raym
ond
Elis
eRo
uxC
haril
eSc
hmid
tEr
icSt
irlin
gD
eny
seW
ilso
n
Che
mic
al
Cla
ssC
hem
ica
lTe
ste
dRe
gin
aC
ree
ley
Da
naD
ow
Paul
ette
Din
gle
yA
my
Gra
ham
Betti
eKe
ttell
Russ
ell
Lib
by
Ha
nna
hPi
ngre
eLa
ura
lee
Raym
ond
Vi
Raym
ond
Elis
eRo
uxC
haril
eSc
hmid
tEr
icSt
irlin
gD
eny
seW
ilso
n
Phth
alat
esin
URI
NE
In e
ach
box:
The
1st
resu
lt is
in n
g/m
L or
~pa
rts
per
billi
on(p
pb);
The
2nd
resu
lt is
in u
g/gC
r-L
(cre
atin
ine-
corr
ecte
d) o
r ~
ppb
PFCs
in b
lood
SER
UM
resu
lts
show
n in
ng/m
L or
~
part
s pe
r bi
llion
(ppb
)
BPA
in b
lood
SER
UM
MM
P
MEP
MBP
MBz
P
MEH
P
MEO
HP
MEH
HP
Tota
l Pht
hala
tes
< 3.
32<
3.42
10.3
10.6
26.2
27.0
28.2
29.1
10.2
10.5
15.4
15.9
41.3
42.6
133
137
< 1.
73<
1.16
81.5
54.7
32 21.5
20.8
13.6
2.42
1.62
6.15
4.13
12.5
8.39
156
105
12.1
46.5
45.9
177
22.6
86.9
17.9
68.8
8.18
31.5
8.05
31.0
29.5
113
144
555
5.17
7.18
26.7
37.1
15.7
21.8
9.12
12.7
5.23
7.26
7.47
10.4
23.9
33.2
93.3
130
2.99
7.29
24.4
59.5
28 68.3
25.1
61.2
13 31.7
30.9
75.4
66.4
162
191
465
13.1
8.9
29 19.6
38.7
26.1
46.8
31.6
24.7
16.7
27.6
18.6
59.5
40.2
239
162
26.6
23.1
172
150
75.7
65.8
54 47 45.3
39.4
106
92.2
197
171
677
588
21.6
14.2
105
69.1
107
70.4
12.7
8.36
23.3
15.3
52.1
34.3
95.8
63.0
418
275
19.6
22.7
121
140
66.2
76.5
26.5
30.6
57.9
66.9
114
132
280
324
685
793
15.8
8.19
395
205
97.4
50.5
127
65.8
7.89
4.09
29.1
15.1
54.5
28.2
727
377
< 6.
28<
5.87
20.7
19.3
48.5
45.3
6.73
6.29
4.52
4.22
8.56
8.00
43.6
40.7
136
127
5.56
6.78
38.1
46.5
35.4
43.2
22.5
27.4
2.82
3.44
8.81
10.7
20.6
25.1
134
163
< 26
.3<
17.2
73.9
48.3
141
92.2
30.5
19.9
10.8
7.06
22.6
14.8
49.6
32.4
342
223
PFBA
PFPe
APF
HxA
PFH
pAPF
OAPF
NA
PFDA
PFU
nAPF
DoA
PFBS
PFH
xSPF
OSPF
OSA
Tota
l PFC
s
< 0.
576
< 0.
544
< 0.
476
< 0.
556
1.52
0.92
3<
0.50
4<
0.51
2<
0.57
6<
1.41
3.44
13.7
< 0.
4822
.3
< 0.
576
< 0.
544
< 0.
476
< 0.
556
18.4
3.07
1.21
1.39
< 0.
576
< 1.
419.
0138
< 0.
4873
.3
< 0.
576
< 0.
721
< 0.
478
< 0.
556
3.05
1.21
< 0.
504
< 0.
512
< 0.
576
< 1.
411.
5514
.4<
0.48
25.0
< 0.
576
< 0.
544
< 0.
476
< 0.
556
1.05
< 0.
468
< 0.
504
< 0.
512
< 0.
576
< 1.
41<
1.29
6.11
< 0.
4810
.8
< 0.
576
< 0.
544
< 9.
86<
0.55
64.
551.
570.
615
< 0.
512
< 0.
576
< 1.
412.
1921
.4<
0.48
32.8
< 0.
576
< 0.
544
< 0.
476
< 0.
556
4.43
1.86
0.55
1<
0.51
2<
0.57
6<
1.41
< 1.
2915
.4<
0.48
25.4
< 0.
576
< 0.
544
< 0.
476
< 0.
556
5.03
1.96
0.68
31.
19<
0.57
6<
1.41
< 1.
2914
.2<
0.48
26.0
< 0.
576
< 0.
544
< 0.
487
< 0.
556
3.7
0.93
< 0.
504
0.59
5<
0.57
6<
1.41
2.46
13.4
< 0.
4823
.6
< 0.
576
< 0.
576
< 0.
476
< 0.
556
7.69
1.61
1.23
0.74
4<
0.57
6<
1.41
< 1.
2910
.9<
0.48
25.0
< 0.
576
< 0.
544
< 0.
719
< 0.
556
3.55
1.16
0.62
80.
69<
0.57
6<
1.41
< 1.
2914
.9<
0.48
23.8
< 0.
576
< 0.
544
< 0.
755
< 0.
556
4.41
1.56
< 0.
504
0.63
3<
0.57
6<
1.41
2.74
25<
0.48
36.9
< 0.
576
< 0.
544
< 0.
539
< 0.
556
5.61
1.37
0.82
60.
932
< 0.
576
< 1.
411.
5714
.1<
0.48
26.7
< 0.
576
< 0.
544
< 0.
811
< 0.
556
1.23
0.69
7<
0.50
4<
0.51
2<
0.57
6<
1.41
< 1.
296.
69<
0.48
12.0
BPA
BADG
E-4O
H<
0.75
2<
2.6
< 0.
52<
2.6
3.75
6.35
< 0.
522.
81<
0.52
< 4.
06<
0.52
< 2.
6<
1.64
6.69
< 0.
571
< 2.
64.
4911
96.
6459
.7<
3.24
< 2.
6<
0.52
< 2.
6<
0.52
< 2.
6re
sult
s sh
own
in n
g/m
L or
~ p
arts
per
bill
ion
(ppb
)

46
Tab
le 2
—C
ont
inue
d (
Co
mp
lete
Re
sults
of C
hem
ica
l Sc
ree
ning
of T
hirte
en
Ma
ine
rs)
Che
mic
al
Cla
ssC
hem
ica
lTe
ste
dRe
gin
aC
ree
ley
Da
naD
ow
Paul
ette
Din
gle
yA
my
Gra
ham
Betti
eKe
ttell
Russ
ell
Lib
by
Ha
nna
hPi
ngre
eLa
ura
lee
Raym
ond
Vi
Raym
ond
Elis
eRo
uxC
harli
eSc
hmid
tEr
icSt
irlin
gD
eny
seW
ilso
n
PBDE
sin
blo
od S
ERU
M
resu
lts
show
n in
pg/g
on
a lip
idw
eigh
t ba
sis,
whi
ch is
appr
oxim
atel
yth
e sa
me
as p
arts
per
trill
ion
(ppt
)
BDE-
7BD
E-8/
11BD
E-10
BDE-
12/1
3BD
E-15
BDE-
17/2
5BD
E-28
/33
BDE-
30BD
E-32
BDE-
35BD
E-37
BDE-
47BD
E-49
BDE-
51BD
E-66
BDE-
71BD
E-75
BDE-
77BD
E-79
BDE-
85BD
E-99
BDE-
100
BDE-
105
BDE-
116
BDE-
119/
120
BDE-
126
BDE-
128
BDE-
138/
166
BDE-
140
BDE-
153
BDE-
154
BDE-
155
BDE-
181
BDE-
183
BDE-
190
BDE-
203
BDE-
206
BDE-
207
BDE-
208
BDE-
209
Tota
l PBD
Es
< 27
.4<
27.4
< 27
.4<
27.4
439
154
900
< 27
.4<
27.4
*102
< 27
.483
8013
6<
27.4
122
*31.
3<
27.4
< 27
.439 17
722
1015
50<
32<
45.4
< 29
< 27
.4<
27.9
47.9
56.7
4840
200
*45.
9<
28.2
297
< 40
.819
0<
328
< 32
8<
328
< 49
2020
,088
< 22
.1<
22.1
< 22
.1<
22.1
86.7
72.1
599
< 22
.1<
22.1
*101
< 22
.164
9057
.5*2
2.6
*73.
4<
22.1
< 22
.1<
22.1
23.6
103
1210
1440
< 22
.1<
22.1
< 22
.1<
22.1
< 13
4*4
0.4
28 3660
145
*31
< 26
.835
2<
39.7
*248
< 79
9<
799
< 79
9<
1070
014
,751
< 27
.2<
27.2
< 27
.2<
27.2
*141
36.7
350
< 27
.2<
27.2
*67.
1<
27.2
2900
48<
27.2
*55.
2<
27.2
< 27
.2<
27.2
< 27
.253
.298
745
4<
27.2
< 28
< 27
.2<
27.2
< 31
.4<
27.2
< 27
.213
9096
.8<
27.2
< 27
.2*1
47<
27.2
90.1
< 32
8<
328
< 32
8<
4910
6,91
8
< 43
.6<
43.6
< 43
.6<
43.6
80.2
58.1
518
< 52
.1<
43.6
46.3
< 43
.683
9083
.9<
43.6
128
< 43
.6<
43.6
< 43
.6*5
5.5
148
1870
1260
< 57
.8<
85.4
< 53
.6<
43.6
< 52
.6*5
6.8
49.4
4520
225
*70.
5<
43.6
623
< 45
.5*1
77<
526
< 52
6<
526
< 39
4018
,579
< 25
.7<
25.7
< 25
.7<
25.7
200
506
2200
< 25
.7<
25.7
*69.
4<
25.7
3350
027
583
.850
670
.885
.1<
25.7
140
745
9280
6350
< 34
.3<
48.8
*54.
8<
25.7
< 43
.212
177
.840
6074
6*7
8.6
< 25
.753
1<
30 91.1
< 30
8<
308
< 30
8<
4620
59,8
69
< 25
.7<
25.7
< 25
.7<
25.7
506
212
1850
< 25
.7<
25.7
*101
37.1
1720
014
047
.524
030
.532
.9<
25.7
103
254
3290
4780
< 26
< 36
.9*4
8<
25.7
< 34
.610
168
.355
7050
5*5
9.5
< 25
.744
5<
32.5
*153
< 30
8<
308
< 30
8<
3080
35,9
55
< 24
.6<
24.6
< 24
.6<
24.6
603
58.7
554
< 24
.6<
24.6
*119
*55.
354
6097
.6<
24.6
87.4
< 24
.6<
24.6
< 24
.626
.695
.314
0086
6<
24.6
< 25
.3<
24.6
< 24
.6<
31.5
< 24
.6<
24.6
2780
131
*38.
4<
24.6
159
< 24
.613
4<
441
< 44
1<
441
< 88
2012
,782
< 31
.3<
31.3
< 31
.3<
31.3
225
217
1350
< 31
.3<
31.3
*47.
9<
31.3
1750
011
7*7
6.4
215
< 31
.3*3
8.5
< 31
.378
.130
631
7072
30<
31.3
< 42
.3*5
6.2
< 31
.3<
40.8
84.2
113
1530
039
6*5
7.8
< 31
.341
7<
31.3
*111
< 37
8<
378
< 37
8<
5660
47,3
43
< 23
.4<
23.4
< 23
.4<
23.4
119
69.4
608
< 23
.4<
23.4
*100
< 23
.474
5098
.3<
23.4
*101
< 23
.4<
23.4
< 23
.432
.813
714
9016
50<
23.4
*51.
7<
23.4
< 23
.4<
25.2
32.4
31.1
3030
166
*34.
6<
23.4
210
< 23
.4*9
4.8
< 28
2<
282
< 28
2<
4220
15,5
18
< 34
.1<
34.1
< 34
.1<
34.1
86.1
138
694
< 34
.1<
34.1
*41.
4<
34.1
1300
011
2<
34.1
169
< 34
.1<
34.1
< 34
.1*3
8.8
229
3310
2550
< 34
.1<
34.3
< 34
.1<
34.1
< 39
.459 49
.628
4028
0*5
7.6
< 34
.127
1<
34.1
*129
< 40
8<
408
< 40
8<
6120
24,2
29
< 27
.7<
27.7
< 27
.7<
27.7
144
202
1340
< 27
.7<
27.7
< 27
.7<
27.7
1820
015
6*3
820
7<
27.7
< 27
.7<
27.7
48 365
3680
3380
< 36
< 50
.5<
32.8
< 27
.7<
37.3
93.8
72.6
4300
375
*62.
3<
27.7
1400
< 36
.330
3<
666
< 66
6<
666
< 99
9034
,594
< 19
.1<
19.1
< 19
.1<
19.1
60.6
84.4
483
< 19
.1<
19.1
*68.
5<
19.1
6550
70.5
< 19
.193
.3<
19.1
< 19
.1<
19.1
25.5
99.9
1440
1150
< 19
.123
.9<
19.1
< 19
.1<
20.8
21.2
50.5
9120
150
*42.
2<
19.1
262
< 19
.110
4<
345
< 34
5<
345
< 34
5019
,971
< 31
.9<
31.9
< 31
.9<
31.9
480
*58.
280
1<
31.9
< 31
.9*6
6.1
< 31
.965
7082
.6<
31.9
93.5
< 31
.9<
31.9
< 31
.936
.375
.911
3092
2<
31.9
< 33
< 31
.9<
31.9
< 36
.5<
31.9
< 31
.921
5011
9*3
7.3
< 31
.932
8<
31.9
*191
< 76
8<
768
< 76
8<
1150
013
,410

47
Tab
le 2
—C
ont
inue
d (
Co
mp
lete
Re
sults
of C
hem
ica
l Sc
ree
ning
of T
hirte
en
Ma
ine
rs)
Che
mic
al
Cla
ssC
hem
ica
lTe
ste
dRe
gin
aC
ree
ley
Da
naD
ow
Paul
ette
Din
gle
yA
my
Gra
ham
Betti
eKe
ttell
Russ
ell
Lib
by
Ha
nna
hPi
ngre
eLa
ura
lee
Raym
ond
Vi
Raym
ond
Elis
eRo
uxC
harli
eSc
hmid
tEr
icSt
irlin
gD
eny
seW
ilso
n
Met
als
Pb in
BLO
ODin
ug/
dL
MeH
g in
HA
IRin
ng/
g or
ppb
As
in U
RINE
1st
# is
in u
g/L
2nd
is u
g/gC
r-L
(cre
atin
ine
corr
ecte
d)–
both
are
~ p
pb
Che
mic
al
Cla
ssC
hem
ica
lTe
ste
dRe
gin
aC
ree
ley
Da
naD
ow
Paul
ette
Din
gle
yA
my
Gra
ham
Betti
eKe
ttell
Russ
ell
Lib
by
Ha
nna
hPi
ngre
eLa
ura
lee
Raym
ond
Vi
Raym
ond
Elis
eRo
uxC
haril
eSc
hmid
tEr
icSt
irlin
gD
eny
seW
ilso
n
LEA
D
MET
HYL
MER
CURY
ARS
ENIC
(tot
al)
ARS
ENIC
(ino
rgan
ic)
ARS
ENIC
(II
I)
1.10
*156
843
869
0.23
80.
245
0.21
00.
216
1.06
497
98.1
65.8
0.49
60.
333
0.42
00.
282
1.46
396
3.51
13.5
0.16
20.
623
0.16
00.
623
0.54
9
437
11.2
15.5
0.57
50.
799
0.45
00.
625
0.71
6
333
21.2
51.7
0.17
30.
422
0.15
00.
366
1.07
*215
16.1
10.9
1.11
0.75
0.74
00.
500
1.20
1140
30.7
26.7
1.13
0.98
0.73
00.
635
0.71
9
759
59.6
39.2
1.07
0.70
0.83
0.55
0.88
4
291
11.1
12.8
0.75
30.
871
0.62
00.
717
0.50
7
778
8.18
4.24
0.48
0.25
0.44
0.52
3.26
**18
6
40.2
37.6
0.50
80.
476
0.14
00.
131
1.14
1180
58.6
71.5
0.29
90.
365
0.20
00.
244
no d
ata
257
56.7
37.1
1.16
0.76
0.83
0.54
Prot
ein
in U
RINE
CREA
TIN
INE
(mg/
dL)
9714
926
7241
148
115�
152�
86.5
193
107
8215
3
Thes
e no
rmal
pro
tein
leve
ls a
re u
sed
to a
djus
t th
e m
easu
red
chem
ical
s in
uri
ne t
o ac
coun
t fo
r di
luti
on d
ue t
o va
ryin
g am
ount
s of
flu
id in
take
per
per
son
NO
TES:
Bold
face
typ
e in
a c
olor
ed b
ox in
dica
tes
the
chem
ical
was
det
ecte
d
<th
e ch
emic
al w
as n
ot f
ound
abo
ve t
he li
mit
of
dete
ctio
n in
dica
ted;
the
che
mic
al m
ight
be
pres
ent
belo
w t
his
limit
*th
e ch
emic
al w
as d
etec
ted
but
the
quan
tifi
cati
on c
rite
ria
wer
e no
t m
et, t
here
fore
the
res
ult
repr
esen
ts t
he e
stim
ated
max
imum
pos
sibl
e co
ncen
trat
ion
**es
tim
ate
To c
alcu
late
the
sum
tot
al for
Pht
hala
tes,
PFC
s an
d PB
DEs,
any
val
ue r
epor
ted
as n
on-d
etec
ted
(< #
) w
as a
ssig
ned
a va
lue
of 1/
2 the
det
ecti
on li
mit
; For
the
sam
e pu
rpos
e, a
ny P
BDE
valu
e th
at w
as f
lagg
ed (
*) a
s no
t m
eeti
ng q
uant
ific
atio
ncr
iter
ia w
as a
ssig
ned
a va
lue
of 1/
2 the
rep
orte
d va
lue.

48
Table 3—Summary of Results of Maine Body Burden Study
RESULTS FROM 13 MAINE PARTICIPANTS
Phthalates
RESULTS FROM OTHER STUDIES
MMP
MEP
MBP
MBzP
MEHP
MEOHP
MEHHP
Sum TOTAL
Minimum Maximum Median – or50th %tile
units = ug/gCr-L (creatinine corrected)
PBDEs units = pg/g on a lipid weight basis
Minimum Maximum Median – or50th %tile
BDE-15
BDE-17/25
BDE-28/33
BDE-35
BDE-37
BDE-47
BDE-49
BDE-51
BDE-66
BDE-71
BDE-75
BDE-79
BDE-85
BDE-99
BDE-100
BDE-116
BDE-119/120
BDE-138/166
BDE-140
BDE-153
BDE-154
BDE-155
BDE-183
BDE-203
Sum TOTAL
< 1.16
10.6
21.8
6.29
1.62
4.13
8.39
105
46.5
205
92.2
68.8
66.9
132
324
793
8.19
54.7
50.5
29.1
10.6
15.9
40.7
223
60.6
36.7
350
< 27.7
< 19.1
2900
48
< 19.1
*55.2
< 19.1
< 19.1
< 27.2
53.2
987
454
< 22.1
< 19.1
21.2
< 24.6
1390
96.8
< 27.2
*147
90.1
6,918
603
506
2200
119
*55.3
33500
275
83.8
506
70.8
85.1
140
745
9280
7230
*51.7
*56.2
121
77.8
15300
746
*78.6
1400
303
59,869
144
84.4
694
*68.5
< 27.7
8380
98.3
< 31.9
122
< 31.3
< 27.7
*38.8
148
1870
1550
< 36.9
< 31.9
47.9
49.6
4060
200
*45.9
328
134
19,971
Median – or50th %tile
75th %tile 90th %tile 95th %tile
1.33
147
26.0
13.5
3.89
11.2
16.6
219
WashingtonMedian93
CaliforniaMedian94
Median – or50th %tile
95th %tile
from federal CDC 3rd National Exposure Report91
n = 2,536 for MEP; n = 2,772 for all other phthalates1
2.62
388
51.6
26.6
7.94
21.3
32.3
530
5.00
975
98.6
55.1
18.2
45.1
70.8
1,268
7.97
1860
149
90.4
32.8
87.5
147
2,375
from McDonald 200592
n = 62 women from CA & IN n = 10 n = 11
included below
included below
included below
included below
included below
40,700
included below
included below
included below
included below
included below
305,000
275
61.7
1128
< 5.64
10.0
19950
178
~ 12
170
< 17.4
25.0
*61.1
346
4255
3115
< 22.4
22.8
73.8
~ 44
2725
368
43.4
218
152
47,500
-
-
-
-
-
14100
-
-
-
-
-
-
-
3100
2100
-
-
-
-
3400
280
-
-
-
22,980

49
Table 3—Continued (Summary of Results of Maine Body Burden Study)
PFCs
PFOA
PFNA
PFDA
PFUnA
PFHxS
PFOS
Sum TOTAL
Minimum Maximum Median
units = ng/mL in blood serum (wet weight)
BPA units = ng/mL in blood serum (wet weight)
Minimum Maximum RangeDetected
BPA
BADGE-4OH
1.05
< 0.468
< 0.504
< 0.512
< 1.29
6.11
10.8
18.4
3.07
1.23
1.39
9.01
38
73.3
4.41
1.56
0.551
0.595
1.57
14.2
25.0
< 0.52
< 2.6
6.64
119
3.75 – 6.64
2.81 - 119
National Mean(estimated)95
WashingtonMedian96
CaliforniaMedian97
3.97 to 6.98
0.51 to 1.10
-
-
4.33
23.4 to 40.2
32.2 – 52.6
3.6
-
-
-
-
21.3
24.9
5.3
1.67
0.43
0.40
2.44
25.6
35.8
1.40 2.20 3.40 4.40
n = 476 women& 442 men n = 10 n = 12
Geometric Mean- EWG95
CaliforniaMedian99
Mean - Takeuchiand Tsutsumi100
1.08
9.33
0.46
12.8
0.64_ to 1.49_
-
n = 7 for BPAn = 30 for BADGE n = 11
n = 14 women _n = 11 men _
Metals
Minimum Maximum Median - 50%
0.51 3.26 1.08
LeadMedian – or50th %tile
75th %tile 90th %tile 95th %tile
Units = micrograms of lead per deciliter of blood (ug/dL) n = 8945; from federal CDC 3rd National Exposure Report101
360 2400 200 1400
Minimum Maximum Median - 50%
156
257
1180
1140
396
759
MercuryU.S. Women of Childbearing Age U.S. Women of Childbearing Age
Mean 95th %tile 90th %tileMean
Methylmercury
Top row: n = 13 Mainers
Bottom row: n = 5 Maine women of childbearing age
Units = nanograms methylmercury per gram of hair (ng/g) or ppb
Smith (1997) cited in NationalResearch Council102 n = 702 (CDC, 2001)103
Reference Dose, level above which fetal brain development is at risk = 1000 ppb methylmercury in hair
Minimum Maximum Median - 50%
3.51
0.16
0.14
843
1.16
0.83
30.7
0.51
0.44
Arsenic Pellizari & Clayton (2006)104
Units = micrograms of arsenic per liter of urine (ug/L) or ppb
Median - 50%
10.23
-
-
Total AS
Inorganic As
Arsenic (III)
WashingtonMedian105
NOTES: Minimum and Maximum are the lowest and highest values reported among the 13 Maine participants. The median is the reported value that falls in the middleof the range of all reported values. The median is the same as the 50th percentile (50th %tile), which means that half or 50% of the reported values are less thanthis number and half are greater than it; The 75th percentile (75th %tile) is the number that is greater than three-quarters or 75% of all the reported values (and isless than one-quarter or 25% of all the reported values); The 90th percentile (90th %tile) is the number that’s greater than nine-tenths or 90% of all the reportedvalues (and less than 10% of all reported values); The 95th percentile (95th %tile) is the number that is greater than 95% of all the reported values (and less than 5% of all reported values); < means that the chemical was not found above the limit of detection indicated (but the chemical might be present below this level); *means that the chemical was detected but the quantification criteria were not met, therefore the result represents the estimated maximum possible concentration forthat sample; n = the number of individuals sampled. For PFCs, the sum total is the median value of the minimum, maximum, and total among all Maine participants.For the comparative results, the sum total is the sum of the reported values. The values reported for the PFC national mean are the least squares means estimates ofserum concentrations for non-Hispanic white females (lower value) and non-Hispanic white males (higher value) from pooled samples obtained through the2001-2002 NHANES. The lead national mean is based on total results for the U.S. population aged one and older from 2001-2002 NHANES. See note 1, Table 16, p.38.
1 Based on total results for the U.S. population aged 6 and older from the 2001-2002 National Health and Nutrition Examination Survey (NHANES), except that resultsfor MBP are from the 1999-2000 survey because it was reported then as the sum of the two isomers of mono-butyl phthalate.
11
-
-
n = 10n = 102

1 Environmental Working Group. 2003. Body Burden: The Pollution in People. <http://www.ewg.org/reports/bodyburden1/> Accessed on May 7, 2007.
2 Black, H. 2006. Setting a baseline for biomonitoring. Environmental Health Perspectives 114:A652-A654.
3 U.S. Centers for Disease Control and Prevention. 2005. Third National Report on Human Exposure toEnvironmental Chemicals. Atlanta, Georgia: National Center for Environmental Health, Division of LaboratorySciences, NCEH
4 Schreder, E. 2006. Pollution in People: A Study of Toxic Chemicals in Washingtonians. Seattle, WA:Toxic-Free Legacy Coalition. <http://www.pollutioninpeople.org> Accessed on May 7, 2007.
5 Patten, S. and D. Baltz. 2005. Taking It All In: Documenting Chemical Pollution in Californians ThroughBiomonitoring. Bolinas, CA: Commonweal Biomonitoring Resource Center. <http://www.commonweal.org>Accessed on May 7, 2007.
6 Environmental Defence. 2005. Toxic Nation: A Report on Pollution in Canadians. Toronto, Ontario:Environmental Defence.
7 Environmental Working Group. 2003. Body Burden: The Pollution in People. <http://www.ewg.org/reports/bodyburden1/> Accessed on May 7, 2007.
8 National Research Council Committee on Human Biomonitoring for Environmental Toxicants. 2006.Human Biomonitoring for Environmental Chemicals. Washington, DC: National Academies Press.
9 DiGangi, J., T. Schettler, M. Cobbing, and M. Rossi. 2002. Aggregate exposures to phthalates in humans.Washington, DC: Health Care Without Harm. <http://www.noharm.org/library/docs/Phthalate_Report.pdf>
10 Chang, J.C.S., R. Fortmann, and N. Roache. 2002. Air toxics emissions from a vinyl shower curtain.Proceedings: Indoor Air 2002: 542-547.
11 U.S. Centers for Disease Control and Prevention. 2003. Second Annual Report on Human Exposure toEnvironmental Chemicals. Atlanta, Georgia: National Center for Environmental Health, Division of LaboratorySciences, NCEH Pub. No. 02-0716.
Blount, B.C. 2000. Levels of seven urinary phthalate metabolites in a human reference population.Environmental Health Perspectives 108: 979-982.
50
References

12 Clark K., I. Cousins, and D. MacKay. 2003. Assessment of critical exposure pathways, 3Q. Phthalate Esters,pp. 227-262 in: The Handbook of Environmental Chemistry (C. Staples, ed.). New York: Springer.
Otake, T., J. Yoshinaga, and Y. Yanagisawa. 2004. Exposure to phthalate esters from indoor environment.Journal of Exposure Analysis and Environmental Epidemiology 14:524-528.
13 Green, R., R. Hauser, T. Schettler, and H. Hu. 2005. Use of di(2-ethylhexyl)phthalate–containing medicalproducts and urinary levels of mono(2-ethylhexyl)phthalate in neonatal intensive care unit infants.Environmental Health Perspectives 113:1222–1225.
14 Houlihan, J., C. Brody, and B. Schwan. 2002. Not Too Pretty: Phthalates, Beauty Products, and the FDA.Washington, D.C.: Environmental Working Group. <http://www.noharm.org/us/pesticidesCleaners/Fragrances>Accessed on May 7, 2007.
15 Swan, S.H., K.M. Main, F. Liu, S.L. Stewart, et al. 2005. Decrease in anogenital distance among male infantswith prenatal phthalate exposure. Environmental Health Perspectives 113:1056-1061.
16 Gray, L.E. Jr., J. Ostby, J. Furr, M. Price, D.N. Rao Veeramachaneni, and L. Parks. 2000. Perinatal exposureto the phthalates DEHP, BBP, and DINP, but not DEP, DMP, or DOTP, alters sexual differentiation of the malerat. Toxicological Sciences 58:350-365.
Center for the Evaluation of Risks to Human Reproduction. 2006. NTP CERHR Monograph on the PotentialReproductive and Developmental Effects of Di(2-ethylhexyl)phthalate (DEHP). Research Triangle Park, NC:National Toxicology Program, U.S. Department of Health and Human Services, NIH Pub. No. 06-4476.
17 Duty, S.M. 2003. The relationship between environmental exposures to phthalates and DNA damage inhuman sperm. Environmental Health Perspectives 111: 1164-1169.
18 Hauser, R., and A.M. Calafat. 2005. Phthalates and human health. Occupational and Environmental Medicine62:806-818.
19 Colon, I. 2000. Identification of phthalate esters in the serum of young Puerto Rican girls with prematurebreast development. Environmental Health Perspectives 108:895-900.
20 ATSDR. 2002. Toxicological profile for Di(2-ethylhexyl)phthalate. Atlanta, GA: U.S. Department of Healthand Human Services. < http://www.atsdr.cdc.gov/toxprofiles/tp9.html> Accessed on May 7, 2007.
Bornehag, C., J. Sundell, C.J. Weschler, T. Sigsgaard, B. Lundgren, M. Hasselgren, and L. Hägerhead-Engman.2004. The association between asthma and allergic symptoms in children and phthalates in house dust: Anested case-control study. Environmental Health Perspectives 112:1393-1397.
51

Hoppin, J.A., R. Ulmer, and S.J. London. 2004. Phthalate exposure and pulmonary function. EnvironmentalHealth Perspectives 112:571-574.
21 U.S. EPA. 1993. Integrated Risk Information System, Di(2-ethylhexyl)phthalate (DEHP) (CASRN 117-81-7).<http://www.epa.gov/iris/subst/0014.htm> Accessed on May 7, 2007.
22 Center for Food Safety and Applied Nutrition Office of Cosmetics and Colors. 2005. Phthalates and CosmeticProducts. U.S. Food and Drug Administration, < http://www.cfsan.fda.gov/~dms/cos-phth.html> Accessedon May 7, 2007.
23 Agency for Toxic Substances and Disease Registry. 2004. Toxicological profile for polybrominated biphenylsand polybrominated diphenyl ethers. Atlanta, Georgia: U.S. Department of Health and Human Services.
24 Hazrati, S. and S. Harrad. 2006. Causes of variability in concentrations of polychlorinated biphenyls andpolybrominated diphenyl ethers in indoor air. Environmental Science and Technology 40:7584-7589.
25 Stapleton, H.M., N.G. Dodder, J.H. Offenberg, M.M. Schantz, and S.A. Wise. 2005. Polybrominated diphenylethers in house dust and clothes dryer lint. Environmental Science and Technology 39:925-931.
26 Noren, K., and D. Meironyte. 2000. Certain organochlorine and organobromine contaminants in Swedishhuman milk in perspective of past 20-30 years. Chemosphere 40:1111-1123.
27 Schecter, A., O. Päpke, J.E. Joseph, and K.C. Tung. 2005. Polybrominated diphenyl ethers (PBDEs) in U.S.computers and domestic carpet vacuuming: possible sources of human exposure. Journal of Toxicology andEnvironmental Health A68:501–513.
Stapleton, H.M., N.G. Dodder, J.H. Offenberg, M.M. Schantz, and S.A. Wise. 2005. Polybrominated diphenylethers in house dust and clothes dryer lint. Environmental Science and Technology 39:925–931.
Sjödin, A., R.S. Jones, J.F. Focant, C. Lapeza, R.Y. Wang, E. McGahe III, et al. 2004. Retrospective time-trend study of polybrominated diphenyl ether and polybrominated and polychlorinated biphenyl levels inhuman serum from the United States. Environmental Health Perspectives 112:654–658.
Jones-Otazo, H.A., J.P. Clarke, M.L. Diamond, J.A. Archbold, G. Ferguson, T. Harner, et al. 2005. Is housedust the missing exposure pathway for PBDEs? An analysis of the urban fate and human exposure to PBDEs.Environmental Science and Technology 39:5121–5130.
Wu, N., T. Webster, T. Hermann, O. Päpke, J. Tickner, R. Hale, et al. 2005. Associations of PBDE levels inbreast milk with diet and indoor dust concentrations. Organohalogen Compounds 67:654–657.
Butt, C.M., M.L. Diamond, J. Truong, M.G. Ikonomou, and A.F.H. Ter Schure. 2004. Spatial distribution of
52

polybrominated diphenyl ethers in southern Ontario as measured in indoor and outdoor window organicfilms. Environmental Science and Technology 38:724-731.
Harrad, S., R. Wijesekera, S. Hunter, C. Halliwell, and R. Baker. 2004. Preliminary assessment of U.K. humandietary and inhalation exposure to polybrominated diphenyl ethers. Environmental Science and Technology38:2345-2350.
27 Bocio, A., J.M. Llobet, J.L. Domingo, J. Corbella, A. Teixidó, and C. Casas. 2003. Polybrominated diphenylethers (PBDEs) in foodstuffs: human exposure through the diet. Journal of Agricultural and Food Chemistry51:3191-3195.
Schecter, A., O. Päpke, K.C. Tung, D. Staskal, and L. Birnbaum. 2004. Polybrominated diphenyl etherscontamination of United States food. Environmental Science and Technology 38:5306-5311.
Schecter, A., O. Päpke, R. Harris, K.C. Tung, A. Musumba, J. Olson, and L. Birnbaum. 2006. Polybrominateddiphenyl ether (PBDE) levels in an expanded market basket survey of U.S. food and estimated PBDE dietaryintake by age and sex. Environmental Health Perspectives 114: 1515-1520.
29 Lunder, S. and R. Sharp. 2003. Mothers Milk. Washington, D.C.: Environmental Working Group.
Hites, R.A. 2004. Polybrominated diphenyl ethers in the environment and in people: a meta-analysis ofconcentrations. Environmental Science and Technology 38:945-956.
Schecter, A., M. Pavuk., O. Päpke, J.J. Ryan, L. Birnbaum, R. Rosen. 2003. Polybrominated diphenyl ethers(PBDEs) in U.S. mothers’ milk. Environmental Health Perspectives 111:1723–1729.
30 Health Canada. 2006. State of the Science Report for a Screening Health Assessment: PolybrominatedDiphenyl Ethers (PBDEs). Environment and Workplace Health, HC Pub. 4436, <http://www.hc-sc.gc.ca/ewh-semt/pubs/contaminants/existsub/pbde/index_e.html> Accessed on May 7, 2007.
Mazdai, A., N.G. Dodder, M.P. Abernathy, R.A. Hites, and R.M. Bigsby. 2003. Polybrominated diphenyl ethersin maternal and fetal blood samples. Environmental Health Perspectives 111:1249–1252.
31 Bocio, A., J.M. Llobet, J.L. Domingo, J. Corbella, A. Teixidó, C. Casas. 2003. Polybrominated diphenyl ethers (PBDEs)in foodstuffs: human exposure through the diet. Journal of Agricultural and Food Chemistry 51:3191-3195.
32 Ohta, S., D. Ishizuka, H. Nishimura, T. Nakao, O. Aozasa, Y. Shimidzu, et al. 2002. Comparison of polybrominateddiphenyl ethers in fish, vegetables, and meats and levels in human milk of nursing women in Japan.Chemosphere 46:689–696.
33 Birnbaum, L.S., and D.F. Staskal. 2004. Brominated flame retardants: cause for concern? EnvironmentalHealth Perspectives 112:9-17
53

34 Cressey, M.A., E.A. Reeve, D.C. Rice, V.P. Markowski. Behavioral impairments produced by developmentalexposure to the flame retardant decaBDE, presented at the annual meeting of the Behavioral ToxicologySociety, September 16-17, 2006.
35 Eriksson, P., H. Viberg, E. Jakobsson, U. Orn, and A. Fredriksson. 2002. A brominated flame retardant,2,2’,4,4’,5-pentabromodiphenyl ether: uptake, retention, and induction of neurobehavioral alterations inmice during a critical phase of neonatal brain development. Toxicological Sciences 67:98-103.
36 Viberg, H., A. Fredriksson, E. Jakobsson, U. Orn, and P. Eriksson. 2003. Neurobehavioral derangements inadult mice receiving decabrominated diphenyl ether (PBDE 209) during a defined period of neonatal braindevelopment. Toxicological Sciences 76:112–120.
Stoker, T.E., S.C. Laws, K.M. Crofton, J.M. Hedge, J.M. Ferrell, and R.L. Cooper. 2004. Assessment of DE-71,a commercial polybrominated diphenyl ether (PBDE) mixture, in the EDSP male and female pubertal protocols.Toxicological Sciences 78:144–155.
37 Zhou, T., D.G. Ross, M.J. DeVito, and K.M. Crofton. 2001. Effects of short-term in vivo exposure topolybrominated diphenyl ethers on thyroid hormones and hepatic enzyme activities in weanling rats.Toxicological Sciences 61:76-82.
Zhou, T., M.M. Taylor, M.J. DeVito, and K.M. Crofton. 2002. Developmental exposure to brominated diphenylethers results in thyroid hormone disruption. Toxicological Sciences 66:105-106.
38 Ross, P. 2006. Fireproof killer whales: flame-retardant chemicals and the conservation imperative in thecharismatic icon of British Columbia, Canada. Canadian Journal of Fisheries and Aquatic Sciences 63:224-234.
Law, R.J., M. Alaee, C.R. Allchin, J.P. Boon, M. Lebeuf, P. Lepom, and G.A. Stern. 2003. Levels and trendsof polybrominated diphenylethers and other brominated flame retardants in wildlife. Environment International29:757-770.
39 U.S. EPA. 1995. Integrated Risk Information System, Decabromodiphenyl ether (DBDPE) (CASRN 1163-19-5). Washington, DC: Office of Research and Development, National Center for Environmental Assessment.
40 Lowell Center for Sustainable Production. 2005. An investigation of non-halogen substitutes in electronicenclosure and textile applications. Lowell, MA: University of Massachusetts.
41 Rossi, M. and L. Heine. 2007. The Green Screen for Safer Chemicals: Evaluating Flame Retardants for TVEnclosures. Medford, MA: Clean Production Action. <http://www.cleanproduction.org/Green.Greenscreen.php>Accessed May 7, 2007.
54

42 Maine Department of Environmental Protection and Maine Center for Disease Control and Prevention. 2007.Brominated Flame Retardants, Third Annual Report to the Maine Legislature. Augusta, ME: Maine DEP.<http://www.maine.gov/dep/rwm/publications/legislativereports/pdf/finalrptjan07.pdf> Accessed onMay 7, 2007.
43 Lorber, M. 2007. Exposure of Americans to polybrominated diphenyl ethers. Journal of Exposure Science andEnvironmental Epidemiology, published online April 11, 2007.
44 3M Company. 2003. Environmental and Health Assessment of Perfluorooctanesulfonate and Its Salts.Washington, DC: U.S. EPA, Docket AR-226-1486.
45 Falandysz, J., S. Taniyasu, A. Gulkowska, N. Yamashita, and U. Schulte-Gehlman. 2006. Is fish a majorsource of fluorinated surfactants and repellants in humans living on the Baltic coast? Environmental Scienceand Technology 40:748-751.
46 Shoeib, M, T. Harner, M. Ikonomou, and K. Kannan. 2004. Indoor and outdoor air concentrations and phasepartitioning of perfluoroalkyl sulfonamides and polybrominated diphenyl ethers. Environmental Science andTechnology 38:1313–1320.
Shoeib, M., T. Harner, B.H. Wilford, K.C. Jones, and J. Zhu. 2005. Polyfluorinated compounds in the home:levels in air and dust and human exposure. Abstract ANA042 in: FLUOROS 2005, 18–20 August 2005, Toronto,Canada. Toronto, CN: University of Toronto. <http://www.chem.utoronto.ca/symposium/fluoros/abstractbook.htm> Accessed May 7, 2007.
Strynar, M.J., and A.B. Lindstrom. 2005. Perfluorinated compounds in archived house dust samples. AbstractANA009 in: FLUOROS 2005.
47 Ellis, D.A., S.A. Mabury, J.W. Martin, and D.C.G. Muir. 2001. Thermolysis of fluoropolymers as a potentialsource of halogenated organic acids in the environment. Nature 412:321-324.
48 U.S. EPA. 2005. Draft risk assessment of the potential human health effects associated with exposure toperfluorooctanoic acid and its salts. <http://www.epa.gov/opptintr/pfoa/pubs/pfoarisk.pdf> Accessed May7, 2007.
49 Inoue, K., F. Okada, R. Ito, S. Kato, S. Sasaki, S. Nakajima, et al. 2004. Perfluorooctane sulfonate (PFOS)and related perfluorinated compounds in human maternal and cord blood samples: assessment of PFOSexposure in a susceptible population during pregnancy. Environmental Health Perspectives 112:1204–1207.
50 So, M.K., N. Yamashita, S. Taniyasu, et al. 2006. Health risks in infants associated with exposure to
55

perfluorinated compounds in human breast milk from Zhoushan, China. Environmental Science and Technology40: 2924-2929.
51 Environmental Working Group. 2003. PFCs: A Family of Chemicals that Contaminate the Planet.<http://www.ewg.org/reports/pfcworld/index.php> Accessed May 7, 2007.
52 Alexander, B.H., G.W. Olsen, J.M. Burris, et al. 2003. Mortality of employees of a perfluorooctanesulphonylfluoride manufacturing facility. Occupational and Environmental Medicine 60:722-729.
53 Luebker, D.J., R.G. York, J.A. Moore, K.J. Hansen, and J.L. Butenhoff. 2005. Neonatal mortality from inutero exposure to perfluorooctanesulfonate (PFOS) in Sprague-Dawley rats: dose response, pharmacokinetics,and clinical chemistry. Toxicology 215:149–169.
Organization for Economic Co-operation and Development. 2002. Co-operation on Existing Chemicals: HazardAssessment of Perfluorooctane Sulfonate and Its Salts. <http://www.oecd.org/dataoecd/23/18/2382880.pdf>Accessed on May 7, 2007.
Case, M.T., R.G. York, and M.S. Christian. 2001. Rat and rabbit oral developmental toxicity studies with twoperfluorinated compounds. International Journal of Toxicology 20:101-109.
54 Perfluorooctanoic Acid Review Panel. 2006. Science Advisory Board Review of EPA’s Draft Risk Assessmentof Potential Human Health Effects Associated with PFOA and Its Salts. Washington, DC: U.S. EnvironmentalProtection Agency, EPA-SAB-06-006. <http://www.epa.gov/sab/pdf/sab_06_006.pdf> Accessed May 7, 2007.
U.S. EPA. 2005. Draft risk assessment of the potential human health effects associated with exposure toperfluorooctanoic acid and its salts. <http://www.epa.gov/opptintr/pfoa/pubs/pfoarisk.pdf>
55 U.S. Environmental Protection Agency. 2006. Proposed Rule: Premanufacture Notification Exemption forPolymers: Amendment of Polymer Exemption Rule to Exclude Certain Perfluorinated polymers. Washington,DC: U.S. EPA Docket ID Number EPA-HQ-OPPT-2002-0051.
56 Sinclair, E., S.K. Kim, H.B. Akinleye, and K. Kannan. 2007. Quantitation of gas-phase perfluoroalkylsurfactants and fluorotelomer alcohols released from nonstick cookware and microwave popcorn bags.Environmental Science and Technology 41:1180-1185.
57 Brotons, J.A., M.F. Olea-Serrano, M. Villalobos, V. Pedraza and N. Olea. 1995. Xenoestrogens released fromlacquer coating in food cans. Environmental Health Perspectives 103:608-612.
Takao, Y., H.C. Lee, S. Kohra and K. Arizono. 2002. Release of bisphenol A from food can lining upon heating.Journal of Health Science 48:331-334.
56

Yoshida, T., M. Horie, Y. Hoshino and H. Nakazawa. 2001. Determination of bisphenol A in canned vegetablesand fruit by high performance liquid chromatography. Food Additives and Contaminants 18:69-75.
58 Krishnan, A.V., P. Stathis, S.F. Permuth, L. Tokes and D. Feldman. 1993. Bisphenol-A: an estrogenic substanceis released from polycarbonate flasks during autoclaving. Endocrinology 132:2279-2286.
Brede, C., P. Fjeldal, I. Skjevrak and H. Herikstad. 2003. Increased migration levels of bisphenol A from polycarbonatebaby bottles after dishwashing, boiling and brushing. Food Additives and Contaminants 20: 684-689.
59 Kolpin, D.W., E.T. Furlong, M.T. Meyer, E.M. Thurman, S.D. Zaugg, LB. Barber, and H.T. Buxton. 2002.Pharmaceuticals, hormones, and other organic wastewater contaminants in U.S. streams, 1999-2000: Anational survey. Environmental Science and Technology 36:1202-1211.
60 Dodds, E.C. and W. Lawson. 1938. Molecular structure in relation to oestrogenic activity: compounds withouta phenanthrene nucleus. Proceedings of the Royal Society, London B. 125:222-232.
61 Sugiura-Ogasawara, M., Y. Ozaki, S. Sonta, T. Makino and K. Suzumori. 2005. Exposure to bisphenol A isassociated with recurrent miscarriage. Human Reproduction 20:2325-2329.
62 Kubo, K., O. Arai, M. Omura, R. Wantanabe, R. Ogata, and S. Aou. 2003. Low dose effects of bisphenol Aon sexual differentiation of the brain and behavior in rats. Neuroscience Research 45: 345-356.
63 Ho, S.M., W.Y. Tang, J. Belmonte de Frausto, and G.S. Prins. 2006. Developmental exposure to estradiol andbisphenol A increases susceptibility to prostate carcinogenesis and epigenetically regulates phosphodiesterasetype 4 variant 4. Cancer Research 66: 5624-5632.
Wetherill, Y.B., C.E. Petre, K.R. Monk, A. Puga, and K.E. Knudsen. 2002. The xenoestrogen bisphenol Ainduces inappropriate androgen receptor activation and mitogenesis in prostatic adenocarcinoma cells.Molecular Cancer Therapeutics 1: 515–524.
64 Durando, M., L. Kass, J. Piva, C. Sonnenschein, A.M. Soto, E.H. Luque, and M. Muñoz-de-Toro. 2007. Prenatalbisphenol A exposure induces preneoplastic lesions in the mammary gland in wistar rats. EnvironmentalHealth Perspectives 115: 80-86.
65 vom Saal, F.S. and C. Hughes. 2005. An extensive new literature concerning low-dose effects of bisphenolA shows the need for a new risk assessment. Environmental Health Perspectives 113:926-933.
vom Saal, F.S. and Welshons, W.V. 2006. Large effects from small exposures: II. The importance of positivecontrols in low-dose research on bisphenol A. Environmental Research 100:50-76.
57

66 vom Saal, F.S. and C. Hughes. 2005. An extensive new literature concerning low-dose effects of bisphenolA shows the need for a new risk assessment. Environmental Health Perspectives 113:926-933.
67 Environmental Working Group. 2007. Human Toxome Project: Mapping the Pollution in People, BADGE-4OH.<www.ewg.org/sites/humantoxome/chemicals/chemical.php?chemid=100356> Accessed on May 7, 2007.
68 Municipal Code of San Francisco. 2007. Article 34: Sale of Toys and Child Care Articles Made with Bisphenol-A. <http://www.municode.com/content/4201/14136/HTML/ch034.html> Accessed on May 7, 2007.
69 Moller, L., C. Helweg, C.H. Pratt, A. Worup, and C. Skak. 2002. Evaluation of Alternatives for Compoundsunder Risk Assessment in the EU, Bisphenol A. Denmark: Danish Environmental Protection Agency.
70 Environmental Working Group. 2007. A Survey of Bisphenol A in U.S. Canned Foods. <http://www.ewg.org/reports/bisphenola/execsumm.php> Accessed on April 16, 2007.
71 Gilbert, S. 2004. A Small Dose of Toxicology: The Health Effects of Common Chemicals. New York: CRC Press.
Lanphear, B.P., R. Hornung, J. Khoury, K. Yolton, P. Baghurst, D.C. Bellinger, R.L. Canfield, K.N. Dietrich,R. Bornschein, T. Greene, S.J. Rothenberg, H.L. Needleman, L. Schnaas, G. Wasserman, J. Graziano, and R.Roberts. 2005. Low-level environmental lead exposure and children's intellectual function: An internationalpooled analysis. Environmental Health Perspectives 113:894-899.
72 Grosse, S.D., T.D. Matte, J. Schwartz, and R.J. Jackson. 2002. Economic gains resulting from the reductionin children's exposure to lead in the United States. Environmental Health Perspectives 110:563.
73 ATSDR. 2005. ToxFAQs for Lead. <http://www.atsdr.cdc.gov/tfacts13.html> Accessed on May 7, 2007.
74 Crockett, P. and M. Belliveau. 2005. Known Hazard, Unrecognized Danger: Lead Exposure in Maine’s Workforce.Augusta: Maine Labor Group on Health and Environmental Health Strategy Center.
75 Public Health Service, National Toxicology Program. 2005. Report on Carcinogens, Eleventh Edition. ResearchTriangle Park, NC: U.S. Department of Health and Human Services.
76 Warren C. 2000. Brush with Death: A Social History of Lead Poisoning. Baltimore, MD: The Johns HopkinsUniversity Press.
Markowitz, G. and D. Rosner. 2002. Deceipt and Denial: The Deadly Politics of Industrial Pollution. Berkeley,CA: University of California Press.
58

77 U.S. Centers for Disease Control and Prevention. 2005. Blood Lead Levels—United States, 1999-2002. MMWR Weekly54:513-516. <http://www.cdc.gov/mmwr/preview/mmwrhtml/mm5420a5.htm> Accessed on May 7, 2007.
78 Lanphear, B.P., R. Hornung, J. Khoury, K. Yolton, P. Baghurst, D.C. Bellinger, R.L. Canfield, K.N. Dietrich,R. Bornschein, T. Greene, S.J. Rothenberg, H.L. Needleman, L. Schnaas, G. Wasserman, J. Graziano, and R.Roberts. 2005. Low-level environmental lead exposure and children's intellectual function: An internationalpooled analysis. Environmental Health Perspectives 113:894-899.
Koller, K., T. Brown, A. Spurgeon, and L. Levy. 2004. Recent developments in low-level lead exposure andintellectual impairment in children. Environmental Health Perspectives 112:987-994.
79 National Research Council. 2000. Toxicological Effects of Methylmercury. Washington, DC: National Academies Press.
Murata, K., P. Weihe, E. Budtz-Jørgensen, P.J. Jørgensen, and P. Grandjean. 2004. Delayed brainstem auditoryevoked potential latencies in 14-year-old children exposed to methylmercury. The Journal of Pediatrics144:177-183.
80 Schober, S.E., T.H. Sinks, R.L. Jones, M.P. Bolger, M. McDowell, J. Osterloh, E.S. Garrett, R.A. Canady, C.F.Dillon, Y. Sun, C.B. Joseph, and K. Mahaffey. 2003. Blood mercury levels in U.S. children and women ofchildbearing age, 1999-2000. Journal of the American Medical Association 289:1667-1674.
81 Mahaffey, K. 2004. Methylmercury: Epidemiological Update, report presented at the 2004 Fish Forum, SanDiego, CA. Washington, D.C.: Environmental Protection Agency.
82 Maine Bureau of Health. 2000. Warning about eating freshwater fish. Augusta, ME: Environmental ToxicologyProgram, Maine Bureau of Health, Revised August 29, 2000. <http://www.maine.gov/dhhs/eohp/fish/2KFCA.htm> Accessed on May 7, 2007.
83 Maine Center for Disease Control and Prevention. 2005. Maine Family Fish Guide. Augusta, ME: Environmentaland Occupational Health Program, Maine Center for Disease Control and Prevention. <http://www.maine.gov/dhhs/eohp/fish/> Accessed on May 7, 2007.
84 Environmental Working Group. 2005. EWG Appeal Requesting Correction to FDA Seafood Advisory Entitled“What You Need to Know About Mercury in Fish and Shellfish: 2004 FDA and EPA Advice for Women who MightBecome Pregnant, Women who are Pregnant, Nursing Mothers, Young Children.” (Docket Number 2004P-0004/CP1). <http://www.ewg.org/issues/siteindex/issues.php?issueid=5010> Accessed on May 7, 2007.
85 Ayotte, J.D., B.T. Nolan, J.R. Nuckols, K.P. Cantor, G.R. Robinson, Jr., D. Baris, L. Hayes, M.R. Karagas, W.Bress, D.T. Silverman, and J.H. Lubin. 2006. Modeling the probability of arsenic in groundwater in New
59

England as a tool for exposure assessment. Environmental Science and Technology 40:3578-3585.
86 Klaassen, C.D., ed. 2001. Casarett & Doull’s Toxicology: The Basic Science of Poisons, Sixth Edition. New York,NY: McGraw Hill Medical Publishing Division.
87 ATSDR. 2005. Toxicological profile for arsenic, draft for public comment. Atlanta, GA: U.S. Department ofHealth and Human Services, Public Health Service.
88 U.S. EPA. 2000. Technologies and costs for removal of arsenic from drinking water. EPA 815-R-00028.Washington, DC: U.S. EPA.
89 Wasserman, G.A., and X. Liu. 2004. Water arsenic exposure and children’s intellectual function in Araihazar,Bangladesh. Environmental Health Perspectives 112:1329–1333.
90 Baldacci, J. 2006. An Order Promoting Safer Chemicals in Consumer Products and Services, Executive OrderNo. 12, FY 06/07, February 22, 2006. Augusta, ME: Office of the Governor.
91 U.S. Centers for Disease Control and Prevention. 2005. Third National Report on Human Exposure toEnvironmental Chemicals. Atlanta, Georgia: National Center for Environmental Health, Division of LaboratorySciences, NCEH Pub. No. 05-0570.
92 McDonald, T. 2005. Polybrominated diphenylether levels among United States residents: daily intake andrisk of harm to the developing brain and reproductive organs. Integrated Environmental Assessment andManagement 1:343-354.
93 Schreder, E. 2006. Pollution in People: A Study of Toxic Chemicals in Washingtonians. Seattle, WA:Toxic-Free Legacy Coalition. <http://www.pollutioninpeople.org> Accessed on May 7, 2007.
94 Patten, S. and D. Baltz. 2005. Taking It All In: Documenting Chemical Pollution in Californians ThroughBiomonitoring. Bolinas, CA: Commonweal Biomonitoring Resource Center.
95 Calafat, A.M., Z. Kuklenyik, S.P. Caudill, J.A. Reidy, and L.L. Needham. 2006. Perfluorochemicals in pooled serumsamples from United States residents in 2001 and 2002. Environmental Science and Technology 40:2128-2134.
96 Schreder, E. 2006. Pollution in People: A Study of Toxic Chemicals in Washingtonians. Seattle, WA:Toxic-Free Legacy Coalition. <http://www.pollutioninpeople.org> Accessed on May 7, 2007.
60

97 Patten, S. and D. Baltz. 2005. Taking It All In: Documenting Chemical Pollution in Californians ThroughBiomonitoring. Bolinas, CA: Commonweal Biomonitoring Resource Center.
98 Environmental Working Group. 2007. Human Toxome Project: Mapping the Pollution in People. Bisphenol A,<www.ewg.org/sites/humantoxome/chemicals/chemical.php?chemid=100357> and BADGE-4OH,<www.ewg.org/sites/humantoxome/chemicals/chemical.php?chemid=100356> Accessed on May 7, 2007.
99 Patten, S. and D. Baltz. 2005. Taking It All In: Documenting Chemical Pollution in Californians ThroughBiomonitoring. Bolinas, CA: Commonweal Biomonitoring Resource Center.
100 Takeuchi, T. and O. Tsutsumi. 2002. Serum bisphenol A concentrations showed gender differences, possiblylinked to androgen levels. Biochemical and Biophysical Research Communications 291:76-78.
101 U.S. Centers for Disease Control and Prevention. 2005. Third National Report on Human Exposure toEnvironmental Chemicals. Atlanta, Georgia: National Center for Environmental Health, Division of LaboratorySciences, NCEH Pub. No. 05-0570.
102 Smith, J.C., P.V. Allen, and R. Von Burg. 1997. Hair methylmercury levels in U.S. women. Archives ofEnvironmental Health 52(6):476-480; cited in National Research Council. 2000. Toxicological Effects ofMethylmercury. Washington, DC: National Academies Press.
103 U.S. Centers for Disease Control and Prevention. 2001. Blood and hair mercury levels in young children andwomen of childbearing age—United States, 1999. Morbidity and Mortality Weekly Report 50:140-143.<http://www.cdc.gov/mmwr/preview/mmwrhtml/mm5008a2.htm> Accessed on May 7, 2007.
104 Pellizzari, E.D. and C.A. Clayton. 2006. Assessing the measurement precision of various arsenic forms andarsenic exposure in the National Human Exposure Assessment Survey (NHEXAS). Environmental HealthPerspectives 114:220-227.
105 Schreder, E. 2006. Pollution in People: A Study of Toxic Chemicals in Washingtonians. Seattle, WA:Toxic-Free Legacy Coalition. <http://www.pollutioninpeople.org> Accessed on May 7, 2007.
61

Visit the Alliance for a Clean and Healthy Maine at www.cleanandhealthyme.org orcontact us at (207) 772-2181, One Pleasant Street, Fourth Floor, Portland, Maine 04101.PRINTED ON 100% POST-CONSUMER CONTENT RECYCLED PAPER, NOT REBLEACHED WITH CHLORINE COMPOUNDS