Reproductions supplied by EDRS are the best that can be - Eric

ID 152,703
AUTHORk TITLE
[ PUB DATEV MOTE
EDRS PRICEDESCRIPTORS
IDEMTIPIERS
BOCIMET 2SONE
TB 006 706
Brown, Alai S.; Itzig, Jerry N.The Interaction of Humor and Anxiety in Academic TestSituations.[76]27p.
HIP-S0'.03 HC -$2.06 Plus Postage.Academic Achievement; *Anxiety; *Arousal Patterns;Higher Education; *Humor; Multiple'Choice Tests;*Performance Pactors;-Questionnaires; ResearchProblems;' Response Stile (Tests); Self Evaluation;Test Constriction; Testing; *Testing Problems; *TestItems; Undergraduate StudentsSelf Evaluation Questionnaire; State Trait AnxietyInventory; *Test Anxiety
ABSTRACTThe effects of humorous test questions on test
performance of high and low-anxious college students wasinvestigated. It was hypothesized that humor should reduce theanxiety level of high-anxious subjects, and thus improve theirperformance, vile having little effect on low-anxious subjects.Students were assigned to a low or high-banxious group depending upontheir responses to the Self-Evaluation Questionnaire part of theState-Trait Anxiety. Inventory. Humor was introduced to the test.bydropping one of the three incorrect alternatives in the multiplechoice section and substituting an absurd alternative. Fourexperimental groups were formed by assigning low and high-anxietygroups to the humorous or nonhunorous version of the second test..High-anxious subjects did relatively better on the nonhumorous test,while low-anxious subjects scored relatively better on the humoroustest. This supported the conception of an inverted U-shaped functionrelating arousal to performance: increased arousal induced thehumorous; questions facilitated low-anxious while hindering.high-anxious-subjects. Humorous questions should be avoided becauseof the risk of differentially biasing the testing situation againststudents who have a higher anxiety or arousal level. Twomethodological problems present in previous research--initialequivalence of high and lox anxious subjects on the performancedimension, and reactivity and performance-produced anxiety bias--wereeliminated in the present design. (Author/CP)
************************************************************************ Reproductions supplied by EDRS are the best that can be made ** r from the original document. ************************************************************************

U.S. DEPARTMENT OF HEALTH,EDUCATION & WELFARENATIONAL INSTITUTE OF
EDUCATION
THIS DOCUMENT HAS BEEN REPRO,DUCED EXACTLY AS RECEIVE() FROMTHE PERSON OR ORGANIZATION ORIGIN-ATING IT. POINTS OF VIEW OR OPINIONSSTATED DO NOT NECESSARILY REPRE-SENT OFFICIAL NATIONAL INSTITUTE OFEDUCATION POSITION OR POLICY
The Interaction of Humor and Anxiety in Academic Test Situations
Alan S. Brown and Jerry M. Itzig
"PERMISSION TO REPRODUCE THISSouthern Methodist University MATERIAL HAS BEEN GRANTED BY
Auw S. BAbLorl)
TO THE EDUCATIONAL RESOURCESINFORMATION CENTER (ERIC) ANDUSERS OF THE ERIC SYSTEM."
Running head: Humor, Anxiety, and Test Performance

0' The Interaction
1
Abstract
The effects of humorous test questions on examination performance of high-
and low-anxious subjects was investigated. It was hypothesized that humor
should reduce the anxiety level of high-anxious subjects, resulting in im-
proved performance, while having little effect on low-anxious subjects.
However, the data contradicted this postulation. Comparing humorous and
nonhumorous exams, high-anxious subjects performed relatively better on the
nonhumorous one, while low-anxious subjects scored relatively better on the
humorous one. This supported the conception of an inverted U-shaped func-
tion relating arousal to performance: increased arousal induced by the
humorous questions facilitated low-anxious while hindering high-anxious
subjects. Two methodological problems present in previous research were
discussed, and eliminated in the present design.
3

The Interaction
2
The Interaction of Humor and Anxiety in Academic Test Situations
The influence of level of anxiety on test performance has been a topic
of considerable interest in psychological research, from both theoretical
and practical perspectives. In the theoretical sense, the anxiety-perfor-
mance relationship has been used to examine internal versus external
attentional mechanisms (e.g., Liebert & Morris, 1967; Wine, 1971), dominant
(correct) versus nondominant (incorrect) response tendencies (e.g., Montague,
1953), and various levels of activation (e.g., Munz, Costello, & Korabik,
1975).
From a practical vantage point, the concern over the anxiety-performance
relationship is obvious. Educators have long been aware of the possible
detrimental effects of high anxiety levels on test performance, and, therefore,
the need to eliminate its possible confounding influence. A number of
different efforts have been directed at reducing the anxiety level of high
anxious students, involving both direct and indirect procedures.
The direct manipulations usually involve some type of counseling, such
as systematic desensitization (cf. Wine, 1971), cognitive modification
(Meichenbaum, 1972), or covert reinforcement (Guidry & Randolph, 1974). On
the other hand, the indirect manipulations focus on changing the test
stimulus environment as a means to reduce the level of anxiety. Within
this framework, several techniques seem to have some success at reducing
test anxiety (as inferred from higher test scores) for high-anxious students.
These can be classed as either (a) pertaining to the general examination
procedure, such as increased frequency of examinations (Dustin, 1971) and
4

The Interaction
3
opportunity to comment on the questions (Paul & Eriksen, 1964; Smith &
Rockett, 1958), or (b) specific item manipulations, such as spreading the
difficult items throughout the examination sequence (Munz & Smouse, 1968)
or using humorous test items (Smith, Ascough, Ettinger, & Nelson, 1971;
Terry & Woods, 1975).
The primary purpose of the present study was to attempt to reduce
anxiety (and therefore improve performance) of high anxious subjects through
use of humorous test questions. HOWever, there are two important methodo-
logical problems with research on the anxiety-performance relationship,
which will be commented on below. The secondary purpose of the present
investigation was to present an improved procedure which will eliminate
these problems and allow for a more unambiguous interpretation of the em-
pirical outcome.
The first problem concerns the initial equivalence of the high-and low-
anxious subjects on the performance, or dependent variable, dimension. As
Campbell and Stanley (1966) have pointed out, it is essential to determine
the equivalence of the groups at the outset of the study in order to ensure
the internal validity of the results. Previous investigations in this area
have consistently failed to check on the equivalence of the test-taking ability
of subjects differing in anxiety level prior to the instigation of the'mani-
pulation. Although some studies have used a repeated measures design (French,
1962; Paul & Eriksen, 1964), they have not used a preliminary test as a basis
for equating the groups.
The other problem relates to the procedures employed in determining
the subjects' anxiety level. Typically, anxiety has been differentiated
5

The Interaction
4
into two different varieties: trait and state. Trait anxiety refers to
an individual's general base level of anxiety which he/she typically ex-
periences while state anxiety concerns the level'of anxiety experienced in
a given situation. The particular type of state anxiety of interest in the
research on the anxiety-performance relationship is test anxiety. As
Sarason (1960) has pointed out,
...the majority of studies relating measures of general anxiety to
measures of intellectual performance have yielded nonsignificant
correlations....However, studies which have related test anxiety
...to measures of intellectual performance have shown consistent
.negative correlations. (pp. 407-408)
Ideally, some measure of test anxiety would be more appropriate than
a measure of general anxiety for studies probing the effects of a manipula-
tion on the anxiety-test performance relationship. HOwever, the use of
a test-anxiety scale is methodologically unsuited to such studies, for the
following reasons.
Reactivity bias. If the test-anxiety questionnaire is presented prior
to the actual test (whether minutes, days, or weeks), there always exists
,the possibility that this pretest in some way sensitizes and/or alters
the normal behavior of subjects on the subsequent test (see Campbell &
Stanley, 1966). For instance, the fact that a student has stated earlier
that he/she is high test anxious may in some way interfere with later per-
formance, or the opposite (low anxious rating may be facilitative). It is
easily conceivable that some sort of self-fulfilling expectation may mediate
this effect.
6

The Interaction
5
Performance-produced anxiety bias. On the other hand, if the ques-
tionnaire is given after the test, it is quite conceivable that a subject
may not accurately judge his/her level of anxiety during the test, but
rather do one of the following:
1. Judge the current (post-test) level of anxiety and attribute it
as having existed during the exam. This level of anxiety could easily be
generated by the level of performance exhibited on the test. That is,
successful performance would end up producing an eventual low level of
post-test anxiety, while unsuccessful performance would generate a higher
level of post-test anxiety.
2. Related to this first point, they may infer their level of test
anxiety from their perceived performence. Specifically, they may intuitively
assume that because they did poorly, they were anxious or because they did
well, they were relatively at ease (disregarding, of course, their present
post-test level of anxiety).
Both of these biases (reactivity and performance-produced anxiety) are
technically impossible to eliminate whenever a test-anxiety questionnaire
is used. Although there is no way to directly confirm the existence of
these biases, indirect support is derived from the consistent negative re-
lationship between measures of performance and test (or state) anxiety
(Alpert & Haber, 1960; Cowen, 1957; Mandler & Cowen, 1958; Osterhouse, 1975;
Pad]. & Eriksen, 1964; Sarason, 1957, 1959; Sarason & Mandler, 1952; Smith,
Ascough, Ettinger, & Nelson, 1971; Snyder & Katahn, 1970; Spielberger, 1966).
Whether the questionnaire is given prior to, or after, the critical per-
formance measure, a negative relationship would be expected between anxiety

The Interaction
6
level and test score.
Because of these problems, a general measure of anxiety was used in
the present study to differentiate between high and low anxious subjects.
The use of a general scale seems to be justified because (a) previous studies
show that there is a strong positive relationship between trait and test
(or state) anxiety (O'Neil, Hansen, & Spielberger, 1969; O'Neil, Spielberger,
& Hansen, 1969; Spielberger, Gorsuch, & Lushene, 1970; Wittmaier, 1974),
(b) the test does index a general level of anxiety which persists across
a variety of situations, including testing, and (c) the aforementioned
biases are avioded because there is no ostensible relationship between
the general anxiety scale and the testing situation.
To summarize, the present investigation involved an examination of
the effects of test question manipulation (humorous versus nonhumorous)
on examination performance of high- and low-anxious students, with anxiety
level determined by the Self-Evaluation Questionnaire (Spielberger, Gorsuch,
& Lushene, 1970) and performance levels among the four anxiety text type
groups equated on the basis of the first course examination. It was hypo-
thesized that the humorous questions should have a facilitating effect on
the high-anxious students through the reduction of examination anxiety, while
having no effect on low-anxious students.
Method
Subjects. Sixty-three undergraduate psychology majors enrolled in an
upper-level course (Sensation and Perception) at Southern Methodist Univer-
sity participated in the study.
Group. formation. During the second week of classes, all 63 students
8
The Interaction
7
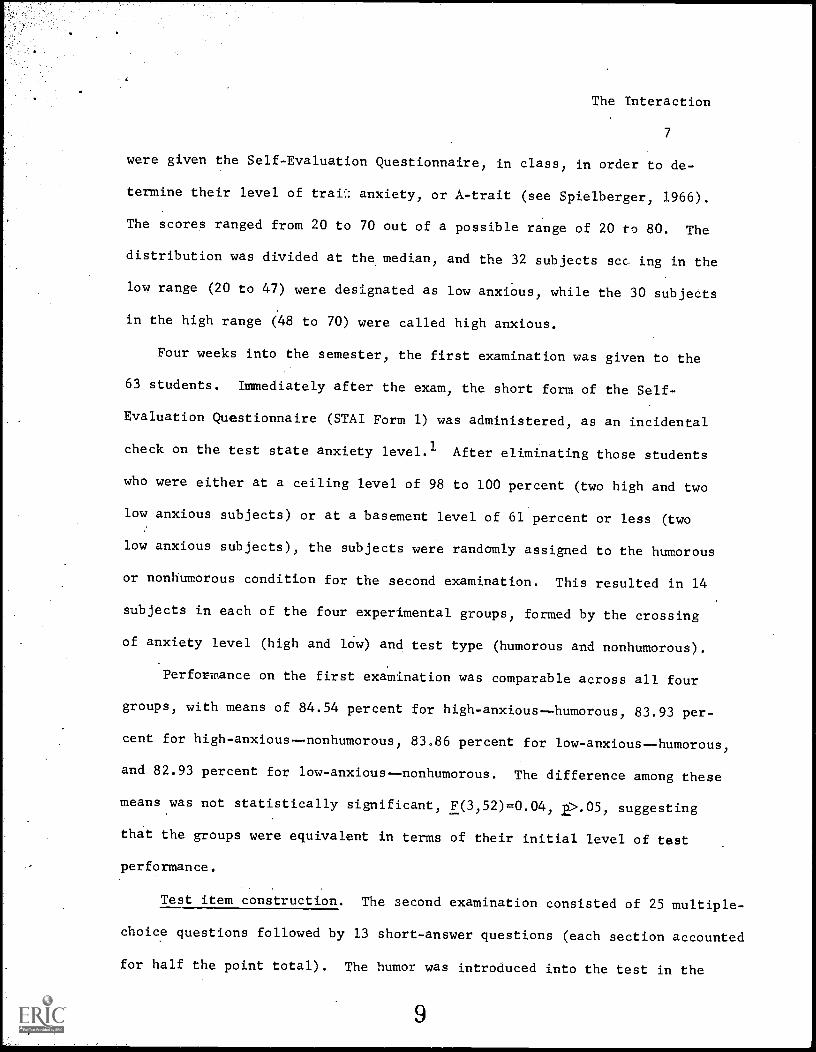
were given the. Self-Evaluation Questionnaire, in class, in order to de-
termine their level of trail: anxiety, or A-trait (see Spielberger, 1966).
The scores ranged from 20 to 70 out of a possible range of 20 to 80. The
distribution was divided at the median, and the 32 subjects scc ing in the
low range (20 to 47) were designated as low anxious, while the 30 subjects
in the high range (48 to 70) were called high anxious.
Four weeks into the semester, the first examination was given to the
63 students. Immediately after the exam, the short form of the Self-
Evaluation Questionnaire (STAI Form 1) was administered, as an incidental
check on the test state anxiety level. 1 After eliminating those students
who were either at a ceiling level of 98 to 100 percent (two high and two
low anxious subjects) or at a basement level of 61 percent or less (two
low anxious subjects), the subjects were randomly assigned to the humorous
or nonhumorous condition for the second examination. This resulted in 14
subjects in each of the four experimental groups, formed by the crossing
of anxiety level (high and low) and test type (humorous and nonhumorous).
Performance on the first examination was comparable across all four
groups, with means of 84.54 percent for high- anxious humorous, 83.93 per-
cent for high-anxious--nonhumorous, 83.86 percent for low-anxious--humorous,
and 82.93 percent for low-anxious--nonhumorous. The difference among these
means was not statistically significant, F(3,52)=0.04, 2>.05, suggesting
that the groups were equivalent in terms of their initial level of test
performance.
Test item construction. The second examination consisted of 25 multiple-
choice questions followed by 13 short-answer questions (each section accounted
for half the point total). The humor was introduced into the test in the
9

The Interaction
8
following manner: for eight of the multiple-choice items, one of the three
incorrect alternatives. was randomly dropped and a humorous alternative
substituted in its place (i.e., "The gelatin-like covering called the
cupula fits over the: (a) crista, (b) macula, (c) sacculus, (d) pineapple
chunks and Bing cherries").
It was decided to put the humor into the alternatives, rather than
the stem, of the questions because (a) it would be more difficult to main-
tain equal difficulty of the items between the humorous and nonhumorous forms
of the test if the stem was altered, and (b) the subjects could conceivably
havea more difficult time separating out the humor from the essential con-
tent, in order to arrive at an answer.
Test procedure. The critical manipulation occurred at the second
examination, given four weeks after the first. At this time, the subjects
were given either the humorous or nonhumorous form of the test (as randomly
determined earlier). After completion of the examination, they were asked
(but not required) to fill out the Self-Evaluation Questionnaire, as after
the first examination. In addition, those subjects who were given the
humorous form of the test were asked to fill out a short questionnaire on
the effects of the humorous questions.
Results
. On the second examination, one subject (in the high-anxious--nonhumorous
group) dropped 31 percentage points (89 to 58). It was decided to drop
this subject because of the strong suspicion that he was not performing
within the normal range on either or both occassions (the next largest change
from the first to second examination was only 13 percent). In order to
10

The Interaction
9
equalize the size of the four groups, one subject was randomly dropped
from each of the other three, resulting in a total of 13 subjects per group.
The average performance for each of the four groups on both examinations
is presented in Figure 1. This information reveals several important points.
Insert Figure 1. about here
First, dropping a subject from each of the groups did not alter their equi-
valence on the first examination. A post-hoc comparisonof the means
(Duncan's Multiple Range Test) revealed no significant differences (2?.05)
among them. Second, and more importantly, performance of subjects in the
high-anxious--humorous condition declined while those in the high- anxious
nonhumorous group improved. This is contrary to the expectation proposed
earlier that humor would improve performance for high-anxious subjects.
Furthermore, low-anxious subjects also diverged on the second test, but
in the opposite manner: those getting the humorous questions improved,
while those getting the nonhumorous questions declined. This is also con-
trary to the expectation of no differential effects of humor with low-
anxious subjects.
An analysis of variance confirmed the reliability of this finding, in
that the interaction of anxiety level by test type by test was statistically
significant, F(1,48)=8.68, 25.01. The only other statistically significant
effect was due to test, F(1,48)=6.52, 25.05, with performance level increasing
from the first to the second examination. All other main effects and inter-
actions were not significant (2>.05).
The state anxiety levels of the four groups at the two tests are pre-
11

The Interaction
10
sented in Table 1. Because the questionnaire was not compulsory, there
Insert Table 1 about here
were 12 of the 52 subjects who did not take it at one, or both, of the
examinations (these differences in N are noted in the table). Due to
this differential subject attrition, coupled with the afore-mentioned
interpretive problem when a test-anxiety questionnaire is given after a
test, the results should be cautiously interpreted. It appears that the
level of anxiety declined in all four groups. However, the drop was sta-
tistically significant for the low-anxious--nonhumorous group, only.
Comparisons were also made between state-anxiety levels and per-
formance. A Pearson product-moment correlation was computed between the
self-rated test anxiety and test score, separately for both the first
(r=-.24) and second (r=-.42) mid-term examinations. This correlation was
significant (2(.05) for the second, but not the first, exam. This finding
is congruent with a large number of previous studies noting the negative
relationship between test performance and anxiety.
Finally, the questionnaires concerning the effects of the humu.ous
questions on the subjects were examined. As shown in Table 2, the eval-
Insert Table 2 about here
uations of the effects are very similar for both the high and low anxious
subjects (NOTE: because this questionnaire was not compulsory, two high
and two low anxious subjects did not fill one out). Besides the equiva-
lent overall subjective effects of the humorous questions on the high and
12

The Interaction
11
low anxious subjects, this information also suggests that the humorous
questions (a) did tend to alleviate some of the anxiety, (b) improved
the estimated level of performance, and (c) are desired on examinations.
Discussion
The most striking outcome of the present investigation was that not
only did the humorous questions not help the high-anxious subjects, it even
seemed to hinder performance relative to the high- anxious nonhumor group.
This, of course, is completely contradictory to the hypothesis that the
humorous questions should improve test performance through a reduction of
test anxiety. This result is doubly puzzling because it is counterintuitive,
as well as being counterhypothetical.
An alternative possibility is that the humorous questions actually
increased, rather than decreased, the anxiety level of the high-anxious
subjects (inferring backwards from performance to internal state). There
are, however, two lines of evidence which argue against this conjecture:
(a) low-anxious subjects performed better when given the humorous test
(compared to the nonhumorous test) and (b) the subjects consistently re-
ported that the humorous questions helped to relieve their anxiety levels
(subjectively assessed).
Another possibile explanation is that arousal level, rather than anxiety
level, may be the critical variable influencing performance in this situation.
As Uehling (1972) has pointed out, it is usually assumed that there is some
optimal arousal level for performance of a given task (which varies system-
atically as a function of task complexity, instructions, etc.). One theo-
retical position on the relationship between these two variables is that
13
The Interaction
12
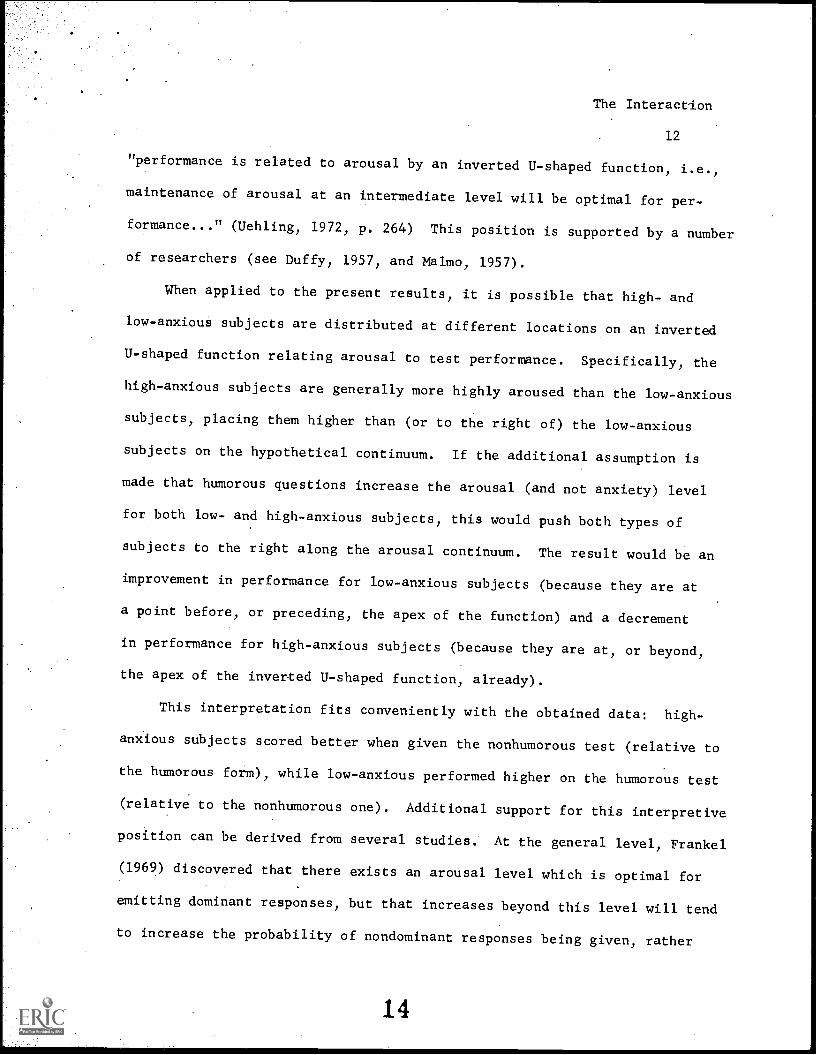
"performance is related to arousal by an inverted U-shaped function, i.e.,
maintenance of arousal at an intermediate level will be optimal for per-
formance..." (Uehling, 1972, p. 264) This position is supported by a number
of researchers (see Duffy, 1957, and Malmo, 1957).
When applied to the present results, it is possible that high- and
low-anxious subjects are distributed at different locations on an inverted
U-shaped function relating arousal to test performance. Specifically, the
high-anxious subjects are generally more highly aroused than the low-anxious
subjects, placing them higher than (or to the right of) the low-anxious
subjects on the hypothetical continuum. If the additional assumption is
made that humorous questions increase the arousal (and not anxiety) level
for both low- and high-anxious subjects, this would push both types of
subjects to the right along the arousal continuum. The result would be an
improvement in performance for low-anxious subjects (because they are at
a point before, or preceding, the apex of the function) and a decrement
in performance for high-anxious subjects (because they are at, or beyond,
the apex of the inverted U-shaped function, already).
This interpretation fits conveniently with the obtained data: high-
anxious subjects scored better when given the nonhumorous test (relative to
the humorous form), while low-anxious performed higher on the humorous test
(relative to the nonhumorous one). Additional support for this interpretive
position can be derived from several studies. At the general level, Frankel
(1969) discovered that there exists an arousal level which is optimal for
emitting dominant responses, but that increases beyond this level will tend
to increase the probability of nondominant responses being given, rather
14
The Interaction
13
than the dominant ones. This can be related to the present investigation
by assuming that dominant responses are the correct ones while nondominant
responses are the incorrect ones.
At a more specific level, Munz, Costello, and Korabik (1975) attempted
to verify the notion that the inverted U-shaped function directly mediated
the relationship between anxiety and performance in a test situation. They
found that subjects with a high (debilitators) or low (non affecteds) level
of arousal (or activation level) performed significantly poorer on a class-
room examination than those possessing an intermediate level of arousal
(facilitators). Furthermore, both Paul and Eriksen (1964) and Terry and
Woods (1975) suggested that this inverted U-shaped conceptualization pro-
vided a good interpretive framework for their results, where attempts were
made to directly manipulate anxiety levels in the test situation. This
held true for both adults (Paul & Eriksen) and children (Terry & Woods).
Before finishing a discussion of this result, it should be contrasted
to Smith et al. (1971), because they also used test question humor in an
attempt to manipulate anxiety level in a regular examination situation.
Their outcome appears to contradict the present findings, in that humorous
items facilitated performance for high-anxious subjects while having no
effect on low-anxious subjects. However, it is difficult to directly com-
pare the two studies because their study suffers from the two methodological
flaws which the present study attempted to correct (i.e., determination of
anxiety through a test-anxiety questionnaire and no equating of base level
performance for the various groups). It is interesting to note, however,
that their moderate-anxiety subjects exhibited a substantial (but not sig-
15

The Interaction
14
nificant) decrement in performance when given the humorous test (relative
to the nonhumorous form). This forced them to conceed that "...the manner
in which humor affects performance may be a complex function of the level
of anxiety being experienced." (p. 245) They also include an additional
observation, which is even more pertinant to the present interpretive
position: "several of the subjects in the moderate-anxiety--humorous-
test condition later remarked that while the humorous items served to
'loosen them up' somewhat, they also had a somewhat distracting effect on
them." (p. 245) Similar to this, the high-anxious subjects in the present
study may have had their subjective level of tension reduced (as suggested
by the questionnaire) while, at the same time, experiencing an increase in
their arousal level (which they were not directly aware of, but which
nonetheless created a distinct hindrance to performance).
Several other aspects of the results deserve comment. To begin with,
both the lack of a relationship between general anxiety level and test
performance (no significant difference among groups on the first examination)
and presence of a negative relationship between test-state anxiety and test
performance are congruent with previous studies, as discussed earlier.
Further, there was a positive (but nonsignificant) correlation between
trait and test-state anxiety levels for both the first (r=.27) and second
(r=.23) examinations. This is also consistent with previous research, and
gives some additional post hoc justification for using the general anxiety
measure as a valid index of test anxiety.
Conclusion
The present investigation was an attempt to approach the investigation
16

The Interaction
15
of the anxiety-performance relationship in a practical setting with the
use of improved methodological techniques. In terms of the improved
methodology, it was suggested that there is no way to obtain an unbiased
indication of test anxiety directly through a test-anxiety questionnaire,
and that a general anxiety measure is preferable. In addition, some sort
of performance premeasure is essential for interpretive clarity. The
outcome of the study suggested that an attempt to reduce the anxiety level
of high- anxious subjects through the use of humorous test items was not
successful. In fact, it appears that the humorous questions increased
the arousal level of both the high- and low-anxious subjects, a shift
which was beneficial for the low-anxious but detremental for the high-
anxious subjects.
The practical implications of this finding are clear. It is almost
a universal assumption that humor in examinations will in some way aid
the students taking the test. However, the present study indicated that
this may not be the case, especially when considering high-test-anxious
students (see Levine and Abelson, 1959, for more discussion of this point).
Therefore, it is suggested that humorous test questions should be avoided
because of the risk of differentially biasing the testing situation against
students who have a higher anxiety, or arousal, level.
17

The Interaction
16
References
Alpert, R., & Haber, R. N. Anxiety in academic achievement situations.
Journal of Abnormal-and Social Psychology, 1960, 61, 207-215.
Campbell, D. T., & Stanley, J. C. Experimental and quasi-experimental
designs for research. Chicago: Rand McNally, 1966.
Cowen, J. E. Test anxiety in high school students and its relationship
to performance on group tests. Unpublished doctoral dissertation,
School of Education, Harvard University, 1957.
Duffy, E. The psychological significance of the concept of "arousal" or
activation. Psychological Review, 1957, 64, 265-275.
Dustin, D. Some effects of exam frequency. Psychological Record, 1971,
21, 409-414.
Frankel, A. S. Effects of arousal on hierarchically organized responses.
Journal of Experimental Psychology, 1969, 82, 385-389.
Levine, J., & Abelson, R. Humor as a distracting stimulus. Journal of
General Psychology, 1959, 60, 191-200.
Liebert, R., & Morris, L. Cognitive and emotional components of test
anxiety: A distinction and some initial data. Psychological Reports,
1967, 20, 975-978.
Malmo, R. B. Anxiety and behavioral arousal. Psychological Review, 1957,
64 276-287.
Mandler, G., & Cowen, J. E. Test anxiety questionnaires. Journal of
Consulting Psychology, 1958, 22, 228-229.
Guidry, L. S., & Randolph, D. L. Covert reinforcement in the treatment of
test.anxiety. Journal of Counseling Psychology, 1974, 21, 260-264.
18

The Interaction
17
Meichenbaum, D. H. Cognitive modification of test anxious college stu-
dents. Journal of Consulting and Clinical Psychology, 1972, 39,
370-380.
Montague, E. K. The role of anxiety in serial rote learning. Journal of
Experimental Psychology, 1953, 45 91-95.
Munz, D. C., Costello, C. T., & Korabik, K. A further test of the inverted-
U hypothesis relating achievement anxiety and academic test performance.
Journal of Psychology, 1975, 89, 39-47.
Munz, D. C., & Smouse, A. D. The interactive effects of item difficulty
sequence and achievement anxiety reaction on academic performance.
Journal of Educational Psychology, 1968, 59, 370-374.
O'Neil, H. F., Jr. Hanson, D. N., & Spielberger, C. D. Errors and latency
of response as a function of anxiety and task difficulty. Paper pre-
sented at the American Educational Research Association, Los Angeles,
February, 1969.
O'Neil, H. F., Jr., Spielberger, C. D., & Hansen, D. N. The effects of
state-anxiety and task difficulty on computer-assisted learning.
Journal of Educational Psychology, 1969, 60, 343-350.
Osterhouse, R. A. Classroom anxiety and the examination performance of
test-anxious students. The Journal of Educational Research, 1975,
68, 247-250.
Paul, G. & Eriksen, C. W. Effects of anxiety on "real-life" examinations.
Journal of Personality, 1964, 32, 480-494.
The Interaction
18
Sarason, I. G. Test anxiety, general anxiety, and intellectual perform-
ance. Journal of Consulting Psychology, 1957, 21, 485-490.
Sarason, I. G. Intellectual and personality correlates of test anxiety.
Journal of Abnormal Social Psychology, 1959, 59, 272-275.
Sarason, I. G. Empirical findings and theoretical problems in the use of
anxiety scales. Psychological Bulletin, 1960, 57, 403-415.
Sarason, S. B. & Mandler, G. Some correlates of test anxiety. Journal of
Abnormal Social Psychology, 1952, 47, 810-817.
Smith, R. E., Ascough, J. C., Ettinger, R. F., & Nelson, D. A. Humor,
anxiety, and task performance. Journal of Personality and Social
Psychology, 1971, 19, 243-246.
Smith, W., & Rockett, F. Anxiety and test performance. Journal of
Educational Research, 1958, 52, 138-141.
Snyder, C. R., & Katahn, M. Comparison levels, test anxiety, ongoing
affect and complex verbal learning. Americal Journal of Psychology,
1973, 86, 555-565.
Spielberger, C. D. Theory and research on anxiety. In C. D. Spielberger
(Ed.), Anxiety and behavior. New York: . Academic Press, 1966.
Spielberger, C. D., Gorsuch, R. L., & Lushene, R. E. Manual for the State-
Trait Anxiety Inventory. Palo Alto, California: Consulting Psycho-
logical Press, 1970.
Terry; R. L., & Woods, M. E. Effects of humor on the test performance of
elementary school children. Psychology in the Schools, 1975, 3, 182-185.
20

The Interaction
19
Uehling, B. S. Arousal in verbal learning. In C. P. Duncan, L. Sechrest,
& A. W. Melton (Eds.), Human memory: Festschrift for Benton J.
Underwood. New York: Appleton-Century-Crofts, 1972.
Wine, J. Test anxiety and direction of attention. Psychological
Bulletin, 1971, 76, 92-104.
Wittmaier, B. C. Test anxiety, mood, and performance. Journal of
Personality and Social Psychology, 1974, 29, 664-669.
21
The Interaction
21
Footnotes
The authors wish to express their appreciation to Dr. William H.
Tedford for permission to use hisclass for thc: study, as well as for
construction of examination questions.
1Thanks are due to Dr. James Papy for his permission to use the
retrospective version of the Self-Evaluation Questionnaire.
22

The Interaction
Table 1
Mean State Anxiety Levels
at Both Examinations for each Experimental Group
22
Examination Examination
Group 1 2 t ratio
High-anxious--humora 62.88 59.88 1.26
High-anxious--nonhumorb
61.10 57.90 0.91
Low-anxious--humorb 60.00 56.60 1.81
Low -anxious--nonhumorc
58.92 54.75 2.55*
a N=8
bN=10
N=12
* P<O5
23

The Interaction
22
Table 2
Response Frequencies to Questionnaire
Assessing the Effects of the Humorous Questions
Question
High-anxious Low-anxious
subjectsa subjectsa
1. When you encountered a humorous question,
how did it make you feel:
a. tense 0 0
b. relieved 11 9
c. no different 0 2
2. Did the humor:
a. facilitate 8 8
b. hinder 0 0
c. have no effect3 3
on your answer to the question
it was in?
3. Do you feel that the humorous questions:
a. helped 11 8
b. hindered 0 0
c. had no effect on 0 2
you while you were taking the test?
24

4. Did you find the humorous questions:
a. easier
b. harder
c. no different
to understand than the nonhu-
morous questions?
5. Would you like to see tests contain:
a. more
b. less
c. about the same number of
humorous questions as this test?
The Interaction
23
5
0
6
G
0
7 7
0 0
4 4
.
aN=11
25

The Interaction
24
Figure Captions
Figure 1. Mean percent correct on the first and second examinations
for each experimental group.
26

P Low-anx. Humor
High-anx. Nonhumor