
Board Workshop on Pupil Assignment St. Lucie County School District August 17, 2005.
76
Board Workshop on Pupil Assignment St. Lucie County School District August 17, 2005
-
Upload
carmella-gaines -
Category
Documents
-
view
216 -
download
2
Transcript of Board Workshop on Pupil Assignment St. Lucie County School District August 17, 2005.

Board Workshop on Pupil Assignment
St. Lucie County School District
August 17, 2005

Introduction The UNC Charlotte Urban Institute
Not-for-profit outreach unit of UNC Charlotte
Technology Services and Training 18 years experience working with school planning
issues
Roll/Philosophy UNC Charlotte Urban Institute to facilitate, inform,
recommend as an outside entity Open, Community–Based Process Use latest technology to provide information to
citizens, staff and elected officials Deal with difficult growth issues head-on Work to incorporate latest research and thinking in
recommendations

Our Charge (Tonight’s Agenda) Summarize and analyze data
Create GIS system files for analysis of student population
Propose options for changes to the student assignment system for discussion in the community in the fall of 2005 With feedback from the district and survey data also
provided by SLCS,

Our Charge - Specifics Develop options that are:
Modifications of current system Complete revisions to that system
Show potential impacts to assist decision makers
Next Steps (After Tonight) Detailed proposals will be developed as
variations of the preferred approach based on the Board’s response to these data and proposals
Public involvement throughout process

Final Outcomes Board makes decision on changes to pupil
assignment plan UNC Charlotte delivers GIS data files to
St. Lucie County Schools to allow for creation of their own GIS analysis tools for future use

Summary and Analysis of Data
Process – Develop Planning Data Integrate student data with GIS to create
visualization and analysis tool Data Collection Items Reviewed:
Recent survey data from parents Staff Interviews on Student Assignment Process St. Lucie County data for residential development Fishkind and Associates Student projections

Parent Survey Summary SLCS developed a 21 question public survey
with multiple sources of input Results were reviewed in June

Survey Results Response rate
7,243 paper survey responses 1,126 internet survey responses Over 1,900 written comments transcribed (23% of
all surveys received had comments)
Total of 8,369 survey responses Represents 38.4% of parents

Summary of Survey Results• Parents want to continue to have choices for
their children.• Parents want the ability to choose their
neighborhood school and get it.• Parents want diversity in their schools.• Academics, location and reputation of school
are decision factors.

Summary of Survey Results• Strong agreement with parents having choices,
duplication of programs, fairness in assignment, siblings in same schools, stability of assignment and proximity preference regardless of other factors.
• The biggest problem is long bus rides for children who don’t get their first choice.

Data on Growth Consultant data on projections of student
enrollment growth County Residential Permits
Approved Pending Proposed

Percent Change in Total Students from 2005-2015
Fishkind Data 2005

Residential Growth

Growth Analysis
Approved% of Total Pending
% of Total Proposed
% of Total Total % of Total
Choice Zone 1 7,898 9.9 10,291 12.9 10,578 13.2 28,767 36.0
Choice Zone 2 14,575 18.2 32,316 40.5 0 0.0 46,891 58.7
Choice Zone 3 3,281 4.1 952 1.2 0 0.0 4,233 5.3
Total 25,754 32.2 43,559 54.5 10,578 13.2 79,891 100.0
Residential Growth by Current Choice Zone
Source: SL County Planning

Residential Permit Analysis Map
Demographic Overview Current Zone Profiles North, South (Midway Road) Profiles Fort Pierce Profile
DataData was assembled from two independent sources (St Lucie County School System, student data and St LucieCounty GIS Department, street centerlines). While effortswere made to reconcile differences, some errors may beincluded in the final dataset. The dataset was assembled tobe a tool, which informs the school assignment processand provides a basis for public discussion and input. Userdiscretion should be employed – especially when using fora small scale analysis. Point in time – May 2005.

Data 34,116 students
(‘04-’05 St Lucie County School Dataset) 33,552 students “geocoded” or matched to the street
map 98.3% overall student locations geocoded
Data analysis reflects those that were successfully geocoded.

St Lucie County Public School Demographic Profile
African American,
28.1
Asian, 1.5
White, 49.8
Hispanic, 16.8
Native American,
0.3
Multi-racial, 3.5
Total Population Census 2000: 79% White, 15% African American, 13% Hispanic (of any race)
High45.9
Low54.1
Racial Socioeconomic

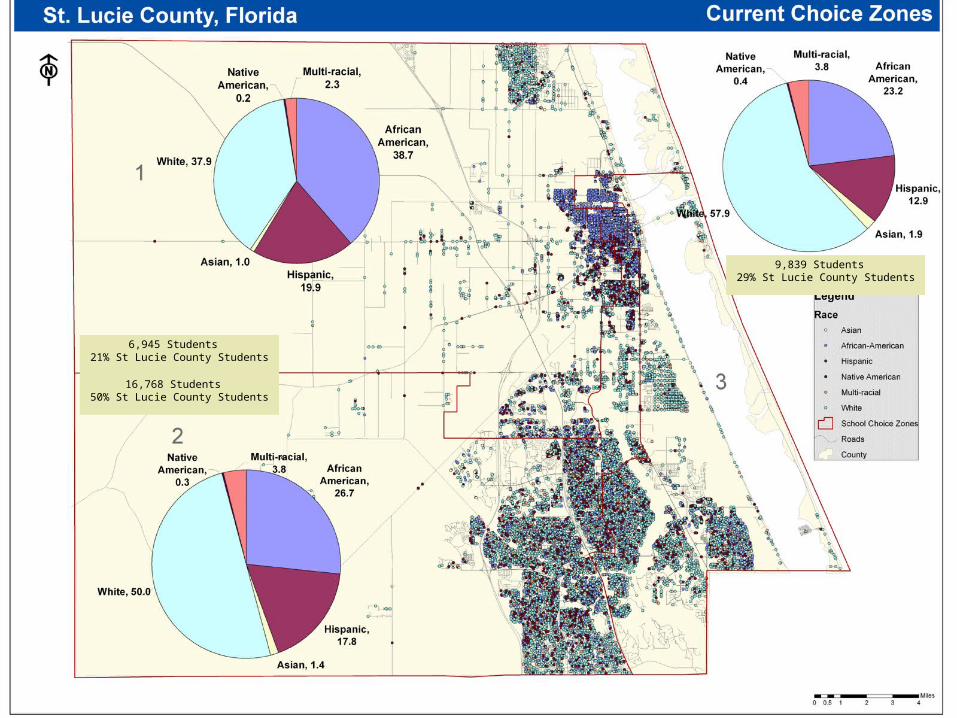
6,945 Students 21% St Lucie County Students
16,768 Students 50% St Lucie County Students
9,839 Students 29% St Lucie County Students
6,945 Students 21% St Lucie County Students
16,768 Students 50% St Lucie County Students
9,839 Students 29% St Lucie County Students

Description of Current Demographics Unique development pattern resulting in high
level of racial and economic diversity Pattern of lower socioeconomics in Ft. Pierce Expectation of less socioeconomic diversity in
areas of new growth unless affordable housing is required

Choice Zone 1
Choice Zone 2
Choice Zone 3
Current Choice Zones: Economic Composition
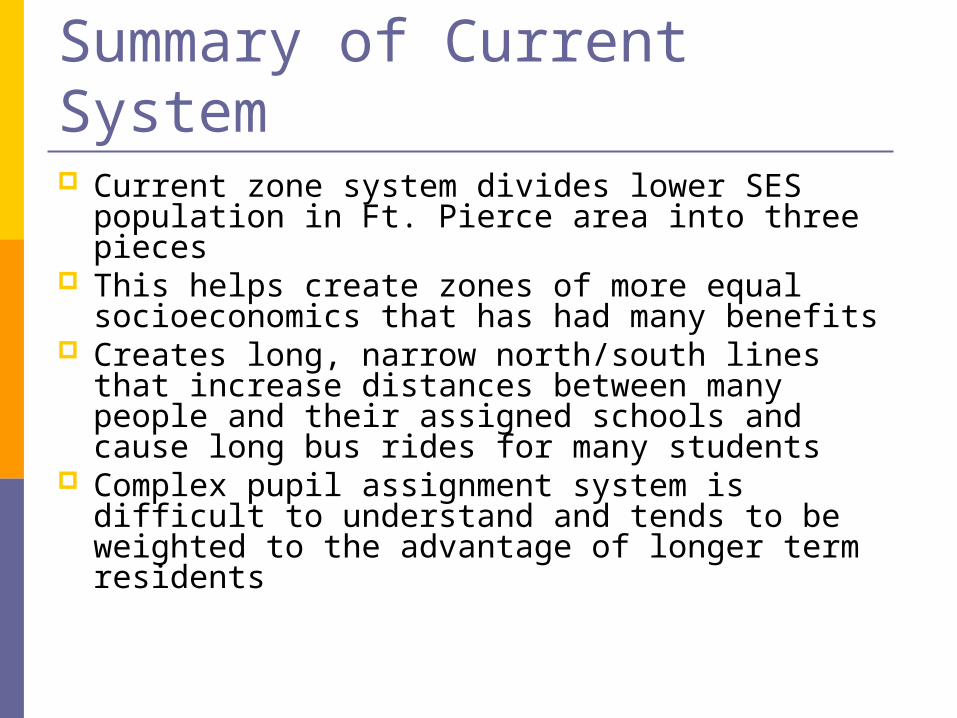
Summary of Current System Current zone system divides lower SES population in Ft.
Pierce area into three pieces This helps create zones of more equal socioeconomics
that has had many benefits Creates long, narrow north/south lines that increase
distances between many people and their assigned schools and cause long bus rides for many students
Complex pupil assignment system is difficult to understand and tends to be weighted to the advantage of longer term residents

Develop Proposals

Our Charge - Specifics Develop options that are:
Modifications of current system Complete revisions to that system
Show potential impacts to assist decision makers

What People Want Everything
Choice Neighborhood schools Diversity Short bus rides Access to popular magnets Seats in their closest school Academically successful schools
Some “wants” may mean different things to different people may be in conflict with each other

Community Consensus Requires an open, impartial process that involves public
input and the understanding that there is not a right answer
Situation that naturally leads to tense public debate and a “minefield” for school and elected officials
The greater community must come together to agree on a solution that deals with the unique situation in St. Lucie County
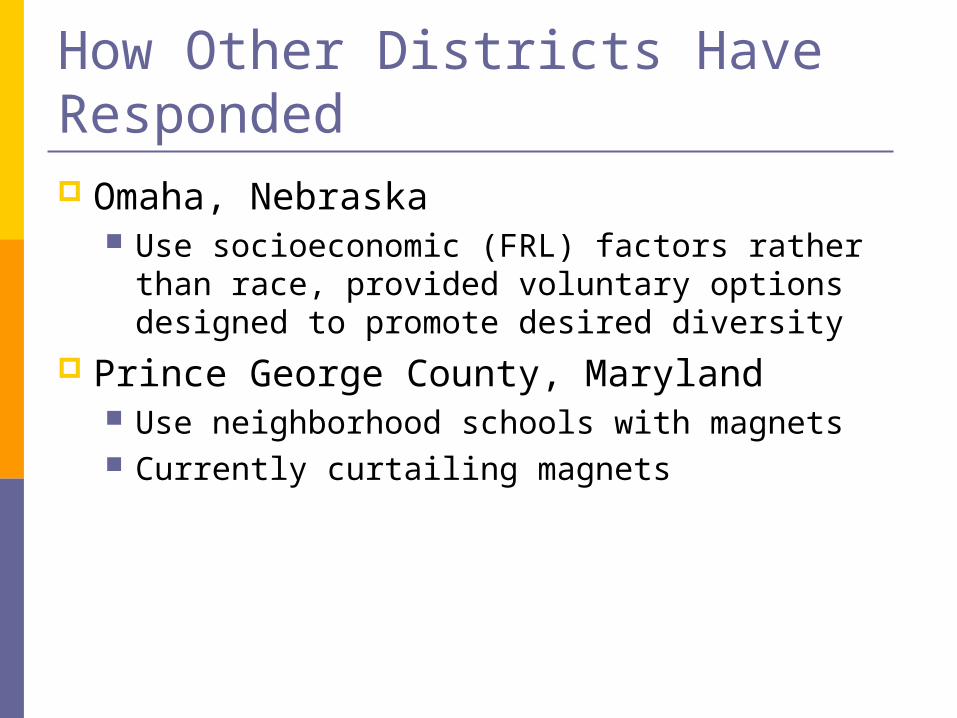
How Other Districts Have Responded Omaha, Nebraska
Use socioeconomic (FRL) factors rather than race, provided voluntary options designed to promote desired diversity
Prince George County, Maryland Use neighborhood schools with magnets Currently curtailing magnets

Experience of Other Districts Austin, Texas
Use neighborhood model with voluntary options
Charlotte, NC Combined district and sub-district magnet programs
with transportation within zones (if seats are available)
Use public input process to help with determining new assignment zones

Florida Districts Miami-Dade
Use Attendance Boundary Committees (ABC), in setting new lines
Very successful, but takes longer and involves more staff to get through process
Strong structured process that guides them through necessary steps
Palm Beach County Use ABC since 1995 that serves in advisory capacity to
Superintendent Method involves coordinated planning and growth data, 5 year
capital outlay plan, adequate public facilities review process Guidelines are followed when making boundary changes

Florida Districts Hillsborough County
Use ABC for last few years Broward County
Employed magnet schools, starburst assignment, research and development schools, limited open enrollment assignments
Other Places – Offer guidance, but SLC has its own unique situation
Hillsborough County Variables ethnic diversity socioeconomic diversity student proximity safety growth community issues natural boundaries existing feeder patterns choice plan exceptional student needs

SLCS Major Issues Growth – PSL fastest
growing town in US last year This has been a catalyst for a
range of issues Capacity has become
critical issue Socioeconomics – Current
systems of zones has helped balance socioeconomic profile of zones Fort Pierce student population
has lower income than rest of the district
www.census.gov

SLCS Major Issues Pupil Assignment process
Complex and unpopular with many parents Seen as critical to others
Transportation – long rides and high costs, growth/congestion making things worse rapidly

How to Proceed
1. Decide Basic Approach
2. Develop Specific Scenarios

Advantages Breaks issues down into more manageable
pieces for the Board, public Allows for difficult decisions to be taken in logical
sequence that is better suited to an open process
Gives direction…. Needed for short timeline to do a good job
Process Requested Develop options that are:
Modifications of current system Complete revisions to that system
Show potential impacts to assist decision makers

Developing Approaches – Criteria Derived from Parent Survey Choice – continuing to have choices Close to home – getting school assignments
closer to home Stability – assignment stability Bus rides – reduces bus rides Diversity – promotes diversity in schools Capacity – Works with school facilities/grade
configurations

Developing Approaches Reviewed
Data and current methods Parent survey Literature and methods used around the country and
Florida
Examined a range of approaches at HS level Used new GIS tool to develop preliminary idea
of impacts Rejected some based on negatives

Rejected Approaches No Change
Growth pressures High level of dissatisfaction with current system
Overlays (overlapping zones) Added Complexity Long bus rides could be longer
Transportation Zones Not significantly different from current plan Similar to other approaches considered
All Choice Very high expense Longer bus rides

4 Approaches Examined More Closely
Modifications and Complete Revisions
Show Immediate Impact
User Criteria to Review

Approach 1-Small Zone Modification
Small change

Assumptions Capacity per zone and facility not addressed
High schools per zone assigned based on zone lines
Logical breaking points Major roads Canals
Current choice zones 1 and 2 change physical boundaries Since some overlays are already done, students in all zones are
impacted

HS Student Impact Impact:
North Zone (1) 2,090 HS students in new zone 807 HS students impacted
West Zone (2) 3,718 HS students in new zone 343 HS students impacted
East Zone (3) 2,601HS students in new zone 947 HS students impacted
Estimated Impact- 2,100 HS students
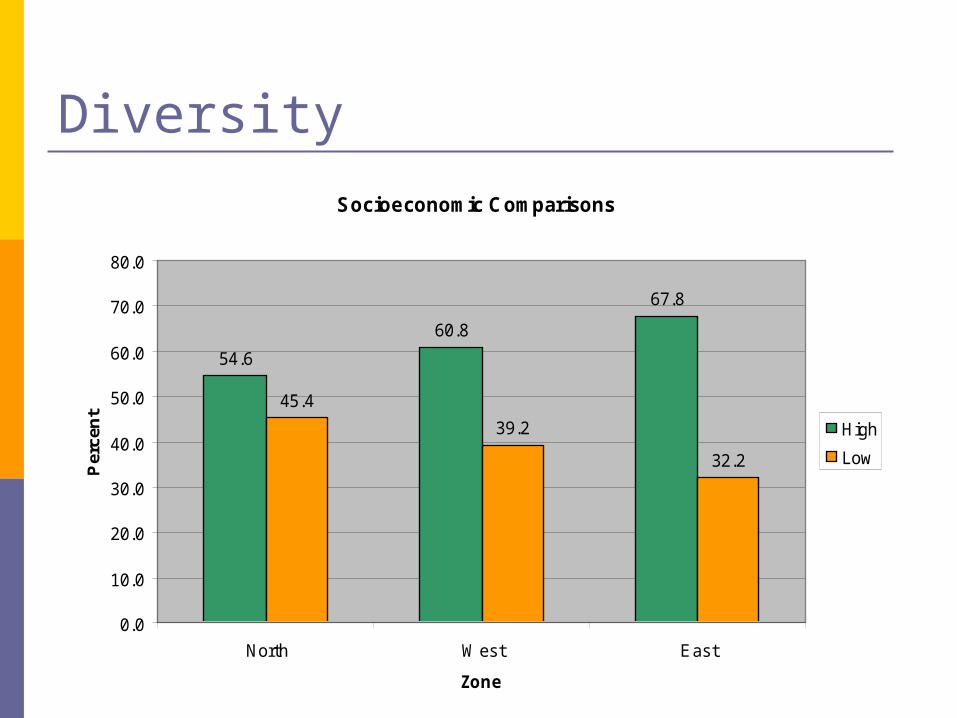
Diversity
Socioeconomic Comparisons
54.6
60.8
67.8
45.4
39.2
32.2
0.0
10.0
20.0
30.0
40.0
50.0
60.0
70.0
80.0
North West East
Zone
Per
cen
t
High
Low

Benefits Choice – continues to allow choice Stability - least disruptive to
assignment Diversity - socioeconomic and
numerical impact of zones

Issues Close to home – more
students will be further from home
Bus rides - longer Capacity - facilities don’t
match well with the change Schools in north are
overcrowded

Approach 2 – Big Zone Modification Simplified zones
that follow geographic lines

Assumptions Capacity per zone and facility not addressed
2 High Schools per zone Logical breaking points
Major roads Canals

HS Student Impact North Zone
2,825 students in new zone 1,224 HS students impacted
West Zone 2,237 students in new zone 1,175 HS students impacted
East Zone 3,347 students in new zone 1,435 HS students impacted
Estimated Impact- 3,834 HS students
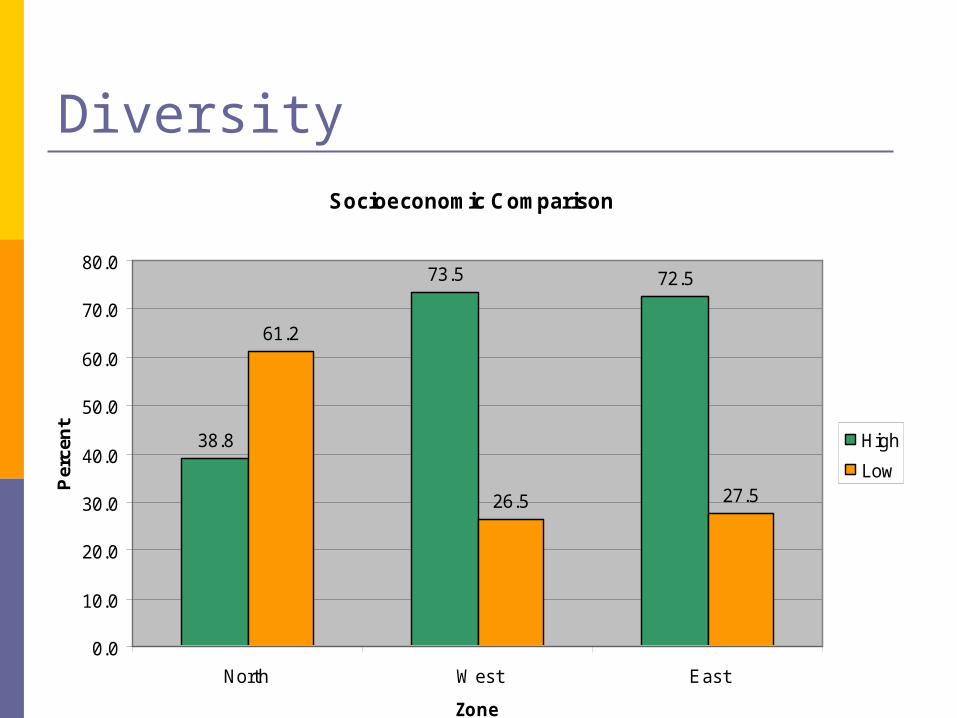
Diversity Socioeconomic Comparison
38.8
73.5 72.5
61.2
26.5 27.5
0.0
10.0
20.0
30.0
40.0
50.0
60.0
70.0
80.0
North West East
Zone
Per
cen
t
High
Low

Benefits Choices – continues to allow
choices Close to home - Geographic zones
improve proximity to school somewhat
Stability – preserves stability Bus rides – reduced somewhat
Issues Diversity – less diversity than
current plan, but reflects geographic realities
Capacity - Facilities adjustments required

Approach 3 – Boundaries
Revision Traditional
boundaries
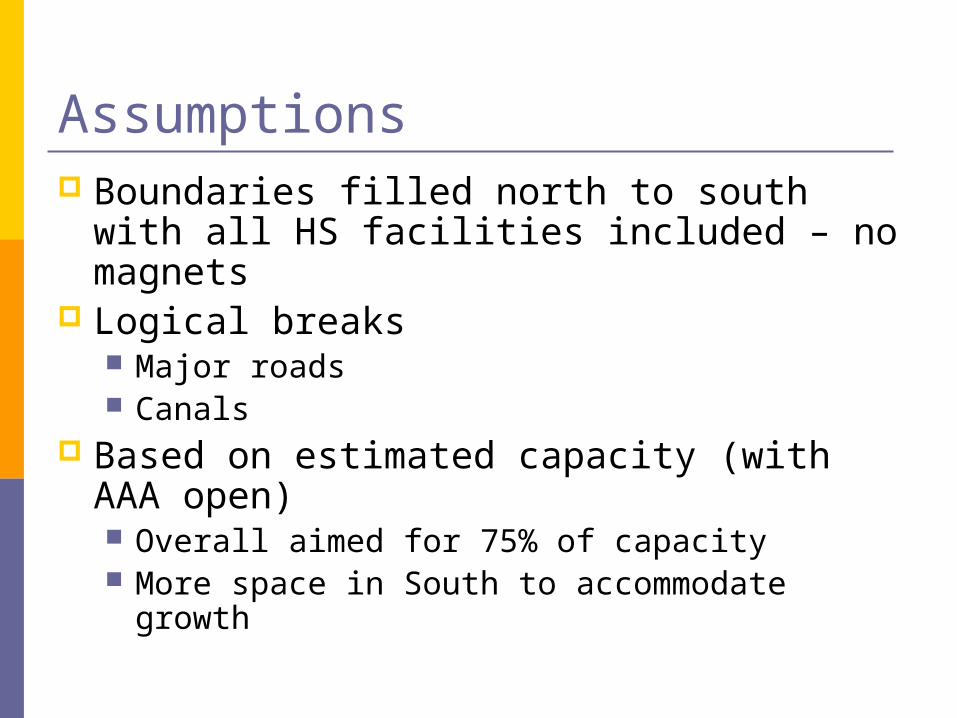
Assumptions Boundaries filled north to south with all HS
facilities included – no magnets Logical breaks
Major roads Canals
Based on estimated capacity (with AAA open) Overall aimed for 75% of capacity More space in South to accommodate growth

HS Student Impact Fort Pierce Westwood
1,215 students in high school boundary 466 HS students impacted
Lincoln Park Academy 1,431 students in high school boundary 1,254 HS students impacted
Fort Pierce Central 1,561 students in high school boundary 1,184 HS students impacted

HS Student Impact (cont.) Port St Lucie
1,701 students in high school boundary 582 HS students impacted
St Lucie West Centennial 1,281 students in high school boundary 625 HS students impacted
New AAA 1,220 students in high school boundary 1,220 HS students impacted (but all would be impacted when new
school opens anyway)
Estimated Impact- 5,300 HS students

Diversity
45.8
69.2
30.7
73.476.8
70.4
54.2
30.8
69.3
26.623.2
29.6
0.0
10.0
20.0
30.0
40.0
50.0
60.0
70.0
80.0
FPW FPC LPA PSL SLWC AAA
High School Catchment
Per
cen
t
High
Low

Benefits Close to home - Community
Schools System of student assignment
intuitive
Bus Ride – Bus rides / transportation costs reduced
Capacity - Facilities match boundaries, but expect split feeder zones for MS and Elem

Issues Choice – not available Stability - Loss of assignment
stability as new schools are added Diversity - Concentration of low
SES population in Ft. Pierce area

Approach 4 – Hybrid Revision Includes
Boundaries Limited Choice Zone Magnets

Assumptions Traditional boundaries for most areas Special zone of choice options for low SES
(+80% area) Magnet options retained

HS Student Impact Students impacted similar to boundaries Differences would be caused by individual student
magnet choices Limited choice zone statistics:
2,242 HS students in limited choice zone 593 HS students impacted
Estimated Impact- 5,000 HS students

Diversity Diversity would combine the issues of the
northern zone approach with the boundary profile in the south
Choice zone creates more evenly distributed low SES students across northern schools

Benefits Choice for low SES and through magnet
programs, though none for majority of students Popular magnet programs maintained
Close to home – boundary approach improves proximity to school for most students
Bus rides reduced Capacity - Facilities match boundaries

Issues Stability - Loss of assignment
stability as new schools are added Diversity – reduction in diversity of
school populations

4 Approaches1. Small Zone Modification
2. Large Zone Modification
3. Boundaries
4. Hybrid – boundaries with limited choice zone, magnets

Overall Recommendations Consider instituting a committee based on the
ABC model for future boundary/assignment changes
Work closely with city and county officials to develop strong, unified system for insuring adequate facilities are planned before development can be approved

4 Approaches - Criteria Choice – is there choice?
One option allows choice for greatly reduced number Close to home* – overall, are students closer to
assigned school Stability – nature of option provide stability? Bus Ride* - based on proximity of students to schools Diversity – defined strictly- whether new zones provide
more diversity than current plan Capacity – fit with current facilities Modification vs. Revision and potential HS impact
*Some criteria heavily influenced by policies at time of implementation, so potential recognized

Choices Close to Home
Stability Bus ride SES Diversity
Capacity Type/ Est. Impact
Modification
Up to 2100 HS students
Modification
Up to 3834 HS students
Revision
Up to 5300 HS students
Revision
Up to 5000 HS students
4 Approaches - SummaryApproach

Public Feedback/Next Steps Board and public input is key to the process
success Goal has been to give Board and public
background and ideas for proceeding Need feedback, to answer questions so Board is
comfortable making decision on approach Then work will begin on specifics
recommendations with further public input

Timetable May – August
Data Gathering and Reporting August – September
Public Analysis of Options, Report back to School Board September – October
Creation of detailed scenarios based on chosen approach Presentation of scenarios to public Analysis of results
November School Board Workshop Public Hearing (as needed for policy changes)
December Additional public hearings as necessary

Board Workshop on Pupil Assignment
St. Lucie County School District
August 17, 2005