
BOARD RESPONSE TO WRITTEN REQUESTS FOR … RESPONSE TO WRITTEN REQUESTS FOR CLARIFICATION . RELATING...
20
1 BOARD RESPONSE TO WRITTEN REQUESTS FOR CLARIFICATION RELATING TO: INVITATION TO NEGOTIATE FOR ACTIVELY-MANAGED FIXED INCOME INVESTMENT MANAGEMENT SERVICES FOR THE STANLEY G. TATE FLORIDA PREPAID COLLEGE PROGRAM #17-05 December 21, 2017 Florida Prepaid College Board 1801 Hermitage Blvd., Suite 210 Tallahassee, Florida 32308 (850) 488-8514
Transcript of BOARD RESPONSE TO WRITTEN REQUESTS FOR … RESPONSE TO WRITTEN REQUESTS FOR CLARIFICATION . RELATING...
1
BOARD RESPONSE TO WRITTEN REQUESTS FOR CLARIFICATION
RELATING TO:
INVITATION TO NEGOTIATE FOR
ACTIVELY-MANAGED FIXED INCOME INVESTMENT MANAGEMENT SERVICES FOR
THE STANLEY G. TATE FLORIDA PREPAID COLLEGE PROGRAM
#17-05
December 21, 2017
Florida Prepaid College Board 1801 Hermitage Blvd., Suite 210
Tallahassee, Florida 32308 (850) 488-8514

2
MEMORANDUM
To: Prospective Respondents, ITN #17-05 From: Florida Prepaid College Board Date: December 21, 2017 Subject: Board Response to Written Requests for Clarification relating to ITN #17-05 Actively-
Managed Fixed Income Investment Management Services for the Stanley G. Tate Florida Prepaid College Program.
Any questions concerning conditions and specifications of this ITN must be addressed in the form of written questions submitted by Respondents pursuant to the schedule in Section I.D.
Company Name: SEI Investments Distribution Co.
Question Question/Comment 1. In regards to the search for a fixed income/liability driven investing manager for the
Stanley G. Tate Florida Prepaid College Program: Has the Board/Consultant decided to exclude from consideration a discretionary asset manager who builds portfolios using third party managers (i.e. a manager of managers) to run the $2B mandate? The discretionary manager would still optimize based on the Tate program metrics and implement accordingly. Assuming: the value case could be compelling from a cost perspective, and all other qualifications met such as Separate Accounts for the investments and discretionary/LDI assets under management of the provider.
Answer: The Board intends to contract directly with a firm(s) that performs investment management services.
Company Name: Capital Group
Question Question/Comment 1. What discount rate is utilized to evaluate “market value” of projected liabilities?
Answer: Please find the Board’s projected monthly cash flows for the Stanley G. Tate Florida Prepaid College Program as of June 30, 2017, with associated discount factors, attached herein as Exhibit B.
2. For the current Customized Benchmark, is the STRIPS allocation tied to specific published market benchmark(s) or constructed with individual STRIPS?
Answer: Please find a benchmark construction summary prepared by Callan, the Board’s investment consultant, based on the projected monthly cash flows as of June 30, 2017, attached herein as Exhibit A.

3
3. Are there specific excess return and/or tracking error objectives for the active fixed income mandate?
Answer: For active fixed income investment guidelines, please refer to the Comprehensive Investment Plan (CIP) for the Stanley G. Tate Florida Prepaid College Program, specifically, Part II Active Fixed Income Investment Guidelines. The CIP is attached to the ITN as Appendix E.
4. Could you kindly confirm if you are looking to split $2 billion between up to 5 investment managers or is it $2 billion per investment manager?
Answer: The Board does not guarantee any minimum or maximum market value for the portfolio of the Stanley G. Tate Florida Prepaid College Plan at any time or in any year during the term of the contract resulting from this ITN. For context, over the past five years, the market value of fixed income assets in the portfolio have ranged from approximately $9 billion to approximately $11 billion. These funds have generally been split equally between four fixed income managers.
Company Name: Federated Investors
Question Question/Comment 1. What is the target and/or current duration of the Active Fixed Income portfolio?
Answer: Please find a benchmark construction summary prepared by Callan, the Board’s investment consultant, based on the projected monthly cash flows as of June 30, 2017, attached herein as Exhibit A.
Company Name: Pimco
Question Question/Comment 1. In regards to Question 3 in Section B “Statutory Requirements – Mandatory” of the
Qualifications Questionnaire; can you define imprudent investing and provide examples?
a. For section 16 of the Investment Management Agreement, Appendix F: Is the Manager liability for Imprudent Investing subject to the standard of care stated in section 5 of the Agreement?
Answer: Pursuant to Section 5 of the Investment Management Agreement, “the Manager agrees to discharge its duties, as investment manager and fiduciary, with respect to the Account Assets solely in the interest of the Board and the beneficiaries thereunder and (a) with the care, skill, prudence, and diligence under the circumstances then prevailing that a prudent man acting in the like capacity and familiar with such matters would use in the conduct of an enterprise of a like character and with like aims, and (b) in accordance with the investment instructions as the Board may furnish to the Manager in writing from time to time and with this Agreement. The Manager further agrees that it will continue at all times during the term of this Agreement to be an investment manager and a fiduciary as above described, and that it will comply with all laws, rules, and regulations set forth in Paragraph 1 (A), and that it will perform in accordance with the standards of care set forth in this paragraph and this Agreement.” Actions to the contrary shall constitute imprudent investing pursuant to Section 16 of the Investment Management Agreement.

4
2. For section 9A of the Investment Management Agreement, Appendix F: While we do maintain an ERISA bond, it would only be applicable to a true ERISA plan. Would an equivalent fidelity bond suffice in lieu of the ERISA bonding requirement?
Answer: Yes, an equivalent fidelity bond will suffice in lieu of the ERISA bonding requirement provided that coverage is generally consistent with the bonding requirements of Section 412 of ERISA.
3. For section 35 of the Investment Management Agreement, Appendix F: Can this be changed to the SIFMA holiday schedule?
Answer: Yes. The Board will accept the SIFMA holiday schedule as an acceptable alternative to Section 35 of the Investment Management Agreement.
4. Can you please share the actuarial valuation report of the Prepaid Plans liabilities (as referenced in Appendix E)?
Answer: Please find the Board’s projected monthly cash flows for the Stanley G. Tate Florida Prepaid College Program as of June 30, 2017, with associated discount factors, attached herein as Exhibit B.
5. Can you please share a schedule of the actuarially derived liability cash flows / projections of the Prepaid Plans?
Answer: Please find the Board’s projected monthly cash flows for the Stanley G. Tate Florida Prepaid College Program as of June 30, 2017, with associated discount factors, attached herein as Exhibit B.
6. Can you please provide specifics on the discount rate methodology used by the actuary to determine the present value of the Prepaid Plans liability present value?
Answer: Please find the Board’s projected monthly cash flows for the Stanley G. Tate Florida Prepaid College Program as of June 30, 2017, with associated discount factors, attached herein as Exhibit B.
7. Can you please share the most recent asset/liability study associated with the Prepaid Plans?
Answer: Please find a benchmark construction summary prepared by Callan, the Board’s investment consultant, based on the projected monthly cash flows as of June 30, 2017, attached herein as Exhibit A.
Company Name: J.P. Morgan Asset Management
Question Question/Comment 1. What is the anticipated mandate size per active fixed income manager hired under the
resulting contract? Answer: The Board does not guarantee any minimum or maximum market value for the portfolio of the Prepaid Plan at any time or in any year during the term of the contract resulting from this ITN. For context, over the past five years, the market value of fixed income assets in the portfolio have ranged from approximately $9 billion to approximately $11 billion. These funds have generally been split equally between four fixed income managers.

5
2. The current benchmark stated in the ITN includes “76% United States Treasury Strip securities”. Is this the full Bloomberg Barclays US Treasury STRIPS Index, or a sub-component of this Index?
Answer: Please find a benchmark construction summary prepared by Callan, the Board’s investment consultant, based on the projected monthly cash flows as of June 30, 2017, attached herein as Exhibit A.
Company Name: Wellington Management Company LLP
Question Question/Comment 1. What is the duration of the Plan’s liabilities?
Answer: Please find the Board’s projected monthly cash flows for the Stanley G. Tate Florida Prepaid College Program as of June 30, 2017, with associated discount factors, attached herein as Exhibit B. In addition, please find a benchmark construction summary prepared by Callan, the Board’s investment consultant, based on the projected monthly cash flows as of June 30, 2017, attached herein as Exhibit A.
2. What is the duration of the LDI benchmark for the Active FI allocation?
Answer: Please find a benchmark construction summary prepared by Callan, the Board’s investment consultant, based on the projected monthly cash flows as of June 30, 2017, attached herein as Exhibit A.
3. Are the STRIPS in the benchmark incorporated to match the cash flows of the liabilities or to reach the target duration?
Answer: Please find a benchmark construction summary prepared by Callan, the Board’s investment consultant, based on the projected monthly cash flows as of June 30, 2017, attached herein as Exhibit A.
Company Name: Loomis, Sayles & Company, L.P.
Question Question/Comment 1. Would you please clarify which STRIPS index is included in the blended benchmark? Is
the index provider Bloomberg Barclays? Is the full index used or specific maturity sub-indices?
Answer: Please find a benchmark construction summary prepared by Callan, the Board’s investment consultant, based on the projected monthly cash flows as of June 30, 2017, attached herein as Exhibit A.

6
2. Is there a specific tracking error target against the blended benchmark for active managers?
Answer: For active fixed income investment guidelines, please refer to the Comprehensive Investment Plan (CIP) for the Stanley G. Tate Florida Prepaid College Program, specifically, Part II Active Fixed Income Investment Guidelines. The CIP is attached to the ITN as Appendix E.
3. We understand the custom benchmark for the Plan’s total fixed income exposure is 76% US Treasury STRIPS, 14% BBG Barclays US Corp and 10% BBG Barclays MBS Index. Is each active manager benchmarked against the same custom benchmark?
Answer: Yes, each active manager is evaluated against the same custom benchmark.
4. Are managers expected to take active risk across sectors or do you foresee the STRIPS allocation being generally a replication approach?
Answer: For active fixed income investment guidelines, please refer to the Comprehensive Investment Plan (CIP) for the Stanley G. Tate Florida Prepaid College Program, specifically, Part II Active Fixed Income Investment Guidelines. The CIP is attached to the ITN as Appendix E.
5. Would you please clarify sector weight guidelines. Page 30 (C2) states that 10% leeway in cap/floor for Corp and ABS relative to benchmark while page 48 (E13) allows maximum of 50% allocation to Corporates, ABS and MBS. Are ABS allowed up to 10% ? Are MBS restricted to +/- 10% relative to bench or the overall 50% limit?
Answer: A 10% allocation to ABS is permissible. Corporate debt securities, ABS, and MBS are restricted to +/- 10% relative to the benchmark weight. This an additional limitation pursuant to the second sentence of paragraph 10 on page E13. The 50% maximum allocation relates to the total allocation to corporate debt, ABS, and MBS.
Company Name: Insight Investments
Question Question/Comment 1. Is there further detail available on the liability benchmark policy and the resultant
actuarial methodology?
1a) Can you provide more detail on the custom liability benchmark, broken down by tenor/key rate? 1b) Can you provide more detail on the spread component of the liability benchmark and how this is derived? How is it updated on an annual basis?
Answer: Please find a benchmark construction summary prepared by Callan, the Board’s investment consultant, based on the projected monthly cash flows as of June 30, 2017, attached herein as Exhibit A.
2. Is each active fixed income manager's benchmark a pro-rata slice of the custom liability benchmark?
Answer: Each active manager is evaluated against the same custom benchmark.

7
3. Can you provide more information on the convexity of the liabilities? Is there a specific convexity constraint that must be managed to?
Answer: For active fixed income investment guidelines, please refer to the Comprehensive Investment Plan (CIP) for the Stanley G. Tate Florida Prepaid College Program, specifically, Part II Active Fixed Income Investment Guidelines. The CIP is attached to the ITN as Appendix E. In addition, please find the Board’s projected monthly cash flows for the Stanley G. Tate Florida Prepaid College Program as of June 30, 2017, with associated discount factors, attached herein as Exhibit B.
4. Should the manager consider coupons as part of the liquidity pool? If not, how does this affect the custom liability benchmark?
Answer: Coupons may be used to satisfy liabilities. Please find the Board’s projected monthly cash flows for the Stanley G. Tate Florida Prepaid College Program as of June 30, 2017, with associated discount factors, attached herein as Exhibit B. Also, the manager may utilize coupons as part of an active investment strategy.
5. What is the plan’s current alpha target and tracking error budget? Answer: For active fixed income investment guidelines, please refer to the Comprehensive Investment Plan (CIP) for the Stanley G. Tate Florida Prepaid College Program, specifically, Part II Active Fixed Income Investment Guidelines. The CIP is attached to the ITN as Appendix E.
Company Name: TCW
Question Question/Comment 1. Please define what specific index is being used for the STRIP component of the custom
benchmark. For example, the BC Treasury STRIP Index? Answer: Please find a benchmark construction summary prepared by Callan, the Board’s investment consultant, based on the projected monthly cash flows as of June 30, 2017, attached herein as Exhibit A.
2. What is the duration target of the custom benchmark? Answer: Please find a benchmark construction summary prepared by Callan, the Board’s investment consultant, based on the projected monthly cash flows as of June 30, 2017, attached herein as Exhibit A.

8
3. How many managers will be hired for the proposed $2B portfolio? Answer: The Board intends to contract with at least one responsive Respondent to this ITN. For the customer LDI strategy, the Board currently contemplates up to five (5) managers. Please be advised, the Board does not guarantee any minimum or maximum market value for the portfolio of the Prepaid Plan at any time or in any year during the term of the contract resulting from this ITN. For context, over the past five years, the market value of fixed income assets in the portfolio have ranged from approximately $9 billion to approximately $11 billion. These funds have generally been split equally between four fixed income managers.
4. Should managers propose an annual fee based on a $2B portfolio?
Answer: The Board does not guarantee any minimum or maximum market value for the portfolio of the Prepaid Plan at any time or in any year during the term of the contract resulting from this ITN. For context, over the past five years, the market value of fixed income assets in the portfolio have ranged from approximately $9 billion to approximately $11 billion. These funds have generally been split equally between four fixed income managers.
Company Name: Blackrock
Question Question/Comment 1. What is the discount rate used to value the liability and how is it determined?
Answer: Please find the Board’s projected monthly cash flows for the Stanley G. Tate Florida Prepaid College Program as of June 30, 2017, with associated discount factors, attached herein as Exhibit B.
2. Could you please confirm that commingled or mutual funds would be acceptable investment sleeves within a separate account structure.
Answer: The Board intends to contract for separate account management. However, the Board will consider compelling evidence to support a strategy that utilizes commingled or mutual funds managed by the contracting manager as investment sleeves.
3. The ITN asks for one effective fee for the mandate. Is there scope to supplement the effective fee with an asset-based schedule?
Answer: The Board will initially evaluate proposals based on a single effective fee for the mandate. However, the Board may consider negotiating alternative fee schedules with the manager(s) selected to the shortlist for negotiation. Please be advised, the Board does not guarantee any minimum or maximum market value for the portfolio of the Prepaid Plan at any time or in any year during the term of the contract resulting from this ITN. For context, over the past five years, the market value of fixed income assets in the portfolio have ranged from approximately $9 billion to approximately $11 billion. These funds have generally been split equally between four fixed income managers
4. Would you be willing to more specifically detail your cash flows so that we can make a more accurate benchmark recommendation?
Answer: Please find the Board’s projected monthly cash flows for the Stanley G. Tate Florida Prepaid College Program as of June 30, 2017, with associated discount factors, attached herein as Exhibit B.

Exhibit A: Prepaid Benchmark Construction

Callan LLC 300 Galleria Parkway Suite 950 Atlanta, GA 30339
Main 770.618.2140 Fax 770.618.2141
www.callan.com
October 3, 2017 Mr. Kevin Thompson Executive Director Florida Prepaid College Program 1801 Hermitage Boulevard Suite 210 Tallahassee, FL 32308 Dear Kevin,
This letter confirms the agreement reached by Columbia, Neuberger Berman, Northern Trust, and Standish on the construction of the benchmark against which their immunized fixed income portfolios will be measured for the twelve-month period beginning October 1, 2017, and ending September 30, 2018. Callan participated in the benchmark construction deliberations and believes that the process was thorough. For your records, we will outline the methodology used, as well as the structure of the benchmark itself. The liabilities and actuarial reserves, as calculated by Milliman, had a net present value of $13,523 million as of June 30, 2017. Future contract premiums and other income had a net present value of $2,118 million. Projected net cash flows included 24.6 basis points of option-adjusted spread (OAS) and had a present value of $9,008 million and duration of 8.96 years. As of June 30, 2017, the Enhanced Immunized Bond Portfolio had fixed income assets of $9,664 million. Consistent with the asset allocation policy adopted by the Board and stated in the Comprehensive Investment Plan, the amount of equity in the Fund is limited to 15% “of the market value of the total Fund, or the actuarial reserve balance as determined by the actuary, whichever is less.” As of June 30, 2016 asset allocation weight to equity was equal to 14.37%, while the weight to fixed income totaled 85.63%. The fixed income managers optimized to the benchmark consisting of 14% Barclays Corporate Index, 10% Barclays Fixed Rate Mortgage Index, and 76% U.S. Treasury STRIP securities, each of which are permitted investments to construct the benchmark. The weighting and the parameters of the two market indices were a fixed element in the modeling process, with the model solving for a U.S. Treasury STRIP portfolio which most closely matched the remaining duration of the Program’s liabilities. The following table summarizes the duration contribution from the two market indices and the resulting Treasury contribution needed to fulfill the required duration buckets. The Treasury STRIP portfolio was

2 Mr. Kevin Thompson October 3, 2017
constructed in order for the sum of the three components to closely mirror the duration weights reflected in the “$Duration Target” column of the table.
The final Treasury STRIP benchmark composition is enclosed as Attachment A. The securities will be priced monthly by Northern Trust. They will blend the return on the Treasury STRIP component with the return of the two market indices and compile a blended benchmark return. This return will be reported to Callan, which will disseminate the information to Columbia, Neuberger, Northern Trust and Standish. If you have any questions regarding the benchmark construction process, please let me know. Kind Regards,
Weston Lewis Senior Vice President Attachment Cc: Amy Crumpler, Florida Prepaid
Will Thompson, Florida Prepaid Karl Chang, Columbia Threadneedle Thanos Bardas, Neuberger Berman Anthony Criscuolo, Standish Mike Chico, Northern Trust Gary Guibert, Northern Trust

3 Mr. Kevin Thompson October 3, 2017
Attachment A
1 Weight as a percent of Treasury STRIPS total market value
Cusip Par (000) Description Coupon Maturity Weight (%)1
912833KT6 250,000 TINT 0 11/15/2018 3.6912833KU3 100,073 TINT 0 02/15/2019 1.4912833KW9 47,353 TINT 0 08/15/2019 0.7912833KX7 132,518 TINT 0 11/15/2019 1.9912833KZ2 20,613 TINT 0 05/15/2020 0.3912833LA6 165,143 TINT 0 08/15/2020 2.3912833LC2 292,939 TINT 0 02/15/2021 4.0912833LD0 141,485 TINT 0 05/15/2021 1.9912833LE8 146,779 TINT 0 08/15/2021 2.0912833LF5 45,000 TINT 0 11/15/2021 0.6912833LG3 97,405 TINT 0 02/15/2022 1.3912833LJ7 177,717 TINT 0 08/15/2022 2.3912833LL2 73,352 TINT 0 02/15/2023 1.0912833LN8 490,455 TINT 0 05/15/2023 6.3912833LP3 9,122 TINT 0 11/15/2023 0.1912833LQ1 379,908 TINT 0 02/15/2024 4.8912833LR9 31,632 TINT 0 05/15/2024 0.4912833LU2 375,348 TINT 0 02/15/2025 4.6912833LY4 464,219 TINT 0 02/15/2026 5.5912833LZ1 162,412 TINT 0 05/15/2026 1.9912803BH5 164,080 TP 0 08/15/2026 1.9912833PA2 135,385 TINT 0 08/15/2026 1.6912833PB0 185,192 TINT 0 11/15/2026 2.2912803BK8 110,414 TP 0 02/15/2027 1.3912803BL6 119,940 TP 0 08/15/2027 1.4912833PE4 38,617 TINT 0 08/15/2027 0.4912803BM4 213,811 TP 0 11/15/2027 2.4912833WR7 179,275 TINT 0 11/15/2028 2.0912803BW2 199,181 TP 0 02/15/2029 2.2912833XT2 596,844 TINT 0 11/15/2029 6.3912833XX3 292,640 TINT 0 02/15/2030 3.1912803CH4 380,907 TP 0 05/15/2030 4.1912833XY1 100,934 TINT 0 08/15/2030 1.09128337P9 71,960 TINT 0 05/15/2031 0.79128334S6 150,000 TINT 0 08/15/2031 1.59128337Q7 106,274 TINT 0 11/15/2031 1.19128334U1 103,823 TINT 0 08/15/2032 1.09128334V9 184,479 TINT 0 02/15/2033 1.89128337T1 500,000 TINT 0 05/15/2033 4.89128334X5 85,000 TINT 0 02/15/2034 0.89128337V6 200,000 TINT 0 05/15/2034 1.89128334Y3 200,000 TINT 0 08/15/2034 1.8912833X88 147,203 TINT 0 05/15/2035 1.3912833X96 150,000 TINT 0 11/15/2035 1.39128335B2 150,000 TINT 0 02/15/2036 1.3912833Y20 150,000 TINT 0 05/15/2036 1.39128337E4 26,296 TINT 0 08/15/2036 0.29128337F1 150,000 TINT 0 02/15/2037 1.3912833Y46 150,000 TINT 0 05/15/2037 1.3
OPTIMUM TREASURY STRIPSAs of 6/30/17

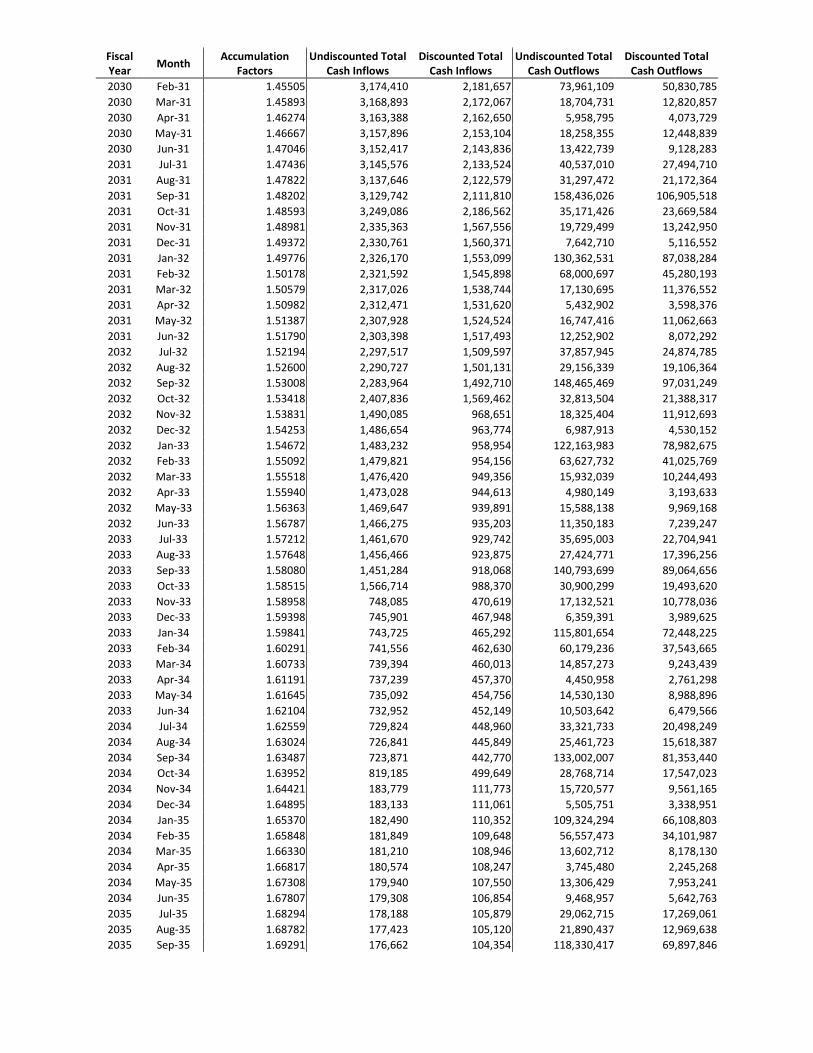
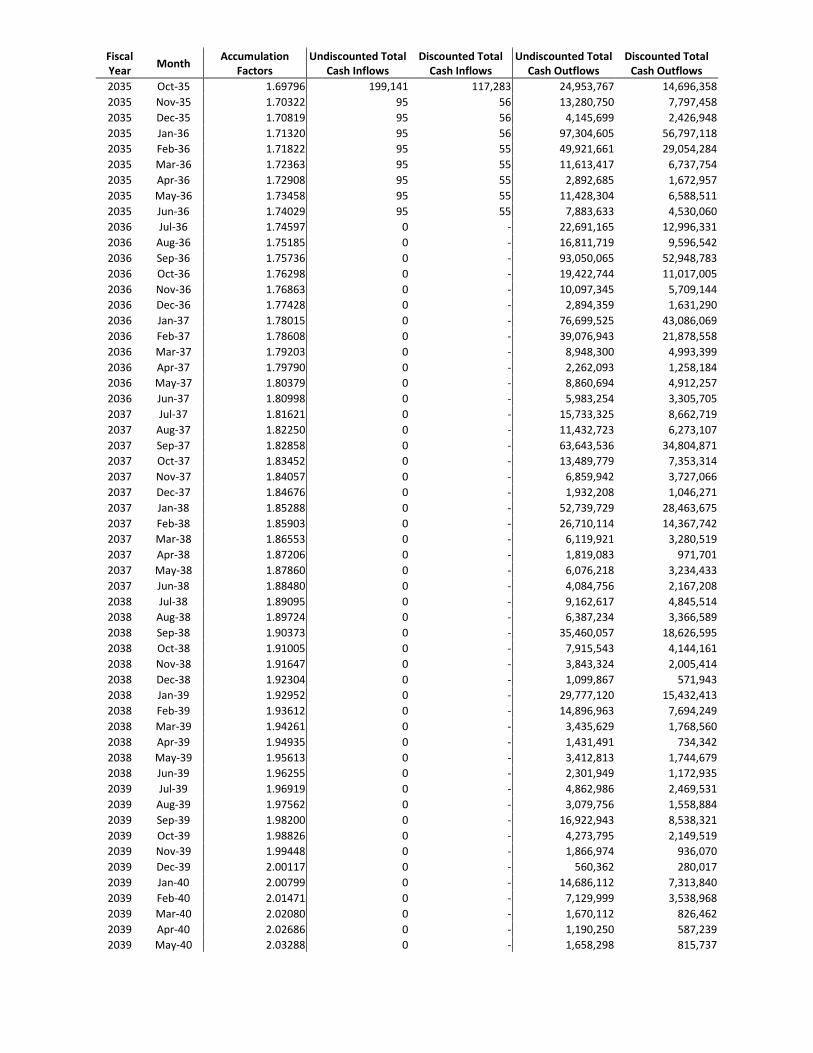
Exhibit B: Cash Inflow Flow Summary
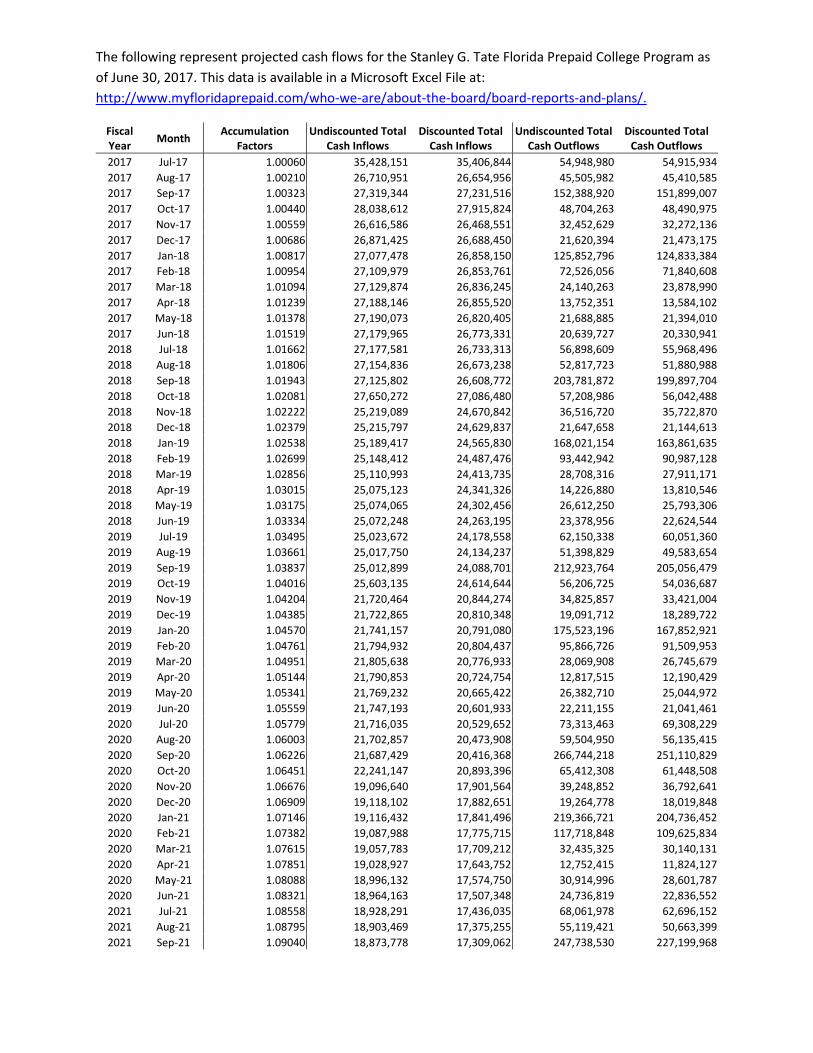
The following represent projected cash flows for the Stanley G. Tate Florida Prepaid College Program as of June 30, 2017. This data is available in a Microsoft Excel File at: http://www.myfloridaprepaid.com/who-we-are/about-the-board/board-reports-and-plans/.
Fiscal Year Month Accumulation
Factors Undiscounted Total
Cash Inflows Discounted Total
Cash Inflows Undiscounted Total
Cash Outflows Discounted Total
Cash Outflows 2017 Jul-17 1.00060 35,428,151 35,406,844 54,948,980 54,915,934 2017 Aug-17 1.00210 26,710,951 26,654,956 45,505,982 45,410,585 2017 Sep-17 1.00323 27,319,344 27,231,516 152,388,920 151,899,007 2017 Oct-17 1.00440 28,038,612 27,915,824 48,704,263 48,490,975 2017 Nov-17 1.00559 26,616,586 26,468,551 32,452,629 32,272,136 2017 Dec-17 1.00686 26,871,425 26,688,450 21,620,394 21,473,175 2017 Jan-18 1.00817 27,077,478 26,858,150 125,852,796 124,833,384 2017 Feb-18 1.00954 27,109,979 26,853,761 72,526,056 71,840,608 2017 Mar-18 1.01094 27,129,874 26,836,245 24,140,263 23,878,990 2017 Apr-18 1.01239 27,188,146 26,855,520 13,752,351 13,584,102 2017 May-18 1.01378 27,190,073 26,820,405 21,688,885 21,394,010 2017 Jun-18 1.01519 27,179,965 26,773,331 20,639,727 20,330,941 2018 Jul-18 1.01662 27,177,581 26,733,313 56,898,609 55,968,496 2018 Aug-18 1.01806 27,154,836 26,673,238 52,817,723 51,880,988 2018 Sep-18 1.01943 27,125,802 26,608,772 203,781,872 199,897,704 2018 Oct-18 1.02081 27,650,272 27,086,480 57,208,986 56,042,488 2018 Nov-18 1.02222 25,219,089 24,670,842 36,516,720 35,722,870 2018 Dec-18 1.02379 25,215,797 24,629,837 21,647,658 21,144,613 2018 Jan-19 1.02538 25,189,417 24,565,830 168,021,154 163,861,635 2018 Feb-19 1.02699 25,148,412 24,487,476 93,442,942 90,987,128 2018 Mar-19 1.02856 25,110,993 24,413,735 28,708,316 27,911,171 2018 Apr-19 1.03015 25,075,123 24,341,326 14,226,880 13,810,546 2018 May-19 1.03175 25,074,065 24,302,456 26,612,250 25,793,306 2018 Jun-19 1.03334 25,072,248 24,263,195 23,378,956 22,624,544 2019 Jul-19 1.03495 25,023,672 24,178,558 62,150,338 60,051,360 2019 Aug-19 1.03661 25,017,750 24,134,237 51,398,829 49,583,654 2019 Sep-19 1.03837 25,012,899 24,088,701 212,923,764 205,056,479 2019 Oct-19 1.04016 25,603,135 24,614,644 56,206,725 54,036,687 2019 Nov-19 1.04204 21,720,464 20,844,274 34,825,857 33,421,004 2019 Dec-19 1.04385 21,722,865 20,810,348 19,091,712 18,289,722 2019 Jan-20 1.04570 21,741,157 20,791,080 175,523,196 167,852,921 2019 Feb-20 1.04761 21,794,932 20,804,437 95,866,726 91,509,953 2019 Mar-20 1.04951 21,805,638 20,776,933 28,069,908 26,745,679 2019 Apr-20 1.05144 21,790,853 20,724,754 12,817,515 12,190,429 2019 May-20 1.05341 21,769,232 20,665,422 26,382,710 25,044,972 2019 Jun-20 1.05559 21,747,193 20,601,933 22,211,155 21,041,461 2020 Jul-20 1.05779 21,716,035 20,529,652 73,313,463 69,308,229 2020 Aug-20 1.06003 21,702,857 20,473,908 59,504,950 56,135,415 2020 Sep-20 1.06226 21,687,429 20,416,368 266,744,218 251,110,829 2020 Oct-20 1.06451 22,241,147 20,893,396 65,412,308 61,448,508 2020 Nov-20 1.06676 19,096,640 17,901,564 39,248,852 36,792,641 2020 Dec-20 1.06909 19,118,102 17,882,651 19,264,778 18,019,848 2020 Jan-21 1.07146 19,116,432 17,841,496 219,366,721 204,736,452 2020 Feb-21 1.07382 19,087,988 17,775,715 117,718,848 109,625,834 2020 Mar-21 1.07615 19,057,783 17,709,212 32,435,325 30,140,131 2020 Apr-21 1.07851 19,028,927 17,643,752 12,752,415 11,824,127 2020 May-21 1.08088 18,996,132 17,574,750 30,914,996 28,601,787 2020 Jun-21 1.08321 18,964,163 17,507,348 24,736,819 22,836,552 2021 Jul-21 1.08558 18,928,291 17,436,035 68,061,978 62,696,152 2021 Aug-21 1.08795 18,903,469 17,375,255 55,119,421 50,663,399 2021 Sep-21 1.09040 18,873,778 17,309,062 247,738,530 227,199,968

Fiscal Year Month Accumulation
Factors Undiscounted Total
Cash Inflows Discounted Total
Cash Inflows Undiscounted Total
Cash Outflows Discounted Total
Cash Outflows 2021 Oct-21 1.09286 19,492,976 17,836,644 60,662,561 55,508,020 2021 Nov-21 1.09535 16,142,864 14,737,642 36,285,347 33,126,739 2021 Dec-21 1.09791 16,122,842 14,685,077 17,709,685 16,130,412 2021 Jan-22 1.10052 16,101,721 14,631,018 203,750,232 185,140,049 2021 Feb-22 1.10315 16,077,814 14,574,434 109,218,436 99,005,798 2021 Mar-22 1.10573 16,055,559 14,520,376 29,939,631 27,076,895 2021 Apr-22 1.10833 16,031,046 14,464,167 11,697,592 10,554,266 2021 May-22 1.11094 16,007,317 14,408,783 28,522,087 25,673,794 2021 Jun-22 1.11356 15,984,190 14,354,130 22,785,493 20,461,840 2022 Jul-22 1.11619 15,956,550 14,295,525 63,889,004 57,238,364 2022 Aug-22 1.11885 15,932,035 14,239,698 51,670,990 46,182,380 2022 Sep-22 1.12151 15,907,883 14,184,300 232,223,196 207,062,350 2022 Oct-22 1.12422 16,226,750 14,433,770 56,896,624 50,609,816 2022 Nov-22 1.12694 14,428,247 12,803,067 33,981,254 30,153,647 2022 Dec-22 1.12970 14,409,040 12,754,699 16,562,123 14,660,580 2022 Jan-23 1.13252 14,390,987 12,707,099 190,990,203 168,642,469 2022 Feb-23 1.13535 14,373,233 12,659,682 102,339,927 90,139,147 2022 Mar-23 1.13815 14,354,683 12,612,312 27,967,628 24,572,917 2022 Apr-23 1.14098 14,336,507 12,565,052 10,893,876 9,547,801 2022 May-23 1.14380 14,318,335 12,518,257 26,616,147 23,270,008 2022 Jun-23 1.14660 14,300,270 12,471,934 21,268,081 18,548,888 2023 Jul-23 1.14942 14,278,384 12,422,263 62,577,464 54,442,696 2023 Aug-23 1.15224 14,257,942 12,374,121 50,285,397 43,641,472 2023 Sep-23 1.15514 14,237,480 12,325,378 228,442,857 197,762,846 2023 Oct-23 1.15807 14,537,683 12,553,337 55,428,801 47,862,950 2023 Nov-23 1.16099 12,733,897 10,968,184 32,918,040 28,353,545 2023 Dec-23 1.16392 12,718,723 10,927,474 15,747,641 13,529,813 2023 Jan-24 1.16690 12,703,208 10,886,285 187,819,517 160,955,932 2023 Feb-24 1.16987 12,687,985 10,845,596 100,383,414 85,807,000 2023 Mar-24 1.17279 12,672,426 10,805,370 27,145,728 23,146,288 2023 Apr-24 1.17573 12,656,515 10,764,854 10,298,005 8,758,850 2023 May-24 1.17865 12,641,334 10,725,238 25,868,307 21,947,348 2023 Jun-24 1.18168 12,625,541 10,684,374 20,519,218 17,364,404 2024 Jul-24 1.18478 12,606,458 10,640,347 61,992,004 52,323,691 2024 Aug-24 1.18789 12,586,148 10,595,420 49,682,186 41,824,044 2024 Sep-24 1.19086 12,565,146 10,551,290 228,081,463 191,526,120 2024 Oct-24 1.19384 12,862,852 10,774,343 54,802,140 45,904,052 2024 Nov-24 1.19686 11,075,622 9,253,892 32,405,746 27,075,615 2024 Dec-24 1.20000 11,060,987 9,217,452 15,235,126 12,695,888 2024 Jan-25 1.20317 11,046,302 9,180,984 187,470,671 155,813,711 2024 Feb-25 1.20633 11,031,901 9,144,977 99,980,140 82,879,290 2024 Mar-25 1.20950 11,017,651 9,109,276 26,836,377 22,188,030 2024 Apr-25 1.21268 11,003,073 9,073,316 9,951,079 8,205,824 2024 May-25 1.21590 10,988,844 9,037,656 25,630,461 21,079,497 2024 Jun-25 1.21898 10,974,861 9,003,324 20,180,230 16,555,030 2025 Jul-25 1.22213 10,956,949 8,965,479 60,972,476 49,890,484 2025 Aug-25 1.22523 10,937,704 8,927,093 48,649,750 39,706,763 2025 Sep-25 1.22853 10,918,261 8,887,226 226,689,107 184,519,989 2025 Oct-25 1.23189 11,187,693 9,081,746 53,750,874 43,632,930 2025 Nov-25 1.23519 9,439,004 7,641,714 31,580,342 25,567,097 2025 Dec-25 1.23839 9,426,177 7,611,650 14,479,079 11,691,876 2025 Jan-26 1.24162 9,413,258 7,581,422 186,300,357 150,045,989 2025 Feb-26 1.24477 9,400,099 7,551,687 99,044,644 79,568,753 2025 Mar-26 1.24796 9,386,999 7,521,879 26,339,189 21,105,807 2025 Apr-26 1.25111 9,373,877 7,492,433 9,503,926 7,596,379 2025 May-26 1.25430 9,360,561 7,462,802 25,245,847 20,127,508

Fiscal Year Month Accumulation
Factors Undiscounted Total
Cash Inflows Discounted Total
Cash Inflows Undiscounted Total
Cash Outflows Discounted Total
Cash Outflows 2025 Jun-26 1.25754 9,347,164 7,432,878 19,665,425 15,637,974 2026 Jul-26 1.26084 9,330,838 7,400,507 59,306,848 47,037,660 2026 Aug-26 1.26418 9,313,482 7,367,210 47,052,019 37,219,387 2026 Sep-26 1.26741 9,296,166 7,334,770 223,199,063 176,106,340 2026 Oct-26 1.27069 9,568,387 7,530,085 52,107,685 41,007,464 2026 Nov-26 1.27398 7,888,317 6,191,852 30,358,707 23,829,748 2026 Dec-26 1.27727 7,876,656 6,166,798 13,478,459 10,552,566 2026 Jan-27 1.28058 7,865,020 6,141,787 183,415,787 143,229,212 2026 Feb-27 1.28395 7,853,678 6,116,824 97,135,624 75,653,919 2026 Mar-27 1.28727 7,842,251 6,092,171 25,531,653 19,834,001 2026 Apr-27 1.29057 7,830,891 6,067,768 8,911,953 6,905,429 2026 May-27 1.29385 7,819,409 6,043,499 24,574,464 18,993,220 2026 Jun-27 1.29726 7,808,301 6,019,076 18,893,722 14,564,339 2027 Jul-27 1.30065 7,794,472 5,992,738 56,032,501 43,080,288 2027 Aug-27 1.30411 7,779,283 5,965,223 44,220,401 33,908,595 2027 Sep-27 1.30756 7,764,270 5,937,999 212,804,656 162,749,851 2027 Oct-27 1.31102 7,980,838 6,087,494 49,093,722 37,446,912 2027 Nov-27 1.31446 6,498,356 4,943,764 28,383,525 21,593,376 2027 Dec-27 1.31784 6,488,603 4,923,669 12,256,193 9,300,220 2027 Jan-28 1.32127 6,478,781 4,903,435 174,884,935 132,360,860 2027 Feb-28 1.32473 6,469,052 4,883,313 92,314,700 69,685,881 2027 Mar-28 1.32816 6,459,319 4,863,355 24,020,939 18,085,862 2027 Apr-28 1.33165 6,449,691 4,843,398 8,170,241 6,135,446 2027 May-28 1.33510 6,440,001 4,823,597 23,194,222 17,372,603 2027 Jun-28 1.33871 6,430,361 4,803,403 17,642,812 13,178,970 2028 Jul-28 1.34230 6,418,600 4,781,805 52,553,571 39,151,986 2028 Aug-28 1.34589 6,405,609 4,759,375 41,190,632 30,604,691 2028 Sep-28 1.34952 6,392,775 4,737,072 201,917,803 149,621,904 2028 Oct-28 1.35313 6,556,964 4,845,786 45,888,443 33,912,885 2028 Nov-28 1.35678 5,248,183 3,868,116 26,267,935 19,360,492 2028 Dec-28 1.36026 5,240,058 3,852,241 10,927,742 8,033,554 2028 Jan-29 1.36376 5,231,992 3,836,455 165,969,396 121,700,118 2028 Feb-29 1.36726 5,224,017 3,820,800 87,246,351 63,811,214 2028 Mar-29 1.37083 5,215,909 3,804,940 22,432,842 16,364,479 2028 Apr-29 1.37441 5,207,731 3,789,075 7,398,970 5,383,391 2028 May-29 1.37795 5,199,479 3,773,331 21,757,296 15,789,559 2028 Jun-29 1.38159 5,191,244 3,757,454 16,320,228 11,812,681 2029 Jul-29 1.38527 5,181,345 3,740,312 48,447,546 34,973,342 2029 Aug-29 1.38892 5,170,359 3,722,569 37,742,322 27,173,819 2029 Sep-29 1.39237 5,159,570 3,705,604 187,781,358 134,864,610 2029 Oct-29 1.39587 5,317,020 3,809,104 42,188,488 30,223,766 2029 Nov-29 1.39943 4,140,364 2,958,609 23,941,143 17,107,791 2029 Dec-29 1.40313 4,133,844 2,946,160 9,647,099 6,875,414 2029 Jan-30 1.40689 4,127,279 2,933,626 154,395,801 109,742,878 2029 Feb-30 1.41061 4,120,658 2,921,194 80,884,266 57,340,035 2029 Mar-30 1.41430 4,113,907 2,908,792 20,598,901 14,564,726 2029 Apr-30 1.41797 4,107,339 2,896,641 6,645,126 4,686,379 2029 May-30 1.42165 4,100,691 2,884,465 20,050,913 14,104,004 2029 Jun-30 1.42537 4,094,172 2,872,351 14,869,475 10,431,987 2030 Jul-30 1.42902 4,086,286 2,859,493 44,155,139 30,898,793 2030 Aug-30 1.43274 4,077,193 2,845,738 34,206,682 23,875,065 2030 Sep-30 1.43642 4,068,116 2,832,125 172,105,783 119,815,955 2030 Oct-30 1.44007 4,196,938 2,914,405 38,358,144 26,636,359 2030 Nov-30 1.44368 3,191,006 2,210,323 21,611,715 14,969,848 2030 Dec-30 1.44750 3,185,450 2,200,653 8,492,281 5,866,851 2030 Jan-31 1.45129 3,179,918 2,191,097 141,564,179 97,543,672
Fiscal Year Month Accumulation
Factors Undiscounted Total
Cash Inflows Discounted Total
Cash Inflows Undiscounted Total
Cash Outflows Discounted Total
Cash Outflows 2030 Feb-31 1.45505 3,174,410 2,181,657 73,961,109 50,830,785 2030 Mar-31 1.45893 3,168,893 2,172,067 18,704,731 12,820,857 2030 Apr-31 1.46274 3,163,388 2,162,650 5,958,795 4,073,729 2030 May-31 1.46667 3,157,896 2,153,104 18,258,355 12,448,839 2030 Jun-31 1.47046 3,152,417 2,143,836 13,422,739 9,128,283 2031 Jul-31 1.47436 3,145,576 2,133,524 40,537,010 27,494,710 2031 Aug-31 1.47822 3,137,646 2,122,579 31,297,472 21,172,364 2031 Sep-31 1.48202 3,129,742 2,111,810 158,436,026 106,905,518 2031 Oct-31 1.48593 3,249,086 2,186,562 35,171,426 23,669,584 2031 Nov-31 1.48981 2,335,363 1,567,556 19,729,499 13,242,950 2031 Dec-31 1.49372 2,330,761 1,560,371 7,642,710 5,116,552 2031 Jan-32 1.49776 2,326,170 1,553,099 130,362,531 87,038,284 2031 Feb-32 1.50178 2,321,592 1,545,898 68,000,697 45,280,193 2031 Mar-32 1.50579 2,317,026 1,538,744 17,130,695 11,376,552 2031 Apr-32 1.50982 2,312,471 1,531,620 5,432,902 3,598,376 2031 May-32 1.51387 2,307,928 1,524,524 16,747,416 11,062,663 2031 Jun-32 1.51790 2,303,398 1,517,493 12,252,902 8,072,292 2032 Jul-32 1.52194 2,297,517 1,509,597 37,857,945 24,874,785 2032 Aug-32 1.52600 2,290,727 1,501,131 29,156,339 19,106,364 2032 Sep-32 1.53008 2,283,964 1,492,710 148,465,469 97,031,249 2032 Oct-32 1.53418 2,407,836 1,569,462 32,813,504 21,388,317 2032 Nov-32 1.53831 1,490,085 968,651 18,325,404 11,912,693 2032 Dec-32 1.54253 1,486,654 963,774 6,987,913 4,530,152 2032 Jan-33 1.54672 1,483,232 958,954 122,163,983 78,982,675 2032 Feb-33 1.55092 1,479,821 954,156 63,627,732 41,025,769 2032 Mar-33 1.55518 1,476,420 949,356 15,932,039 10,244,493 2032 Apr-33 1.55940 1,473,028 944,613 4,980,149 3,193,633 2032 May-33 1.56363 1,469,647 939,891 15,588,138 9,969,168 2032 Jun-33 1.56787 1,466,275 935,203 11,350,183 7,239,247 2033 Jul-33 1.57212 1,461,670 929,742 35,695,003 22,704,941 2033 Aug-33 1.57648 1,456,466 923,875 27,424,771 17,396,256 2033 Sep-33 1.58080 1,451,284 918,068 140,793,699 89,064,656 2033 Oct-33 1.58515 1,566,714 988,370 30,900,299 19,493,620 2033 Nov-33 1.58958 748,085 470,619 17,132,521 10,778,036 2033 Dec-33 1.59398 745,901 467,948 6,359,391 3,989,625 2033 Jan-34 1.59841 743,725 465,292 115,801,654 72,448,225 2033 Feb-34 1.60291 741,556 462,630 60,179,236 37,543,665 2033 Mar-34 1.60733 739,394 460,013 14,857,273 9,243,439 2033 Apr-34 1.61191 737,239 457,370 4,450,958 2,761,298 2033 May-34 1.61645 735,092 454,756 14,530,130 8,988,896 2033 Jun-34 1.62104 732,952 452,149 10,503,642 6,479,566 2034 Jul-34 1.62559 729,824 448,960 33,321,733 20,498,249 2034 Aug-34 1.63024 726,841 445,849 25,461,723 15,618,387 2034 Sep-34 1.63487 723,871 442,770 133,002,007 81,353,440 2034 Oct-34 1.63952 819,185 499,649 28,768,714 17,547,023 2034 Nov-34 1.64421 183,779 111,773 15,720,577 9,561,165 2034 Dec-34 1.64895 183,133 111,061 5,505,751 3,338,951 2034 Jan-35 1.65370 182,490 110,352 109,324,294 66,108,803 2034 Feb-35 1.65848 181,849 109,648 56,557,473 34,101,987 2034 Mar-35 1.66330 181,210 108,946 13,602,712 8,178,130 2034 Apr-35 1.66817 180,574 108,247 3,745,480 2,245,268 2034 May-35 1.67308 179,940 107,550 13,306,429 7,953,241 2034 Jun-35 1.67807 179,308 106,854 9,468,957 5,642,763 2035 Jul-35 1.68294 178,188 105,879 29,062,715 17,269,061 2035 Aug-35 1.68782 177,423 105,120 21,890,437 12,969,638 2035 Sep-35 1.69291 176,662 104,354 118,330,417 69,897,846
Fiscal Year Month Accumulation
Factors Undiscounted Total
Cash Inflows Discounted Total
Cash Inflows Undiscounted Total
Cash Outflows Discounted Total
Cash Outflows 2035 Oct-35 1.69796 199,141 117,283 24,953,767 14,696,358 2035 Nov-35 1.70322 95 56 13,280,750 7,797,458 2035 Dec-35 1.70819 95 56 4,145,699 2,426,948 2035 Jan-36 1.71320 95 56 97,304,605 56,797,118 2035 Feb-36 1.71822 95 55 49,921,661 29,054,284 2035 Mar-36 1.72363 95 55 11,613,417 6,737,754 2035 Apr-36 1.72908 95 55 2,892,685 1,672,957 2035 May-36 1.73458 95 55 11,428,304 6,588,511 2035 Jun-36 1.74029 95 55 7,883,633 4,530,060 2036 Jul-36 1.74597 0 - 22,691,165 12,996,331 2036 Aug-36 1.75185 0 - 16,811,719 9,596,542 2036 Sep-36 1.75736 0 - 93,050,065 52,948,783 2036 Oct-36 1.76298 0 - 19,422,744 11,017,005 2036 Nov-36 1.76863 0 - 10,097,345 5,709,144 2036 Dec-36 1.77428 0 - 2,894,359 1,631,290 2036 Jan-37 1.78015 0 - 76,699,525 43,086,069 2036 Feb-37 1.78608 0 - 39,076,943 21,878,558 2036 Mar-37 1.79203 0 - 8,948,300 4,993,399 2036 Apr-37 1.79790 0 - 2,262,093 1,258,184 2036 May-37 1.80379 0 - 8,860,694 4,912,257 2036 Jun-37 1.80998 0 - 5,983,254 3,305,705 2037 Jul-37 1.81621 0 - 15,733,325 8,662,719 2037 Aug-37 1.82250 0 - 11,432,723 6,273,107 2037 Sep-37 1.82858 0 - 63,643,536 34,804,871 2037 Oct-37 1.83452 0 - 13,489,779 7,353,314 2037 Nov-37 1.84057 0 - 6,859,942 3,727,066 2037 Dec-37 1.84676 0 - 1,932,208 1,046,271 2037 Jan-38 1.85288 0 - 52,739,729 28,463,675 2037 Feb-38 1.85903 0 - 26,710,114 14,367,742 2037 Mar-38 1.86553 0 - 6,119,921 3,280,519 2037 Apr-38 1.87206 0 - 1,819,083 971,701 2037 May-38 1.87860 0 - 6,076,218 3,234,433 2037 Jun-38 1.88480 0 - 4,084,756 2,167,208 2038 Jul-38 1.89095 0 - 9,162,617 4,845,514 2038 Aug-38 1.89724 0 - 6,387,234 3,366,589 2038 Sep-38 1.90373 0 - 35,460,057 18,626,595 2038 Oct-38 1.91005 0 - 7,915,543 4,144,161 2038 Nov-38 1.91647 0 - 3,843,324 2,005,414 2038 Dec-38 1.92304 0 - 1,099,867 571,943 2038 Jan-39 1.92952 0 - 29,777,120 15,432,413 2038 Feb-39 1.93612 0 - 14,896,963 7,694,249 2038 Mar-39 1.94261 0 - 3,435,629 1,768,560 2038 Apr-39 1.94935 0 - 1,431,491 734,342 2038 May-39 1.95613 0 - 3,412,813 1,744,679 2038 Jun-39 1.96255 0 - 2,301,949 1,172,935 2039 Jul-39 1.96919 0 - 4,862,986 2,469,531 2039 Aug-39 1.97562 0 - 3,079,756 1,558,884 2039 Sep-39 1.98200 0 - 16,922,943 8,538,321 2039 Oct-39 1.98826 0 - 4,273,795 2,149,519 2039 Nov-39 1.99448 0 - 1,866,974 936,070 2039 Dec-39 2.00117 0 - 560,362 280,017 2039 Jan-40 2.00799 0 - 14,686,112 7,313,840 2039 Feb-40 2.01471 0 - 7,129,999 3,538,968 2039 Mar-40 2.02080 0 - 1,670,112 826,462 2039 Apr-40 2.02686 0 - 1,190,250 587,239 2039 May-40 2.03288 0 - 1,658,298 815,737

Fiscal Year Month Accumulation
Factors Undiscounted Total
Cash Inflows Discounted Total
Cash Inflows Undiscounted Total
Cash Outflows Discounted Total
Cash Outflows 2039 Jun-40 2.03912 0 - 1,130,572 554,441 2040 Jul-40 2.04558 0 - 2,984,072 1,458,793 2040 Aug-40 2.05179 0 - 1,619,174 789,152 2040 Sep-40 2.05818 0 - 8,781,155 4,266,458 2040 Oct-40 2.06445 0 - 2,683,129 1,299,681 2040 Nov-40 2.07059 0 - 990,753 478,489 2040 Dec-40 2.07667 0 - 314,562 151,475 2040 Jan-41 2.08251 0 - 8,072,754 3,876,448 2040 Feb-41 2.08848 0 - 3,713,511 1,778,095 2040 Mar-41 2.09450 0 - 887,120 423,547 2040 Apr-41 2.10051 0 - 1,091,526 519,648 2040 May-41 2.10650 0 - 880,388 417,939 2040 Jun-41 2.11206 0 - 608,155 287,945 2041 Jul-41 2.11751 0 - 2,151,915 1,016,250 2041 Aug-41 2.12309 0 - 958,051 451,253 2041 Sep-41 2.12919 0 - 5,141,001 2,414,528 2041 Oct-41 2.13521 0 - 1,978,609 926,656 2041 Nov-41 2.14140 0 - 590,661 275,829 2041 Dec-41 2.14778 0 - 195,660 91,098 2041 Jan-42 2.15419 0 - 5,129,284 2,381,078 2041 Feb-42 2.16062 0 - 2,180,831 1,009,356 2041 Mar-42 2.16677 0 - 529,469 244,359 2041 Apr-42 2.17296 0 - 1,054,642 485,349 2041 May-42 2.17920 0 - 525,306 241,055 2041 Jun-42 2.18541 0 - 366,605 167,751 2042 Jul-42 2.19180 0 - 1,644,136 750,130 2042 Aug-42 2.19810 0 - 543,592 247,300 2042 Sep-42 2.20452 0 - 2,894,227 1,312,861 2042 Oct-42 2.21082 0 - 1,550,650 701,391 2042 Nov-42 2.21714 0 - 337,016 152,004 2042 Dec-42 2.22413 0 - 115,018 51,714 2042 Jan-43 2.23089 0 - 3,324,844 1,490,364 2042 Feb-43 2.23785 0 - 1,230,603 549,905 2042 Mar-43 2.24436 0 - 302,409 134,742 2042 Apr-43 2.25104 0 - 1,038,738 461,449 2042 May-43 2.25774 0 - 299,993 132,873 2042 Jun-43 2.26452 0 - 210,908 93,136 2043 Jul-43 2.27132 0 - 1,302,306 573,370 2043 Aug-43 2.27815 0 - 253,777 111,397 2043 Sep-43 2.28466 0 - 1,344,103 588,317 2043 Oct-43 2.29132 0 - 1,263,569 551,459 2043 Nov-43 2.29783 0 - 157,966 68,746 2043 Dec-43 2.30441 0 - 54,995 23,865 2043 Jan-44 2.31086 0 - 2,090,881 904,805 2043 Feb-44 2.31734 0 - 572,452 247,030 2043 Mar-44 2.32419 0 - 141,927 61,065 2043 Apr-44 2.33073 0 - 1,034,752 443,961 2043 May-44 2.33727 0 - 140,812 60,246 2043 Jun-44 2.34424 0 - 99,484 42,438 2044 Jul-44 2.35120 0 - 1,087,336 462,459 2044 Aug-44 2.35817 0 - 61,268 25,981 2044 Sep-44 2.36408 0 - 324,286 137,172 2044 Oct-44 2.37015 0 - 1,084,117 457,405 2044 Nov-44 2.37623 0 - 38,187 16,071 2044 Dec-44 2.38297 0 - 13,354 5,604 2044 Jan-45 2.38986 0 - 1,289,489 539,567

Fiscal Year Month Accumulation
Factors Undiscounted Total
Cash Inflows Discounted Total
Cash Inflows Undiscounted Total
Cash Outflows Discounted Total
Cash Outflows 2044 Feb-45 2.39658 0 - 138,178 57,656 2044 Mar-45 2.40312 0 - 34,377 14,305 2044 Apr-45 2.40948 0 - 1,041,081 432,078 2044 May-45 2.41583 0 - 34,128 14,127 2044 Jun-45 2.42203 0 - 24,133 9,964


