BOARD OF EDUCATION OF THE TOWNSHIP OF TABERNACLE … · 2015/2016 770 2016/2017 709 The District is...
159
BOARD OF EDUCATION OF THE TOWNSHIP OF TABERNACLE SCHOOL DISTRICT TABERNACLE, NEW JERSEY COMPREHENSIVE ANNUAL FINANCIAL REPORT FOR THE FISCAL YEAR ENDED JUNE 30, 2017
Transcript of BOARD OF EDUCATION OF THE TOWNSHIP OF TABERNACLE … · 2015/2016 770 2016/2017 709 The District is...

BOARD OF EDUCATION
OF THE
TOWNSHIP OF TABERNACLESCHOOL DISTRICT
TABERNACLE, NEW JERSEY
COMPREHENSIVE ANNUAL FINANCIAL REPORT
FOR THE FISCAL YEAR ENDED
JUNE 30, 2017

i
24750 TABERNACLE SCHOOL DISTRICT
Table of Contents Page
INTRODUCTORY SECTION Letter of Transmittal 2 Organizational Chart 10 Roster of Officials 11 Consultants and Advisors 12
FINANCIAL SECTION Independent Auditor's Report 14 Required Supplementary Information - Part I Management’s Discussion and Analysis 20 Basic Financial Statements A. Government-Wide Financial Statements: A-1 Statement of Net Position 29 A-2 Statement of Activities 30
B. Fund Financial Statements: Governmental Funds: B-1 Balance Sheet 32 B-2 Statement of Revenues, Expenditures and Changes in Fund Balances 33
B-3 Reconciliation of the Statement of Revenues, Expenditures and Changes in Fund Balances of Governmental Funds to the Statement of Activities 34 Proprietary Funds: B-4 Statement of Net Position 35 B-5 Statement of Revenues, Expenses and Changes in Fund Net Position 36 B-6 Statement of Cash Flows 37 Fiduciary Funds: B-7 Statement of Fiduciary Net Position 38 B-8 Statement of Changes in Fiduciary Net Position 39 Notes to the Financial Statements 40 Required Supplementary Information - Part II
C. Budgetary Comparison Schedules
C-1 Budgetary Comparison Schedule - General Fund 74 C-1a Combining Schedule of Revenues, Expenditures and Changes in Fund Balance - Budget and Actual (if applicable) N/A C-1b Community Development Block Grant - Budget and Actual (if applicable) N/A C-2 Budgetary Comparison Schedule - Special Revenue Fund 83
C-3 Notes to Required Supplementary Information - Part II Budget-to-GAAP Reconciliation 84

ii
24750 TABERNACLE SCHOOL DISTRICT
Table of Contents (Cont’d)
Page
Required Supplementary Information - Part III L. Schedules Related to Accounting and Reporting for Pensions L-1 Schedule of the School District’s Proportionate Share of the Net Pension Liability - PERS 86 L-2 Schedule of the School District’s Contributions - PERS 87 L-3 Schedule of the School District’s Proportionate Share of the Net Pension Liability - TPAF 88 L-4 Schedule of the School District’s Contributions - TPAF 89 L-5 Notes to the Required Supplementary Information - Part III 90
Required Supplementary Information - Part IV (if applicable) L-6 Schedule of Funding Progress for Health Benefits Plan N/A L-7 Notes to the Required Supplementary Information - Part IV N/A
Other Supplementary Information
D. School Based Budget Schedules:
D-1 Combining Balance Sheet N/A D-2 Blended Resource Fund - Schedule of Expenditures Allocated by Resource Type - Actual N/A D-3 Blended Resource Fund - Schedule of Blended Expenditures - Budget and Actual N/A
E. Special Revenue Fund:
E-1 Combining Schedule of Program Revenues and Expenditures - Budgetary Basis 93 E-2 Preschool Education Aid Schedule(s) of Expenditures - Budgetary Basis N/A
F. Capital Projects Fund:
F-1 Summary Schedule of Project Expenditures 96 F-2 Summary Schedule of Revenues, Expenditures, and Changes in Fund Balances 97 F-2a Schedule(s) of Project Revenues, Expenditures, Project Balance and Project Status 98

iii
24750 TABERNACLE SCHOOL DISTRICT
Table of Contents (Cont’d)
Page Other Supplementary Information (Cont’d)
G. Proprietary Funds:
Enterprise Fund: G-1 Statement of Net Position 100 G-2 Statement of Revenues, Expenses and Changes in Fund Net Position 101 G-3 Statement of Cash Flows 102 Internal Service Fund: G-4 Combining Statement of Net Position N/A G-5 Combining Statement of Revenues, Expenses and Changes in Fund Net Position N/A G-6 Combining Statement of Cash Flows N/A
H. Fiduciary Funds:
H-1 Combining Statement of Fiduciary Net Position 104 H-2 Combining Statement of Changes in Fiduciary Net Position 105 H-3 Student Activity Agency Fund Schedule of Receipts and Disbursements 106 H-4 Payroll Agency Fund Schedule of Receipts and Disbursements 107
I. Long-Term Debt:
I-1 Schedule of Serial Bonds 109 I-2 Schedule of Obligations under Capital Leases 110 I-3 Debt Service Fund Budgetary Comparison Schedule 111
STATISTICAL SECTION (Unaudited)
Introduction to the Statistical Section Financial Trends J-1 Net Position by Component 114 J-2 Changes in Net Position 115 J-3 Fund Balances - Governmental Funds 117 J-4 Changes in Fund Balances - Governmental Funds 118 J-5 General Fund Other Local Revenue by Source 119 Revenue Capacity J-6 Assessed Value and Estimated Actual Value of Taxable Property 121 J-7 Direct and Overlapping Property Tax Rates 122 J-8 Principal Property Taxpayers 123 J-9 Property Tax Levies and Collections 124 Debt Capacity J-10 Ratios of Outstanding Debt by Type 126 J-11 Ratios of General Bonded Debt Outstanding 127 J-12 Direct and Overlapping Governmental Activities Debt 128 J-13 Legal Debt Margin Information 129

iv
24750 TABERNACLE SCHOOL DISTRICT
Table of Contents (Cont’d)
Page STATISTICAL SECTION (Unaudited) (Cont’d)
Demographic and Economic Information J-14 Demographic and Economic Statistics 131 J-15 Principal Non-Governmental Employers 132 Operating Information J-16 Full-time Equivalent District Employees by Function/Program 134 J-17 Operating Statistics 135 J-18 School Building Information 136 J-19 Schedule of Required Maintenance 137 J-20 Insurance Schedule 138
SINGLE AUDIT SECTION
K-1 Report on Internal Control over Financial Reporting and on Compliance and Other Matters Based on an Audit of Financial Statements Performed in Accordance with Government Auditing Standards 17 K-2 Report on Compliance for Each Major Program and Report on Internal Control over Compliance Required by the Uniform Guidance and State of New Jersey Circular 15-08-OMB 140 K-3 Schedule of Expenditures of Federal Awards, Schedule A 142 K-4 Schedule of Expenditures of State Financial Assistance, Schedule B 144 K-5 Notes to the Schedules of Expenditures of Federal Awards and State Financial Assistance 146 Schedule of Findings and Questioned Costs: K-6 Summary of Auditor’s Results 148 K-7 Schedule of Current Year Findings 150 K-8 Summary Schedule of Prior Year Audit Findings and Questioned Costs as Prepared by Management 153

INTRODUCTORY SECTION

Tabernacle Township Schools 132 New Road Tabernacle, NJ 08088
November 8, 2017
Honorable President and Members of the Board of Education Township of Tabernacle School District County of Burlington, New Jersey
Dear Board of Education Members:
The Comprehensive Annual Financial Report of the Tabernacle Township School District for the fiscal year ended June 30, 2017 is hereby submitted. Responsibility for both the accuracy of the data and completeness and fairness of the presentation, including all disclosures, rests with the management of the Board of Education (Board). To the best of our knowledge and belief, the data presented in this report is accurate in all material respects and is reported in a manner designed to present fairy the financial position and results of operations of the various funds of the District. All disclosures necessary to enable the reader to gain an understanding of the District’s financial activities have been included.
The Comprehensive Annual Financial Report is presented in four sections: introductory, financial, statistical and single audit. The introductory section includes this transmittal letter, the District’s organizational chart, and a list of principal officials. The financial section includes Management’s Discussion and Analysis, basic financial statements and schedules, as well as the auditor’s report thereon. The statistical section includes selected financial and demographic information. The District is required to undergo an annual single audit in conformity with the provisions of Title 2 U.S. Code of Federal Regulations Part 200, Uniform Administrative Requirements, Cost Principles, and Audit Requirements for Federal Awards (Uniform Guidance), and State of New Jersey Circular 15‐08‐OMB, Single Audit Policy for Recipients of Federal Grants, State Grants and State Aid. Information related to this single audit, including the auditor’s report on the internal control structure and compliance with applicable laws and regulations, findings and questioned costs, is included in the single audit section of this report. ‐
1. REPORTING ENTITY AND ITS SERVICES: Tabernacle Township School district is an independentreporting entity within the criteria adopted by the GASB as established by GASB Statement 14. All fundsof the District are included in this report. The Tabernacle Township Board of Education and its schoolsconstitute the District’s reporting entity. The District provides a full range of educational servicesappropriate to grade levels preschool disabilities through eight. These include regular education as wellas special education for disabled children. The District’s enrollment is 707 as of June 30, 2017. Thefollowing details the changes in the student enrollment of the District over the last ten years:
2

AVERAGE DAILY ENROLLMENT
Fiscal Year Student Enrollment 2007/2008 880 2008/2009 896 2009/2010 873 2010/2011 870 2011/2012 828 2012/2013 819 2013/2014 797 2014/2015 763 2015/2016 770 2016/2017 709
The District is a constituent member of the Lenape Regional High School District. The District’s students in grades 9‐12 attend Seneca High School located in Tabernacle Township.
2. ECONOMIC CONDITION AND OUTLOOK: Tabernacle Township is a rural, residential community locatedin the southwestern portion of Burlington County. The Township is approximately 49.55 square milesand approximately twenty‐six miles from Philadelphia. Wharton Tract covers 28.5% of the township’s30,489 acres. Tabernacle Township is located within the Pinelands Preservation area with developmenthighly regulated. The estimated population for 2016 was 6,892 compared to 6,954 in 2015. Theestimated population density in 2016 was 139.1 persons per square mile. The percent of school tax levycollected for 2017 was 100.0%. The unemployment rate for 2016 was 4.7%. The County of Burlingtonper capital personal income for 2015 was $55,227.
3. MAJOR INITIATIVES:
Statewide and District Assessments: Students in grades K‐8 are evaluated with the Measures ofAcademic Progress (MAP) in the areas of reading and mathematics. The MAP benchmark assessment isadministered three times a year and is aligned to the Common Core State Standards (CCSS). Studentsin grades three through eighth were assessed using the Partnership for Assessment of Readiness forCollege and Careers (PARCC) for English Language Arts and Mathematics and, additionally, the NewJersey Assessment for Skills and knowledge (NJ ASK) in grades fourth and eighth for Science. Studentsin fourth and eighth grades were assessed in language arts, mathematics, and science.
Language Arts: The District writing program continues to be in development and is based on the LucyCalkins Writer’s Workshop Model. Additional writing resources offering ideas for mini lessons have beenpurchased for teachers. Writing activities are correlated with the reading/literature program of eachgrade level. The Writers’ Workshop model of instruction has been implemented district‐wide in an effortto raise student achievement in Language Arts Literacy.
Mathematics: This program is in use in kindergarten through fifth grade. The EnVision Math programtargets student understanding and meets the individual needs of students through balanced andaccurately paced lessons, printed lessons, printed materials, manipulatives, and technology integration.The Progressive Mathematics Initiative (PMI) is used for math instruction in grades six through eight.Select student groups in grades seven and eight continue to use the algebra and geometry texts andsyllabi from the Lenape Regional High School District. All other eighth grade students are instructedthrough the use of PMI.
3

Science: The elementary school continues to use the McGraw Hill Science as a resource. Grade one uses the big book format, grades two and three the single text format, and grade four the modular format. All topics were aligned with the recently revised New Jersey Core Curriculum Content Standards (NJCCCS) for science. The middle school science department is in its seventh year with Holt Science 7 Technology. The program is modular and allows for flexibility of instructional topics within the middle school grade levels. It also has an extensive technology resource component for students and instructors. Middle school science instructors also have one of the technology labs organized with Virtual Investigations. The program includes virtual experiments and student online access to the textbook. Teachers in grades 5‐8 have selected IQWST units to meet the NGSS and are writing curriculum to address these standards.
Social Studies: Grades three, four, five, six, seven and eight are currently using the History Alive program. Call to Freedom is used as a supplemental resource by the eighth grade. In addition, current events are incorporated to provide timely and appropriate topics for classroom discussion. Grades K‐2 teach social studies through the Nystrom Program, which offers a hands on approach to social studies.
Technology: The Tabernacle Technology Department has revamped the entire student/teacher technology platform from a Microsoft Windows environment to an Apple OS and iOS in grades K‐8. This also contains a standard load set where teacher and student laptops contain identical software suites (Microsoft Office Suite, Adobe Reader, Pages, Notes, Spreadsheets, iMovie, VLC Media Player, etc.). This way, the software compatibly between students and teachers is not a concern. The administration and business side of the district are still on a Microsoft OS load set, running Windows 7 Enterprise and Microsoft Office Professional suites. We are using a Dell Kace2100 imaging management appliance for deploying the existing load set to our Microsoft OS environment along with a Dell KacelOOO for patch management. To manage the load set for the new Apple environment, two servers were installed. One server is an Apple App Caching server to house Apple Applications to deploy over the network. The second server is a Jamf Suite MDM server that controls the software, configuration and security policy that each MacBook or iPad needs in the district. This saves valuable time to our Technology Department so that we have more time to service our student, teacher and district needs. All users are assigned an individual login with user created passwords. This is controlled by a primary Microsoft Windows Active Directory Domain Controller. There is also a backup Active Directory and Domain Controller.
To manage the new, existing hardware, software and end users, we upgraded our internal network switches and infrastructure physical connectivity to a fiber backbone. Each POE switch that now in a designated IDF closet, has a dedicated connection via fiber that runs at 1GBS+ to the MDF at both schools. Both schools have a dedicated fiber connecting between the middle school and elementary school.
With our upgraded, over worked 200MEG coaxial/fiber hybrid ISP connection to a true 1GBS UP/1GBS DOWN fiber ISP connection (Which can be upgraded to higher speeds in the future), Upgraded Ruckus Zone Director wireless controller and access points (AC, BG, N) district wide, along with a new FortiNet Firewall/Content appliance, we have achieved a true robust enterprise level network. This will keep Tabernacle School's both LAN and WAN robust infrastructure speeds aligned with the ever changing, demanding end user bandwidth and ISP requirements.
4

Each teacher has been assigned a 13 inch MacBook Air. In grades 5‐8, each student has a MacBook Air 11 inch model bringing the middle school a true 1:1 laptop environment. These laptops are housed in combination locked charging carts, in designated home rooms. The middle school students pick up their assigned MacBook Air at the beginning of the day and return them at the end of the day. Grades K ‐ 4, have a shared environment consisting of 95 new MacBook Air 11 inch models divided into 20‐25 MacBook Airs per combination locked charging cart. Additional 50 second life laptops are deployed among grades 3rd and 4th grades. Grades K‐2 have 5, iPad Air 2 in each classroom. And additional 25, iPad Air 2 cart is available in the Elementary Media Center where any teacher may sign out additional iPads as needed. That totals 75 teacher MacBook Air 13 inch and 455 student MacBook Air 11 inch models.
With this new student/teacher technology platform and additional inventory, we are able to perform state enforced online assessments in a more timely and efficient matter. This is also true for district online benchmark assessment MAP.
A new STEM lab at the Middle School has been built. There are 8 Dell OptiPlex Microsoft OS workstations with upgraded software suites. This includes such software titles as Google Sketchup 2015 Pro with a free license for up to 300 simultaneous users can use the software, district wide. Adobe CS6 Suites, Maxis SimCity for the annual Future Cities competitions has been installed and receives upgrades every year free. The STEM lab also contains a SmartBoard 800 series digital white board with a HD LED projector.
All classrooms contain either a SmartBoard 800 series with a HD LED projector or the new 8 touch interactive flat SmartPanel 6000 Series 4K LED. The new Smart Panels contain HD quality sound for impressive audience attention. Most classrooms at both the middle and elementary schools contain a Sound Field or Front Row interactive sound system. This system not only assists our students with hearing concerns, but draws attention to the teacher from the student level as the teacher speaks into a wireless necklace type HD microphone. Depending on the model type, the sound is delivered through a speaker that is wall mounted or ceiling mounted. Hearing impaired students wear an ear peace to help aid their listening skills, as per their IEP or 504 plan.
The district utilizes Study Island for creating individual learning plans, based on student performance on the NWEA Measures of Academic Progress. Classes have been created for all grade levels. FastMath is also utilized as an interactive online based math learning tool for all grade levels. We have included many other online based software packages such as BrainPop, BrainPop and Reading Eggs.
Google Apps has been deployed across the district. All staff and students haven been assigned email addresses that are utilized as their Google Apps username. Email services that Google Apps offers is available for all staff. Students do not have access to their individual email at this time. This is a goal for the 2016‐2017 school year; to have student email. This will be a controlled email environment based on domain level email access only. Students do have access to Google Drive, Sheets, Docs, Presentation, Sites, Photo and Sketch. These are subject to change depending on the demand of the lesson at hand. Teachers have been collaborating interactively by sharing assigned assignments. Many custom generated tests by the teachers are being accessed by the student body of each grade.
Google Vault has been set into place for e‐mail recovery and quality assurance purposes. A Domain Key Identified Mail (DKIM) has been deployed to help spam filters outside of our network to authenticate sent district email. This helps other spam filters know that our email is not spam and ensures recipient receives our outgoing district domain email.
5

Our district wide HVAC system has been upgraded at all network, server and software levels. The new Metasys Climate Control Suite resides on a new virtual server that contains the space and processing power to run the middle and elementary school chillers, boilers, air handlers, temperature set points and humidity set points.
Our Business Office and Transportation Center run custom dedicated data base software that is also hosted on a virtual server. The Transportation Center utilizes the software title Buss Boss which provides custom routes for our buses for transportation. For purchase orders, budgeting, attendance and check printing, the Business Office utilizes the software title Systems 3000. Intuit QuickBooks Pro is used for student account activities.
Tabernacle has a redundant backup system. Daily backup of all servers are performed to another local server in another building and to the secure cloud based environment. This is part of the disaster recovery plan for technology.
Reading/Literature: Kindergarten through eighth grade continue to implement the use of authentic literature as one of the primary sources of instructional materials. The Tabernacle School District continues with a major literacy initiative to fully develop a well‐balanced literacy program to include: 1.) a core literature component, 2.) guided reading, 3.) writer’s workshop, 4.) personal choice reading, and 5.) vocabulary word study.
Staff Development: Staff development continues to be a District priority. Topics for presentations were based on curriculum changes, school objectives, and the District’s local professional development plan. Tabernacle staff have professional development opportunities through in‐service programs, Lenape Regional Consortium programs, Burlington County Curriculum Consortium programs, after‐school courses, off‐site professional workshops/conferences, in‐house training sessions, and tuition reimbursement for college level graduate‐level courses.
World Language: Each school has its own world language instructor. Each teacher has purchased a variety of resources based on the grade level they instruct. The elementary students use elementary level materials available like SALSA (NJ Department of Education) and the Spanish Alphabet Books (Zaner‐Bloser Publishing Company). The Middle School Spanish classroom focuses on learning the language through comprehensible input and cooperative learning. Language instruction at the middle school is delivered utilizing resources associated with the Teaching Proficiency Through Reading and Storytelling (TPRS) method which allows students to learn a language using a more natural approach. The district will continue to purchase resources to enhance instruction. Select eighth grade students participate in the full year program using the text used by first year Spanish students in Seneca High School. The Spanish I students in 8th grade use !Avancemos! (Holt McDougal), ?Que tal? (Scholastic Spanish Magazine Series) and a Spanish class novel from TPRS Publishing, Inc.
Integrated Science Technology Engineering and Mathematics (iSTEM) Program: The school district has partnered with the College of New Jersey’s Center for Excellence in iSTEM Education to successfully implement a best practice model of an integrated ISTEM program at the Kenneth R. Olson Middle School. The district is utilizing the Engineering by Design curriculum as a model for programming design challenges for students in 5th through 8th grades. The district continues to develop curriculum in the iSTEM program.
Report Cards: The school district completes its report cards electronically through the District’s technology resources. There were no revisions to any elementary level report cards.
6

Special Education Services: The District strives to provide the least restrictive environment for its students. Approximately three quarters of the special needs students are in general education classrooms and receive their special education services through in‐class support of the regular teacher assisted by a resource special education teacher. During the 2011/2012 school year the State of New Jersey Department of Education reviewed and approved the District’s special education improvement plan. The District continues to meet with its Special Education Parent Advisory Group to review and improve services. This group also arranges speakers on various special educational topics for parent information sessions. The district provides preschool inclusive programming for students with disabilities and adopted the High Scope researched based early childhood curriculum, a NJDOE recognized evidenced based program.
District Information: Tabernacle students grades kindergarten through fourth, including an integrated preschool disabilities class, are housed in the Tabernacle Elementary School. Students in grades fifth through eighth are housed in the Kenneth R. Olson Middle School. As of July 1, 2000 the District’s third school, the Tabernacle Intermediate School, was leased to the Lenape Regional High School District for use as a transition high school. After extensive renovations to the school were completed by the Lenape District, the building opened to high school students for the 2001/2002 school year. At that time the building was dedicated as Sequoia Transition High School.
The district provides full day kindergarten programming for all Tabernacle resident students. Curriculum is based on the NJDOE recommended schedule of learning and activities for a model kindergarten full day program.
The District was successfully monitored during January 2001 by the State of New Jersey Department of Education under N.J.S.A. 18A:7A‐1 et seq. This resulted in certification for a period of seven years. Currently districts must comply with the New Jersey Quality Single Accountability Continuum (QSAC) which is the State’s monitoring and evaluation system for public school districts to ensure that all districts are operating at a high level of performance. QSAC focuses on five key components that have been identified to be key factors in effective school districts. They are instruction and program, personnel, fiscal management, operations and governance. This process occurs every three years with districts completing a Statement of Assurances every year. This District successfully passed QSAC during the 2014/2015 school year.
The District’s Long‐Range Facilities Plan was revised and approved by the Board of Education at its October 10, 2005 meeting. This plan is a requirement of the Educational Facilities Construction and Financing Act, P.L. 2000, c.72, N.J.A.C. 6A:26.1.1 and the Facilities Efficiency Standards. The plan covers years October 2008 to October 2013. The district has submitted amendments and updates to the current LRFP to accommodate for future projects to be addressed in the 2015/2016 school year and beyond. Security upgrades were completed during the summer of 2015.
On March 9, 2004 the District held a bond referendum in the amount of $11,673,195 for the replacement of the middle school roof and various upgrades to the major systems of the middle school and elementary school. The referendum was defeated. The Board of Education held another referendum on September 28, 2004 in the amount of $9,743,980 which did receive voter approval. A second question on the ballot was defeated with a tie vote.
In February 2005 bonds were issued in the amount of $5,673,000 with a net interest rate of 3.9713%. The projects began during the spring of 2005 with major work scheduled for the summer of 2006 and 2007. Upgrades to the district’s waste water treatment plant began during the 2008/2009 school year.
7

During October 2013 closing took place for the refinancing of the District’s 2003 and 2005 bond issues. The savings to the District was $359,398.40. The retirement date of the bonds is in the 2024/2025 school year.
4. INTERNAL ACCOUNTING CONTROLS: Management of the District is responsible for establishing andmaintaining an internal control structure designed to ensure that the assets of the District are protected from loss, theft or misuse and to ensure that adequate accounting data is compiled to allow for the preparation of financial statements in conformity with generally accepted accounting principles (GAAP). The internal control structure is designed to provide reasonable, but not absolute, assurance that these objectives are met. The concept of reasonable assurance recognizes that: (1) the cost of a control should not exceed the benefits likely to be derived, and (2) the valuation of costs and benefits requires estimates and judgments by management.
As a recipient of federal and state financial assistance, the District also is responsible for ensuring that an adequate internal control structure is in place to ensure compliance with applicable laws and regulations related to those programs. This internal control structure is also subject to periodic evaluation by the District management.
5. BUDGETARY CONTROLS: In addition to internal accounting controls, the District maintains budgetarycontrols. The objective of these budgetary controls is to insure compliance with legal provisions embodied in the State approved annual appropriated budget. Annual appropriated budgets are adopted for the general fund, the special revenue fund, and the debt service fund. The final budget amount as amended for the fiscal year is reflected in the financial section.
An encumbrance accounting system is used to record outstanding purchase commitments on a line item basis. Open encumbrances at year‐end are included as reappropiations of fund balance in the subsequent year. Those amounts to be reappropriated are reported as assignments of fund balance at June 30, 2017.
6. ACCOUNTING SYSTEM AND REPORTS: The District’s accounting records reflect generally acceptedaccounting principles, as promulgated by the Governmental Accounting Standards Board (GASB). The accounting system of the District is organized on the basis of funds. These funds are explained in “Notes to the Financial Statements”, Note 1.
7. FINANCIAL INFORMATION AT FISCAL YEAR END: As demonstrated by the various statements andschedules included in the financial section of this report, the District continues to meet its responsibility for sound financial management.
8. DEBT ADMINISTRATION: At June 30, 2017 the District’s outstanding debt issues included $4,565,000of general obligation bonds.
9. CASH MANAGEMENT: The investment policy of the District is guided in large part by State statuteas detailed in “Notes to the Financial Statement”, Note 2. The District has adopted a cash management plan, which requires it to deposit public funds in public depositories protected from loss under the provision of the Governmental unit Deposit Protection Act (“GUDPA”). GUDPA was enacted in 1970 to protect Governmental Units from a loss of funds on deposit with a failed banking institution in New Jersey. The law requires governmental units to deposit public funds only in public depositories located in New Jersey, where the funds are secured in accordance with the Act.
8

10. RISK MANAGEMENT: The Board carries various forms of insurance, including but not limited togeneral liability, automobile liability and comprehensive/collision, hazard and theft insurance on property and contents, and fidelity bonds. The District is a member of the Burlington County Insurance Pool Joint Insurance Fund.
11. OTHER INFORMATION: State statutes require an annual audit by independent certified publicaccountants or registered municipal accountants. The Board of Education appointed the firm of Bowman & Company LLP as the District’s auditors. In addition to meeting the requirements set forth in State statutes, the audit also was designed to meet the requirements of Title 2 U.S. Code of Federal Regulations Part 200, Uniform Administrative Requirements, Cost Principles, and Audit Requirements for Federal Awards (Uniform Guidance), and State of New Jersey Circular 15‐08‐OMB, Single Audit Policy for Recipients of Federal Grants, State Grants and State Aid. The auditor’s report on the basic financial statements and combining and individual fund statements and schedules is included in the financial section of this report. The auditor’s report related specifically to the single audit is included in the single audit section of this report.
ACKNOWLEDGMENTS: The Tabernacle School District would not experience its successes without the support of the administration, staff, parents, and the community, but most certainly by the Tabernacle Board of Education. Not only is the Board of Education to be commended for their continued support and concern in providing fiscal accountability to the citizens and taxpayers of the School District, but the Board is recognized for its vision and desire to truly educate the students of the Township of Tabernacle for a lifetime. We express our appreciation for their dedication to the development and maintenance of the District’s educational and financial operations. In addition, the preparation of this report could not have been accomplished without the efforts and accomplishments of our District administration and their staff, and especially, the Business Office staff. Their continued dedication and commitment result in the excellence that is maintained. Their efforts are acknowledged and greatly appreciated.
Respectfully submitted,
Glenn Robbins Jessica L. DeWysockie Superintendent of Schools School Business Administrator
Board Secretary
9

TA
BE
RN
AC
LE
TO
WN
SH
IP S
CH
OO
L D
IST
RIC
TO
rgan
izat
ion
Ch
art
Cit
izen
s
Su
per
inte
nd
ent
Bo
ard
of
Ed
uca
tio
n
Dir
ecto
r o
f C
urr
icu
lum
P
rin
cip
als
Dir
ecto
r o
f S
pec
ial
Ser
vic
esB
usi
nes
s A
dm
in/
Bo
ard
Sec
reta
ry
Off
ice
Sta
ff
Off
ice
Sta
ffO
ffic
eS
taff
Off
ice
Sta
ffO
ffic
eS
taff
Tea
cher
sL
ibra
rian
sN
urse
s
Ass
ista
nts
CS
TC
ou
nse
lors
Fac
ilit
ies
Man
ager
Bu
s M
ech
anic
Bu
s D
riv
ers
Su
per
vis
or
of
Caf
eter
iaT
reas
ure
r o
f S
cho
ol
Mo
nie
s
Cu
sto
dia
ns
Mai
nte
nan
ce
Tec
hnol
ogy
Adm
inis
trat
or
Sp
Ed
A
ssis
tan
ts
Rel
ated
Ser
vic
es
Sp
ecia
l E
dT
each
ers
Ed
Tec
h S
peci
alis
tS
ecre
tary
Tra
nsp
ort
atio
n
Man
ager
10

TABERNACLE TOWNSHIP BOARD OF EDUCATION132 NEW ROAD
TABERNACLE, NEW JERSEY 08088
ROSTER OF OFFICIALSJUNE 30, 2017
MEMBERS OF THE BOARD OF EDUCATION TERM EXPIRES
Victoria Shoemaker, President 2019Anthony Laudicina, Vice President 2018Gail Corey 2019Julia Sailer 2017Dr. Kevin McCloy 2017Dr. Megan Jones 2017Megan Chamberlain 2019Brian Lepsis 2018John Tirico 2018
OTHER OFFICIALS
Glenn Robbins – SuperintendentJessica DeWysockie – Interim Business Administrator/Board Secretary Karen Albanese – Treasurer of School Monies
.
11

TABERNACLE TOWNSHIP BOARD OF EDUCATION132 New Road
Tabernacle, New Jersey
CONSULTANTS AND ADVISORS
Architect
Regan, Young, England, Butera456 High Street
Mt. Holly, New Jersey 08060
Audit Firm
Bowman & Company LLPDaniel M. DiGangi, CPA, PSA
601 White Horse RoadVoorhees, NJ 08043
Attorney
Parker, McCay and CriscuoloFrank Cavallo
9000 Midlantic Drive, Suite 300Mount Laurel, NJ 08054
Labor Consultants
Capehart & ScatchardRobert Muccilli
8000 Midlantic Drive, Suite 300SMount Laurel, NJ 08054
Official Depositories
TD Bank1701 Route 70 East
Cherry Hill, New Jersey 08053
12

FINANCIAL SECTION

INDEPENDENT AUDITOR'S REPORT
The Honorable President andMembers of the Board of EducationTownship of Tabernacle School DistrictCounty of BurlingtonTabernacle, New Jersey 08088
Report on the Financial Statements
We have audited the accompanying financial statements of the governmental activities, the business-typeactivities, each major fund, and the aggregate remaining fund information of the Township of Tabernacle School District, in the County of Burlington, State of New Jersey, as of and for the fiscal year ended June 30, 2017, and the related notes to the financial statements, which collectively comprise the School District’s basic financial statements as listed in the table of contents.
Management’s Responsibility for the Financial Statements
Management is responsible for the preparation and fair presentation of these financial statements in accordance with accounting principles generally accepted in the United States of America; this includes the design, implementation, and maintenance of internal control relevant to the preparation and fair presentation of financial statements that are free from material misstatement, whether due to fraud or error.
Auditor’s Responsibility
Our responsibility is to express opinions on these financial statements based on our audit. We conducted ouraudit in accordance with auditing standards generally accepted in the United States of America; the standards applicable to financial audits contained in Government Auditing Standards, issued by the Comptroller General of the United States; and in compliance with audit requirements as prescribed by the Division of Administration and Finance, Department of Education, State of New Jersey. Those standards require that we plan and perform the audit to obtain reasonable assurance about whether the financial statements are free from material misstatement.
An audit involves performing procedures to obtain audit evidence about the amounts and disclosures in the financial statements. The procedures selected depend on the auditor’s judgment, including the assessment of the risks of material misstatement of the financial statements, whether due to fraud or error. In making those risk assessments, the auditor considers internal control relevant to the School District’s preparation and fair presentation of the financial statements in order to design audit procedures that are appropriate in the circumstances, but not for the purpose of expressing an opinion on the effectiveness of the School District’s internal control. Accordingly, we express no such opinion. An audit also includes evaluating the appropriateness of accounting principles used and the reasonableness of significant accounting estimates made by management, as well as evaluating the overall presentation of the financial statements.
We believe that the audit evidence we have obtained is sufficient and appropriate to provide a basis for our audit opinions.
14

24750
Opinions
In our opinion, the financial statements referred to above present fairly, in all material respects, the respectivefinancial position of the governmental activities, the business-type activities, each major fund, and the aggregate remaining fund information of the Township of Tabernacle School District, in the County of Burlington, State of New Jersey, as of June 30, 2017, and the respective changes in financial position and, where applicable, cash flows thereof for the fiscal year then ended in accordance with accounting principles generally accepted in the United States of America.
Other Matters
Required Supplementary Information
Accounting principles generally accepted in the United States of America require that the management’s discussion and analysis, budgetary comparison information, schedule of the School District’s proportionate share of the net pension liability and schedule of the School District’s contributions as listed in the table of contents, be presented to supplement the basic financial statements. Such information, although not a part of the basic financial statements, is required by the Governmental Accounting Standards Board who considers it to be an essential part of financial reporting for placing the basic financial statements in an appropriate operational, economic, or historical context. We have applied certain limited procedures to the required supplementary information in accordance with auditing standards generally accepted in the United States of America, which consisted of inquiries of management about the methods of preparing the information and comparing the information for consistency with management’s responses to our inquiries, the basic financial statements, and other knowledge we obtained during our audit of the basic financial statements. We do not express an opinion or provide any assurance on the information because the limited procedures do not provide us with sufficient evidence to express an opinion or provide any assurance.
Other Information
Our audit was conducted for the purpose of forming opinions on the financial statements that collectively comprisethe Township of Tabernacle School District’s basic financial statements. The introductory section, combining statements and related major fund supporting statements and schedules, statistical section, and schedule of expenditures of federal programs are presented for purposes of additional analysis, as required by the Division of Administration and Finance, Department of Education, State of New Jersey, and are not a required part of the basic financial statements. The accompanying schedule of expenditures of state financial assistance, as required by State of New Jersey Circular 15-08-OMB, Single Audit Policy for Recipients of Federal Grants, State Grants and State Aid, is also presented for purposes of additional analysis and is not a required part of the basic financial statements.
The accompanying combining statements and related major fund supporting statements and schedules and schedules of expenditures of federal awards and state financial assistance are the responsibility of management and were derived from and relate directly to the underlying accounting and other records used to prepare the basic financial statements. Such information has been subjected to the auditing procedures applied in the audit of the basic financial statements and certain additional procedures, including comparing and reconciling such information directly to the underlying accounting and other records used to prepare the basic financial statements or to the basic financial statements themselves, and other additional procedures in accordance with auditing standards generally accepted in the United States of America. In our opinion, the accompanying combining statements and related major fund supporting statements and schedules and schedules of expenditures of federal awards and state financial assistance are fairly stated, in all material respects, in relation to the basic financial statements as a whole.
The introductory section and statistical section listed in the table of contents have not been subjected to the auditing procedures applied in the audit of the basic financial statements, and accordingly, we do not express an opinion or provide any assurance on them.
15

24750
Other Reporting Required by Government Auditing Standards
In accordance with Government Auditing Standards, we have also issued our report dated November 8, 2017 on our consideration of the Township of Tabernacle School District's internal control over financial reporting and on our tests of its compliance with certain provisions of laws, regulations, contracts, and grant agreements and other matters. The purpose of that report is to describe the scope of our testing of internal control over financial reporting and compliance and the results of that testing, and not to provide an opinion on internal control over financial reporting or on compliance. That report is an integral part of an audit performed in accordance with Government Auditing Standards in considering the Township of Tabernacle School District's internal control over financial reporting and compliance.
Respectfully submitted,
BOWMAN & COMPANY LLPCertified Public Accountants& Consultants
Daniel M. DiGangiCertified Public AccountantPublic School Accountant No. CS 002376
Voorhees, New JerseyNovember 8, 2017
16

Exhibit K-1
REPORT ON INTERNAL CONTROL OVER FINANCIAL REPORTING AND ON COMPLIANCE AND OTHER MATTERS BASED ON AN AUDIT OF FINANCIAL STATEMENTS PERFORMED IN
ACCORDANCE WITH GOVERNMENT AUDITING STANDARDS
INDEPENDENT AUDITOR’S REPORT
The Honorable President andMembers of the Board of EducationTownship of Tabernacle School DistrictCounty of BurlingtonTabernacle, New Jersey 08088
We have audited, in accordance with the auditing standards generally accepted in the United States of America,the standards applicable to financial statement audits contained in Government Auditing Standards, issued by the Comptroller General of the United States, and in compliance with audit requirements as prescribed by the Division of Administration and Finance, Department of Education, State of New Jersey, the financial statements of the governmental activities, the business-type activities, each major fund, and the aggregate remaining fund information of the Township of Tabernacle School District, in the County of Burlington, State of New Jersey, as of and for the fiscal year ended June 30, 2017, and the related notes to the financial statements, which collectively comprise the School District’s basic financial statements, and have issued our report thereon dated November 8, 2017.
Internal Control Over Financial Reporting
In planning and performing our audit of the financial statements, we considered the Township of TabernacleSchool District’s internal control over financial reporting (internal control) to determine the audit procedures that are appropriate in the circumstances for the purpose of expressing our opinions on the financial statements, but not for the purpose of expressing an opinion on the effectiveness of the School District’s internal control. Accordingly, we do not express an opinion on the effectiveness of the Township of Tabernacle School District’sinternal control.
A deficiency in internal control exists when the design or operation of a control does not allow management or employees, in the normal course of performing their assigned functions, to prevent, or detect and correct,misstatements on a timely basis. A material weakness is a deficiency, or combination of deficiencies, in internal control, such that there is a reasonable possibility that a material misstatement of the entity’s financial statements will not be prevented, or detected and corrected on a timely basis. A significant deficiency is a deficiency, or a combination of deficiencies, in internal control that is less severe than a material weakness, yet important enough to merit attention by those charged with governance.
Our consideration of internal control was for the limited purpose described in the first paragraph of this section and was not designed to identify all deficiencies in internal control that might be material weaknesses or significant deficiencies. Given these limitations, during our audit we did not identify any deficiencies in internal control that we consider to be material weaknesses. However, material weaknesses may exist that have not been identified.
17

24750 Exhibit K-1
Compliance and Other Matters
As part of obtaining reasonable assurance about whether the Township of Tabernacle School District's financial statements are free from material misstatement, we performed tests of its compliance with certain provisions of laws, regulations, contracts, and grant agreements, noncompliance with which could have a direct and material effect on the determination of financial statement amounts. However, providing an opinion on compliance with those provisions was not an objective of our audit, and accordingly, we do not express such an opinion. The results of our tests disclosed no instances of noncompliance or other matters that are required to be reported under Government Auditing Standards, and audit requirements as prescribed by the Division of Administration and Finance, Department of Education, State of New Jersey.
Purpose of this Report
The purpose of this report is solely to describe the scope of our testing of internal control and compliance and the results of that testing, and not to provide an opinion on the effectiveness of the entity’s internal control or on compliance. This report is an integral part of an audit performed in accordance with Government Auditing Standards and audit requirements as prescribed by the Division of Administration and Finance, Department of Education, State of New Jersey, and federal and state awarding agencies and pass-through entities, in considering the School District’s internal control and compliance. Accordingly, this communication is not suitable for any other purpose.
Respectfully submitted,
BOWMAN & COMPANY LLPCertified Public Accountants& Consultants
Daniel M. DiGangiCertified Public AccountantPublic School Accountant No. CS 002376
Voorhees, New JerseyNovember 8, 2017
18

REQUIRED SUPPLEMENTARY INFORMATIONPART I

TABERNACLE TOWNSHIP PUBLIC SCHOOL DISTRICTManagement’s Discussion and Analysis
For the Fiscal Year Ended June 30, 2017(Unaudited)
The management’s discussion and analysis of Tabernacle Township Public School District (School District) financial performance provides an overall review of the School District’s financial activities for the fiscal years ended June 30, 2017 and 2016. The intent of the discussion and analysis is to look at the School District’s financial performance and review the notes to the basic financial statements to enhance the understanding of the School District’s financial performance. It is recommended that the discussion and analysis be read in conjunction with a transmittal letter at the front of this financial report.
FINANCIAL HIGHLIGHTS
Financial Highlights for fiscal year 2017:
The assets of the Tabernacle Township Public School District exceeded its liabilities at the close of themost recent fiscal year by $6,628,007 (net position).
The School District’s total net position decreased by $286,796. This decrease is primarily attributable tothe Tabernacle Township Public School District’s increase in certain long-term liabilities.
As of the close of the current fiscal year, the School District’s governmental funds reported combinedending fund balances of $2,912,019, a decrease of $355,808 in comparison with the prior year.
At the end of the current fiscal year, unassigned fund balance for the general fund had a deficit of$130,493, which is a decrease of $127,471 in comparison with the prior year.
The Tabernacle Township Public School District’s total debt decreased by $719,172 as a result of debtand lease payments.
OVERVIEW OF THE FINANCIAL STATEMENTS
This annual report consists of three parts – management’s discussion and analysis (this section), the basic financial statements, and required supplementary information. The basic financial statements include two kinds of statements that present different views of the School District:
The first two statements are government-wide financial statements that provide both short-term and long-term information about the School District’s overall financial status.
The remaining statements are fund financial statements that focus on individual parts of the SchoolDistrict, reporting the School District’s operations in more detail than the district-wide statements.
Governmental funds statements tell how basic services like regular and special education were financedin the short term as well as what remains for future spending.
Proprietary funds statements offer short and long-term financial information about the activities the SchoolDistrict operates like businesses, such as food services.
Fiduciary funds statements provide information about the financial relationships in which the SchoolDistrict acts solely as a trustee or agent for the benefit of others.
The financial statements also include notes that explain some of the information in the statements and provide more detailed data. The statements are followed by a section of required supplementary information that further explains and supports the financial statements with a comparison of the School District’s budget for the year.
20

TABERNACLE TOWNSHIP PUBLIC SCHOOL DISTRICTManagement’s Discussion and Analysis
For the Fiscal Year Ended June 30, 2017(Unaudited) (Cont’d)
OVERVIEW OF THE FINANCIAL STATEMENTS (CONT’D)
Government-Wide Statements
The government-wide statements report information about the School District as a whole using accounting methods similar to those used by the private-sector companies. The statement of net position includes all of the School District’s assets and liabilities. All of the current year’s revenues and expenses are accounted for in the statement of activities regardless of when cash is received or paid.
The two government-wide statements report the School District’s net position and how they have changed. Net position is the difference between the School District’s assets and deferred outflows of resources and liabilitiesand deferred inflows of resources and is one way to measure the School District’s financial health or position. An increase or decrease in the School District’s net position is an indicator of whether its financial position is improving or deteriorating, respectively. To assess the overall health or position of the School District, you need to consider additional nonfinancial factors such as changes in the School District’s property tax base and the condition of school buildings and other facilities.
In the government-wide financial statements, the School District’s activities are divided in two categories:
Governmental activities – The basic services, such as instruction for regular and special education,maintenance and operations, transportation and administration are included as government activities.Property taxes, state aid and fund balance appropriated finance most of these activities.
Business-type activities – The School District charges fees to cover the costs of certain services such as foodservices.
Fund Financial Statements
The fund financial statements provide more detailed information about the School District’s funds, focusing on the significant funds, not the School District as a whole. Funds are used by the School District to keep track of specific sources of funding and spending on particular programs.
The School District has three kinds of funds:
Governmental funds – The School District’s basic services are included in governmental funds, which detailcash and other financial assets and also identify balances that remain at year-end. Governmental fundsstatements provide a short-term view to determine whether more or less financial resources can be spent insubsequent years.
Proprietary funds – These funds represent charges or fees for such activities as food services.
Fiduciary funds – The School District is the trustee for assets that belong to others. The student activitiesfunds which include clubs, classes, athletic and scholarship funds are maintained in this fund. The SchoolDistrict is responsible for ensuring that the assets reported in these funds are used only for their intendedpurposes. These funds are not included in the government-wide financial statements since the School Districtis not permitted to use these assets in the School District operation.
21

TABERNACLE TOWNSHIP PUBLIC SCHOOL DISTRICTManagement’s Discussion and Analysis
For the Fiscal Year Ended June 30, 2017(Unaudited) (Cont’d)
FINANCIAL ANALYSIS OF THE DISTRICT AS A WHOLE
Table 1 provides a summary of the School District’s net position for fiscal years 2017 and 2016.
June 30, 2017 June 30, 2016 Change % ChangeAssets:
Current and Other Assets 3,666,587$ 3,312,165$ 354,422$ 10.70%Capital Assets 13,407,734 13,732,184 (324,450) -2.36%
Total Assets 17,074,321 17,044,349 29,972 0.18%
Deferred Ouflows of Resources:Related to Pensions 1,716,604 761,810 954,794 125.33%Deferred Loss on Refunding 274,075 308,334 (34,259) -11.11%
Total Deferred Outflows of Resources 1,990,679 1,070,144 920,535 86.02%
Liabilities:Long-Term Liabilities 11,118,810 10,457,413 661,397 6.32%Other Liabilities 267,268 236,511 30,757 13.00%
Total Liabilities 11,386,078 10,693,924 692,154 6.47%
Deferred Inflows of Resources:Related to Taxes 675,265 675,265 100.00%Related to Pensions 375,650 505,767 (130,117) -25.73%
Total Deferred Inflows of Resources 1,050,915 505,767 545,148 107.79%
Net Position:Net Investment in Capital Assets 8,814,156 8,432,333 381,823 4.53%Restricted 2,955,892 3,486,925 (531,033) -15.23%Unrestricted (Deficit) (5,142,041) (5,004,455) (137,586) 2.75%
Total Net Position 6,628,007$ 6,914,803$ (286,796)$ -4.15%
TABLE 1Net Position
June 30, 2017 June 30, 2016 Change % Change
Deferred Outflows Related to Pensions 1,716,604$ 761,810$ 954,794$ 125.33%Less: Net Pension Liability (5,831,108) (4,471,678) (1,359,430) 30.40%Less: Deferred Inflows Related to Pensions (375,650) (505,767) 130,117 -25.73%
(4,490,154)$ (4,215,635)$ (274,519)$ 6.51%
TABLE 2
Statement of Net Position - Effect of Pension Related Items
22

TABERNACLE TOWNSHIP PUBLIC SCHOOL DISTRICTManagement’s Discussion and Analysis
For the Fiscal Year Ended June 30, 2017(Unaudited) (Cont’d)
FINANCIAL ANALYSIS OF THE DISTRICT AS A WHOLE (CONT’D)
Table 3 reflects changes in net position for fiscal years 2017 and 2016.
Revenues: June 30, 2017 June 30, 2016 Change % Change
Program Revenues:Charges for Services 289,180$ 311,380$ (22,200)$ -7.13%Operating Grants and Contributions 4,658,988 1,761,635 2,897,353 164.47%
General Revenues:Property Taxes 8,103,180 7,842,111 261,069 3.33%Grants and Contributions 5,744,399 5,826,736 (82,337) -1.41%Other 95,786 79,220 16,566 20.91%
Total Revenues 18,891,533 15,821,082 3,070,451 19.41%
Expenses:
Instruction:Regular 3,966,302 3,757,047 209,255 5.57%Special Education 1,327,326 1,400,173 (72,847) -5.20%Other Instruction 257,727 271,795 (14,068) -5.18%Other Special Instruction 61,813 114,835 (53,022) -46.17%Tuition 371,920 371,920 100.00%
Student Services:Student and Instruction Related 1,690,711 1,542,127 148,584 9.64%School Administrative Services 364,311 365,927 (1,616) -0.44%Other Administrative Services 759,712 673,390 86,322 12.82%Plant Operations and Maintenance 1,470,680 1,313,388 157,293 11.98%Pupil Transportation 535,509 489,603 45,906 9.38%Allocated and Unallocated Benefits 6,565,761 2,799,582 3,766,179 134.53%Reimbursed TPAF Pension and Social Security 919,659 1,386,351 (466,692) -33.66%Interest on Long-Term Debt 161,814 231,378 (69,564) -30.07%Unallocated Depreciation 472,915 488,178 (15,263) 100.00%
Food Service 252,169 256,842 (4,673) -1.82%
Total Expenses 19,178,329 15,090,616 4,087,713 27.09%
Increase (Decrease) in Net Position (286,796) 730,466 (1,017,262) (1.39)
Beginning Net Position 6,914,803 6,184,337 730,466 11.81%
Ending Net Position 6,628,007$ 6,914,803$ (286,796)$ -4.15%
TABLE 3
Change in Net Position
23

TABERNACLE TOWNSHIP PUBLIC SCHOOL DISTRICTManagement’s Discussion and Analysis
For the Fiscal Year Ended June 30, 2017(Unaudited) (Cont’d)
FINANCIAL ANALYSIS OF THE DISTRICT AS A WHOLE (CONT’D)
Governmental Activities
In 2016-2017, Governmental Activities Revenues were $18,645,671 or 98.7% of total revenues.
In 2015-2016, Governmental Activities Revenues were $15,558,981 or 98.3% of total revenues.
In 2016-2017, General Revenues - Property Taxes of $8,103,180 made up 43.5%, and General Revenues – Grants and Contributions not Restricted to Specific Programs of $5,744,399 made up 30.8% of Governmental Activities Revenues.
In 2015-2016, General Revenues - Property Taxes of $7,842,111 made up 50.4%, and General Revenues – Grants and Contributions not Restricted to Specific Programs of $5,826,736 made up 37.5% of Governmental Activities Revenues.
In 2016-2017, the School District’s Governmental Activities expenditures increased by $4,092,386 or 27.6%.
Business-Type Activities
In 2016-2017, Business-Type Activities Revenues were $245,862 or 1.3% of total revenues. In 2015-2016 Business-Type Activities Revenues were $262,102 or 1.7% of total revenues.
Charges for Services for Business-Type Activities were $179,437 in 2016-2017 compared to $192,093 in 2015-2016, a 6.6% decrease.
Operating Grants and Contributions for Business-Type Activities were $66,425 in 2016-2017 compared to $70,008 in 2015-2016, a 5.1% decrease.
Expenses for Business-Type Activities were $252,169 in 2016-2017 compared to $256,842 in 2015-2016, a 1.8%decrease.
General Fund Budgeting Highlights
The final budgetary basis revenue estimate was $13,085,507, which was equal to the original budget.
The 2016-2017 General Fund Tax Levy was $7,380,663, an increase of $272,252 or 3.8% from the 2015-2016General Fund Tax Levy of $7,108,411.
During fiscal year 2017, the School District budgeted $7,380,663 for property taxes (local tax levy) and $5,530,344 for state aid revenues.
The School District also received $388,733 and $1,166,230 reimbursed T.P.A.F. Social Security Aid and On-behalf T.P.A.F. Medical, Non-Contributory Insurance, Long-term Disability Insurance and Pension Contributions, respectively. The Tabernacle Township Public School District’s expenditures also include the reimbursed TPAF Social Security Aid and On-behalf T.P.A.F. Medical, Non-Contributory Insurance, Long-term Disability Insurance and Pension Contributions of $388,733 and $1,166,230 respectively.
The final budgetary basis expenditure appropriation estimate was $14,105,526, which was $164,264 more than the original budget.
24

TABERNACLE TOWNSHIP PUBLIC SCHOOL DISTRICTManagement’s Discussion and Analysis
For the Fiscal Year Ended June 30, 2017(Unaudited) (Cont’d)
FINANCIAL ANALYSIS OF THE DISTRICT AS A WHOLE (CONT’D)
Financial Analysis of the Government’s Funds
Governmental Funds - As of the end of the current fiscal year, the School District’s governmental funds reported combining ending fund balances of $2,912,019, a decrease of $355,808 in comparison with the prior year.
Of the combined ending fund balances of $2,912,019, $130,493 constitutes unassigned fund balance deficits. The remainder of fund balance of $3,042,512 is restricted or assigned for various purposes.
Proprietary Funds - As of the end of the current fiscal year, the School District’s proprietary fund had $41,249 in unrestricted net position.
CAPITAL ASSETS
The Tabernacle Township Public School District’s investment in capital assets for its governmental and business-type activities as of June 30, 2017 amounts to $13,407,734 (net of accumulated depreciation). This investment in capital assets includes land improvements, buildings and improvements, and equipment. There was a net decrease in the Tabernacle Township Public School District’s investment in capital assets for the current fiscal year of 2.4%. The net decrease was the result of depreciation. Table 4 reflects the capital assets.
TABLE 4
Capital Assets
Capital Assets (Net of Depreciation): June 30, 2017 June 30, 2016
Land Improvements 18,974$ 23,328$ Building and Improvements 12,724,901 13,174,359 Furniture, Fixtures and Equipment 663,859 534,497
Total Capital Assets 13,407,734$ 13,732,184$
Depreciation expense was $557,726 for fiscal year ended 2017 and $573,348 for fiscal year ended 2016.
DEBT ADMINISTRATION
Long-term Debt - At the end of the current fiscal year, the Tabernacle Township Public School District had total bonded debt outstanding of $4,565,000. The entire Tabernacle Township Public School District’s bonded debt is governmental as opposed to business-type. The 2018 adopted budget has an appropriation of $685,000 representing the payment of the annual principal. The 2013 refunding bonds will mature on September 1, 2024.
25

TABERNACLE TOWNSHIP PUBLIC SCHOOL DISTRICTManagement’s Discussion and Analysis
For the Fiscal Year Ended June 30, 2017(Unaudited) (Cont’d)
FACTORS ON THE DISTRICT’S FUTURE
For the 2016-17 school year, the Tabernacle Township Public School District was able to sustain its budget through the township tax levy, federal aid, state aid and miscellaneous revenue sources. 42.9 percent of total revenue is from local tax levy and 55.1 percent of the Tabernacle Township Public School District's revenue is from federal and state aid (restricted and not restricted).
In conclusion, the Tabernacle Township Board of Education and Administration have committed themselves to financial excellence for many years. Additionally, the School District’s system for financial planning, budgeting, and internal financial controls are well regarded. The School District will continue with sound fiscal management to meet the challenge of the future.
CONTACTING THE DISTRICT’S FINANCIAL MANAGEMENT
This financial report is designed to provide a general overview of the Tabernacle Township Public School District’s finances for all those with an interest in the government’s finances. Questions concerning any of the information provided in this report or requests for additional financial information should be addressed to Jessica DeWysockie, Business Administrator / Board Secretary at the Tabernacle Township School District, 132 New Road, Tabernacle, New Jersey 08088.
26

BASIC FINANCIAL STATEMENTS

GOVERNMENT-WIDE FINANCIAL STATEMENTS

24750 Exhibit A-1TABERNACLE TOWNSHIP SCHOOL DISTRICT
Statement of Net Position
Governmental Business-TypeActivities Activities Total
ASSETS:Cash and Cash Equivalents 3,201,808.92$ 29,607.01$ 3,231,415.93$ Receivables, net 319,123.58 10,632.56 329,756.14Restricted Cash and Cash Equivalents 99,076.43 99,076.43Inventory 6,337.67 6,337.67Capital Assets, net (Note 6) 13,348,311.01 59,423.44 13,407,734.45
Total Assets 16,968,319.94 106,000.68 17,074,320.62
DEFERRED OUTFLOWS OF RESOURCES:Related to Pensions (Note 9) 1,716,604.00 1,716,604.00Deferred Loss on Refunding 274,074.52 274,074.52
Total Deferred Outflows 1,990,678.52 - 1,990,678.52
LIABILITIES:Accounts Payable: Related to Pensions 177,924.00 177,924.00 Other 26,687.98 26,687.98 Accrued Interest 51,290.77 51,290.77 Unearned Revenue 6,036.71 5,328.24 11,364.95 Noncurrent Liabilities (Note 7): Due within One Year 829,831.92 829,831.92 Due beyond One Year 10,288,977.56 10,288,977.56
Total Liabilities 11,380,748.94 5,328.24 11,386,077.18
DEFERRED INFLOWS OF RESOURCESRelated to Taxes 675,265.00 675,265.00Related to Pensions 375,650.00 375,650.00
Total Deferred Inflows 1,050,915.00 - 1,050,915.00
NET POSITION:Net Investment in Capital Assets 8,754,732.81 59,423.44 8,814,156.25Restricted for: Capital Projects 1,282,555.99 1,282,555.99 Other Purposes 1,673,335.93 1,673,335.93Unrestricted (Deficit) (5,183,290.21) 41,249.00 (5,142,041.21)
Total Net Position 6,527,334.52$ 100,672.44$ 6,628,006.96$
The accompanying Notes to Financial Statements are an integral part of this statement.
June 30, 2017
29

24750
Ex
hib
it A
-2T
AB
ER
NA
CL
E T
OW
NS
HIP
SC
HO
OL
DIS
TR
ICT
Stat
emen
t of A
ctiv
ities
Prog
ram
Rev
enue
sN
et (E
xpen
se) R
even
ue a
nd C
hang
es in
Net
Pos
ition
Ope
ratin
gC
apita
lC
harg
es fo
rG
rant
s an
dG
rant
s an
dG
over
nmen
tal
Busi
ness
-Typ
eFu
nctio
ns /
Prog
ram
sEx
pens
esSe
rvic
esC
ontri
butio
nsC
ontri
butio
nsAc
tiviti
esAc
tiviti
esTo
tal
Gov
ernm
enta
l Act
iviti
es:
In
stru
ctio
n:
R
egul
ar3,
966,
302.
04$
(3,9
66,3
02.0
4)$
(3,9
66,3
02.0
4)$
Sp
ecia
l Edu
catio
n1,
327,
326.
4210
9,74
2.79
$
66,9
45.3
8$
(1
,150
,638
.25)
(1
,150
,638
.25)
Oth
er S
peci
al In
stru
ctio
n25
7,72
6.47
(257
,726
.47)
(257
,726
.47)
Oth
er In
stru
ctio
n61
,812
.56
(61,
812.
56)
(6
1,81
2.56
)
Tu
ition
371,
920.
4517
9,35
7.00
(192
,563
.45)
(192
,563
.45)
Su
ppor
t Ser
vice
s:
St
uden
t and
Inst
ruct
ion
Rel
ated
Ser
vice
s1,
690,
710.
8313
,430
.00
(1,6
77,2
80.8
3)
(1,6
77,2
80.8
3)
Sc
hool
Adm
inis
trativ
e Se
rvic
es36
4,31
0.70
(364
,310
.70)
(364
,310
.70)
Oth
er A
dmin
istra
tive
Serv
ices
759,
712.
49(7
59,7
12.4
9)
(7
59,7
12.4
9)
Pl
ant O
pera
tions
and
Mai
nten
ance
1,47
0,67
9.98
(1,4
70,6
79.9
8)
(1,4
70,6
79.9
8)
Pu
pil T
rans
porta
tion
535,
509.
06(5
35,5
09.0
6)
(5
35,5
09.0
6)
U
nallo
cate
d Be
nefit
s6,
565,
760.
813,
395,
516.
00(3
,170
,244
.81)
(3
,170
,244
.81)
Rei
mbu
rsed
TPA
F Pe
nsio
n an
d So
cial
Sec
urity
919,
658.
5291
9,65
8.52
Inte
rest
on
Long
-Ter
m D
ebt
161,
814.
0017
,655
.93
(144
,158
.07)
(144
,158
.07)
Una
lloca
ted
Dep
reci
atio
n47
2,91
5.43
(472
,915
.43)
(472
,915
.43)
Tota
l Gov
ernm
enta
l Act
iviti
es18
,926
,159
.76
10
9,74
2.79
4,59
2,56
2.83
-(1
4,22
3,85
4.14
)
-
(14,
223,
854.
14)
Busi
ness
-Typ
e Ac
tiviti
es:
Fo
od S
ervi
ce25
2,16
8.83
179,
436.
98
66
,425
.18
--
(6,3
06.6
7)$
(6,3
06.6
7)
Tota
l Gov
ernm
ent
19,1
78,3
28.5
9$
289,
179.
77$
4,
658,
988.
01$
-
(14,
223,
854.
14)
(6,3
06.6
7)(1
4,23
0,16
0.81
)
Gen
eral
Rev
enue
s:
Taxe
s:
Pr
oper
ty T
axes
, Lev
ied
for G
ener
al P
urpo
ses,
net
7,38
0,66
3.00
7,
380,
663.
00
Ta
xes
Levi
ed fo
r Deb
t Ser
vice
722,
517.
0072
2,51
7.00
Fe
dera
l and
Sta
te A
id N
ot R
estri
cted
5,
669,
334.
005,
669,
334.
00
Fede
ral a
nd S
tate
Aid
Res
trict
ed75
,065
.07
75,0
65.0
7
Mis
cella
neou
s In
com
e95
,786
.13
95,7
86.1
3
Tota
l Gen
eral
Rev
enue
s13
,943
,365
.20
-13
,943
,365
.20
Cha
nge
in N
et P
ositi
on(2
80,4
88.9
4)(6
,306
.67)
(286
,795
.61)
Net
Pos
ition
-- J
uly
16,
807,
823.
4610
6,97
9.11
6,91
4,80
2.57
Net
Pos
ition
-- J
une
306,
527,
334.
52$
10
0,67
2.44
$
6,
628,
006.
96$
The
acco
mpa
nyin
g N
otes
to F
inan
cial
Sta
tem
ents
are
an
inte
gral
par
t of t
his
stat
emen
t.
For t
he F
isca
l Yea
r End
ed J
une
30, 2
017
30

FUND FINANCIAL STATEMENTS

24750 Exhibit B-1
TABERNACLE TOWNSHIP SCHOOL DISTRICT
Governmental FundsBalance SheetJune 30, 2017
Special Capital Debt TotalGeneral Revenue Projects Service Governmental
Fund Fund Fund Fund FundsASSETS:Cash and Cash Equivalents 3,201,808.92$ 99,076.43$ 3,300,885.35$ Receivables, net: Interfunds Receivable: Special Revenue Fund 62,775.41 62,775.41 Payroll 1,670.00 1,670.00 Unemployment 1.00 1.00 Receivables from Other Governments: State of NJ -- Non-Public Transportation Aid 2,849.00 2,849.00 State of NJ -- FICA 28,741.63 28,741.63 State of NJ -- Extraordinary Aid 183,597.00 183,597.00 Federal 62,407.09$ 62,407.09 Other Receivables 32,857.86 7,000.00 39,857.86
Total Assets 3,514,300.82$ 69,407.09$ - 99,076.43$ 3,682,784.34$
LIABILITIES AND FUND BALANCES:Liabilities: Accounts Payable 26,093.01$ 594.97$ 26,687.98$ Unearned Revenue 6,036.71 6,036.71 Interfunds Payable: General Fund 62,775.41 62,775.41
Total Liabilities 26,093.01 69,407.09 - - 95,500.10
DEFERRED INFLOWS OF RESOURCESRelated to Taxes 615,055.25 - - 60,209.75$ 675,265.00
Fund Balances: Restricted: Capital Reserve 1,282,555.99$ 1,282,555.99 Emergency Reserve 63.11 63.11 Maintenance Reserve 131,416.35 131,416.35 Excess Surplus 487,612.66 487,612.66 Excess Surplus Designated for Subsequent Year's Expenditures 1,054,243.81 1,054,243.81 Debt Service 38,866.68 38,866.68 Assigned: Other Purposes 44,070.77 44,070.77 Subsequent Year's Expenditures 3,683.19 3,683.19 Unassigned (Deficit) (130,493.32) (130,493.32)
Total Fund Balances 2,873,152.56 - - 38,866.68 2,912,019.24
Total Liabilities and Fund Balances 3,514,300.82$ 69,407.09$ - 99,076.43$
Amounts reported for governmental activities in the statement of net position (A-1) are different because: Capital assets used in governmental activities are not financial resources and therefore are not reported in the funds. The cost of the assets is $26,238,816.70 and the accumulated depreciation is $12,890,505.69. 13,348,311.01 Long-term liabilities, including bonds payable, are not due and payable in the current period and are not reported as liabilities in the funds. (11,118,809.48) Deferred loss on refundings are not financial resources and therefore are not reported in the funds. 274,074.52 Accrued interest on bonds payable and capital leases is not due and payable in the current period and therefore are not reported as liabilities in the funds. (51,290.77) Accounts Payable related to the April 1, 2018 Required PERS pension contribution that is not to be liquidated with current financial resources. (177,924.00) Deferred Outflows of Resources - Related to Pensions 1,716,604.00 Deferred Inflows of Resources - Related to Pensions (375,650.00)
Net position of governmental activities 6,527,334.52$
The accompanying Notes to Financial Statements are an integral part of this statement.
32

24750
Ex
hib
it B
-2
TA
BE
RN
AC
LE
TO
WN
SH
IP S
CH
OO
L D
IST
RIC
T
Gov
ernm
enta
l Fun
dsSt
atem
ent o
f Rev
enue
s, E
xpen
ditu
res,
and
Cha
nges
in F
und
Bala
nces
For t
he F
isca
l Yea
r End
ed J
une
30, 2
017
Spec
ial
Cap
ital
Deb
tTo
tal
Gen
eral
Rev
enue
Proj
ects
Serv
ice
Gov
ernm
enta
lFu
ndFu
ndFu
ndFu
ndFu
nds
REV
ENU
ES:
Loca
l Tax
Lev
y7,
380,
663.
00$
72
2,51
7.00
$
8,
103,
180.
00$
Tu
ition
109,
742.
7910
9,74
2.79
Stat
e So
urce
s7,
224,
296.
5292
,721
.00
7,31
7,01
7.52
Fede
ral S
ourc
es26
4,46
9.09
$
26
4,46
9.09
Mis
cella
neou
s95
,786
.13
6,96
3.29
102,
749.
42
Tota
l Rev
enue
s14
,810
,488
.44
271,
432.
38-
815,
238.
0015
,897
,158
.82
EXPE
ND
ITU
RES
:
Reg
ular
Inst
ruct
ion
3,92
7,63
8.11
3,92
7,63
8.11
Sp
ecia
l Edu
catio
n In
stru
ctio
n1,
249,
756.
1966
,945
.38
1,31
6,70
1.57
O
ther
Spe
cial
Inst
ruct
ion
257,
726.
4725
7,72
6.47
O
ther
Inst
ruct
ion
61,8
12.5
661
,812
.56
Tu
ition
192,
563.
4517
9,35
7.00
371,
920.
45
Supp
ort S
ervi
ces
and
Und
istri
bute
d C
osts
:
St
uden
t and
Inst
ruct
ion
Rel
ated
Ser
vice
s1,
677,
280.
8313
,430
.00
1,69
0,71
0.83
Scho
ol A
dmin
istra
tive
Serv
ices
364,
310.
7036
4,31
0.70
Oth
er A
dmin
istra
tive
Serv
ices
728,
149.
2772
8,14
9.27
Plan
t Ope
ratio
ns a
nd M
aint
enan
ce1,
466,
880.
141,
466,
880.
14
Pu
pil T
rans
porta
tion
559,
231.
0555
9,23
1.05
Una
lloca
ted
Bene
fits
2,89
2,70
9.81
11,7
00.0
02,
904,
409.
81
R
eim
burs
ed T
PAF
Pens
ion
and
Soci
al S
ecur
ity1,
554,
962.
521,
554,
962.
52D
ebt S
ervi
ce:
Pr
inci
pal
660,
000.
0066
0,00
0.00
In
tere
st15
5,23
7.50
155,
237.
50C
apita
l Out
lay
233,
275.
6023
3,27
5.60
Tota
l Exp
endi
ture
s15
,166
,296
.70
271,
432.
38-
815,
237.
5016
,252
,966
.58
Exce
ss (D
efic
ienc
y) o
f Rev
enue
s
over
Exp
endi
ture
s(3
55,8
08.2
6)-
-0.
50(3
55,8
07.7
6)
OTH
ER F
INAN
CIN
G S
OU
RC
ES (U
SES)
: T
rans
fers
To
and
From
Cap
ital R
eser
ve17
9,81
5.50
-
(179
,815
.50)
$
--
Net
Cha
nge
in F
und
Bala
nces
(1
75,9
92.7
6)-
(179
,815
.50)
0.50
(355
,807
.76)
Fund
Bal
ance
(Def
icit)
-- Ju
ly 1
3,04
9,14
5.32
-17
9,81
5.50
38,8
66.1
83,
267,
827.
00
Fund
Bal
ance
(Def
icit)
-- Ju
ne 3
02,
873,
152.
56$
-
-38
,866
.68
$
2,
912,
019.
24$
The
acco
mpa
nyin
g N
otes
to F
inan
cial
Sta
tem
ents
are
an
inte
gral
par
t of t
his
stat
emen
t.
33

24750 Exhibit B-3TABERNACLE TOWNSHIP SCHOOL DISTRICT
Reconciliation of the Statement of Revenues, Expenditures,and Changes in Fund Balances of Governmental Funds
to the Statement of ActivitiesFor the Fiscal Year Ended June 30, 2017
Total Net Change in Fund Balances - Governmental Funds (355,807.76)$
Amounts reported for governmental activities in the statement of activities (A-2) are different because:
Capital outlays are reported in governmental funds as expenditures. However, in the statement of activities, the cost of those assets is allocated over their estimated useful lives as depreciation expense. This is the amount by which capital outlays exceeded depreciation in the period. Depreciation Expense (550,517.58)$ Capital Outlays 233,275.60
(317,241.98) Repayment of bond principal is an expenditure in the governmental funds, but the repayment reduces long-term liabilities in the statement of net position and is not reported in the statement of activities.
660,000.00 Governmental funds report the effect of premiums, discounts, and similar items when debt is first issued, whereas these amounts are deferred and amortized in the statement of activities. This amount is the net effect of the difference in the treatment of the long-term debt related items. Amortization of Loss on Early Retirement of Debt (34,259.32) Amortization of Bond Sale Premiums 21,360.90
Repayment of capital leases is an expenditure in the governmental funds, but the repayment reduces long-term liabilities in the statement of net position and is not reported in the statement of activities. 59,171.69
In the statement of activities, interest on long-term debt in the statement of activities is accrued, regardless of when due. In the governmental funds, interest is reported when due. The decrease in accrued interest is an addition in the reconciliation. (+) 6,321.92
In the statement of activities, certain operating expenses, e.g., compensated absences (vacations) are measured by the amounts earned during the year. In the governmental funds, however, expenditures for these items are reported in the amount of financial resources used (paid). When the earned amount exceeds the paid amount, the difference is a reduction in the reconciliation (-);when the paid amount exceeds the earned amount the difference is an addition to the reconciliation (+). (42,499.39)
Governmental funds report School District pension contributions as expenditures. However in the statement of activities, the cost of pension benefits earned is reported as pension expense. This is the amount by which the pension benefits earned exceeded School District's pension contributions in the current period. (277,535.00)
Change in Net Position of Governmental Activities (280,488.94)$
The accompanying Notes to Financial Statements are an integral part of this statement.
34

24750 Exhibit B-4TABERNACLE TOWNSHIP SCHOOL DISTRICT
Proprietary FundBusiness Type Activities - Enterprise Fund
Statement of Net PositionJune 30, 2017
FoodService
ASSETS:Current Assets: Cash and Cash Equivalents 29,607.01$ Accounts Receivable: State 395.58 Federal 8,731.52 Other 1,505.46 Inventories 6,337.67
Total Current Assets 46,577.24
Noncurrent Assets: Capital Assets: Furniture, Fixtures and Equipment 172,764.50 Less Accumulated Depreciation (113,341.06)
Total Noncurrent Assets 59,423.44
Total Assets 106,000.68
LIABILITIES:Current Liabilities: Unearned Revenue 5,328.24
NET POSITION: Net Investment in Capital Assets 59,423.44 Unrestricted 41,249.00
Total Net Position 100,672.44$
The accompanying Notes to Financial Statements are an integral part of this statement.
35

24750 Exhibit B-5TABERNACLE TOWNSHIP SCHOOL DISTRICT
Proprietary FundBusiness Type Activities - Enterprise Fund
Statement of Revenues, Expenses and Changes in Fund Net PositionFor the Fiscal Year Ended June 30, 2017
FoodService
OPERATING REVENUES:Charges for Services: Daily Sales - Reimbursable Programs: School Lunch Program 96,344.80$ Daily Sales - Non-Reimbursable Programs 80,512.64 Special Functions 2,579.54
Total Operating Revenues 179,436.98
OPERATING EXPENSES:Salaries 92,146.26Employee Benefits 17,628.66General Supplies 6,197.35Depreciation 7,207.99Administrative Fee 24,868.20Other Purchased Services 9,153.54Cost of Sales - Reimbursable Programs 62,871.61Cost of Sales - Non-Reimbursable Programs 32,095.22
Total Operating Expenses 252,168.83
Operating Income / (Loss) (72,731.85)
NONOPERATING REVENUES (EXPENSES):State Sources: State School Lunch Program 2,015.65Federal Sources: National School Lunch Program 46,309.52 Food Distribution Program 18,100.01
Total Nonoperating Revenues (Expenses) 66,425.18
Change in Net Position (6,306.67)
Net Position -- July 1 106,979.11
Net Position -- June 30 100,672.44$
The accompanying Notes to Financial Statements are an integral part of this statement.
36

24750 Exhibit B-6TABERNACLE TOWNSHIP SCHOOL DISTRICT
Proprietary FundBusiness Type Activities - Enterprise Fund
Statement of Cash FlowsFor the Fiscal Year Ended June 30, 2017
FoodService
CASH FLOWS FROM OPERATING ACTIVITIES:Receipts from Customers 178,078.02$ Payments to Employees (92,146.26) Payments for Employee Benefits (17,628.66) Payments for Supplies and Services (132,484.66)
Net Cash Provided by (used for) Operating Activities (64,181.56)
CASH FLOWS FROM NON-CAPITAL FINANCING ACTIVITIES:State Sources 1,811.36Federal Sources 61,173.88
Net Cash Provided by (used for) Non-Capital Financing Activities 62,985.24
CASH FLOWS FROM CAPITAL AND RELATED FINANCING ACTIVITIES:Purchases of Capital Assets -
CASH FLOWS FROM INVESTING ACTIVITIES:Interest Revenue -
Net Increase (Decrease) in Cash and Cash Equivalents (1,196.32)
Cash and Cash Equivalents -- July 1 30,803.33
Cash and Equivalents -- June 30 29,607.01$
Reconciliation of Operating Income (Loss) to Net Cash Provided (Used) by Operating Activities: Operating Income (Loss) (72,731.85)$ Adjustments to Reconcile Operating Income (Loss) to Net Cash Provided by (used for) Operating Activities: Depreciation and Net Amortization 7,207.99 (Increase) Decrease in Accounts Receivable (1,364.48) (Increase) Decrease in Inventories 2,701.26 Increase (Decrease) in Unearned Revenue 5.52
Total Adjustments 8,550.29
Net Cash Provided by (used for) Operating Activities (64,181.56)$
The accompanying Notes to Financial Statements are an integral part of this statement.
37

24750 Exhibit B-7TABERNACLE TOWNSHIP SCHOOL DISTRICT
Fiduciary FundsCombining Statement of Fiduciary Net Position
June 30, 2017
Private Purpose Trust Funds Agency Funds
UnemploymentScholarship Compensation Student
Trust Trust Activity Payroll Total
ASSETS:Cash and Cash Equivalents 10,344.96$ 96,545.38$ 38,216.86$ 24,675.93$ 169,783.13$ Accounts Receivable: Interfund Accounts Receivable: Due Unemployment Fund 5,000.55 5,000.55
Total Assets 10,344.96 96,545.38 38,216.86$ 29,676.48$ 174,783.68
LIABILITIES:Accounts Payable 6.30 6.30Interfund Accounts Payable: Due General Fund 1.00 1,670.00$ 1,671.00 Due Payroll Fund 5,000.55 5,000.55Payable to Student Groups 38,216.86$ 38,216.86Payroll Deductions and Withholdings 28,006.48 28,006.48
Total Liabilities - 5,007.85 38,216.86$ 29,676.48$ 72,901.19
NET POSITION:Held in Trust for Unemployment Claims and Other Purposes 10,344.96$ 91,537.53$ 101,882.49$
The accompanying Notes to Financial Statements are an integral part of this statement.
38

24750 Exhibit B-8TABERNACLE TOWNSHIP SCHOOL DISTRICT
Fiduciary FundsStatement of Changes in Fiduciary Net Position
For the Fiscal Year Ended June 30, 2017
UnemploymentScholarship Compensation
Trust Trust
ADDITIONS:Contributions and Donations from Payroll Deductions Withheld 13,392.79$ Scholarship Donations 1,100.00$
Total Additions 1,100.00 13,392.79
DEDUCTIONS:Scholarship Awards 1,500.00Unemployment Claims 141.26
Total Deductions 1,500.00 141.26
Change in Net Position (400.00) 13,251.53
Net Position -- July 1 10,744.96 78,286.00
Net Position -- June 30 10,344.96$ 91,537.53$
The accompanying Notes to Financial Statements are an integral part of this statement.
Private Purpose Trust Funds
39

24750
TOWNSHIP OF TABERNACLE SCHOOL DISTRICTNotes to Financial Statements
For the Fiscal Year Ended June 30, 2017
Note 1: SUMMARY OF SIGNIFICANT ACCOUNTING POLICIES
The financial statements of the Township of Tabernacle School District (the “School District”) have been prepared to conform with accounting principles generally accepted in the United States of America (“GAAP”) as applied to governmental units. The Governmental Accounting Standards Board (“GASB”) is the accepted standard setting body for establishing governmental accounting and financial reporting principles. The following is a summary of the more significant of these policies.
Description of the Financial Reporting Entity
The School District is a Type II district located in the County of Burlington, State of New Jersey. As a Type II district, the School District functions independently through a Board of Education (the “Board”). The Board is comprised of nine members elected to three-year terms. These terms are staggered so that three member's terms expire each year. The Superintendent is appointed by the Board to act as executive officer of the School District. The purpose of the School District is to educate students in grades Kindergarten through eight at its two schools. The School District has an approximate enrollment at June 30, 2017 of 707.
The primary criterion for including activities within the School District's reporting entity, as set forth in Section 2100 of the Governmental Accounting Standards Board Codification of Governmental Accounting and Financial Reporting Standards, is the degree of oversight responsibility maintained by the School District. Oversight responsibility includes financial interdependency, selection of governing authority, designation of management, ability to significantly influence operations and accountability for fiscal matters. The combined financial statements include all funds of the School District over which the Board exercises operating control.
Component Units
In evaluating how to define the School District for financial reporting purposes, management has considered all potential component units. The decision to include any potential component units in the financial reporting entity was made by applying the criteria set forth in GASB Statements No. 14, The Financial Reporting Entity, as amended by GASB Statement No. 39, Determining Whether Certain Organizations are Component Units, GASB Statement No. 61, The Financial Reporting Entity: Omnibus - an amendment of GASB Statements No. 14 and No. 34, and GASB Statement No. 80, Blending Requirements for Certain Component Units – an amendment of GASB Statement No. 14. Blended component units, although legally separate entities, are in-substance part of the government'soperations. Each discretely presented component unit is reported in a separate column in the government-wide financial statements to emphasize that it is legally separate from the government.
The basic-but not the only-criterion for including a potential component unit within the reporting entity is the governing body's ability to exercise oversight responsibility. The most significant manifestation of this ability is financial interdependency. Other manifestations of the ability to exercise oversight responsibility include, but are not limited to, the selection of governing authority, the designation of management, the ability to significantly influence operations, and accountability for fiscal matters. A second criterion used in evaluating potential component units is the scope of public service. Application of this criterion involves considering whether the activity benefits the government and / or its citizens.
A third criterion used to evaluate potential component units for inclusion or exclusion from the reporting entity is the existence of special financing relationships, regardless of whether the government is able to exercise oversight responsibilities. Finally, the nature and significance of a potential component unit to the primary government could warrant its inclusion within the reporting entity.
40

24750 Notes to Financial Statements (Cont'd)
Note 1: SUMMARY OF SIGNIFICANT ACCOUNTING POLICIES (CONT'D)
Component Units (Cont’d)
Based upon the application of these criteria, the School District has no component units.
Government-wide and Fund Financial Statements
The School District’s basic financial statements consist of government-wide statements, and fund financial statements which provide a more detailed level of financial information.
The government-wide financial statements (i.e., the statement of net position and the statement of activities) report information on all of the nonfiduciary activities of the government. For the most part, the effect of interfund activity has been removed from these statements. Governmental activities, which normally are supported by property taxes and intergovernmental revenues, are reported separately from business-type activities, which rely to a significant extent on fees and charges for support.
The statement of activities demonstrates the degree to which the direct expenses of a given function or segment is offset by program revenues. Direct expenses are those that are specifically associated with a service, program, or department and, therefore, clearly identifiable to a particular function. It is the policy of the School District to not allocate indirect expenses to functions in the statement of activities. Program revenues include (1) charges to customers or applicants who purchase, use, or directly benefit from goods, services, or privileges provided by a given function or segment and (2) grants and contributions that are restricted to meeting the operational or capital requirements of a particular function or segment. Property taxes and other items not properly included among program revenues are reported instead as general revenues.
In regards to the fund financial statements, the School District segregates transactions related to certain functions or activities in separate funds in order to aid financial management and to demonstrate legal compliance. A fund is defined as a fiscal and accounting entity with a self-balancing set of accounts. Fund financial statements report detailed information about the School District. The focus of governmental fund financial statements is on major funds rather than reporting funds by type. Each major fund is presented in a single column. Fiduciary funds are reported by fund type.
Measurement Focus, Basis of Accounting and Financial Statement Presentation
The government-wide financial statements are reported using the economic resources measurement focus and the accrual basis of accounting, as are the proprietary fund and fiduciary fund financialstatements. Revenues are recorded when earned and expenses are recorded when a liability is incurred, regardless of the timing of related cash flows. Grants and similar items are recognized as revenue as soon as all eligibility requirements imposed by the provider have been met. Property taxes are recognized as revenues in the year for which they are levied. The Burlington County Board of Taxation is responsible for the assessment of properties, and the respective municipal tax collector is responsible for the collection of property taxes. Assessments are certified and property taxes are levied on January 1. Property tax payments are due February 1, May 1, August 1 and November 1. Unpaid property taxes are considered delinquent the following January 1 and are then subject to municipal lien. In accordance with New Jersey State Statute, the School District is entitled to receive moneys under an established payment schedule, and any unpaid amount is considered as an accounts receivable. The governing body of each municipality is required to pay over to the School District, within forty (40) days after the beginning of the school year, twenty percent (20%) of the moneys from school tax due. Thereafter, but prior to the last day of the school year, the municipality must pay the balance of moneys from school tax due for school purposes in such amounts as requested, with certain limitations, from time to time by the School District, within thirty days after each request.
41

24750 Notes to Financial Statements (Cont'd)
Note 1: SUMMARY OF SIGNIFICANT ACCOUNTING POLICIES (CONT'D)
Measurement Focus, Basis of Accounting and Financial Statement Presentation (Cont’d)
Governmental fund financial statements are reported using the current financial resources measurement focus and the modified accrual basis of accounting. Revenues are recorded when they are deemed both available and measurable. Available means when revenues are collectible within the current period or soon enough thereafter to pay liabilities of the current period. For this purpose, the School District considers revenues to be available if they are collected within sixty (60) days of the end of the current fiscal year. Measurable means that the amount of revenue can be determined. Expenditures generally are recorded when a liability is incurred, as under accrual accounting. However, debt service expenditures, as well as expenditures related to compensated absences and claims and judgments, are recorded only when payment is due.
Property taxes, tuition, reimbursable-type grants, and interest associated with the current fiscal year are all considered to be susceptible to accrual and so have been recognized as revenues of the current fiscal year. All other revenue items are considered to be measurable and available only when cash is received by the School District.
The School District reports the following major governmental funds:
General Fund - The general fund is the primary operating fund of the School District. It is used to account for all financial resources except those required to be accounted for in another fund. Included are certain expenditures for vehicles and movable instructional or non-instructional equipment classified in the capital outlay sub-fund.
As required by the New Jersey State Department of Education, the School District includes budgeted capital outlay in this fund. Accounting principles generally accepted in the United States of America,as they pertain to governmental entities, state that general fund resources may be used to directly finance capital outlays for long-lived improvements as long as the resources in such cases are derived exclusively from unrestricted revenues.
Resources for budgeted capital outlay purposes are normally derived from State of New Jersey aid, ad valorem tax revenues, and appropriated fund balance. Expenditures are those which result in the acquisition of or additions to capital assets for land, existing buildings, improvements of grounds, construction of buildings, additions to, or remodeling of buildings, and the purchase of built-in equipment.
Special Revenue Fund - The special revenue fund is used to account for and report the proceeds of specific revenue sources that are restricted or committed to expenditures for specified purposes other than debt service or capital projects.
Capital Projects Fund - The capital projects fund is used to account for and report financial resources that are restricted, committed, or assigned to expenditures for capital outlays, including the acquisition or construction of capital facilities and other capital assets, other than those financed by proprietary funds. The financial resources are derived from New Jersey Economic Development Authority grants, temporary notes, serial bonds which are specifically authorized by the voters as a separate question on the ballot either during the annual election or at a special election, or from the general fund by way of transfers from capital outlay or the capital reserve account.
Debt Service Fund - The debt service fund is used to account for and report financial resources that are restricted, committed, or assigned to expenditures for principal and interest.
42

24750 Notes to Financial Statements (Cont'd)
Note 1: SUMMARY OF SIGNIFICANT ACCOUNTING POLICIES (CONT'D)
Measurement Focus, Basis of Accounting and Financial Statement Presentation (Cont’d)
Proprietary funds are used to account for the School District’s ongoing organizations and activities, which are operated and financed in a manner similar to those found in the private sector. The measurement focus is upon the determination of net income. Proprietary funds distinguish operating revenues and expenses from nonoperating items. Operating revenues and expenses generally result from providing services and producing and delivering goods in connection with a proprietary fund’s principal ongoing operations. All items not meeting this definition are reported as nonoperating revenues and expenses.
The School District reports the following major proprietary fund:
Food Service Fund - This fund accounts for the financial transactions related to the food service operations of the School District.
Additionally, the School District reports the following fund types:
Fiduciary funds are used to account for assets held by the School District on behalf of outside related organizations or on behalf of other funds within the School District. The fiduciary fund financial statements are reported using the economic resources measurement focus and the accrual basis of accounting. Revenues are recorded when earned and expenses are recorded when a liability is incurred, regardless of the timing of related cash flows. The fiduciary fund category is split into four classifications: pension trust funds, investment trust funds, private-purpose trust funds, and agency funds.
The School District maintains the following fiduciary funds:
Agency Funds - Agency funds are used to account for assets held by the School District in a trustee capacity or as an agent for individuals, private organizations, other governments, and / or other funds (i.e., payroll and student activities). The School District retains no equity interest in these funds. Agency funds are custodial in nature (assets equal liabilities) and do not involve measurement of results of operations. The School District maintains the following agency funds: student activity fund and payroll fund.
Private-Purpose Trust Funds - Private-purpose trust funds are used to account for the principal and income for all other trust arrangements that benefit individuals, private organizations, or other governments. The School District maintains the following private-purpose trust funds:
Scholarship Fund - Revenues consist of donations and interest income. Expenditures represent scholarships for future teachers, which are awarded in accordance with the trust requirements.
New Jersey Unemployment Compensation Insurance Trust Fund - Revenues consist of contributions that have been included in the annual budget of the School District, employee payroll withholdings, and interest income. Expenditures represent claims incurred for unemployment.
As a general rule the effect of interfund activity has been eliminated from the government-wide financial statements.
Amounts reported as program revenues include (1) charges to customers or applicants for goods, services, or privileges provided, (2) operating grants and contributions, and (3) capital grants and contributions. Internally dedicated resources are reported as general revenues rather than as program revenues. Likewise, general revenues include all property taxes.
43

24750 Notes to Financial Statements (Cont'd)
Note 1: SUMMARY OF SIGNIFICANT ACCOUNTING POLICIES (CONT'D)
Budgets / Budgetary Control
Annual appropriated budgets are prepared in the spring of each fiscal year for the general, special revenue, and debt service funds, and are submitted to the county office of education. In accordance with P.L. 2011, c. 202, the School District passed a resolution to move the school board election to the first Tuesday after the first Monday in November, starting in November of 2012, to be held simultaneously with the general election. As a result, a vote is not required on the School District’s general fund tax levy for the budget year, other than the general fund tax levy required to support a proposal for additional funds, if any. Budgets are prepared using the modified accrual basis of accounting. The legal level of budgetary control is established at line item accounts within each fund. Line item accounts are defined as the lowest (most specific) level of detail as established pursuant to the minimum chart of accounts referenced in N.J.A.C. 6A:23A-16.2(f)1. Transfers of appropriations may be made by school board resolution at any time during the fiscal year in accordance with N.J.A.C. 6A:23A-13.3.
Formal budgetary integration into the accounting system is employed as a management control device during the year. For governmental funds there are no substantial differences between the budgetary basis of accounting and generally accepted accounting principles, with the exception of the legally mandated revenue recognition of the one or more June state aid payments for budgetary purposes only,and the special revenue fund. N.J.S.A. 18A:22-44.2 provides that in the event a state school aid payment is not made until the following school budget year, school districts must record the delayed one or more June state aid payments as revenue, for budget purposes only, in the current school budget year. The bill provides legal authority for school districts to recognize this revenue in the current budget year. Encumbrance accounting is also employed as an extension of formal budgetary integration in the governmental fund types. Unencumbered appropriations lapse at fiscal year-end.
The accounting records of the special revenue fund are maintained on the budgetary basis. The budgetary basis differs from GAAP in that the budgetary basis recognizes encumbrances as expenditures and also recognizes the related revenues, whereas the GAAP basis does not. Sufficient supplemental records are maintained to allow for the presentation of GAAP basis financial reports.
The budget, as detailed on exhibit C-1, exhibit C-2, and exhibit I-3, includes all amendments to the adopted budget, if any.
Exhibit C-3 presents a reconciliation of the general fund revenues and special revenue fund revenues and expenditures from the budgetary basis of accounting, as presented in the general fund budgetary comparison schedule and the special revenue fund budgetary comparison schedule, to the GAAP basis of accounting as presented in the statement of revenues, expenditures and changes in fund balances -governmental funds. Note that the School District does not report encumbrances outstanding at fiscal year-end as expenditures in the general fund since the general fund budget follows the modified accrual basis of accounting, with the exception of the aforementioned revenue recognition policy for the one or more June state aid payments.
Encumbrances
Encumbrance accounting, under which purchase orders, contracts, and other commitments for the expenditure of funds are recorded to assign a portion of the applicable appropriation, is utilized for budgetary control purposes. Encumbrances are a component of fund balance at fiscal year-end as they do not constitute expenditures or liabilities, but rather commitments related to unperformed contracts for goods and services. Open encumbrances in the governmental funds, other than the special revenue fund, which have not been previously restricted, committed, or assigned, should be included withincommitted or assigned fund balance, as appropriate.
44

24750 Notes to Financial Statements (Cont'd)
Note 1: SUMMARY OF SIGNIFICANT ACCOUNTING POLICIES (CONT'D)
Encumbrances (Cont’d)
Open encumbrances in the special revenue fund, however, for which the School District has received advances of grant awards, are reflected on the balance sheet as unearned revenues at fiscal year-end.
The encumbered appropriation authority carries over into the next fiscal year. An entry will be made at the beginning of the next fiscal year to increase the appropriation reflected in the certified budget by the outstanding encumbrance amount as of the current fiscal year end.
Cash, Cash Equivalents and Investments
Cash and cash equivalents, for all funds, include petty cash, change funds, cash in banks and all highly liquid investments with a maturity of three months or less at the time of purchase and are stated at cost plus accrued interest. Such is the definition of cash and cash equivalents used in the statement of cash flows for the proprietary funds. U.S. treasury and agency obligations and certificates of deposit with maturities of one year or less when purchased are stated at cost. All other investments are stated at fair value.
New Jersey school districts are limited as to the types of investments and types of financial institutions they may invest in. N.J.S.A. 18A:20-37 provides a list of permissible investments that may be purchased by New Jersey school districts.
N.J.S.A. 17:9-41 et seq. establishes the requirements for the security of deposits of governmental units. The statute requires that no governmental unit shall deposit public funds in a public depository unless such funds are secured in accordance with the Governmental Unit Deposit Protection Act (“GUDPA”), a multiple financial institutional collateral pool, which was enacted in 1970 to protect governmental units from a loss of funds on deposit with a failed banking institution in New Jersey. Public depositories include State or federally chartered banks, savings banks or associations located in or having a branch office in the State of New Jersey, the deposits of which are federally insured. All public depositories must pledge collateral, having a market value at least equal to five percent of the average daily balance of collected public funds, to secure the deposits of governmental units. If a public depository fails, the collateral it has pledged, plus the collateral of all other public depositories, is available to pay the amount of their deposits to the governmental units.
Inventories
Inventories are valued at cost, which approximates market. The costs are determined on a first-in, first-out method.
The cost of inventories in the governmental fund financial statements is recorded as expenditures when purchased rather than when consumed.
Inventories recorded on the government-wide financial statements and in the proprietary fund types are recorded as expenses when consumed rather than when purchased.
Tuition Receivable
Tuition charges were established by the School District based on estimated costs. The charges are subject to adjustment when the final costs are determined.
45

24750 Notes to Financial Statements (Cont'd)
Note 1: SUMMARY OF SIGNIFICANT ACCOUNTING POLICIES (CONT'D)
Prepaid Expenses
Prepaid expenses recorded on the government-wide financial statements and in the proprietary fund types represent payments made to vendors for services that will benefit periods beyond June 30, 2017. The School District had no prepaid expenses for the fiscal year ended June 30, 2017.
In the governmental fund financial statements, however, payments for prepaid items are fully recognized as expenditures in the fiscal year of payment. No asset for the prepayment is created, and no expenditure allocation to future accounting periods is required (non-allocation method). This is consistent with the basic governmental concept that only expendable financial resources are reported by a specific fund.
Short-Term Interfund Receivables / Payables
Short-term interfund receivables / payables (internal balances) represent amounts that are owed, other than charges for goods or services rendered to / from a particular fund within the School District, and that are due within one year. Such balances are eliminated in the statement of net position to minimize the grossing up of internal balances, thus leaving a net amount due between the governmental and business-type activities that are eliminated in the total government column. Balances with fiduciary activities are not considered to be internal balances; therefore, such balances appear on the statement of net position as accounts receivable.
Capital Assets
Capital assets represent the cumulative amount of capital assets owned by the School District. Purchased capital assets are recorded as expenditures in the governmental fund financial statements and are capitalized at cost on the government-wide statement of net position and proprietary fund statement of net position. In the case of gifts or contributions, such capital assets are recorded at acquisition value at the time received.
The School District’s capitalization threshold is $2,000.00. Other costs incurred for repairs and maintenance is expensed as incurred. All reported capital assets, except land and construction in progress, are depreciated. Depreciation is computed using the straight-line method over the following estimated useful lives:
Description Estimated Lives
Furniture, Fixtures and Equipment 3 - 15 YearsBuildings and Improvements 15 - 50 YearsLand Improvements 15 Years
The School District does not possess any infrastructure assets.
Deferred Outflows and Deferred Inflows of Resources
The statement of net position reports separate sections for deferred outflows of resources and deferred inflows of resources. Deferred outflows of resources, reported after total assets, represents a reduction of net position that applies to a future period(s) and will be recognized as an outflow of resources (expense) at that time. Deferred inflows of resources, reported after total liabilities, represents an acquisition of net position that applies to a future period(s) and will be recognized as an inflow of resources (revenue) at that time.
46
24750 Notes to Financial Statements (Cont'd)
Note 1: SUMMARY OF SIGNIFICANT ACCOUNTING POLICIES (CONT'D)
Deferred Outflows and Deferred Inflows of Resources (Cont’d)
Transactions are classified as deferred outflows of resources and deferred inflows of resources only when specifically prescribed by the Governmental Accounting Standards Board (GASB) standards. The School District is required to report the following as deferred outflows of resources and deferred inflows of resources:
Defined Benefit Pension Plans - The difference between expected (actuarial) and actual experience, changes in actuarial assumptions, net difference between projected (actuarial) and actual earnings on pension plan investments, changes in the School District’s proportion of expenses and liabilities to the pension as a whole, differences between the School District’s pension contribution and its proportionate share of contributions, and the School District’s pension contributions subsequent to the pension valuation measurement date.
Tax Receipts – The school district received additional property taxes in advance of the date due to the school district. These excess receipts are deferred inflows of resources.
In addition, the School District reports the following as deferred outflows of resources:
Loss on Refunding of Debt - The loss on refunding arose from the issuance of refunding bonds, which is amortized in a systematic and rational manner over the duration of the related debt as a component of interest expense.
Tuition Payable
Tuition charges for the fiscal years ended June 30, 2017 and 2016 were based on rates established by the receiving district. These rates are subject to change when the actual costs have been determined.
Accrued Salaries and Wages
Certain School District employees who provide services to the School District over the ten-month academic year have the option to have their salaries evenly disbursed during the entire twelve-month year. New Jersey statutes require that these earned but undisbursed amounts be retained in a separate bank account. As of June 30, 2017, the amounts earned by these employees were disbursed to the employees' own individual credit union accounts.
Compensated Absences
Compensated absences are payments to employees for accumulated time such as paid vacation, paid holidays, sick pay, and sabbatical leave. A liability for compensated absences that is attributable to services already rendered, and that are not contingent on a specific event that is outside the control of the School District and its employees, is accrued as the employees earn the rights to the benefits. Compensated absences that relate to future services, or that are contingent on a specific event that is outside the control of the School District and its employees, are accounted for in the period in which such services are rendered or in which such events take place.
The School District uses the vesting method to calculate the compensated absences amount. The entire compensated absence liability, including the employer’s share of applicable taxes, is reported on the government-wide financial statements. The portion related to employees in the proprietary funds is recorded at the fund level. The current portion is the amount estimated to be used in the following fiscal year. Expenditures are recognized in the governmental funds as payments come due each period, for example, as a result of employee resignations and retirements. Compensated absences not recorded at the fund level represent a reconciling item between the fund level and government-wide presentations.
47
24750 Notes to Financial Statements (Cont'd)
Note 1: SUMMARY OF SIGNIFICANT ACCOUNTING POLICIES (CONT'D)
Unearned Revenue
Unearned revenue arises when assets are recognized before revenue recognition criteria have been satisfied and is recorded as a liability until the revenue is both measurable and the School District is eligible to realize the revenue.
Accrued Liabilities and Long-Term Obligations
All payables, accrued liabilities, and long-term obligations are reported in the government-wide financial statements, and all payables, accrued liabilities, and long-term obligations payable from proprietary funds are reported on the proprietary fund financial statements. In general, governmental fund payables and accrued liabilities that, once incurred, are paid in a timely manner, and in full from current financial resources, are reported as obligations of the funds. However, claims and judgments, compensated absences, special termination benefits, and contractually required pension contributions that will be paid from governmental funds, are reported as a liability in the fund financial statements only to the extent that they are normally expected to be paid with expendable available financial resources. Bonds are recognized as a liability on the governmental fund financial statements when due.
Pensions
For purposes of measuring the net pension liability, deferred outflows of resources and deferred inflows of resources related to pensions, and pension expense, information about the fiduciary net position of the Teachers’ Pension and Annuity Fund (“TPAF”) and the Public Employees' Retirement System (“PERS”), and additions to/deductions from TPAF’s and PERS’s fiduciary net position have been determined on the same basis as they are reported by the plans. For this purpose, benefit payments (including refunds of employee contributions) are recognized when due and payable in accordance with the benefit terms. Investments are reported at fair value.
Bond Discounts / Premiums
Bond discounts / premiums arising from the issuance of long-term debt (bonds) are amortized over the life of the bonds, in systematic and rational method, as a component of interest expense. Bond discounts / premiums are presented as an adjustment of the face amount of the bonds on the government-wide statement of net position and on the proprietary fund statement of net position.
Net Position
Net position represents the difference between the summation of assets and deferred outflows of resources, and the summation of liabilities and deferred inflows of resources. Net position is classified into the following three components:
Net Investment in Capital Assets - This component represents capital assets, net of accumulated depreciation, net of outstanding balances of borrowings used for the acquisition, construction, or improvement of those assets.
Restricted - Net position is reported as restricted when there are limitations imposed on their use either through the enabling legislation adopted by the School District or through external restrictions imposed by creditors, grantors or laws or regulations of other governments.
Unrestricted - Net position is reported as unrestricted when it does not meet the criteria of the other two components of net position.
The School District applies restricted resources when an expense is incurred for purposes for which both restricted and unrestricted net position is available.
48

24750 Notes to Financial Statements (Cont'd)
Note 1: SUMMARY OF SIGNIFICANT ACCOUNTING POLICIES (CONT'D)
Fund Balance
The School District reports fund balance in classifications that comprise a hierarchy based primarily on the extent to which the School District is bound to honor constraints on the specific purposes for which amounts in those funds can be spent. The School District’s classifications, and policies for determining such classifications, are as follows:
Nonspendable - The nonspendable fund balance classification includes amounts that cannot be spent because they are either not in spendable form or are legally or contractually required to be maintained intact. The “not in spendable form” criterion includes items that are not expected to be converted to cash, such as inventories and prepaid amounts.
Restricted - The restricted fund balance classification includes amounts that are restricted to specific purposes. Such restrictions, or constraints, are placed on the use of resources either by being (1) externally imposed by creditors, grantors, contributors, or laws or regulations of other governments; or (2) imposed by law through constitutional provisions or enabling legislation.
Committed - The committed fund balance classification includes amounts that can only be used for specific purposes pursuant to constraints imposed by formal action of the School District’s highest level of decision-making authority, which, for the School District, is the Board of Education. Such formal action consists of an affirmative vote by the Board of Education, memorialized by the adoption of a resolution. Once committed, amounts cannot be used for any other purpose unless the Board of Education removes, or changes, the specified use by taking the same type of action (resolution) it employed to previously commit those amounts.
Assigned - The assigned fund balance classification includes amounts that are constrained by the School District’s intent to be used for specific purposes, but are neither restricted nor committed. Intent is expressed by either the Board of Education or by the business administrator, to which the Board of Education has delegated the authority to assign amounts to be used for specific purposes.Such authority of the business administrator is established by way of a formal job description for the position and standard operating procedures, approved by the Board of Education
Unassigned - The unassigned fund balance classification is the residual classification for thegeneral fund. This classification represents fund balance that has not been assigned to other funds and that has not been restricted, committed, or assigned to specific purposes within the general fund. The general fund is the only fund that reports a positive unassigned fund balance amount. In other governmental funds, if expenditures incurred for specific purposes exceed the amounts restricted, committed, or assigned to those purposes, it may be necessary to report a negative unassigned fund balance.
When expenditures are incurred for purposes for which both restricted and unrestricted fund balances are available, it is the policy of the School District to spend restricted fund balances first. Moreover, when expenditures are incurred for purposes for which amounts in any of the unrestricted fund balance classifications can be used, it is the policy of the School District to spend fund balances, if appropriate, in the following order: committed, assigned, then unassigned
Interfund Activity
Transfers between governmental and business-type activities on the government-wide statements arereported in the same manner as general revenues. Exchange transactions between funds are reported as revenues in the seller funds and as expenditures / expenses in the purchaser funds. Flows of cash or goods from one fund to another without a requirement for repayment are reported as interfund transfers. Interfund transfers are reported as other financing sources / uses in governmental funds and after non-operating revenues / expenses in proprietary funds. Reimbursements from funds responsible for particular expenditures / expenses to the funds that initially paid for them are not presented on the financial statements.
49

24750 Notes to Financial Statements (Cont'd)
Note 1: SUMMARY OF SIGNIFICANT ACCOUNTING POLICIES (CONT'D)
Accounting Estimates
The preparation of financial statements in conformity with accounting principles generally accepted in the United States of America requires management to make estimates and assumptions that affect the amounts reported in the financial statements and accompanying notes. Actual results may differ from those estimates.
Impact of Recently Issued Accounting Principles
Recently Issued and Adopted Accounting Pronouncements
The School District implemented the following GASB Statements for the fiscal year ended June 30, 2017:
Statement No. 77, Tax Abatement Disclosures. This Statement provides financial statement users with essential information about the nature and magnitude of the reduction in tax revenues through tax abatement programs in order to better assess (a) whether current-year revenues were sufficient to pay for current-year services, (b) compliance with finance-related legal or contractual requirements, (c) where a government's financial resources come from and how it uses them, and (d) financial position and economic condition and how they have changed over time. The adoption of this Statement had no impact on the basic financial statements of the School District.
Statement No. 80, Blending Requirements for Certain Component Units an amendment of GASB Statement No. 14. This Statement amends the blending requirements for the financial statement presentation of component units of all state and local governments. The additional criterion requires blending of a component unit incorporated as a not-for-profit corporation in which the primary government is the sole corporate member. The additional criterion does not apply to component units included in the financial reporting entity pursuant to the provisions of Statement No. 39, Determining Whether Certain Organizations Are Component Units. The adoption of this Statement had no impact on the basic financial statements of the School District.
Statement No. 82, Pension Issues and amendment of GASB Statements No. 67, No. 68, and No. 73. This Statement addresses issues regarding (1) the presentation of payroll-related measures in required supplementary information, (2) the selection of assumptions and the treatment of deviations from the guidance in an Actuarial Standard of Practice for financial reporting purposes, and (3) the classification of payments made by employers to satisfy employee (plan member) contribution requirements. The adoption of this Statement did not have a significant impact on the basic financial statements of the School District.
Recently Issued Accounting Pronouncements
The GASB has issued the following Statements that will become effective for the School District for the fiscal year ending June 30, 2018:
Statement No. 75, Accounting and Financial Reporting for Postemployment Benefits Other Than Pensions. The primary objective of this Statement is to improve accounting and financial reporting by state and local governments for postemployment benefits other than pensions (other postemployment benefits or OPEB). It also improves information provided by state and local governmental employers about financial support for OPEB that is provided by other entities. Management has determined that this Statement will have an impact on the basic financial statements of the School District
50

24750 Notes to Financial Statements (Cont'd)
Note 2: CASH AND CASH EQUIVALENTS
Custodial Credit Risk Related to Deposits - Custodial credit risk is the risk that, in the event of a bank failure, the School District’s deposits might not be recovered. Although the School District does not have a formal policy regarding custodial credit risk, N.J.S.A. 17:9-41 et seq. requires that governmental unitsshall deposit public funds in public depositories protected from loss under the provisions of the Governmental Unit Deposit Protection Act (GUDPA). Under the Act, the first $250,000.00 of governmental deposits in each insured depository is protected by the Federal Deposit Insurance Corporation (FDIC). Public funds owned by the School District in excess of FDIC insured amounts are protected by GUDPA. However, GUDPA does not protect intermingled agency funds such as salary withholdings, and student activity funds, or funds that may pass to the School District relative to the happening of a future condition. Such funds are classified as uninsured and uncollateralized.
As of June 30, 2017, the School District’s bank balances of $4,036,012.44 were exposed to custodial credit risk as follows:
Insured by FDIC and GUDPA 4,036,012.44$
Uninsured and Uncollateralized -
Total 4,036,012.44$
Note 3: CAPITAL RESERVE ACCOUNT
A capital reserve account was established by the School District during the 1999-2000 for the accumulation of funds for use as capital outlay expenditures in subsequent fiscal years. The capital reserve account is maintained in the general fund and its activity is included in the general fund annual budget.
Funds placed in the capital reserve account are restricted to capital projects in the School District’s approved Long Range Facilities Plan (“LRFP”). Upon submission of the LRFP to the Department, a school district may increase the balance in the capital reserve by appropriating funds in the annual general fund budget certified for taxes or by transfer by board resolution at fiscal year-end (June 1 to June 30) of any unanticipated revenue or unexpended line-item appropriation amounts, or both. A school district may also appropriate additional amounts when the express approval of the voters has been obtained by either a separate proposal at budget time or by a special question at one of the four special elections authorized pursuant to N.J.S.A. 19:60-2. Pursuant to N.J.A.C. 6A:23A-14.1(g), the balance in the account cannot at any time exceed the local support costs of uncompleted capital projects in its approved LRFP.
The activity of the capital reserve for the July 1, 2016 to June, 2017 fiscal year is as follows:
Beginning Balance, July 1, 2016 1,101,562.67$ Increased by:
Interest Earnings 1,177.82$ Deposits:
Cancellation of local portion of EFCFA projects 179,815.50
180,993.32
Ending Balance, June 30, 2017 1,282,555.99$
51

24750 Notes to Financial Statements (Cont'd)
Note 3: CAPITAL RESERVE ACCOUNT (CON’D)
The June 30, 2017 LRFP balance of local support costs of uncompleted projects is $8,232,471.27. Withdrawals from the capital reserve are for use for Department of Education approved facilities projects, consistent with the School District’s LRFP.
Note 4: ACCOUNTS RECEIVABLE
Accounts receivable at June 30, 2017 consisted of accounts (fees for services), intergovernmental awards / grants. All receivables are considered collectible in full due to the stable condition of federal and state programs, the current fiscal year guarantee of federal funds, and the regulated budgetary control of governmental entities in New Jersey.
Accounts receivable as of fiscal year end for the School District’s individual major and fiduciary funds, in the aggregate, are as follows:
Special Food
General Revenue Service
Description Fund Fund Fund Total
Intergovernmental 215,187.63$ 62,407.09$ 9,127.10$ 286,721.82$ Other 32,857.86 7,000.00 1,505.46 41,363.32
248,045.49$ 69,407.09$ 10,632.56$ 328,085.14$
Note 5: INVENTORY
Inventory recorded at June 30, 2017 in business-type activities on the government-wide statement of net position, and on the food service enterprise fund statement of net position, consisted of the following:
Food 3,831.80$ Supplies 2,505.87
6,337.67$
52

24750 Notes to Financial Statements (Cont'd)
Note 6: CAPITAL ASSETS
Capital asset activity for the fiscal year ended June 30, 2017 is as follows:Balance Retirements Balance
July 1, 2016 Additions and Transfers June 30, 2017
Governmental Activities:
Capital Assets, not being Depreciated:Construction in Progress 21,937.50$ - (21,937.50)$ -
Capital Assets, being Depreciated:Furniture, Fixtures and Equipment 2,850,001.36 233,275.60$ (134,184.01) 2,949,092.95$ Buildings and Improvements 23,138,485.25 21,937.50 23,160,422.75Land Improvements 129,301.00 129,301.00
Total Capital Assets, being Depreciated 26,117,787.61 233,275.60 (112,246.51) 26,238,816.70
Total Capital Assets, Cost 26,139,725.11 233,275.60 (134,184.01) 26,238,816.70
Less Accumulated Depreciation for: EquipmentFurniture, Fixtures and Equipment (2,382,135.59) (96,705.68) 134,184.01 (2,344,657.26)
Buildings and Improvements (9,986,063.36) (449,458.35) (10,435,521.71)Land Improvements (105,973.17) (4,353.55) (110,326.72)
Total Accumulated Depreciation (12,474,172.12) (550,517.58) 134,184.01 (12,890,505.69)Total Capital Assets, being Depreciated, Net 13,643,615.49 (317,241.98) 21,937.50 13,348,311.01
Governmental Activities Capital Assets, Net 13,665,552.99$ (317,241.98)$ - 13,348,311.01$
Balance Retirements Balance
July 1, 2016 Additions and Transfers June 30, 2017
Business-Type Activities:
Capital Assets, being Depreciated:Furniture, Fixtures and Equipment 172,764.50$ 172,764.50$
Less Accumulated Depreciation (106,133.07) (7,207.99)$ (113,341.06)
Business-Type Activities Capital Assets, Net 66,631.43$ (7,207.99)$ - 59,423.44$
Depreciation expense was charged to functions / programs of the School District as follows:
Governmental Activities:
Instruction 6,789.39$ Administration 31,563.22Transportation 35,449.70Plant Operations and Maintenance 3,799.84Unallocated 472,915.43
Total Depreciation Expense - Governmental Activities 550,517.58$
Business-Type Activities:
Food Service 7,207.99$
53

24750 Notes to Financial Statements (Cont'd)
Note 7: LONG-TERM LIABILITIES
During the fiscal year ended June 30, 2017, the following changes occurred in long-term obligations for governmental activities:
Balance Adjustments/ Balance Due within
July 1, 2016 Additions Reductions June 30, 2017 One Year
Governmental Activities:
Bonds Payable:General Obligation Bonds 5,225,000.00$ (660,000.00)$ 4,565,000.00$ 685,000.00$
Unamortized Cost of Premium on Bonds 192,248.10 (21,360.90) 170,887.20
Other Liabilities:Net Pension Liability 4,471,678.00 2,496,890.00$ (1,137,460.00) 5,831,108.00Obligations under Capital Lease 190,937.21 (59,171.69) 131,765.52 60,822.17Compensated Absences 377,549.37 75,509.88 (33,010.48) 420,048.77 84,009.75
Total Other Liabilities 5,040,164.58 2,572,399.88 (1,229,642.17) 6,382,922.29 144,831.92
Governmental Activity Long-Term Liabilities 10,457,412.68$ 2,572,399.88$ (1,911,003.07)$ 11,118,809.49$ 829,831.92$
The bonds payable are generally liquidated by the debt service fund, while the net pension liability, obligations under capital lease and compensated absences are liquidated by the general fund.
Bonds Payable - Bonds and loans are authorized in accordance with State law by the voters of the municipality through referendums. All bonds are retired in serial installments within the statutory period of usefulness. Bonds issued by the School District are general obligation bonds.
On October 1, 2003, the School District issued $5,335,000.00 of Refunding School Bonds to provide funding to advance refund the callable portion of the outstanding 1996 Bond Issue. The Refunding Bonds were issued at interest rates varying from 2.00% to 4.30%. The final maturity of these bonds wasSeptember 1, 2021, however the School District refunded these bonds on October 18, 2013.
On February 1, 2005, the District issued $5,673,000.00 of School Bonds at interest rates varying from 2.5% to 4.3%. The purpose of the Bonds is to undertake the construction of various renovations and improvements to Kenneth R. Olson Middle School and Tabernacle Elementary School in order to correct various health and safety deficiencies and make necessary offsite improvements. The final maturity of these bonds was originally February 1, 2025, however the School District refunded these bonds on October 18, 2013.
On October 18, 2013, the School District issued $6,250,000.00 of Refunding School Bonds to provide funding to advance refund the callable portion of the outstanding 2003 and 2005 Bond Issues. The Refunding Bonds were issued at interest rates varying from 2.00% to 4.00%. The final maturity of thesebonds is September 1, 2024.
54

24750 Notes to Financial Statements (Cont'd)
Note 7: LONG-TERM LIABILITIES (CONT’D)
Bonds Payable (Cont’d) - Principal and interest due on bonds outstanding is as follows:
Fiscal Year
Ending June 30, Principal Interest Total
2018 685,000.00$ 135,062.50$ 820,062.50$ 2019 705,000.00 110,687.50 815,687.502020 715,000.00 85,862.50 800,862.502021 700,000.00 64,637.50 764,637.502022 690,000.00 43,787.50 733,787.502023-2025 1,070,000.00 49,843.75 1,119,843.75
4,565,000.00$ 489,881.25$ 5,054,881.25$
Obligations under Capital Lease - The School District leases five school buses totaling $309,285.61 under capital leases. All capital leases are for terms of five years. Capital leases are depreciated in amanner consistent with the School District’s deprecation policy for owned assets.
The following is a schedule of the future minimum lease payments under these capital leases, and the present value of the net minimum lease payments at June 30, 2017.
Fiscal Year
Ending June 30, Principal Interest Total
2018 60,822.17$ 3,899.12$ 64,721.29$ 2019 34,930.67 2,199.83 37,130.50 2020 36,012.68 1,117.82 37,130.50
131,765.52$ 7,216.77$ 138,982.29$
Compensated Absences - As previously stated, compensated absences will be paid from the fund from which the employees’ salaries are paid. Refer to note 14 for a description of the School District’s policy.
Net Pension Liability - For details on the net pension liability, refer to note 9. The School District’s annual required contribution to the Public Employees' Retirement System is budgeted and paid from the general fund on an annual basis.
55

24750 Notes to Financial Statements (Cont'd)
Note 8: OPERATING LEASES
At June 30, 2017, the School District had operating lease agreements in effect for copy machines, mail machines and computer equipment. The present value of the future minimum rental payments under the operating lease agreements are as follows:
Fiscal Year
Ending June 30, Amount
2018 142,714.37$ 2019 127,799.372020 109,249.372021 109,249.37
489,012.48$
Rental payments under operating leases for the fiscal year ended June 30, 2017 were $140,674.49.
Note 9: PENSION PLANS
A substantial number of the School District's employees participate in one of the following defined benefit pension plans: the Teachers' Pension and Annuity Fund (“TPAF”) and the Public Employees' Retirement System (“PERS”), which are administered by the New Jersey Division of Pensions and Benefits (the “Division”). In addition, several School District employees participate in the Defined Contribution Retirement Program, which is a defined contribution pension plan. This plan is administered by Prudential Financial for the Division. Each plan has a Board of Trustees that is primarily responsible for its administration. The Division issues a publicly available financial report that includes financial statements and required supplementary information. That report may be obtained by writing to:
State of New JerseyDivision of Pensions and Benefits
P.O. Box 295Trenton, New Jersey 08625-0295
http://www.nj.gov/treasury/pensions
General Information about the Pension Plans
Plan Descriptions
Teachers' Pension and Annuity Fund - The Teachers' Pension and Annuity Fund is a cost-sharing multiple-employer defined benefit pension plan, with a special funding situation, which was established as of January 1, 1955, under the provisions of N.J.S.A. 18A:66. The State of New Jersey (the “State”) is responsible to fund 100% of the employer contributions, excluding any local employer early retirement incentive (ERI) contributions. The TPAF’s designated purpose is to provide retirement benefits, death, disability and medical benefits to certain qualified members. Membership in the TPAF is mandatory for substantially all teachers or members of the professional staff certified by the State Board of Examiners, who have titles that are unclassified, professional and certified. The TPAF’s Board of Trustees is primarily responsible for the administration of the TPAF.
56

24750 Notes to Financial Statements (Cont'd)
Note 9: PENSION PLANS (CONT’D)
General Information about the Pension Plans (Cont’d)
Plan Descriptions (Cont’d)
Public Employees' Retirement System - The Public Employees' Retirement System is a cost-sharing multiple-employer defined benefit pension plan which was established as of January 1, 1955, under the provisions of N.J.S.A. 43:15A. The PERS’s designated purpose is to provide retirement, death, disability and medical benefits to certain qualified members. Membership in the PERS is mandatory for substantially all full-time employees of the School District, provided the employee is not required to be a member of another state-administered retirement system or other state pensions fund or local jurisdiction’s pension fund. The PERS’s Board of Trustees is primarily responsible for the administration of the PERS.
Defined Contribution Retirement Program - The Defined Contribution Retirement Program is a multiple-employer defined contribution pension fund established on July 1, 2007 under the provisions of Chapter 92, P.L. 2007, and Chapter 103, P.L. 2007 (N.J.S.A. 43:15C-1 et. seq.). The DCRP is a tax-qualified defined contribution money purchase pension plan under Internal Revenue Code (IRC) § 401(a) et seq., and is a “governmental plan” within the meaning of IRC § 414(d). The DCRP provides retirement benefits for eligible employees and their beneficiaries. Individuals covered under DCRP are employees enrolled in TPAF or PERS on or after July 1, 2007, who earn salary in excess of established “maximum compensation” limits; employees enrolled in New Jersey State Police Retirement System (SPRS) or the Police and Firemen’s Retirement System (PFRS)after May 21, 2010, who earn salary in excess of established “maximum compensation” limits; employees otherwise eligible to enroll in TPAF or PERS on or after November 2, 2008, who do not earn the minimum annual salary for tier 3 enrollment but who earn salary of at least $5,000.00 annually; and employees otherwise eligible to enroll in TPAF or PERS after May 21, 2010 who do not work the minimum number of hours per week required for tiers 4 or 5 enrollment, but who earn salary of at least $5,000.00 annually.
Vesting and Benefit Provisions
Teachers' Pension and Annuity Fund - The vesting and benefit provisions are set by N.J.S.A. 18A:66. TPAF provides retirement, death and disability benefits. All benefits vest after ten years of service, except for medical benefits, which vest after 25 years of service or under the disability provisions of TPAF. Members are always fully vested for their own contributions and, after three years of service credit, become vested for 2% of related interest earned on the contributions. In the case of death before retirement, members' beneficiaries are entitled to full interest credited to the members' accounts.
The following represents the membership tiers for TPAF:
Tier Definition
1 Members who were enrolled prior to July 1, 20072 Members who were eligible to enroll on or after July 1, 2007 and prior to November 2, 20083 Members who were eligible to enroll on or after November 2, 2008 and prior to May 21, 20104 Members who were eligible to enroll after May 21, 2010 and prior to June 28, 20115 Members who were eligible to enroll on or after June 28, 2011
57

24750 Notes to Financial Statements (Cont'd)
Note 9: PENSION PLANS (CONT’D)
General Information about the Pension Plans (Cont’d)
Vesting and Benefit Provisions (Cont’d)
Teachers' Pension and Annuity Fund (Cont’d) - Service retirement benefits of 1/55th of final average salary for each year of service credit is available to tiers 1 and 2 members upon reaching age 60 and to tier 3 members upon reaching age 62. Service retirement benefits of 1/60th of final average salary for each year of service credit is available to tier 4 members upon reaching age 62 and tier 5 members upon reaching age 65. Early retirement benefits are available to tiers 1 and 2 members before reaching age 60, tiers 3 and 4 before age 62 with 25 or more years of service credit, and tier 5 before age 65 with 30 or more years of service credit. Benefits are reduced by a fraction of a percent for each month that a member retires prior to the retirement age for his/her respective tier. Deferred retirement is available to members who have at least 10 years of service credit and have not reached the service retirement age for the respective tier.
Public Employees’ Retirement System - The vesting and benefit provisions are set by N.J.S.A. 43:15A and 43:3B. The PERS provides retirement, death and disability benefits. All benefits vest after ten years of service, except for medical benefits, which vest after 25 years of service or under the disability provisions of the PERS. The membership tiers for PERS are the same as previously noted for TPAF.
Service retirement benefits of 1/55th of final average salary for each year of service credit is available to tiers 1 and 2 members upon reaching age 60 and to tier 3 members upon reaching age 62. Service retirement benefits of 1/60th of final average salary for each year of service credit isavailable to tier 4 members upon reaching age 62 and tier 5 members upon reaching age 65. Early retirement benefits are available to tiers 1 and 2 members before reaching age 60, tiers 3 and 4 before age 62 with 25 or more years of service credit and tier 5 with 30 or more years of service credit before age 65. Benefits are reduced by a fraction of a percent for each month that a member retires prior to the age at which a member can receive full early retirement benefits in accordance with their respective tier. Tier 1 members can receive an unreduced benefit from age 55 to age 60 if they have at least 25 years of service. Deferred retirement is available to members who have at least 10 years of service credit and have not reached the service retirement age for the respective tier.
Defined Contribution Retirement Program - Eligible members are provided with a defined contribution retirement plan intended to qualify for favorable Federal income tax treatment under IRC Section 401(a), a noncontributory group life insurance plan and a noncontributory group disability benefit plan. A participant's interest in that portion of his or her defined contribution retirement plan account attributable to employee contributions shall immediately become and shall at all times remain fully vested and nonforfeitable. A participant's interest in that portion of his or her defined contribution retirement plan account attributable to employer contributions shall be vested and nonforfeitable on the date the participant commences the second year of employment or upon his or her attainment of age 65, while employed by an employer, whichever occurs first.
Contributions
Teachers' Pension and Annuity Fund - The contribution policy is set by N.J.S.A. 18A:66 and requires contributions by active members and contributing employers. Pursuant to the provisions of Chapter 78, P.L. 2011, the active member contribution rate increased from 5.5% of annual compensation to 6.5% plus an additional 1% phased-in over 7 years beginning in July 2012. The member contribution rate was 7.20% in State fiscal year 2017. The phase-in of the additional incremental member contribution rate takes place in July of each subsequent State fiscal year. The State’s contribution is based on an actuarially determined amount, which includes the employer portion of the normal cost and unfunded accrued liability. Funding for noncontributory group insurance benefits is based on actual claims paid. For fiscal year 2016, the State’s pension contribution was less that the actuarial determined amount.
58

24750 Notes to Financial Statements (Cont'd)
Note 9: PENSION PLANS (CONT’D)
General Information About the Pension Plans (Cont’d)
Contributions (Cont’d)
Teachers' Pension and Annuity Fund (Cont’d) - Under current statute, all employer contributions are made by the State of New Jersey on-behalf of the School District and all other related non-contributing employers. No normal or accrued liability contribution by the School District has been required over several preceding fiscal years. These on-behalf contributions by the State of New Jersey are considered a special funding situation, under the definition of GASB 68, Accounting and Financial Reporting for Pensions. The School District’s contractually required contribution rate for the fiscal year ended June 30, 2017 was 8.34% of the School District’s covered payroll, of which 0.00% of payroll was required from the School District and 100.00% of payroll was required from the State of New Jersey. The School District was not required to make any contributions to the pension plan during the fiscal year ended June 30, 2017 because of the 100.00% special funding situation with the State of New Jersey.
Based on the most recent TPAF measurement date of June 30, 2016, the State’s contractually required contribution, on-behalf of the School District, to the pension plan for the fiscal year ended June 30, 2017 was $455,932.00, and was paid by April 1, 2017. School District employee contributions to the pension plan during the fiscal year ended June 30, 2017 were $405,573.19.
Public Employees’ Retirement System - The contribution policy is set by N.J.S.A. 43:15A and requires contributions by active members and contributing employers. Members contribute at a uniform rate. Pursuant to the provisions of Chapter 78, P.L. 2011, the active member contribution rate increased from 5.5% of annual compensation to 6.5% plus an additional 1% phased-in over seven years beginning in July 2012. The member contribution rate was 7.20% in State fiscal year 2017. The phase-in of the additional incremental member contribution rate takes place in July of each subsequent State fiscal year. The rate for members who are eligible for the Prosecutors Part of PERS (Chapter 366, P.L. 2001) increased from 8.5% of base salary to 10%. Employers' contribution amounts are based on an actuarially determined rate. The School District’s contribution amounts are based on an actuarially determined amount, which includes the normal cost and unfunded accrued liability.
The School District’s contractually required contribution rate for the fiscal year ended June 30, 2017was 12.93% of the School District’s covered payroll. This amount was actuarially determined as theamount that, when combined with employee contributions, is expected to finance the costs of benefits earned by employees during the year, including an additional amount to finance any unfunded accrued liability.
Based on the most recent PERS measurement date of June 30, 2016, the School District’scontractually required contribution to the pension plan for the fiscal year ended June 30, 2017 was$174,908.00, and was paid by April 1, 2017. School District employee contributions to the pension plan during the fiscal year ended June 30, 2017 were $101,422.02.
Defined Contribution Retirement Program - The contribution policy is set by N.J.S.A. 43:15C-3 and requires contributions by active members and contributing employers. In accordance with Chapter 92, P.L. 2007 and Chapter 103, P.L. 2007, plan members are required to contribute 5.5% of their annual covered salary. In addition to the employee contributions, the School Districtcontributes 3% of the employees' base salary, for each pay period, to Prudential Financial not later than the fifth business day after the date on which the employee is paid for that pay period.
For the fiscal year ended June 30, 2017, employee contributions totaled $8,830.18, and the School District recognized pension expense, which equaled the required contributions, of $1,910.52. There were no forfeitures during the fiscal year.
59

24750 Notes to Financial Statements (Cont'd)
Note 9: PENSION PLANS (CONT’D)
Pension Liabilities, Pension Expense, and Deferred Outflows of Resources and Deferred Inflows of Resources Related to Pensions
Teachers' Pension and Annuity Fund - At June 30, 2017, the School District was not required to report a liability for its proportionate share of the net pension liability because of a 100% special funding situation by the State of New Jersey.
The State’s proportionate share of net pension liability, attributable to the School District is as follows:
School District's Proportionate Share of Net Pension Liability -$
State of New Jersey's Proportionate Share of Net Pension Liability Associated with the School District 45,035,825.00
45,035,825.00$
The net pension liability was measured as of June 30, 2016, and the total pension liability used to calculate the net pension liability was determined by an actuarial valuation as of July 1, 2015. The total pension liability was calculated through the use of updated procedures to roll forward from the actuarial valuation date to the measurement date of June 30, 2016. For the June 30, 2016 measurement date, the School District’s proportion of the net pension liability was based on a projection of the School District’s long-term share of contributions to the pension plan relative to the projected contributions of all participating employers and the State of New Jersey, actuarially determined. At June 30, 2016, the School District proportion was 0.00% due to the 100% special funding situation with the State of New Jersey. For the June 30, 2016 measurement date, the State’s proportionate share of the TPAF net pension liability associated with the School District was .0572491485%, which was an increase of .0044499116% from its proportion measured as of June 30, 2015.
For the fiscal year ended June 30, 2017, the School District recognized $3,383,816.00 in pension expense and revenue, in the government-wide financial statements, for the State of New Jersey on-behalf TPAF pension contributions. This pension expense and revenue was based on the pension plans June 30, 2016 measurement date.
Public Employees’ Retirement System - At June 30, 2017, the School District reported a liability of$5,831,108.00 for its proportionate share of the net pension liability. The net pension liability was measured as of June 30, 2016, and the total pension liability used to calculate the net pension liability was determined by an actuarial valuation as of July 1, 2015. The total pension liability was calculated through the use of updated procedures to roll forward from the actuarial valuation date to the measurement date of June 30, 2016. The School District’s proportion of the net pension liability was based on a projection of the School District’s long-term share of contributions to the pension plan relative to the projected contributions of all participating employers, actuarially determined. For the June 30, 2016 measurement date, the School District’s proportion was .0196882949%, which was a decrease of .0002318708% from its proportion measured as of June 30, 2015.
For the fiscal year ended June 30, 2017, the School District recognized pension expense of $452,432.00, in the government-wide financial statements. This pension expense was based on the pension plans June 30, 2016 measurement date.
60
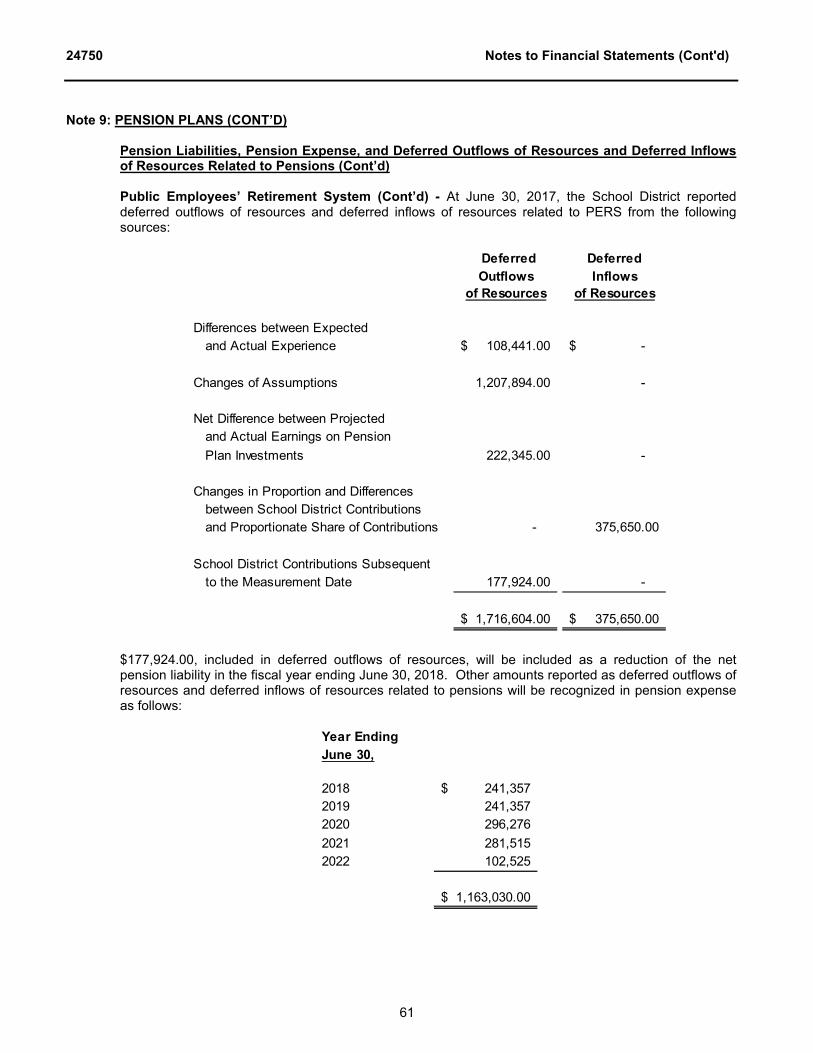
24750 Notes to Financial Statements (Cont'd)
Note 9: PENSION PLANS (CONT’D)
Pension Liabilities, Pension Expense, and Deferred Outflows of Resources and Deferred Inflows of Resources Related to Pensions (Cont’d)
Public Employees’ Retirement System (Cont’d) - At June 30, 2017, the School District reported deferred outflows of resources and deferred inflows of resources related to PERS from the following sources:
Deferred
Outflows Inflows
of Resources of Resources
Differences between Expected and Actual Experience 108,441.00$ -$
Changes of Assumptions 1,207,894.00 -
Net Difference between Projected and Actual Earnings on Pension Plan Investments 222,345.00 -
Changes in Proportion and Differences between School District Contributions and Proportionate Share of Contributions - 375,650.00
School District Contributions Subsequent to the Measurement Date 177,924.00 -
1,716,604.00$ 375,650.00$
Deferred
$177,924.00, included in deferred outflows of resources, will be included as a reduction of the net pension liability in the fiscal year ending June 30, 2018. Other amounts reported as deferred outflows of resources and deferred inflows of resources related to pensions will be recognized in pension expense as follows:
Year Ending
June 30,
2018 241,357$ 2019 241,357 2020 296,276 2021 281,515 2022 102,525
1,163,030.00$
61

24750 Notes to Financial Statements (Cont'd)
Note 9: PENSION PLANS (CONT’D)
Pension Liabilities, Pension Expense, and Deferred Outflows of Resources and Deferred Inflows of Resources Related to Pensions (Cont’d)
Public Employees’ Retirement System (Cont’d) - The amortization of the above other deferred outflows of resources and deferred inflows of resources related to pensions will be over the following number of years:
Deferred Deferred
Outflows Inflows
of Resources of Resources
Differences between Expected and Actual Experience
Year of Pension Plan Deferral:June 30, 2014 - -June 30, 2015 5.72 -June 30, 2016 5.57 -
Changes of AssumptionsYear of Pension Plan Deferral:June 30, 2014 6.44 -June 30, 2015 5.72 -June 30, 2016 5.57 -
Net Difference between Projected and Actual Earnings on Pension Plan Investments
Year of Pension Plan Deferral:June 30, 2014 - 5.00June 30, 2015 - 5.00June 30, 2016 5.00 -
Changes in Proportion and Differences between School District Contributions and Proportionate Share of Contributions
Year of Pension Plan Deferral:June 30, 2014 6.44 6.44June 30, 2015 5.72 5.72June 30, 2016 5.57 5.57
62

24750 Notes to Financial Statements (Cont'd)
Note 9: PENSION PLANS (CONT’D)
Actuarial Assumptions
The net pension liability was measured as of June 30, 2016, and the total pension liability used to calculate the net pension liability was determined by an actuarial valuation as of July 1, 2015. The total pension liability was calculated through the use of updated procedures to roll forward from the actuarial valuation date to the measurement date of June 30, 2016. This actuarial valuation used the following actuarial assumptions, applied to all periods included in the measurement:
TPAF PERS
Inflation 2.50% 3.08%
Salary Increases: 2012-2021 Varies Based on Experience Through 2026 1.65% - 4.15% Based on Age Thereafter Varies Based on Experience 2.65% - 5.15% Based on Age
Investment Rate of Return 7.65% 7.65%
Mortality Rate Table RP-2000 RP-2000
Period of Actuarial Experience Study upon which Actuarial Assumptions were Based July 1, 2012 - June 30, 2015 July 1, 2011 - June 30, 2014
For TPAF, pre-retirement, post-retirement and disabled mortality rates were based on the experience of TPAF members reflecting mortality improvement on a generational basis based on a 60-year average of Social Security data from 1953 to 2013.
For PERS, pre-retirement mortality rates were based on the RP-2000 Employee Preretirement Mortality Table for male and female active participants. Mortality tables are set back 2 years for males and 7 years for females. In addition, the tables provide for future improvements in mortality from the base year of 2013 using a generational approach based on the plan actuary’s modified MP-2014 projection scale. Post-retirement mortality rates were based on the RP-2000 Combined Healthy Male and Female Mortality Tables (set back 1 year for males and females) for service retirements and beneficiaries of former members and a one-year static projection based on mortality improvement Scale AA. In addition, the tables for service retirements and beneficiaries of former members provide for future improvements in mortality from the base year of 2013 using a generational approach based on the plan actuary’s modified MP-2014 projection scale. Disability retirement rates used to value disabled retirees were based on the RP-2000 Disabled Mortality Table (set back 3 years for males and set forward 1 year for females).
For TPAF and PERS, in accordance with State statute, the long-term expected rate of return on plan investments (7.65% at June 30, 2016) is determined by the State Treasurer, after consultation with the Directors of the Division of Investments and Division of Pensions and Benefits, the board of trustees and the actuaries. The long-term expected rate of return was determined using a building block method inwhich best-estimate ranges of expected future real rates of return (expected returns, net of pension plan investment expense and inflation) are developed for each major asset class. These ranges are combined to produce the long-term expected rate of return by weighting the expected future real rates of return by the target asset allocation percentage and by adding expected inflation. Best estimates of arithmetic rates of return for each major asset class included in TPAF’s and PERS’s target asset allocation as of June 30, 2016 are summarized in the following tables:
63

24750 Notes to Financial Statements (Cont'd)
Note 9: PENSION PLANS (CONT’D)
Actuarial Assumptions (Cont’d)
Long-Term Long-Term
Target Expected Real Target Expected Real
Asset Class Allocation Rate of Return Asset Class Allocation Rate of Return
Cash 5.00% 0.39% Cash 5.00% 0.87%U.S. Government Bonds 1.50% 1.28% U.S. Treasuries 1.50% 1.74%U.S. Credit Bonds 13.00% 2.76% Investment Grade Credit 8.00% 1.79%U.S. Mortgages 2.00% 2.38% Mortgages 2.00% 1.67%U.S. Inflation-Indexed Bonds 1.50% 1.41% High Yield Bonds 2.00% 4.56%U.S. High Yield Bonds 2.00% 4.70% Inflation-Indexed Bonds 1.50% 3.44%U.S. Equity Market 26.00% 5.14% Broad U.S. Equities 26.00% 8.53%Developed Foreign Equities 13.25% 5.91% Developed Foreign Equities 13.25% 6.83%Emerging Markets Equity 6.50% 8.16% Emerging Market Equities 6.50% 9.95%Private Real Estate Property 5.25% 3.64% Private Equity 9.00% 12.40%Timber 1.00% 3.86% Hedge Funds / Absolute Return 12.50% 4.68%Farmland 1.00% 4.39% Real Estate (Property) 2.00% 6.91%Private Equity 9.00% 8.97% Commodities 0.50% 5.45%Commodities 0.50% 2.87% Global Debt ex U.S. 5.00% -0.25%Hedge Funds - MultiStrategy 5.00% 3.70% REIT 5.25% 5.63%Hedge Funds - Equity Hedge 3.75% 4.72%Hedge Funds - Distressed 3.75% 3.49%
100.00% 100.00%
TPAF PERS
Discount Rate - The discount rates used to measure the total pension liability at June 30, 2016 were3.22% and 3.98% for TPAF and PERS, respectively. For TPAF and PERS, the respective single blended discount rates were based on the long-term expected rate of return on pension plan investments of 7.65%, and a municipal bond rate of 2.85% as of June 30, 2016, based on the Bond Buyer Go 20-Bond Municipal Bond Index which includes tax-exempt general obligation municipal bonds with an average rating of AA/Aa or higher. The projection of cash flows used to determine the discount rates for TPAF and PERS assumed that contributions from plan members will be made at the current member contribution rates and that contributions from employers will be made based on the contribution rate in the most recent fiscal year. Based on those assumptions, the plan’s fiduciary net position was projected to be available to make projected future benefit payments of current plan members through 2029 for TPAF and 2034 for PERS. Therefore, the long-term expected rate of return on plan investments was applied to projected benefit payments through 2029 for TPAF and 2034 for PERS, and the municipal bond rate was applied to projected benefit payments after that date in determining the total pension liability.
64

24750 Notes to Financial Statements (Cont'd)
Note 9: PENSION PLANS (CONT’D)
Sensitivity of School District’s Proportionate Share of Net Pension Liability to Changes in the Discount Rate
Teachers’ Pension and Annuity Fund (TPAF) - As previously mentioned, TPAF, has a special funding situation where the State pays 100% of the School District’s annual required contribution. As such, the proportionate share of the net pension liability as of June 30, 2016, the pension plans measurement date, attributable to the School District is $0, and the State of New Jersey’s proportionate share of thenet pension liability, attributable to the School District, using a discount rate of 3.22%, as well as using a discount rate that is 1% lower or 1% higher than the current rates used is as follows:
1% Current 1%
Decrease Discount Rate Increase
(2.22%) (3.22%) (4.22%)
School District's Proportionate Share of the Net Pension Liability -$ -$ -$
State of New Jersey's Proportionate Share of Net Pension Liability associated with the School District 53,782,839.00 45,035,825.00 37,892,759.00
53,782,839.00$ 45,035,825.00$ 37,892,759.00$
TPAF
Public Employees' Retirement System (PERS) - The following presents the School District’s proportionate share of the net pension liability at June 30, 2016, the plans measurement date, calculated using a discount rate of 3.98%, as well as what the School District’s proportionate share of the net pension liability would be if it were calculated using a discount rate that is 1% lower or 1% higher than the current rates used:
1% Current 1%
Decrease Discount Rate Increase
(2.98%) (3.98%) (4.98%)
School District's Proportionate Share of the Net Pension Liability 7,145,343.00$ 5,831,108.00$ 4,746,094.00$
PERS
Pension Plan Fiduciary Net Position
For purposes of measuring the net pension liability, deferred outflows of resources and deferred inflows of resources related to pensions, and pension expense, information about the respective fiduciary net position of the TPAF and PERS and additions to/deductions from TPAF and PERS’s respective fiduciary net position have been determined on the same basis as they are reported by TPAF and PERS. Accordingly, benefit payments (including refunds of employee contributions) are recognized when due and payable in accordance with the benefit terms. Investments are reported at fair value. For additional information about TPAF and PERS, please refer to the plan’s Comprehensive Annual Financial Report (CAFR) which can be found at www.nj.gov/treasury/pensions.
65

24750 Notes to Financial Statements (Cont'd)
Note 10:SCHOOL EMPLOYEES HEALTH BENEFITS PROGRAM
P.L. 1987, c.384 of P.L. 1990, c.6 required Teachers’ Pensions and Annuity Fund (“TPAF”) and the Public Employees’ Retirement System (“PERS”), respectively, to fund post-retirement medical benefits for those State employees who retire after accumulating 25 years of credited service or on a disability retirement. P.L. 2007, c.103 amended the law to eliminate the funding of postemployment medical benefits through the TPAF and PERS. It created separate funds outside of the pension plans for the funding and payment of postemployment medical benefits for retired State employees and retired educational employees. As of June 30, 2016, there were 110,512 retirees receiving postemploymentmedical benefits, and the State contributed $1.37 billion on their behalf. The cost of these benefits is funded through contributions by the State in accordance with P.L. 1994, c.62. Funding of post-retirement medical premiums changed from a pre-funding basis to a pay-as-you-go basis beginning in fiscal year 1994.
The State is also responsible for the cost attributable to P.L. 1992 c.126, which provides free health benefits to members of PERS and the Alternate Benefit Program who retire from a board of education or county college with 25 years of service. The State paid $231.2 million toward Chapter 126 benefits for 20,045 eligible retired members in fiscal year 2016.
Note 11:ON-BEHALF PAYMENTS
For the fiscal year ended June 30, 2017, the School District has recognized as revenues and expenditures on-behalf payments made by the State for normal costs and post-retirement medical costs related to TPAF, in the fund financial statements. The amounts recognized as revenues and expenditures in the fund financial statements for normal costs, non-contributory insurance, post-retirement medical costs, and long-term disability insurance were $613,090.00, $22,214.00, $529,352.00, and $1,574.00, respectively.
Note 12:RISK MANAGEMENT
The School District is exposed to various risks of loss related to torts; theft of, damage to, and destruction of assets; errors and omissions; injuries to employees; and natural disasters.
New Jersey Unemployment Compensation Insurance - The School District has elected to fund its New Jersey Unemployment Compensation Insurance under the "Benefit Reimbursement Method". Under this plan, the School District is required to reimburse the New Jersey Unemployment Trust Fund for benefits paid to its former employees and charged to its account with the State. The School District is billed quarterly for amounts due to the State. The following is a summary of the activity of the School District's private-purpose trust fund for the unemployment claims for the current and previous two fiscal years:
Fiscal Year Employee Claims Ending
Ended June 30, Contributions Incurred Balance
2017 13,392.79$ 141.26$ 91,537.53$ 2016 12,908.69 196.13 78,286.00 2015 12,418.87 27,000.09 65,573.44
66

24750 Notes to Financial Statements (Cont'd)
Note 12:RISK MANAGEMENT (CONT’D)
Joint Insurance Pool - The School District is a member of the Burlington County Insurance Pool Joint Insurance Fund. The Fund provides its members with the following coverage:
Workers' Compensation and Employer's LiabilityLiability other than Motor VehiclesProperty Damage other than Motor VehiclesMotor Vehicles
Contributions to the Fund, including a reserve for contingencies, are payable in two installments and are based on actuarial assumptions determined by the Fund's actuary. The Commissioner of Insurance may order additional assessments to supplement the Fund's claim, loss retention, or administrative accounts to assure the payment of the Fund's obligations.
A complete schedule of insurance coverage can be found in the statistical section of this Comprehensive Annual Financial Report. The Fund provides the School District with the following coverage:
Property - Blanket Building and GroundsGeneral and Automobile LiabilityCrimeEducators Legal LiabilityWorkers’ CompensationPollutionCyber LiabilityViolent Malicious Acts
Contributions to the Fund, are payable in an annual premium and is based on actuarial assumptions determined by the Fund's actuary. The School District’s agreement with the Pool provides that the Pool will be self-sustaining through member premiums and will reinsure through the Municipal Excess Liability Joint Insurance Fund for claims in excess of $50,000.00 to $200,000.00 based on the line of coverage for each insured event.
For more information regarding claims, coverages and deductibles, the Fund publishes its own financial report for the year ended December 31, 2016, which can be obtained from:
Burlington County Municipal Joint Insurance FundP.O. Box 489
Marlton, New Jersey 08053
Note 13:DEFERRED COMPENSATION
The School District offers its employees a choice of six deferred compensation plans created in accordance with Internal Revenue Code Sections 403(b) and 457. The plans, which are administered by the entities listed below, permit participants to defer a portion of their salary until future years. Amounts deferred under the plans are not available to employees until termination, retirement, death, or unforeseeable emergency. The plan administrators are as follows:
AXA EquitableING Life Insurance & AnnuityLincoln Investment Planning
MetLifeVanguardAIG Valic
67

24750 Notes to Financial Statements (Cont'd)
Note 14:COMPENSATED ABSENCES
The School District accounts for compensated absences (e.g., unused vacation, sick leave) as directed by Governmental Accounting Standards Board Statement No. 16 (GASB 16), Accounting for Compensated Absences. A liability for compensated absences attributable to services already rendered and not contingent on a specific event that is outside the control of the employer and employee is accrued as employees earn the rights to the benefits.
School District employees who are employed for ten months are entitled to ten paid sick leave days per fiscal school year. School District employees who are employed for twelve months are entitled to twelve paid sick leave days per fiscal school year. Unused sick leave may be accumulated and carried forward to the subsequent years. School District employees are entitled to two personal days which may be carried forward to subsequent years. Vacation days not used during the year may not be accumulated and carried forward. Benefits paid in any future year will be calculated according to formulas outlined in the School Districts' agreements with the various employee unions and included in the current years' budget.
The liability for vested compensated absences is recorded within those funds as the benefits accrue to employees. At June 30, 2017, the liability for compensated absences reported on the government-wide statement of net position was $420,048.76.
Note 15: INTERFUND RECEIVABLES, PAYABLES, AND TRANSFERS
The composition of interfund balances as of June 30, 2017 is as follows:
Interfunds Interfunds
Fund Receivable Payable
General 64,446.41$ Special Revenue 62,775.41$ Fiduciary 5,000.55 6,671.55
69,446.96$ 69,446.96$
The interfund receivables and payables above predominately resulted from payments made by certain funds on behalf of other funds. During the fiscal year 2018, the School District expects to liquidate such interfunds, depending upon the availability of cash flow.
General
Fund
Transfer Out:
Capital Projects Fund 179,815.50$
Transfer In:
The purpose of transfer from the capital projects fund to the general fund was to return the remaining capital reserve funds on completed projects which were used to fund capital projects.
68

24750 Notes to Financial Statements (Cont'd)
Note 16:CONTINGENCIES
Grantor Agencies - Amounts received or receivable from grantor agencies could be subject to audit and adjustment by grantor agencies. Any disallowed claims, including amounts already collected, may constitute a liability of the applicable funds. The amount, if any, of expenditures which may be disallowed by the grantor cannot be determined at this time, although the School District expects such amount, if any, to be immaterial.
Litigation - The School District is a defendant in several legal proceedings that are in various stages of litigation. It is believed that the outcome, or exposure to the School District, from such litigation is either unknown or potential losses, if any, would not be material to the financial statements.
Note 17:CONCENTRATIONS
The School District depends on financial resources flowing from, or associated with, both the federal government and the State of New Jersey. As a result of this dependency, the School District is subject to changes in specific flows of intergovernmental revenues based on modifications to federal and State laws and federal and State appropriations.
Note 18:DEFICIT FUND BALANCES
The School District has a deficit fund balance of $130,493.32 in the general fund as of June 30, 2017 as reported in the fund statements (modified accrual basis). N.J.S.A. 18A:22-44.2 provides that in the event a state school aid payment is not made until the following school budget year, school districts must record the delayed one or more June state aid payments as revenue, for budget purposes only, in the current school budget year. The statute provides legal authority for school districts to recognize this revenue in the current budget year. For intergovernmental transactions, GASB Statement No. 33 requires that recognition (revenue, expenditure, asset, liability) should be in symmetry, i.e., if one government recognizes an asset, the other government recognizes a liability. Since the State is recording the June state aid payments in the subsequent fiscal year, the School District cannot recognize the June state aid payment on the GAAP financial statements until the year the State records the payable. Due to the timing difference of recording the June state aid payments, the general fund balance deficit does not alone indicate that the School District is facing financial difficulties.
Pursuant to N.J.S.A. 18A:22-44.2 any negative unassigned general fund balance that is reported as a direct result from a delay in the June payments of state aid until the following fiscal year, is not considered in violation of New Jersey statute and regulation nor in need of corrective action. The School District deficit in the GAAP funds statements of $130,493.32 is less than the June state aid payments.
Note 19:FUND BALANCES
RESTRICTED
As stated in note 1, the restricted fund balance classification includes amounts that are restricted to specific purposes. Such restrictions, or constraints, are placed on the use of resources by either of the following: (1) externally imposed by creditors, grantors, contributors, or laws or regulations of other governments; or (2) imposed by law through constitutional provisions or enabling legislation. Specific restrictions of the School District’s fund balance are summarized as follows:
69

24750 Notes to Financial Statements (Cont'd)
Note 19:FUND BALANCES (CONT’D)
RESTRICTED (CONT’D)
General Fund
For Excess Surplus - In accordance with N.J.S.A. 18A:7F-7, as amended, the designation of restricted fund balance - excess surplus is the result of a required calculation pursuant to the New Jersey Comprehensive Educational Improvement and Financing Act of 1996 (CEIFA). New Jersey school districts are required to restrict general fund balance at the fiscal year end of June 30 if they did not appropriate a required minimum amount as budgeted fund balance in their subsequent years’ budget. The excess fund balance at June 30, 2017 is $487,612.66. Additionally, $1,054,243.81 of excess fund balance generated during 2015-2016 has been restricted and designated for utilization in the 2017-2018 budget.
For Capital Reserve Account - As of June 30, 2017, the balance in the capital reserve account is $1,282,555.99. These funds are restricted for future capital outlay expenditures for capital projects in the School District’s approved Long Range Facilities Plan (LRFP).
For Maintenance Reserve Account - As of June 30, 2017, the balance in the maintenance reserve account is $131,416.35. These funds are restricted for the required maintenance of school facilities in accordance with the Educational Facilities Construction and Financing Act (EFCFA) (N.J.S.A. 18A:7G-9) as amended by P.L. 2004, c. 73 (S1701).
For Emergency Reserve - As of June 30, 2017, the balance in the emergency reserve is $63.11. These funds are restricted for the purpose of financing unanticipated general fund expenditures required for a thorough and efficient education in accordance with N.J.S.A. 18A:7F-41c(1). The balance of the restricted fund balance is not permitted to exceed $250,000.00, or one percent (1%) of the School District’s general fund budget up to a maximum of $1,000,000.00, whichever is greater. Deposits may be made to the emergency reserve account at budget time, or by board resolution at year end of any unanticipated revenue or unexpended line item appropriation, or both. Withdrawals from the emergency reserve require approval by the Commissioner.
Debt Service Fund - In accordance with N.J.A.C. 6A:23A-8.6, a district board of education shall appropriate annually all debt service fund balances in the budget certified for taxes unless expressly authorized and documented by the voters in a bond referendum. As a result, the School District has $38,866.68 of debt service fund balance at June 30, 2017.
ASSIGNED
As stated in note 1, the assigned fund balance classification includes amounts that are constrained by the School District’s intent to be used for specific purposes, but are neither restricted nor committed. Specific assignments of the School District’s fund balance are summarized as follows:
General Fund
For Subsequent Year’s Expenditures - The School District has appropriated and included as an anticipated revenue for the fiscal year ending June 30, 2018, $3,683.19 of general fund balance at June 30, 2017.
Other Purposes - As of June 30, 2017, the School District had $44,070.77 of encumbrances outstanding for purchase orders and contracts signed by the School District, but not completed, as of the close of the fiscal year.
70

24750 Notes to Financial Statements (Cont'd)
Note 19:FUND BALANCES (CONT’D)
UNASSIGNED
As stated in note 1, the unassigned fund balance classification represents fund balance that has not been restricted, committed, or assigned to specific purposes. The School District’s unassigned fund balance is summarized as follows:
General Fund - As of June 30, 2017, the general fund balance deficit of $130,493.32 was unassigned.
71

REQUIRED SUPPLEMENTARY INFORMATIONPART II

BUDGETARY COMPARISON SCHEDULES

24750
Exh
ibit
C-1
Varia
nce
Orig
inal
Budg
etFi
nal
Posi
tive
(Neg
ativ
e)Bu
dget
Mod
ifica
tions
Budg
etAc
tual
Fina
l to
Actu
alR
EVEN
UES
:Lo
cal S
ourc
es:
Loca
l Tax
Lev
y7,
380,
663.
00$
7,
380,
663.
00$
7,
380,
663.
00$
Tu
ition
from
Indi
vidu
als
15,0
00.0
015
,000
.00
24,8
19.4
59,
819.
45$
Tuiti
on fr
om O
ther
LEA
's w
ithin
the
Stat
e62
,500
.00
62,5
00.0
084
,923
.34
22,4
23.3
4In
tere
st E
arne
d on
Cap
ital R
eser
ve F
unds
1,17
7.82
1,17
7.82
Inte
rest
Ear
ned
on E
mer
genc
y R
eser
ve F
unds
0.07
0.07
Inte
rest
Ear
ned
on M
aint
enan
ce R
eser
ve F
unds
195.
9219
5.92
Ren
ts a
nd R
oyal
ties
37,0
00.0
037
,000
.00
37,0
00.0
0U
nres
trict
ed M
isce
llane
ous
Rev
enue
s60
,000
.00
60,0
00.0
057
,412
.32
(2,5
87.6
8)
Tota
l - L
ocal
Sou
rces
7,55
5,16
3.00
-7,
555,
163.
007,
586,
191.
9231
,028
.92
Stat
e So
urce
s:Eq
ualiz
atio
n Ai
d3,
405,
745.
003,
405,
745.
003,
405,
745.
00C
ateg
oric
al S
peci
al E
duca
tion
Aid
465,
120.
0046
5,12
0.00
465,
120.
00C
ateg
oric
al S
ecur
ity A
id66
,283
.00
66,2
83.0
066
,283
.00
Adju
stm
ent A
id1,
177,
271.
001,
177,
271.
001,
177,
271.
00C
ateg
oric
al T
rans
porta
tion
Aid
337,
115.
0033
7,11
5.00
337,
115.
00PA
RC
C R
eadi
ness
Aid
7,33
0.00
7,33
0.00
7,33
0.00
Per P
upil
Gro
wth
Aid
7,33
0.00
7,33
0.00
7,33
0.00
Prof
essi
onal
Lea
rnin
g C
omm
unity
Aid
7,15
0.00
7,15
0.00
7,15
0.00
Non
-Pub
lic T
rans
porta
tion
Aid
2,84
9.00
2,84
9.00
Extra
ordi
nary
Aid
57,0
00.0
057
,000
.00
183,
597.
0012
6,59
7.00
Rei
mbu
rsed
TPA
F So
cial
Sec
urity
Con
tribu
tions
(non
-bud
gete
d)38
8,73
2.52
388,
732.
52O
n-be
half
TPAF
Med
ical
Con
tribu
tions
(non
-bud
gete
d)52
9,35
2.00
529,
352.
00O
n-be
half
TPAF
Pen
sion
Con
tribu
tions
(non
-bud
gete
d)61
3,09
0.00
613,
090.
00O
n-be
half
TPAF
Non
-Con
tribu
tory
Insu
ranc
e (n
on-b
udge
ted)
22,2
14.0
022
,214
.00
On-
beha
lf TP
AF L
ong-
Term
Dis
abilit
y In
sura
nce
(non
-bud
gete
d)1,
574.
001,
574.
00
Tota
l - S
tate
Sou
rces
5,53
0,34
4.00
-5,
530,
344.
007,
214,
752.
521,
684,
408.
52
Tota
l Rev
enue
s13
,085
,507
.00
-13
,085
,507
.00
14,8
00,9
44.4
41,
715,
437.
44
(Con
tinue
d)
TA
BE
RN
AC
LE
TO
WN
SH
IP S
CH
OO
L D
IST
RIC
T
Req
uire
d Su
pple
men
tary
Info
rmat
ion
Gen
eral
Fun
d
For t
he F
isca
l Yea
r End
ed J
une
30, 2
017
Budg
etar
y C
ompa
rison
Sch
edul
e
74

24750
Exh
ibit
C-1
Varia
nce
Orig
inal
Budg
etFi
nal
Posi
tive
(Neg
ativ
e)Bu
dget
Mod
ifica
tions
Budg
etAc
tual
Fina
l to
Actu
al
TA
BE
RN
AC
LE
TO
WN
SH
IP S
CH
OO
L D
IST
RIC
T
Req
uire
d Su
pple
men
tary
Info
rmat
ion
Gen
eral
Fun
d
For t
he F
isca
l Yea
r End
ed J
une
30, 2
017
Budg
etar
y C
ompa
rison
Sch
edul
e
EXPE
ND
ITU
RES
:G
ENER
AL C
UR
REN
T EX
PEN
SE:
Reg
ular
Pro
gram
s - I
nstru
ctio
n:Sa
larie
s of
Tea
cher
s:Ki
nder
garte
n27
3,15
7.00
$
4,
942.
08$
278,
099.
08$
277,
364.
97$
734.
11$
Gra
des
1 - 5
1,82
1,96
3.00
(8,0
44.4
0)1,
813,
918.
601,
813,
909.
359.
25G
rade
s 6
- 81,
226,
848.
00(9
5,08
9.58
)1,
131,
758.
421,
131,
373.
6638
4.76
Reg
ular
Pro
gram
s - H
ome
Inst
ruct
ion:
Sala
ries
of T
each
ers
12,0
00.0
0(5
,560
.00)
6,44
0.00
3,33
2.74
3,10
7.26
Purc
hase
d Pr
ofes
sion
al/E
duca
tiona
l Ser
vice
s26
6.00
10,5
00.0
010
,766
.00
8,30
5.24
2,46
0.76
Reg
ular
Pro
gram
s - U
ndis
tribu
ted
Inst
ruct
ion:
Oth
er S
alar
ies
for I
nstru
ctio
n31
,881
.00
4,42
8.14
36,3
09.1
435
,414
.88
894.
26Pu
rcha
sed
Prof
essi
onal
/Edu
catio
nal S
ervi
ces
23,2
50.0
010
3,83
5.35
127,
085.
3512
6,75
0.48
334.
87O
ther
Pur
chas
ed S
ervi
ces
267,
700.
008,
450.
0027
6,15
0.00
276,
086.
7863
.22
Gen
eral
Sup
plie
s25
4,52
0.92
(27,
030.
00)
227,
490.
9222
7,49
0.33
0.59
Text
book
s31
,500
.00
(3,5
00.0
0)28
,000
.00
27,5
09.6
849
0.32
Oth
er O
bjec
ts50
0.00
500.
0010
0.00
400.
00
Tota
l Reg
ular
Pro
gram
s3,
943,
585.
92(7
,068
.41)
3,93
6,51
7.51
3,92
7,63
8.11
8,87
9.40
Spec
ial E
duca
tion:
Lear
ning
and
/or L
angu
age
Dis
abilit
ies:
Sala
ries
of T
each
ers
100,
073.
00(3
8,75
5.78
)61
,317
.22
58,9
69.0
02,
348.
22O
ther
Sal
arie
s fo
r Ins
truct
ion
46,1
58.0
04,
344.
0850
,502
.08
48,6
61.2
31,
840.
85Pu
rcha
sed
Prof
essi
onal
/Edu
catio
nal S
ervi
ces
19,7
77.2
019
,777
.20
19,1
56.4
362
0.77
Gen
eral
Sup
plie
s 1,
500.
00(1
7.13
)1,
482.
871,
175.
0630
7.81
Tota
l - L
earn
ing
and/
or L
angu
age
Dis
abilit
ies
147,
731.
00(1
4,65
1.63
)13
3,07
9.37
127,
961.
725,
117.
65
Mul
tiple
Dis
abili
ties:
Sala
ries
of T
each
ers
64,2
07.0
083
7.64
65,0
44.6
462
,580
.87
2,46
3.77
Oth
er S
alar
ies
for I
nstru
ctio
n12
5,23
8.00
(5,3
16.8
1)11
9,92
1.19
117,
549.
652,
371.
54Pu
rcha
sed
Prof
essi
onal
/Edu
catio
nal S
ervi
ces
10,1
50.0
010
,150
.00
3,98
8.76
6,16
1.24
Gen
eral
Sup
plie
s1,
500.
00(6
1.07
)1,
438.
931,
438.
93
Tota
l - M
ultip
le D
isab
ilitie
s19
0,94
5.00
5,60
9.76
196,
554.
7618
5,55
8.21
10,9
96.5
5
Res
ourc
e R
oom
/Cen
ter:
Sala
ries
of T
each
ers
625,
631.
0013
2,93
8.42
758,
569.
4273
1,37
9.60
27,1
89.8
2O
ther
Sal
arie
s fo
r Ins
truct
ion
33,2
50.0
0(1
1,80
0.00
)21
,450
.00
19,5
55.0
01,
895.
00Pu
rcha
sed
Prof
essi
onal
/Edu
catio
nal S
ervi
ces
36,7
43.0
536
,743
.05
34,1
05.8
82,
637.
17G
ener
al S
uppl
ies
4,30
0.00
4,30
0.00
4,17
5.42
124.
58
Tota
l - R
esou
rce
Roo
m/C
ente
r66
3,18
1.00
157,
881.
4782
1,06
2.47
789,
215.
9031
,846
.57
(Con
tinue
d)
75

24750
Exh
ibit
C-1
Varia
nce
Orig
inal
Budg
etFi
nal
Posi
tive
(Neg
ativ
e)Bu
dget
Mod
ifica
tions
Budg
etAc
tual
Fina
l to
Actu
al
TA
BE
RN
AC
LE
TO
WN
SH
IP S
CH
OO
L D
IST
RIC
T
Req
uire
d Su
pple
men
tary
Info
rmat
ion
Gen
eral
Fun
d
For t
he F
isca
l Yea
r End
ed J
une
30, 2
017
Budg
etar
y C
ompa
rison
Sch
edul
e
EXPE
ND
ITU
RES
(CO
NT'
D):
GEN
ERAL
CU
RR
ENT
EXPE
NSE
(CO
NT'
D):
Pres
choo
l Dis
abilit
ies
- Par
t-Tim
e:Sa
larie
s of
Tea
cher
s97
,280
.00
$(2
,767
.60)
$94
,512
.40
$88
,825
.24
$5,
687.
16$
Oth
er S
alar
ies
for I
nstru
ctio
n52
,799
.00
51.1
152
,850
.11
51,1
51.4
61,
698.
65Pu
rcha
sed
Prof
essi
onal
/Edu
catio
nal S
ervi
ces
7,50
0.00
7,50
0.00
5,06
5.46
2,43
4.54
Gen
eral
Sup
plie
s1,
500.
0047
8.20
1,97
8.20
1,97
8.20
Tota
l - P
resc
hool
Dis
abilit
ies
- Par
t-Tim
e15
1,57
9.00
5,26
1.71
156,
840.
7114
7,02
0.36
9,82
0.35
Tota
l - S
peci
al E
duca
tion
1,15
3,43
6.00
154,
101.
311,
307,
537.
31
1,
249,
756.
19
57
,781
.12
Basi
c Sk
ills/R
emed
ial:
Sala
ries
of T
each
ers
337,
774.
00(8
4,27
0.94
)25
3,50
3.06
249,
056.
414,
446.
65Pu
rcha
sed
Prof
essi
onal
/Edu
catio
nal S
ervi
ces
9,16
4.40
9,16
4.40
6,90
8.91
2,25
5.49
Gen
eral
Sup
plie
s2,
000.
002,
000.
001,
761.
1523
8.85
Tota
l - B
asic
Ski
lls/R
emed
ial
339,
774.
00(7
5,10
6.54
)26
4,66
7.46
257,
726.
476,
940.
99
Bilin
gual
Edu
catio
n:G
ener
al S
uppl
ies
500.
00-
500.
00-
500.
00
Scho
ol S
pons
ored
Coc
urric
ular
Act
iviti
es -
Inst
ruct
ion:
Sala
ries
57,3
89.0
0(7
,294
.34)
50,0
94.6
620
,094
.66
30,0
00.0
0Pu
rcha
sed
Serv
ices
(300
-500
ser
ies)
2,50
0.00
2,50
0.00
2,50
0.00
Supp
lies
and
Mat
eria
ls1,
500.
001,
500.
001,
382.
1111
7.89
Oth
er O
bjec
ts50
0.00
500.
0027
5.00
225.
00
Tota
l - S
choo
l Spo
nsor
ed C
ocur
ricul
ar A
ctiv
ities
- In
stru
ctio
n61
,889
.00
(7,2
94.3
4)54
,594
.66
21,7
51.7
732
,842
.89
Scho
ol- S
pons
ored
Ath
letic
s - I
nstru
ctio
n:Sa
larie
s40
,035
.00
12,1
86.0
952
,221
.09
32,2
21.0
920
,000
.00
Purc
hase
d Se
rvic
es (3
00-5
00 s
erie
s)5,
000.
00(3
50.0
0)4,
650.
004,
385.
0026
5.00
Supp
lies
and
Mat
eria
ls3,
500.
003,
500.
003,
379.
7012
0.30
Oth
er O
bjec
ts75
0.00
(650
.00)
100.
0075
.00
25.0
0
Tota
l - S
choo
l Spo
nsor
ed A
thle
tics
- Ins
truct
ion
49,2
85.0
011
,186
.09
60,4
71.0
940
,060
.79
20,4
10.3
0
Und
istri
bute
d Ex
pend
iture
s - I
nstru
ctio
n:Tu
ition
to O
ther
LEA
s w
ithin
Sta
te-R
egul
ar27
,276
.50
5,07
8.00
32,3
54.5
032
,201
.47
153.
03Tu
ition
to C
SSD
& R
eg. D
ay S
choo
ls70
,852
.00
70,8
52.0
070
,852
.00
Tuiti
on to
Priv
ate
Scho
ol fo
r the
Dis
able
d w
ithin
Sta
te17
7,00
0.00
(84,
721.
65)
92,2
78.3
589
,509
.98
2,76
8.37
Tota
l Und
istri
bute
d Ex
pend
iture
s - I
nstru
ctio
n20
4,27
6.50
(8,7
91.6
5)19
5,48
4.85
192,
563.
452,
921.
40
Tota
l - In
stru
ctio
n5,
752,
746.
4267
,026
.46
5,81
9,77
2.88
5,68
9,49
6.78
130,
276.
10
(Con
tinue
d)
76

24750
Exh
ibit
C-1
Varia
nce
Orig
inal
Budg
etFi
nal
Posi
tive
(Neg
ativ
e)Bu
dget
Mod
ifica
tions
Budg
etAc
tual
Fina
l to
Actu
al
TA
BE
RN
AC
LE
TO
WN
SH
IP S
CH
OO
L D
IST
RIC
T
Req
uire
d Su
pple
men
tary
Info
rmat
ion
Gen
eral
Fun
d
For t
he F
isca
l Yea
r End
ed J
une
30, 2
017
Budg
etar
y C
ompa
rison
Sch
edul
e
EXPE
ND
ITU
RES
(CO
NT'
D):
GEN
ERAL
CU
RR
ENT
EXPE
NSE
(CO
NT'
D):
Und
istri
bute
d Ex
pend
iture
s:At
tend
ance
and
Soc
ial W
ork:
Sala
ries
35,6
50.0
0$
512.
97$
36,1
62.9
7$
36,1
62.9
7$
-
Hea
lth S
ervi
ces:
Sala
ries
161,
340.
005,
300.
8316
6,64
0.83
165,
849.
5279
1.31
$Pu
rcha
sed
Prof
essi
onal
and
Tec
hnic
al S
ervi
ces
8,50
0.00
10,3
50.0
018
,850
.00
6,46
6.72
12,3
83.2
8O
ther
Pur
chas
ed S
ervi
ces
1,00
0.00
(200
.00)
800.
0075
3.26
46.7
4Su
pplie
s an
d M
ater
ials
7,70
0.00
(3,6
50.0
0)4,
050.
003,
775.
3927
4.61
Tota
l Hea
lth S
ervi
ces
178,
540.
0011
,800
.83
190,
340.
8317
6,84
4.89
13,4
95.9
4
Spee
ch, O
T, P
T &
Rel
ated
Ser
vice
s:Sa
larie
s15
6,55
2.00
(37,
073.
41)
119,
478.
5911
8,94
9.69
528.
90Pu
rcha
sed
Prof
essi
onal
- Ed
ucat
iona
l Ser
vice
s50
,000
.00
53,7
00.0
010
3,70
0.00
101,
596.
542,
103.
46Su
pplie
s an
d M
ater
ials
3,00
0.00
3,00
0.00
2,68
5.01
314.
99
Tota
l Spe
ech,
OT,
PT&
Rel
ated
Ser
vice
s20
9,55
2.00
16,6
26.5
922
6,17
8.59
223,
231.
242,
947.
35
Oth
er S
uppo
rt Se
rvic
es-S
tude
nts-
Rel
ated
Ser
vice
s:Sa
larie
s15
4,38
8.00
3,99
9.10
158,
387.
1015
7,76
2.10
625.
00Pu
rcha
sed
Prof
essi
onal
- Ed
ucat
iona
l Ser
vice
s51
,645
.00
66,3
73.7
511
8,01
8.75
113,
500.
004,
518.
75
Tota
l - O
ther
Sup
port
Serv
ices
-Stu
dent
s-R
elat
ed S
ervi
ces
206,
033.
0070
,372
.85
276,
405.
8527
1,26
2.10
5,14
3.75
Gui
danc
e:Sa
larie
s of
Oth
er P
rofe
ssio
nal S
taff
167,
818.
00(3
,529
.85)
164,
288.
1516
4,28
8.15
-
Chi
ld S
tudy
Tea
ms:
Sala
ries
of O
ther
Pro
fess
iona
l Sta
ff22
6,48
3.00
(33,
646.
72)
192,
836.
2818
8,28
8.53
4,54
7.75
Sala
ries
of S
ecre
taria
l and
Cle
rical
Ass
ista
nts
53,9
84.0
0(7
,000
.00)
46,9
84.0
046
,058
.88
925.
12Pu
rcha
sed
Prof
essi
onal
- Ed
ucat
iona
l Ser
vice
s48
,000
.00
(3,2
00.0
0)44
,800
.00
31,2
38.1
213
,561
.88
Oth
er P
urch
ased
Ser
vice
s (4
00-5
00 s
erie
s)5,
000.
00(4
,200
.00)
800.
0074
0.00
60.0
0Su
pplie
s an
d M
ater
ials
7,00
0.00
7,00
0.00
6,90
3.79
96.2
1O
ther
Obj
ects
2,95
0.00
(973
.75)
1,97
6.25
1,96
0.00
16.2
5
Tota
l Oth
er S
uppo
rt Se
rvic
es -
Stud
ents
- R
egul
ar34
3,41
7.00
(49,
020.
47)
294,
396.
5327
5,18
9.32
19,2
07.2
1
(Con
tinue
d)
77

24750
Exh
ibit
C-1
Varia
nce
Orig
inal
Budg
etFi
nal
Posi
tive
(Neg
ativ
e)Bu
dget
Mod
ifica
tions
Budg
etAc
tual
Fina
l to
Actu
al
TA
BE
RN
AC
LE
TO
WN
SH
IP S
CH
OO
L D
IST
RIC
T
Req
uire
d Su
pple
men
tary
Info
rmat
ion
Gen
eral
Fun
d
For t
he F
isca
l Yea
r End
ed J
une
30, 2
017
Budg
etar
y C
ompa
rison
Sch
edul
e
EXPE
ND
ITU
RES
(CO
NT'
D):
GEN
ERAL
CU
RR
ENT
EXPE
NSE
(CO
NT'
D):
Und
istri
bute
d Ex
pend
iture
s (C
ont'd
):Im
prov
emen
t of I
nstru
ctio
n Se
rvic
es/O
ther
Sup
port
Serv
ices
- In
stru
ctio
nal S
taff:
Sa
larie
s of
Sec
reta
ry a
nd C
leric
al A
ssis
tant
s46
,579
.00
$46
,579
.00
$46
,153
.92
$42
5.08
$
Oth
er S
alar
ies
100,
280.
0010
0,28
0.00
99,9
54.9
232
5.08
Pu
rcha
sed
Prof
essi
onal
- Ed
ucat
iona
l Ser
vice
s47
,500
.00
47,5
00.0
038
,254
.50
9,24
5.50
O
ther
Pur
chas
ed S
ervi
ces
500.
0050
0.00
175.
0032
5.00
Su
pplie
s an
d M
ater
ials
20,0
00.0
0(5
08.3
5)$
19,4
91.6
512
,205
.83
7,28
5.82
Oth
er O
bjec
ts
3,50
0.00
3,50
0.00
2,23
8.00
1,26
2.00
Tota
l Im
prov
emen
t of I
nstru
ctio
n Se
rvic
es/O
ther
:Su
ppor
t Ser
vice
s - I
nstru
ctio
nal S
taff
218,
359.
00(5
08.3
5)21
7,85
0.65
198,
982.
1718
,868
.48
Educ
atio
nal M
edia
Ser
vice
s/Sc
hool
Lib
rary
:Sa
larie
s22
5,87
0.00
(26,
632.
06)
199,
237.
9419
8,76
2.55
475.
39Sa
larie
s of
Tec
hnol
ogy
Coo
rdin
ator
s70
,040
.00
70,0
40.0
067
,999
.92
2,04
0.08
Purc
hase
d Pr
ofes
sion
al a
nd T
echn
ical
Ser
vice
s25
,500
.00
25,5
00.0
025
,373
.98
126.
02O
ther
Pur
chas
ed S
ervi
ces
7,20
0.00
7,20
0.00
6,76
4.30
435.
70Su
pplie
s an
d M
ater
ials
29,8
40.0
41,
400.
0031
,240
.04
30,6
47.2
459
2.80
Oth
er O
bjec
ts70
0.00
700.
0069
5.00
5.00
Tota
l Edu
catio
nal M
edia
Ser
vice
s/Sc
hool
Lib
rary
332,
950.
0496
7.94
333,
917.
9833
0,24
2.99
3,67
4.99
Inst
ruct
iona
l Sta
ff Tr
aini
ng S
ervi
ces:
Purc
hase
d Pr
ofes
sion
al- E
duca
tiona
l Ser
vice
s4,
600.
00-
4,60
0.00
1,07
7.00
3,52
3.00
Supp
ort S
ervi
ces
Gen
eral
Adm
inis
tratio
n:Sa
larie
s20
5,20
0.00
(38,
794.
71)
166,
405.
2916
6,40
4.37
0.92
Lega
l Ser
vice
s38
,170
.00
(7,0
00.0
0)31
,170
.00
25,6
60.9
65,
509.
04Au
dit F
ees
21,2
50.0
021
,250
.00
20,6
90.0
056
0.00
Arch
itect
ural
/ En
gine
erin
g Se
rvic
es24
,000
.00
(5,5
58.9
9)18
,441
.01
15,6
47.7
92,
793.
22O
ther
Pur
chas
ed P
rofe
ssio
nal S
ervi
ces
30,0
00.0
023
,800
.00
53,8
00.0
052
,730
.81
1,06
9.19
Com
mun
icat
ions
/Tel
epho
ne58
,000
.00
7,72
3.99
65,7
23.9
964
,746
.59
977.
40BO
E O
ther
Pur
chas
ed S
ervi
ces
2,40
0.00
2,40
0.00
1,59
9.00
801.
00M
isce
llane
ous
Purc
hase
d Se
rvic
es14
,000
.00
(5,8
65.0
0)8,
135.
006,
622.
521,
512.
48G
ener
al S
uppl
ies
2,00
0.00
2,00
0.00
4,00
0.00
3,48
2.53
517.
47BO
E In
-Hou
se T
rain
ing/
Mee
ting
Supp
lies
200.
003,
500.
003,
700.
0016
4.00
3,53
6.00
Judg
emen
ts A
gain
st th
e Sc
hool
Dis
trict
50,0
00.0
050
,000
.00
47,1
25.0
02,
875.
00M
isce
llane
ous
Expe
nditu
res
3,60
0.00
1,20
0.00
4,80
0.00
4,50
1.22
298.
78BO
E M
embe
rshi
p D
ues
and
Fees
9,00
0.00
9,00
0.00
7,74
8.52
1,25
1.48
Tota
l Sup
port
Serv
ices
Gen
eral
Adm
inis
tratio
n45
7,82
0.00
(18,
994.
71)
438,
825.
2941
7,12
3.31
21,7
01.9
8
(Con
tinue
d)
78

24750
Exh
ibit
C-1
Varia
nce
Orig
inal
Budg
etFi
nal
Posi
tive
(Neg
ativ
e)Bu
dget
Mod
ifica
tions
Budg
etAc
tual
Fina
l to
Actu
al
TA
BE
RN
AC
LE
TO
WN
SH
IP S
CH
OO
L D
IST
RIC
T
Req
uire
d Su
pple
men
tary
Info
rmat
ion
Gen
eral
Fun
d
For t
he F
isca
l Yea
r End
ed J
une
30, 2
017
Budg
etar
y C
ompa
rison
Sch
edul
e
EXPE
ND
ITU
RES
(CO
NT'
D):
GEN
ERAL
CU
RR
ENT
EXPE
NSE
(CO
NT'
D):
Und
istri
bute
d Ex
pend
iture
s (C
ont'd
):Su
ppor
t Ser
vice
s Sc
hool
Adm
inis
tratio
n:Sa
larie
s of
Prin
cipa
ls/A
ssis
tant
Prin
cipa
ls/P
rogr
am D
irect
ors
241,
768.
00$
241,
768.
00$
241,
564.
63$
203.
37$
Sala
ries
of O
ther
Pro
fess
iona
ls S
taff
24,7
50.0
0(1
0.25
)$
24,7
39.7
524
,739
.75
Sala
ries
of S
ecre
taria
l and
Cle
rical
Ass
ista
nts
77,2
24.0
09,
557.
5386
,781
.53
85,8
34.9
594
6.58
Purc
hase
d Pr
ofes
sion
al a
nd T
echn
ical
Ser
vice
s9,
000.
009,
000.
008,
137.
3086
2.70
Oth
er P
urch
ased
Ser
vice
s1,
100.
001,
100.
0015
0.00
950.
00Su
pplie
s an
d M
ater
ials
5,50
0.00
(600
.00)
4,90
0.00
2,24
4.07
2,65
5.93
Oth
er O
bjec
ts3,
500.
00(1
,000
.00)
2,50
0.00
1,64
0.00
860.
00
Tota
l Sup
port
Serv
ices
Sch
ool A
dmin
istra
tion
353,
842.
0016
,947
.28
370,
789.
2836
4,31
0.70
6,47
8.58
Cen
tral S
ervi
ces:
Sala
ries
210,
936.
002,
363.
8721
3,29
9.87
212,
527.
6077
2.27
Unu
sed
Vaca
tion
Paym
ent t
o Te
rmin
ated
/Ret
ired
Staf
f3,
200.
003,
200.
003,
166.
5833
.42
Purc
hase
d Te
chni
cal S
ervi
ces
34,0
00.0
0(5
,600
.00)
28,4
00.0
028
,137
.09
262.
91M
isce
llane
ous
Purc
hase
d Se
rvic
es60
0.00
810.
001,
410.
001,
176.
1623
3.84
Supp
lies
and
Mat
eria
ls2,
500.
001,
425.
003,
925.
003,
873.
5551
.45
Mis
cella
neou
s Ex
pend
iture
s1,
200.
00(8
10.0
0)39
0.00
358.
0032
.00
Tota
l Cen
tral S
ervi
ces
249,
236.
001,
388.
8725
0,62
4.87
249,
238.
981,
385.
89
Adm
inis
tratio
n of
Info
rmat
ion
Tech
nolo
gy:
Purc
hase
d Te
chni
cal S
ervi
ces
12,4
80.0
012
,480
.00
12,4
79.9
80.
02O
ther
Pur
chas
ed S
ervi
ces
900.
0090
0.00
231.
0066
9.00
Supp
lies
and
Mat
eria
ls1,
250.
00(1
,250
.00)
Tota
l Adm
inis
tratio
n of
Info
rmat
ion
Tech
nolo
gy2,
150.
0011
,230
.00
13,3
80.0
012
,710
.98
669.
02
Req
uire
d M
aint
enan
ce fo
r Sch
ool F
acilit
ies:
Sala
ries
185,
133.
00(1
3,07
9.91
)17
2,05
3.09
172,
053.
09U
nuse
d Va
catio
n Pa
ymen
t to
Term
inat
ed/R
etire
d St
aff
5,60
7.00
5,60
7.00
5,60
6.46
0.54
Cle
anin
g, R
epai
r & M
aint
enan
ce S
ervi
ces
66,7
78.0
022
8,65
4.09
295,
432.
0927
1,88
7.26
23,5
44.8
3G
ener
al S
uppl
ies
59,6
00.0
0(2
3,96
6.69
)35
,633
.31
29,7
58.1
15,
875.
20
Tota
l - R
equi
red
Mai
nten
ance
for S
choo
l Fac
ilitie
s31
1,51
1.00
197,
214.
4950
8,72
5.49
479,
304.
9229
,420
.57
Cus
todi
al S
ervi
ces:
Sala
ries
426,
307.
00(2
5,06
2.45
)40
1,24
4.55
398,
232.
053,
012.
50Pu
rcha
sed
Prof
essi
onal
and
Tec
hnic
al S
ervi
ces
29,3
95.0
0(1
,500
.00)
27,8
95.0
018
,061
.00
9,83
4.00
Cle
anin
g, R
epai
r, an
d M
aint
enan
ce S
ervi
ces
11,7
00.0
011
,700
.00
8,43
7.20
3,26
2.80
Oth
er P
urch
ased
Pro
perty
Ser
vice
s3,
024.
003,
024.
002,
264.
5075
9.50
Insu
ranc
e72
,000
.00
7,85
0.00
79,8
50.0
079
,802
.96
47.0
4M
isce
llane
ous
Purc
hase
d Se
rvic
es3,
895.
00(5
00.0
0)3,
395.
0077
0.00
2,62
5.00
Gen
eral
Sup
plie
s66
,963
.00
(9,5
47.0
3)57
,415
.97
49,9
64.5
97,
451.
38En
ergy
(Nat
ural
Gas
)13
5,00
0.00
(24,
139.
33)
110,
860.
6784
,087
.21
26,7
73.4
6En
ergy
(Ele
ctric
ity)
264,
000.
0014
4.23
264,
144.
2326
4,14
4.23
Tota
l - C
usto
dial
Ser
vice
s1,
012,
284.
00(5
2,75
4.58
)95
9,52
9.42
905,
763.
7453
,765
.68
(Con
tinue
d)
79

24750
Exh
ibit
C-1
Varia
nce
Orig
inal
Budg
etFi
nal
Posi
tive
(Neg
ativ
e)Bu
dget
Mod
ifica
tions
Budg
etAc
tual
Fina
l to
Actu
al
TA
BE
RN
AC
LE
TO
WN
SH
IP S
CH
OO
L D
IST
RIC
T
Req
uire
d Su
pple
men
tary
Info
rmat
ion
Gen
eral
Fun
d
For t
he F
isca
l Yea
r End
ed J
une
30, 2
017
Budg
etar
y C
ompa
rison
Sch
edul
e
EXPE
ND
ITU
RES
(CO
NT'
D):
GEN
ERAL
CU
RR
ENT
EXPE
NSE
(CO
NT'
D):
Und
istri
bute
d Ex
pend
iture
s (C
ont'd
):C
are
and
Upk
eep
of G
roun
dsPu
rcha
sed
Prof
essi
onal
and
Tec
hnic
al S
ervi
ce11
,485
.00
$(4
,802
.97)
$6,
682.
03$
2,69
4.00
$3,
988.
03$
Cle
anin
g, R
epai
r, an
d M
aint
enan
ce S
ervi
ces
18,6
00.0
018
,600
.00
16,1
98.5
02,
401.
50G
ener
al S
uppl
y11
,800
.00
11,8
00.0
09,
811.
901,
988.
10
Tota
l - C
are
and
Upk
eep
of G
roun
ds41
,885
.00
(4,8
02.9
7)37
,082
.03
28,7
04.4
08,
377.
63
Secu
rity:
Sala
ries
61,3
50.0
0(1
4,89
8.60
)46
,451
.40
46,3
68.2
483
.16
Purc
hase
d Pr
ofes
sion
al a
nd T
echn
ical
Ser
vice
5,00
0.00
5,00
0.00
239.
164,
760.
84C
lean
ing,
Rep
air,
and
Mai
nten
ance
5,50
0.00
(1,6
28.5
5)3,
871.
4525
0.50
3,62
0.95
Gen
eral
Sup
plie
s2,
100.
00(2
,000
.00)
100.
0010
0.00
Tota
l Sec
urity
73,9
50.0
0(1
8,52
7.15
)55
,422
.85
46,8
57.9
08,
564.
95
Tota
l - O
pera
tion
and
Mai
nten
ance
of P
lant
Ser
vice
s1,
439,
630.
0012
1,12
9.79
1,56
0,75
9.79
1,46
0,63
0.96
100,
128.
83
Stud
ent T
rans
porta
tion
Serv
ices
:Sa
larie
s of
Non
- Ins
truct
iona
l Aid
es
44,3
59.0
0(4
1,01
2.50
)3,
346.
502,
953.
5739
2.93
Sala
ries
for P
upil
Tran
spor
tatio
n (B
etw
een
Hom
e &
Scho
ol) -
Reg
ular
282,
276.
0021
,550
.54
303,
826.
5430
2,82
6.54
1,00
0.00
Sala
ries
for P
upil
Tran
spor
tatio
n (B
etw
een
Hom
e &
Scho
ol) -
Spe
cial
16,0
00.0
0(3
,458
.14)
12,5
41.8
611
,541
.86
1,00
0.00
Sala
ries
for P
upil
Tran
spor
tatio
n (O
ther
than
Bet
wee
n H
ome
& Sc
hool
)5,
000.
006,
793.
6211
,793
.62
11,7
93.6
2M
anag
emen
t Fee
- ES
C &
CTS
A Pr
ogra
ms
500.
0050
0.00
158.
6334
1.37
Oth
er P
urch
ased
Pro
fess
iona
l and
Tec
hnic
al S
ervi
ces
3,50
0.00
3,50
0.00
3,45
5.50
44.5
0C
lean
ing,
Rep
air,
and
Mai
nten
ance
Ser
vice
s44
,375
.00
(2,0
00.0
0)42
,375
.00
30,5
00.2
711
,874
.73
Leas
e Pu
rcha
se P
aym
ents
- Sc
hool
Bus
ed47
,173
.00
47,1
73.0
047
,172
.00
1.00
AIL
for N
on-P
ublic
12,6
60.0
012
,660
.00
3,17
2.57
9,48
7.43
Con
tr. S
ev (O
th. T
han
Bet h
ome
& Sc
h)55
0.00
550.
0055
0.00
Con
tract
Ser
vice
s (S
peci
al E
d.)
12,0
00.0
08,
000.
0020
,000
.00
18,3
88.8
01,
611.
20C
ontra
cted
Ser
vice
s (R
egul
ar S
tude
nts)
- ES
C's
and
CTS
A's
30,0
00.0
030
,000
.00
23,3
38.7
96,
661.
21C
ontra
cted
Ser
vice
s (S
peci
al E
duca
tion
Stud
ents
) - E
SC's
and
CTS
A's
10,0
00.0
0(5
00.0
0)9,
500.
009,
500.
00M
isce
llane
ous
Purc
hase
d Se
rvic
es -
Tran
spor
tatio
n1,
500.
001,
500.
001,
360.
0014
0.00
Gen
eral
Sup
plie
s 50
0.00
(500
.00)
Tran
spor
tatio
n Su
pplie
s13
0,50
0.00
(24,
475.
00)
106,
025.
0010
0,67
5.90
5,34
9.10
Oth
er O
bjec
ts1,
000.
001,
114.
032,
114.
031,
893.
0022
1.03
Tota
l Stu
dent
Tra
nspo
rtatio
n Se
rvic
es64
1,89
3.00
(34,
487.
45)
607,
405.
5555
9,23
1.05
48,1
74.5
0
Una
lloca
ted
Bene
fits
- Em
ploy
ee B
enef
its:
Soci
al S
ecur
ity C
ontri
butio
ns20
0,00
0.00
200,
000.
0019
6,99
2.35
3,00
7.65
Oth
er R
etire
men
t Con
tribu
tions
- PE
RS
210,
000.
00(1
1,00
0.00
)19
9,00
0.00
176,
260.
0022
,740
.00
Wor
kmen
's C
ompe
nsat
ion
90,0
00.0
0(6
,000
.00)
84,0
00.0
083
,531
.00
469.
00H
ealth
Ben
efits
2,49
5,14
0.00
(263
,208
.57)
2,23
1,93
1.43
2,18
4,79
3.76
47,1
37.6
7Tu
ition
Rei
mbu
rsem
ent
59,5
00.0
059
,500
.00
32,0
08.9
527
,491
.05
Oth
er E
mpl
oyee
Ben
efits
233,
310.
00(7
1,79
1.43
)16
1,51
8.57
159,
726.
251,
792.
32U
nusu
ed S
ick
Paym
ent t
o Te
rmin
ated
/Ret
ired
Staf
f70
,801
.00
70,8
01.0
059
,397
.50
11,4
03.5
0
Tota
l una
lloca
ted
Bene
fits
- Em
ploy
ee B
enef
its3,
287,
950.
00(2
81,1
99.0
0)3,
006,
751.
002,
892,
709.
8111
4,04
1.19
(Con
tinue
d)
80

24750
Exh
ibit
C-1
Varia
nce
Orig
inal
Budg
etFi
nal
Posi
tive
(Neg
ativ
e)Bu
dget
Mod
ifica
tions
Budg
etAc
tual
Fina
l to
Actu
al
TA
BE
RN
AC
LE
TO
WN
SH
IP S
CH
OO
L D
IST
RIC
T
Req
uire
d Su
pple
men
tary
Info
rmat
ion
Gen
eral
Fun
d
For t
he F
isca
l Yea
r End
ed J
une
30, 2
017
Budg
etar
y C
ompa
rison
Sch
edul
e
EXPE
ND
ITU
RES
(CO
NT'
D):
GEN
ERAL
CU
RR
ENT
EXPE
NSE
(CO
NT'
D):
Und
istri
bute
d Ex
pend
iture
s (C
ont'd
):TP
AF C
ontri
butio
ns:
Rei
mbu
rsed
T.P
.A.F
. Soc
ial S
ecur
ity C
ontri
butio
ns (n
on-b
udge
ted)
388,
732.
52$
(388
,732
.52)
$
O
n-be
half
TPAF
Med
ical
Con
tribu
tions
(non
-bud
gete
d)52
9,35
2.00
(529
,352
.00)
On-
beha
lf TP
AF P
ensi
on C
ontri
butio
ns (n
on-b
udge
ted)
613,
090.
00(6
13,0
90.0
0)O
n-be
half
TPAF
Non
-Con
tribu
tory
Insu
ranc
e (n
on-b
udge
ted)
22,2
14.0
0(2
2,21
4.00
)O
n-be
half
TPAF
Lon
g-Te
rm D
isab
ility
Insu
ranc
e (n
on-b
udge
ted)
1,57
4.00
(1,5
74.0
0)
Tota
l TPA
F C
ontri
butio
ns-
--
1,55
4,96
2.52
(1,5
54,9
62.5
2)
To
tal U
ndis
tribu
ted
Expe
nses
8,33
3,71
6.54
$
(145
,554
.36)
$
8,
188,
162.
18$
9,
380,
762.
59
(1
,192
,600
.41)
Tota
l Exp
endi
ture
s - C
urre
nt E
xpen
se13
,882
,186
.46
(69,
736.
25)
13,8
12,4
50.2
114
,877
,695
.92
(1,0
65,2
45.7
1)
CAP
ITAL
OU
TLAY
:Eq
uipm
ent:
Gra
des
6-8
10,0
00.0
0(2
,500
.00)
7,50
0.00
3,90
0.18
3,59
9.82
Und
istri
bute
d Ex
pend
ed -
Supp
ort S
ervi
ces
- Ins
t. St
aff
2,50
0.00
2,50
0.00
2,34
9.00
151.
00Sc
hool
Bus
es -
Reg
ular
234,
000.
0023
4,00
0.00
233,
275.
6072
4.40
Tota
l - E
quip
men
t10
,000
.00
234,
000.
0024
4,00
0.00
239,
524.
784,
475.
22
Asse
ssm
ent f
or D
ebt S
ervi
ce o
n SD
A Fu
ndin
g 49
,076
.00
-49
,076
.00
49,0
76.0
0-
Tota
l Cap
ital O
utla
y59
,076
.00
234,
000.
0029
3,07
6.00
288,
600.
784,
475.
22
Tota
l Exp
endi
ture
s13
,941
,262
.46
164,
263.
7514
,105
,526
.21
15,1
66,2
96.7
0(1
,060
,770
.49)
(Con
tinue
d)
81

24750
Exh
ibit
C-1
Varia
nce
Orig
inal
Budg
etFi
nal
Posi
tive
(Neg
ativ
e)Bu
dget
Mod
ifica
tions
Budg
etAc
tual
Fina
l to
Actu
al
TA
BE
RN
AC
LE
TO
WN
SH
IP S
CH
OO
L D
IST
RIC
T
Req
uire
d Su
pple
men
tary
Info
rmat
ion
Gen
eral
Fun
d
For t
he F
isca
l Yea
r End
ed J
une
30, 2
017
Budg
etar
y C
ompa
rison
Sch
edul
e
Calc
ula
tio
n o
f D
efi
cie
ncy o
f R
even
ues U
nd
er
Exp
en
dit
ure
s:
Exce
ss (D
efic
ienc
y) o
f Rev
enue
s O
ver (
Und
er) E
xpen
ditu
res
(855
,755
.46)
$
(1
64,2
63.7
5)$
(1,0
20,0
19.2
1)$
(3
65,3
52.2
6)$
(654
,666
.95)
$
Oth
er F
inan
cing
Sou
rces
(Use
s):
Can
cella
tion
of C
apita
l Pro
ject
s Tr
ansf
erre
d to
Cap
ital R
eser
ve-
--
179,
815.
50(1
79,8
15.5
0)
Exce
ss (D
efic
ienc
y) o
f Rev
enue
s an
d O
ther
Fin
anci
ng S
ourc
esO
ver (
Und
er) E
xpen
ditu
res
and
Oth
er F
inan
cing
Use
s(8
55,7
55.4
6)(1
64,2
63.7
5)(1
,020
,019
.21)
(185
,536
.76)
834,
482.
45
Fund
Bal
ance
s, J
uly
13,
590,
855.
32-
3,59
0,85
5.32
3,59
0,85
5.32
-
Fund
Bal
ance
s, J
une
302,
735,
099.
86$
(1
64,2
63.7
5)$
2,57
0,83
6.11
$
3,40
5,31
8.56
$
834,
482.
45$
Recap
itu
lati
on
:
Res
trict
ed F
und
Bala
nce:
Exce
ss S
urpl
us48
7,61
2.66
$
Ex
cess
Sur
plus
-- D
esig
nate
d fo
r Sub
sequ
ent Y
ear's
Exp
endi
ture
s1,
054,
243.
81
Em
erge
ncy
Res
erve
63.1
1C
apita
l Res
erve
1,28
2,55
5.99
Mai
nten
ance
Res
erve
131,
416.
35As
sign
ed F
und
Bala
nce:
Oth
er P
urpo
ses
44,0
70.7
7D
esig
nate
d fo
r Sub
sequ
ent Y
ear's
Exp
endi
ture
s3,
683.
19U
nass
igne
d Fu
nd B
alan
ce40
1,67
2.68
3,40
5,31
8.56
Rec
onci
liatio
n to
Gov
ernm
enta
l Fun
ds S
tate
men
ts (G
AAP)
:La
st S
tate
Aid
Pay
men
t Not
Rec
ogni
zed
on G
AAP
Basi
s(5
32,1
66.0
0)
Fund
Bal
ance
per
Gov
ernm
enta
l Fun
ds (G
AAP)
2,87
3,15
2.56
$
82

Ex
hib
it C
-2
TA
BE
RN
AC
LE
TO
WN
SH
IP S
CH
OO
L D
IST
RIC
TR
equi
red
Supp
lem
enta
ry In
form
atio
nSp
ecia
l Rev
enue
Fun
dBu
dget
ary
Com
paris
on S
ched
ule
For t
he F
isca
l Yea
r End
ed J
une
30, 2
017
Varia
nce
Orig
inal
Budg
et
Fina
lPo
sitiv
e (N
egat
ive)
Budg
etTr
ansf
ers
Budg
etAc
tual
Fina
l to
Actu
alR
EVEN
UES
:
Loca
l Sou
rces
:To
shib
a G
rant
1,00
0.00
$1,
000.
00$
997.
91$
2.09
$Ta
bern
acle
Edu
catio
n Fo
unda
tion
Gra
nt2,
000.
002,
000.
001,
996.
063.
94Su
stai
nabl
e Je
rsey
Sm
all S
choo
l Gra
nt10
,000
.00
10,0
00.0
07,
848.
452,
151.
55
Tota
l - L
ocal
Sou
rces
-13
,000
.00
13,0
00.0
010
,842
.42
2,15
7.58
Fede
ral S
ourc
es:
Title
I, P
art A
45,7
18.0
0$
17,9
00.0
063
,618
.00
63,5
39.9
578
.05
Title
II, P
art A
21,4
40.0
0(9
,325
.00)
12,1
15.0
012
,115
.00
Title
III
1,93
5.00
1,93
5.00
1,93
5.00
I.D.E
.A.,
Part
B, B
asic
168,
072.
0011
,385
.00
179,
457.
0017
9,35
7.00
100.
00I.D
.E.A
., Pa
rt B,
Pre
scho
ol
8,06
5.00
8,06
5.00
7,52
2.14
542.
86
Tota
l - F
eder
al S
ourc
es23
5,23
0.00
29,9
60.0
026
5,19
0.00
264,
469.
0972
0.91
Tota
l Rev
enue
s23
5,23
0.00
$42
,960
.00
$27
8,19
0.00
$27
5,31
1.51
$2,
878.
49$
EXPE
ND
ITU
RES
:
Inst
ruct
ion:
Sala
ries
of T
each
ers
32,3
38.4
9$
18,2
75.5
1$
50,6
14.0
0$
50,6
14.0
0$
Tuiti
on16
7,97
8.34
11,3
78.6
617
9,35
7.00
179,
357.
00G
ener
al S
uppl
ies
5,06
5.16
18,0
23.8
423
,089
.00
20,2
10.5
12,
878.
49$
Tota
l Ins
truct
ion
205,
381.
9947
,678
.01
253,
060.
0025
0,18
1.51
2,87
8.49
Supp
ort S
ervi
ces:
Pers
onal
Ser
vice
s - E
mpl
oyee
Ben
efits
8,40
8.01
3,29
1.99
11,7
00.0
011
,700
.00
Purc
hase
d Pr
ofes
sion
al -
Educ
atio
nal S
ervi
ces
21,4
40.0
0(1
7,44
0.00
)4,
000.
004,
000.
00O
ther
Pur
chas
ed S
ervi
ces
5,31
0.00
5,31
0.00
5,31
0.00
Supp
lies
and
Mat
eria
ls4,
120.
004,
120.
004,
120.
00
Tota
l Sup
port
Serv
ices
29,8
48.0
1(4
,718
.01)
25,1
30.0
025
,130
.00
-
Tota
l Exp
endi
ture
s23
5,23
0.00
$42
,960
.00
$27
8,19
0.00
$27
5,31
1.51
$2,
878.
49$
24750
83
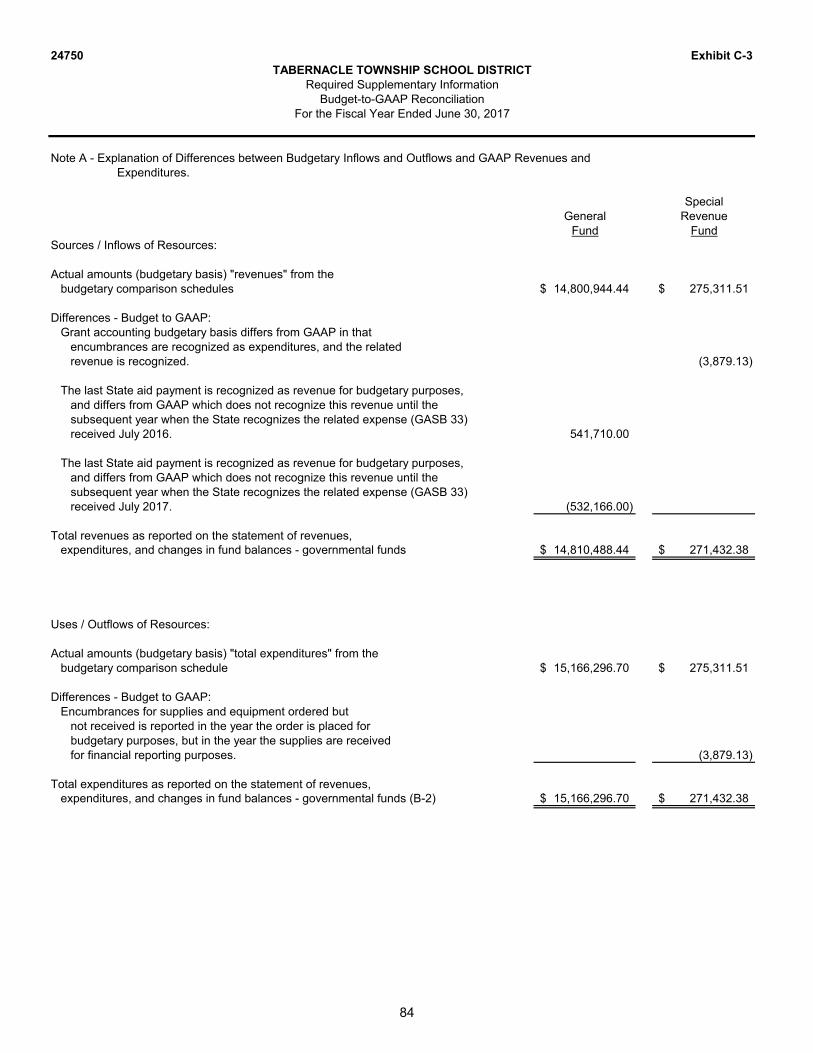
24750 Exhibit C-3TABERNACLE TOWNSHIP SCHOOL DISTRICT
Required Supplementary InformationBudget-to-GAAP Reconciliation
For the Fiscal Year Ended June 30, 2017
Note A - Explanation of Differences between Budgetary Inflows and Outflows and GAAP Revenues andExpenditures.
SpecialGeneral Revenue
Fund FundSources / Inflows of Resources:
Actual amounts (budgetary basis) "revenues" from the budgetary comparison schedules 14,800,944.44$ 275,311.51$
Differences - Budget to GAAP: Grant accounting budgetary basis differs from GAAP in that encumbrances are recognized as expenditures, and the related revenue is recognized. (3,879.13)
The last State aid payment is recognized as revenue for budgetary purposes, and differs from GAAP which does not recognize this revenue until the subsequent year when the State recognizes the related expense (GASB 33) received July 2016. 541,710.00
The last State aid payment is recognized as revenue for budgetary purposes, and differs from GAAP which does not recognize this revenue until the subsequent year when the State recognizes the related expense (GASB 33) received July 2017. (532,166.00)
Total revenues as reported on the statement of revenues, expenditures, and changes in fund balances - governmental funds 14,810,488.44$ 271,432.38$
Uses / Outflows of Resources:
Actual amounts (budgetary basis) "total expenditures" from the budgetary comparison schedule 15,166,296.70$ 275,311.51$
Differences - Budget to GAAP: Encumbrances for supplies and equipment ordered but not received is reported in the year the order is placed for budgetary purposes, but in the year the supplies are received for financial reporting purposes. (3,879.13)
Total expenditures as reported on the statement of revenues, expenditures, and changes in fund balances - governmental funds (B-2) 15,166,296.70$ 271,432.38$
84
REQUIRED SUPPLEMENTARY INFORMATIONPART III

24750 Exhibit L-1
TABERNACLE TOWNSHIP SCHOOL DISTRICT
2016 2015 2014 2013
School District's Proportion of the Net Pension Liability 0.0196882949% 0.0199201657% 0.0207264664% 0.0230472074%
School District's Proportionate Share of the Net Pension Liability 5,831,108.00$ 4,471,678.00$ 3,880,561.00$ 4,404,779.00$
School District's Covered Payroll (Plan Measurement Period) 1,406,200.00$ 1,528,200.00$ 1,502,512.00$ 1,589,872.00$
School District's Proportionate Share of the Net PensionLiability as a Percentage of its Covered Payroll 414.67% 292.61% 258.27% 277.05%
Plan Fiduciary Net Position as a Percentage of the TotalPension Liability 40.14% 47.93% 52.08% 48.72%
Note: This schedule is presented to illustrate the requirement to show information for 10 years. However, until a full 10-year trend is compiled, this presentation will only include information for those years for which information is available.
Required Supplementary InformationSchedule of the School District's Proportionate Share of the Net Pension Liability
Public Employees' Retirement System (PERS)Last Four Plan Years
Measurement Date Ending June 30,
86

24750 Exhibit L-2
TABERNACLE TOWNSHIP SCHOOL DISTRICT
2017 2016 2015 2014
Contractually Required Contribution 177,924.00$ 174,908.00$ 171,260.00$ 170,866.00$
Contributions in Relation to theContractually Required Contribution (177,924.00) (174,908.00) (171,260.00) (170,866.00)
Contribution Deficiency (Excess) - - - -
School District's Covered Payroll (Fiscal Year) 1,376,373.00$ 1,408,876.00$ 1,340,477.00$ 1,387,013.00$
Contributions as a Percentage ofSchool District's Covered Payroll 12.93% 12.41% 12.78% 12.32%
Note: This schedule is presented to illustrate the requirement to show information for 10 years. However, until a full 10-year trend is compiled, this presentation will only include information for those years for which information is available.
Required Supplementary InformationSchedule of the School District's ContributionsPublic Employees' Retirement System (PERS)
Last Four Plan Years
Fiscal Year Ended June 30,
87

24750 Exhibit L-3
TABERNACLE TOWNSHIP SCHOOL DISTRICT
2016 2015 2014 2013
School District's Proportion of the Net Pension Liability 0.00% 0.00% 0.00% 0.00%
State's Proportion of the Net Pension LiabilityAssociated with the School District 100.00% 100.00% 100.00% 100.00%
100.00% 100.00% 100.00% 100.00%
School District's Proportionate Share of the Net Pension Liability - - - -
State's Proportionate Share of the School District'sNet Pension Liability 45,035,825.00$ 33,371,372.00$ 29,985,708.00$ 28,836,785.00$
45,035,825.00$ 33,371,372.00$ 29,985,708.00$ 28,836,785.00$
School District's Covered Payroll (Plan Measurement Period) 6,750,468.00$ 6,774,808.00$ 6,160,916.00$ 6,590,036.00$
School District's Proportionate Share of the Net PensionLiability as a Percentage of its Covered Payroll 0.00% 0.00% 0.00% 0.00%
State's Proportionate Share of the Net PensionLiability as a Percentage of its Covered Payroll 667.15% 492.58% 486.71% 437.58%
Plan Fiduciary Net Position as a Percentage of the TotalPension Liability 22.33% 28.71% 33.64% 33.76%
Note: This schedule is presented to illustrate the requirement to show information for 10 years. However, until a full 10-year trend is compiled, this presentation will only include information for those years for which information is available.
Required Supplementary InformationSchedule of the School District's Proportionate Share of the Net Pension Liability
Teachers' Pension and Annuity Fund (TPAF)Last Four Plan Years
Measurement Date Ending June 30,
88

24750 Exhibit L-4
TABERNACLE TOWNSHIP SCHOOL DISTRICT
This schedule is not applicable.
The School District is not required to make any contributions towards TPAF.
There is a special funding situation where the State of New Jersey pays 100% of the required contributions.
Required Supplementary InformationSchedule of the School District's ContributionsTeachers' Pension and Annuity Fund (TPAF)
Last Ten Fiscal Years
89

24750 Exhibit L-5
TABERNACLE TOWNSHIP SCHOOL DISTRICT
Teachers' Pension and Anuity Fund (TPAF)
Changes in Benefit Terms - None
Public Employees' Retirement System (PERS)
Changes in Benefit Terms - None
Notes to Required Supplementary Information - Part IIIFor the Fiscal Year Ended June 30, 2017
Changes in Assumptions - For 2016, the discount rate changed to 3.98%, the long-term expected rate of return changed to 7.65%, demographic assumptions were revised in accordance with the results of the July 1, 2011 - June 30, 2014 experience study and the mortality improvement scale incorporated the plan actuary's modified MP-2014 projection scale. Further, salary increases were assumed to increase between 1.65% and 4.15% (based on age) through fiscal year 2026 and 2.65% and 5.15% (based on age) for each fiscal year thereafter. For 2015, the discount rate changed to 4.90%. In addition, the social security wage base was set at $118,500 for 2015, increasing 4.00% per annum, compounded annually and the 401(a)(17) pay limit was set at $265,000 for 2015, increasing 3.00% per annum, compounded annually. For 2014, the discount rate was 5.39%.
Changes in Assumptions - For 2016, the discount rate changed to 3.22% and the long-term expected rate of return changed to 7.65%. Further, the demographic assumptions were revised to reflect those recommended on the basis of the July 1, 2012 - June 30, 2015 experience study. For 2015, the discount rate changed to 4.13%. For 2014, the discount rate was at 4.68%.
90

OTHER SUPPLEMENTARY INFORMATION

SPECIAL REVENUE FUND

24750
Exh
ibit
E-1
Tota
lBr
ough
tTo
tal
Title
I, P
art A
Title
II, P
art A
Title
III
Basi
cPr
esch
ool
Forw
ard
REV
ENU
ES:
Fede
ral S
ourc
es26
4,46
9.09
$
63,5
39.9
5$
12,1
15.0
0$
1,93
5.00
$
17
9,35
7.00
$
7,52
2.14
$
Lo
cal S
ourc
es10
,842
.42
10
,842
.42
$
Tota
l Rev
enue
s27
5,31
1.51
$
63,5
39.9
5$
12,1
15.0
0$
1,93
5.00
$
17
9,35
7.00
$
7,52
2.14
$
10
,842
.42
$
EXPE
ND
ITU
RES
:
Inst
ruct
ion:
Sa
larie
s of
Tea
cher
s50
,614
.00
$
45
,000
.00
$
5,
614.
00$
Tu
ition
179,
357.
0017
9,35
7.00
$
G
ener
al S
uppl
ies
20,2
10.5
1
6,83
9.95
620.
00$
1,90
8.14
10,8
42.4
2$
Tota
l Ins
truct
ion
250,
181.
5151
,839
.95
-
620.
0017
9,35
7.00
7,52
2.14
10,8
42.4
2
Supp
ort S
ervi
ces:
Pe
rson
al S
ervi
ces
- Em
ploy
ee B
enef
its11
,700
.00
11,7
00.0
0
Pu
rcha
sed
Prof
essi
onal
- Ed
ucat
iona
l Ser
vice
s4,
000.
004,
000.
00$
O
ther
Pur
chas
ed S
ervi
ces
5,31
0.00
3,99
5.00
1,31
5.00
Su
pplie
s an
d M
ater
ials
4,12
0.00
4,12
0.00
Tota
l Sup
port
Serv
ices
25,1
30.0
0
11,7
00.0
0
12,1
15.0
0
1,31
5.00
--
-
Tota
l Exp
endi
ture
s27
5,31
1.51
$
63,5
39.9
5$
12,1
15.0
0$
1,93
5.00
$
17
9,35
7.00
$
7,52
2.14
$
10
,842
.42
$
(Con
tinue
d)
I.D.E
.A. P
art B
TA
BE
RN
AC
LE
TO
WN
SH
IP S
CH
OO
L D
IST
RIC
T
Spec
ial R
even
ue F
und
Com
bini
ng S
ched
ule
of R
even
ues
and
Expe
nditu
res
- Bud
geta
ry B
asis
Fo
r the
Fis
cal Y
ear E
nded
Jun
e 30
, 201
7
N.C
.L.B
.
93

24750
Exh
ibit
E-1
Tota
lTa
bern
acle
Sust
aina
ble
Car
ried
Tosh
iba
Educ
atio
nJe
rsey
Sm
all
Forw
ard
Gra
ntFo
unda
tion
Gra
ntSc
hool
Gra
nt
REV
ENU
ES:
Fede
ral S
ourc
esLo
cal S
ourc
es10
,842
.42
$
99
7.91
$1,
996.
06$
7,84
8.45
$
Tota
l Rev
enue
s10
,842
.42
$
99
7.91
$1,
996.
06$
7,84
8.45
$
EXPE
ND
ITU
RES
:
Inst
ruct
ion:
Sa
larie
s of
Tea
cher
s
Tuiti
on
Gen
eral
Sup
plie
s10
,842
.42
$
99
7.91
$1,
996.
06$
7,84
8.45
$
Tota
l Ins
truct
ion
10,8
42.4
299
7.91
1,99
6.06
7,84
8.45
Supp
ort S
ervi
ces:
Pe
rson
al S
ervi
ces
- Em
ploy
ee B
enef
its
Purc
hase
d Pr
ofes
sion
al -
Educ
atio
nal S
ervi
ces
O
ther
Pur
chas
ed S
ervi
ces
Su
pplie
s an
d M
ater
ials
Tota
l Sup
port
Serv
ices
--
--
Tota
l Exp
endi
ture
s10
,842
.42
$
99
7.91
$1,
996.
06$
7,84
8.45
$
TA
BE
RN
AC
LE
TO
WN
SH
IP S
CH
OO
L D
IST
RIC
T
Spec
ial R
even
ue F
und
Com
bini
ng S
ched
ule
of R
even
ues
and
Expe
nditu
res
- Bud
geta
ry B
asis
Fo
r the
Fis
cal Y
ear E
nded
Jun
e 30
, 201
7
94

CAPITAL PROJECTS FUND

24750
Ex
hib
it F
-1
Cap
ital P
roje
cts
Fund
Sum
mar
y Sc
hedu
le o
f Pro
ject
Exp
endi
ture
sFo
r the
Fis
cal Y
ear E
nded
Jun
e 30
, 201
7
Expe
nditu
res
to D
ate
Une
xpen
ded
Orig
inal
Prio
rC
urre
ntBa
lanc
ePr
ojec
t Titl
e / I
ssue
Dat
eAp
prop
riatio
nsYe
ars
Year
Can
cella
tions
June
30,
201
7
Tabe
rnac
le E
lem
enta
ry S
choo
l Gen
erat
or
Stat
e Pr
ojec
t # 5
130-
060-
14-1
003-
G04
7/1/
2015
336,
255.
00$
21
,937
.50
$
-
314,
317.
50$
-
Tran
sfer
red
to G
ener
al F
und
-- C
apita
l Res
erve
179,
815.
50$
C
ance
llatio
n of
SD
A G
rant
s13
4,50
2.00
31
4,31
7.50
$
TA
BE
RN
AC
LE
TO
WN
SH
IP S
CH
OO
L D
IST
RIC
T
96

Exhibit F-2
Capital Projects FundSummary Schedule of Revenues, Expenditures, and Changes in Fund Balances
For the Fiscal Year Ended June 30, 2017
Revenues and Other Financing SourcesState Sources--SDA GrantBond Proceeds and TransfersTransfer from Capital Reserve
Total Revenues -
Expenditures and Other Financing UsesPurchased Professional and Technical ServicesMiscellaneousConstruction ServicesGeneral SuppliesOther Objects
Total Expenditures -
Other Financing Uses:Cancellation of SDA Grant 134,502.00$ Transfer to General Fund -- Capital Reserve 179,815.50
Total Other Financing Uses 314,317.50$
Total Expenditures and Other Financing Uses 314,317.50
Excess (Deficiency) of Revenues Over (Under) Expenditures (314,317.50)
Fund Balance -- July 1 314,317.50
Fund Balance -- June 30 -
Reconciliation to Governmental Funds Statements (GAAP):
Fund Balance as of June 30, 2017 -
SDA Grant Revenue Not Recognized on GAAP Basis
Fund Balance per Governmental Funds (GAAP) -
Note: For F-2 Exhibits, SDA Grant awards are recognized as revenue
and encumbrances are not included in expenditures.
TABERNACLE TOWNSHIP SCHOOL DISTRICT24750
97

Exhibit F-2a
Capital Projects FundSchedule of Project Revenues, Expenditures, Project Balance and Project Status
For the Inception and for the Fiscal Year Ended June 30, 2017
RevisedAuthorized
Prior Years Current Year Totals Cost
Revenues and Other Financing Sources
State Sources--SDA Grant 134,502.00$ (134,502.00)$ Bond Proceeds and TransfersTransfer from Capital Reserve 201,753.00 201,753.00$ 201,753.00$
Total Revenues 336,255.00 (134,502.00) 201,753.00 201,753.00
Expenditures and Other Financing Uses
Purchased Professional and Technical Services 21,937.50 21,937.50 21,937.50 MiscellaneousConstruction ServicesGeneral SuppliesOther ObjectsTransfer to General Fund -- Capital Reserve 179,815.50 179,815.50 179,815.50Transfer to Debt Service Fund
Total Expenditures 21,937.50 179,815.50 201,753.00 201,753.00
Excess (Deficiency) of Revenues Over(Under) Expenditures 314,317.50$ (314,317.50)$ - -
Additional Project Information:
Project Number 5130-060-14-1003-G04Grant Date 1/6/2014Bond Authorization DateBonds AuthorizedBonds IssuedOriginal Authorized Cost 336,255.00$ Additional Authorized Cost (134,502.00)$ Revised Authorized Cost 201,753.00$
Percentage Increase over Original Authorized Cost -40%Percentage Completion 100%Original Target Completion Date 8/30/2017Revised Target Completion Date 6/30/2017
24750
TABERNACLE TOWNSHIP SCHOOL DISTRICT
Tabernacle Elementary School Generator
98

PROPRIETARY FUNDS

24750 Exhibit G-1TABERNACLE TOWNSHIP SCHOOL DISTRICT
Proprietary FundBusiness Type Activities - Enterprise Fund
Statement of Net PositionJune 30, 2017
FoodService
ASSETS:Current Assets: Cash and Cash Equivalents 29,607.01$ Accounts Receivable: State 395.58 Federal 8,731.52 Other 1,505.46 Inventories 6,337.67
Total Current Assets 46,577.24
Noncurrent Assets: Capital Assets: Furniture, Fixtures and Equipment 172,764.50 Less Accumulated Depreciation (113,341.06)
Total Noncurrent Assets 59,423.44
Total Assets 106,000.68
LIABILITIES:Current Liabilities: Unearned Revenue 5,328.24
NET POSITION: Net Investment in Capital Assets 59,423.44 Unrestricted 41,249.00
Total Net Position 100,672.44$
100

24750 Exhibit G-2TABERNACLE TOWNSHIP SCHOOL DISTRICT
Proprietary FundBusiness Type Activities - Enterprise Fund
Statement of Revenues, Expenses and Changes in Fund Net PositionFor the Fiscal Year Ended June 30, 2017
FoodService
OPERATING REVENUES:Charges for Services: Daily Sales - Reimbursable Programs: School Lunch Program 96,344.80$ Daily Sales - Non-Reimbursable Programs 80,512.64 Special Functions 2,579.54
Total Operating Revenues 179,436.98
OPERATING EXPENSES:Salaries 92,146.26Employee Benefits 17,628.66General Supplies 6,197.35Depreciation 7,207.99Administrative Fee 24,868.20Other Purchased Services 9,153.54Cost of Sales - Reimbursable Programs 62,871.61Cost of Sales - Non-Reimbursable Programs 32,095.22
Total Operating Expenses 252,168.83
Operating Income / (Loss) (72,731.85)
NONOPERATING REVENUES (EXPENSES):State Sources: State School Lunch Program 2,015.65Federal Sources: National School Lunch Program 46,309.52 Food Distribution Program 18,100.01
Total Nonoperating Revenues (Expenses) 66,425.18
Change in Net Position (6,306.67)
Net Position -- July 1 106,979.11
Net Position -- June 30 100,672.44$
101

24750 Exhibit G-3TABERNACLE TOWNSHIP SCHOOL DISTRICT
Proprietary FundBusiness Type Activities - Enterprise Fund
Statement of Cash FlowsFor the Fiscal Year Ended June 30, 2017
FoodService
CASH FLOWS FROM OPERATING ACTIVITIES:Receipts from Customers 178,078.02$ Payments to Employees (92,146.26)Payments for Employee Benefits (17,628.66)Payments for Supplies and Services (132,484.66)
Net Cash Provided by (used for) Operating Activities (64,181.56)
CASH FLOWS FROM NON-CAPITAL FINANCING ACTIVITIES:State Sources 1,811.36Federal Sources 61,173.88
Net Cash Provided by (used for) Non-Capital Financing Activities 62,985.24
CASH FLOWS FROM CAPITAL AND RELATED FINANCING ACTIVITIES:Purchases of Capital Assets -
CASH FLOWS FROM INVESTING ACTIVITIES:Interest Revenue -
Net Increase (Decrease) in Cash and Cash Equivalents (1,196.32)
Cash and Cash Equivalents -- July 1 30,803.33
Cash and Equivalents -- June 30 29,607.01$
Reconciliation of Operating Income (Loss) to Net Cash Provided (Used) by Operating Activities: Operating Income (Loss) (72,731.85)$ Adjustments to Reconcile Operating Income (Loss) to Net Cash Provided by (used for) Operating Activities: Depreciation and Net Amortization 7,207.99 (Increase) Decrease in Accounts Receivable (1,364.48) (Increase) Decrease in Inventories 2,701.26 Increase (Decrease) in Unearned Revenue 5.52
Total Adjustments 8,550.29
Net Cash Provided by (used for) Operating Activities (64,181.56)$
102

FIDUCIARY FUNDS

24750 Exhibit H-1
TABERNACLE TOWNSHIP SCHOOL DISTRICT
Fiduciary FundsCombining Statement of Fiduciary Net Position
June 30, 2017
Private Purpose Trust Funds Agency Funds
UnemploymentScholarship Compensation Student
Trust Trust Activity Payroll Total
ASSETS:Cash and Cash Equivalents 10,344.96$ 96,545.38$ 38,216.86$ 24,675.93$ 169,783.13$ Accounts Receivable: Interfund Accounts Receivable: Due Unemployment Fund 5,000.55 5,000.55
Total Assets 10,344.96 96,545.38 38,216.86$ 29,676.48$ 174,783.68
LIABILITIES:Accounts Payable 6.30 6.30Interfund Accounts Payable: Due General Fund 1.00 1,670.00$ 1,671.00 Due Payroll Fund 5,000.55 5,000.55Payable to Student Groups 38,216.86$ 38,216.86Payroll Deductions and Withholdings 28,006.48 28,006.48
Total Liabilities - 5,007.85 38,216.86$ 29,676.48$ 72,901.19
NET POSITION:Held in Trust for Unemployment Claims and Other Purposes 10,344.96$ 91,537.53$ 101,882.49$
104

24750 Exhibit H-2TABERNACLE TOWNSHIP SCHOOL DISTRICT
Fiduciary FundsStatement of Changes in Fiduciary Net Position
For the Fiscal Year Ended June 30, 2017
UnemploymentScholarship Compensation
Trust Trust
ADDITIONS:Contributions and Donations from Payroll Deductions Withheld 13,392.79$ Scholarship Donations 1,100.00$
Total Additions 1,100.00 13,392.79
DEDUCTIONS:Scholarship Awards 1,500.00Unemployment Claims 141.26
Total Deductions 1,500.00 141.26
Change in Net Position (400.00) 13,251.53
Net Position -- July 1 10,744.96 78,286.00
Net Position -- June 30 10,344.96$ 91,537.53$
Private Purpose Trust Funds
105
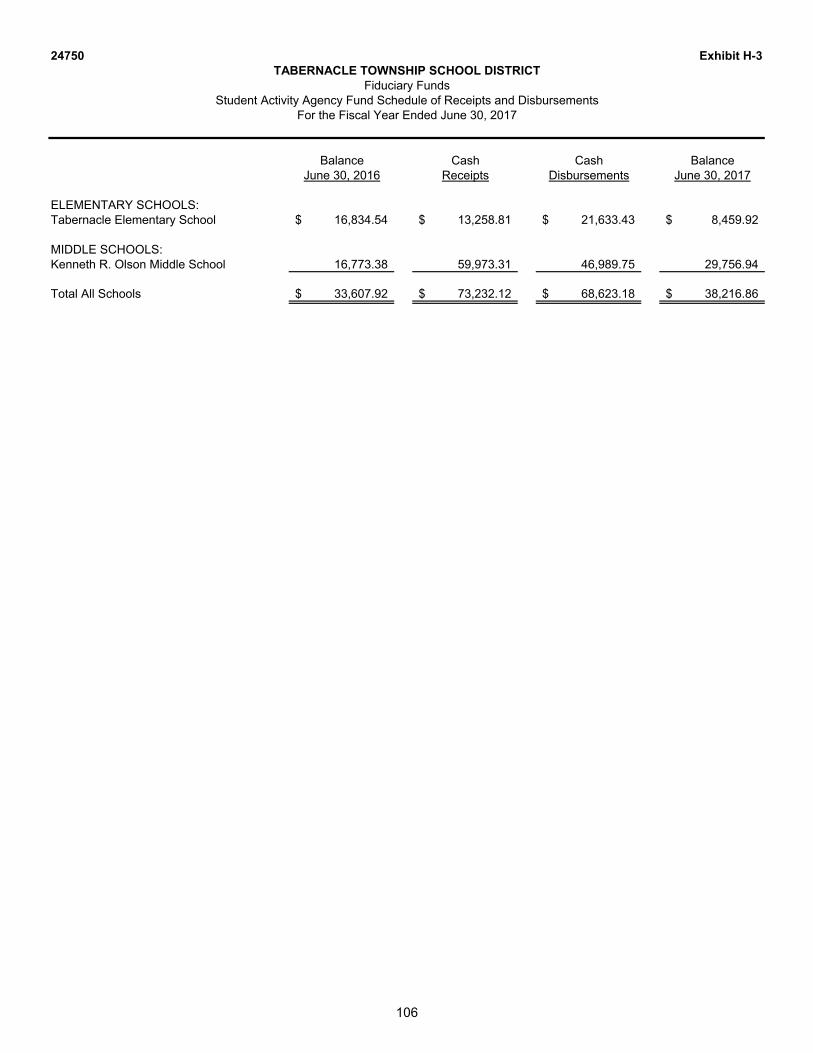
24750 Exhibit H-3TABERNACLE TOWNSHIP SCHOOL DISTRICT
Fiduciary FundsStudent Activity Agency Fund Schedule of Receipts and Disbursements
For the Fiscal Year Ended June 30, 2017
Balance Cash Cash BalanceJune 30, 2016 Receipts Disbursements June 30, 2017
ELEMENTARY SCHOOLS:Tabernacle Elementary School 16,834.54$ 13,258.81$ 21,633.43$ 8,459.92$
MIDDLE SCHOOLS:Kenneth R. Olson Middle School 16,773.38 59,973.31 46,989.75 29,756.94
Total All Schools 33,607.92$ 73,232.12$ 68,623.18$ 38,216.86$
106

24750 Exhibit H-4TABERNACLE TOWNSHIP SCHOOL DISTRICT
Fiduciary FundsPayroll Agency Fund Schedule of Receipts and Disbursements
For the Fiscal Year Ended June 30, 2017
Balance BalanceJune 30, 2016 Additions Deletions June 30, 2017
ASSETS:
Cash and Cash Equivalents 64,486.32$ 8,978,689.89$ 9,018,500.28$ 24,675.93$ Interfund Accounts Receivable: Due Unemployment 4,533.14 13,860.20 13,392.79 5,000.55
Total Assets 69,019.46$ 8,992,550.09$ 9,031,893.07$ 29,676.48$
LIABILITIES:
Payroll Deductions and Withholdings 67,349.46$ 4,159,624.36$ 4,198,967.34$ 28,006.48$ Net Payroll 4,832,925.73 4,832,925.73 Interfund Accounts Payable: Due General Fund 1,670.00 1,670.00
Total Liabilities 69,019.46$ 8,992,550.09$ 9,031,893.07$ 29,676.48$
107

LONG-TERM DEBT

24750
Ex
hib
it I
-1T
AB
ER
NA
CL
E T
OW
NS
HIP
SC
HO
OL
DIS
TR
ICT
Sche
dule
of S
eria
l Bon
dsFo
r the
Fis
cal Y
ear E
nded
Jun
e 30
, 201
7
Dat
e of
Amou
nt o
fAn
nual
Mat
uriti
esIn
tere
st
Bala
nce
Bala
nce
Issu
eIs
sue
Issu
eD
ate
Amou
ntR
ate
June
30,
201
6Is
sued
Ret
ired
June
30,
201
7
2013
Ref
undi
ng B
ond
Issu
e10
/18/
2013
6,25
0,00
0.00
$
9/1/
2017
685,
000.
00$
3.00
0%9/
1/20
1870
5,00
0.00
4.
000%
9/1/
2019
715,
000.
00
3.00
0%9/
1/20
2070
0,00
0.00
3.
000%
9/1/
2021
690,
000.
00
3.00
0%9/
1/20
2236
0,00
0.00
3.
125%
9/1/
2023
360,
000.
00
3.12
5%9/
1/20
2435
0,00
0.00
3.
125%
5,22
5,00
0.00
$
660,
000.
00$
4,56
5,00
0.00
$
5,22
5,00
0.00
$
-66
0,00
0.00
$
4,
565,
000.
00$
109

Exh
ibit
I-2
TA
BE
RN
AC
LE
TO
WN
SH
IP S
CH
OO
L D
IST
RIC
TSc
hedu
le o
f Obl
igat
ions
Und
er C
apita
l Lea
ses
For t
he F
isca
l Yea
r End
ed J
une
30, 2
017
Dat
eTe
rmAm
ount
Issu
ed
Ret
ired
Amou
ntof
ofAm
ount
of O
rigin
al Is
sue
Out
stan
ding
Cur
rent
Cur
rent
Out
stan
ding
Serie
sLe
ase
Leas
ePr
inci
pal
Inte
rest
June
30,
201
6(a)
Year
Year
June
30,
201
7(a)
Two
(2) S
choo
l Bus
ses
09/0
3/13
5 ye
ars
131,
589.
64$
6,
366.
97$
53,2
41.2
4$
26,3
02.3
5$
26,9
38.8
9$
Tw
o (2
) Sch
ool B
usse
s10
/01/
155
year
s93
,948
.82
4,
376.
02
73,9
48.8
2
17,8
50.8
1
56,0
98.0
1
Sc
hool
Bus
05/0
1/16
5 ye
ars
83,7
47.1
5
6,45
0.01
63
,747
.15
15
,018
.53
48
,728
.62
190,
937.
21$
-59
,171
.69
$
13
1,76
5.52
$
(a) F
utur
e In
tere
st P
aym
ents
Rem
oved
from
Car
ryin
g Va
lue
of L
ease
s.
24750
110

24
75
0E
xh
ibit
I-3
TA
BE
RN
AC
LE
TO
WN
SH
IP S
CH
OO
L D
IST
RIC
TD
ebt S
ervi
ce F
und
Budg
etar
y C
ompa
rison
Sch
edul
e Fo
r the
Fis
cal Y
ear E
nded
Jun
e 30
, 201
7
Varia
nce
Orig
inal
Budg
etFi
nal
Posi
tive
(Neg
ativ
e)Bu
dget
Tran
sfer
sBu
dget
Actu
alFi
nal t
o Ac
tual
REV
ENU
ES:
Loca
l Sou
rces
:
Loca
l Tax
Lev
y72
2,51
7.00
$
722,
517.
00$
72
2,51
7.00
$
Stat
e So
urce
s:
Deb
t Ser
vice
Aid
Typ
e II
92,7
21.0
092
,721
.00
92,7
21.0
0
Tota
l Rev
enue
s81
5,23
8.00
-81
5,23
8.00
815,
238.
00-
EXPE
ND
ITU
RES
:
Reg
ular
Deb
t Ser
vice
:
Inte
rest
155,
238.
0015
5,23
8.00
155,
237.
500.
50$
R
edem
ptio
n of
Prin
cipa
l66
0,00
0.00
660,
000.
0066
0,00
0.00
Tota
l Reg
ular
Deb
t Ser
vice
815,
238.
00-
815,
238.
0081
5,23
7.50
0.50
Tota
l Exp
endi
ture
s81
5,23
8.00
-81
5,23
8.00
815,
237.
500.
50
Exce
ss (D
efic
ienc
y) o
f Rev
enue
s O
ver (
Und
er) E
xpen
ditu
res
--
-0.
50(0
.50)
Fund
Bal
ance
(Def
icit)
, Jul
y 1
38,8
66.1
8-
38,8
66.1
8
38,8
66.1
8-
Fund
Bal
ance
(Def
icit)
, Jun
e 30
38,8
66.1
8$
-38
,866
.18
$
38
,866
.68
$
(0
.50)
$
111

STATISTICAL SECTION

Financial Trends Information
Financial trends information is intended to assist the user in understanding and assessinghow the School District's financial position has changed over time. Please refer to thefollowing exhibits for a historical view of the School District's financial performance.

24750
Ex
hib
it J
-1
2017
2016
2015
2014
2013
2012
2011
2010
2009
2008
Gov
ernm
enta
l Act
iviti
es:
Net
Inve
sted
in C
apita
l Ass
ets
8,75
4,73
2.81
$
8,36
5,70
1.52
$
7,84
9,77
8.80
$
7,49
5,27
0.98
$
7,40
5,98
8.04
$
6,84
6,58
4.00
$
7,25
2,24
2.00
$
7,24
2,31
2.00
$
6,72
8,88
2.00
$
7,36
9,58
1.00
$
Res
trict
ed2,
955,
891.
92
3,
486,
924.
66
3,
200,
790.
52
2,
622,
631.
46
1,
783,
326.
14
1,
980,
119.
00
1,
290,
490.
00
72
9,75
8.00
2,
028,
103.
00
2,
022,
046.
00
U
nres
trict
ed(5
,183
,290
.21)
(5,0
44,8
02.7
2)
(4
,967
,952
.29)
(500
,490
.75)
(1
1,82
6.51
)
(3
3.00
)(1
84,9
82.0
0)
130,
545.
00
406,
059.
00
818,
625.
00
Tota
l Gov
ernm
enta
l Act
iviti
es N
et P
ositi
on6,
527,
334.
52$
6,
807,
823.
46$
6,
082,
617.
03$
9,
617,
411.
69$
9,
177,
487.
67$
8,
826,
670.
00$
8,
357,
750.
00$
8,
102,
615.
00$
9,
163,
044.
00$
10
,210
,252
.00
$
Busi
ness
-type
Act
iviti
es:
Net
Inve
sted
in C
apita
l Ass
ets
59,4
23.4
4$
66
,631
.43
$
74,1
99.4
2$
78
,351
.24
$
66,2
79.4
1$
66
,279
.41
$
29,9
04.0
0$
18
9.00
$
984.
00$
U
nres
trict
ed41
,249
.00
40,3
47.6
8
27
,520
.24
28,2
90.3
6
29
,856
.43
29,8
56.4
3
39
,215
.00
68,0
42.0
0$
57
,361
.00
52,0
65.0
0
To
tal B
usin
ess-
type
Act
iviti
es N
et P
ositi
on10
0,67
2.44
$
10
6,97
9.11
$
10
1,71
9.66
$
10
6,64
1.60
$
96
,135
.84
$
96,1
35.8
4$
69
,119
.00
$
68,0
42.0
0$
57
,550
.00
$
53,0
49.0
0$
Dis
trict
-wid
e:N
et In
vest
ed in
Cap
ital A
sset
s8,
814,
156.
25$
8,
432,
332.
95$
7,
923,
978.
22$
7,
573,
622.
22$
7,
472,
267.
45$
6,
912,
863.
41$
7,
282,
146.
00$
7,
242,
312.
00$
6,
729,
071.
00$
7,
370,
565.
00$
R
estri
cted
2,95
5,89
1.92
3,48
6,92
4.66
3,20
0,79
0.52
2,62
2,63
1.46
1,78
3,32
6.14
1,98
0,11
9.00
1,29
0,49
0.00
729,
758.
00
2,02
8,10
3.00
2,02
2,04
6.00
Unr
estri
cted
(5,1
42,0
41.2
1)
(5
,004
,455
.04)
(4,9
40,4
32.0
5)
(4
72,2
00.3
9)
18,0
29.9
2
29
,823
.43
(145
,767
.00)
19
8,58
7.00
46
3,42
0.00
87
0,69
0.00
To
tal D
istri
ct-w
ide
Net
Pos
ition
6,62
8,00
6.96
$
6,91
4,80
2.57
$
6,18
4,33
6.69
$
9,72
4,05
3.29
$
9,27
3,62
3.51
$
8,92
2,80
5.84
$
8,42
6,86
9.00
$
8,17
0,65
7.00
$
9,22
0,59
4.00
$
10,2
63,3
01.0
0$
Sour
ce: E
xhib
it A-
1
For t
he fi
scal
yea
r end
ed J
une
30, 2
015,
the
Scho
ol D
istri
ct a
dopt
ed G
ASBS
No'
s. 6
8 an
d 71
, whi
ch re
quire
d th
e Sc
hool
Dis
trict
to re
cord
its
prop
ortio
nate
sha
re o
f the
net
pen
sion
liab
ility
and
rela
ted
defe
rred
outfl
ows
and
inflo
ws
of re
sour
ces
in th
e go
vern
men
t-wid
e fin
anci
al s
tate
men
ts.
Bala
nces
prio
r to
June
30,
201
5 ar
e sh
own
as o
rigin
ally
repo
rted
and
have
not
bee
n re
stat
ed fo
r thi
s ad
optio
n.
TA
BE
RN
AC
LE
TO
WN
SH
IP S
CH
OO
L D
IST
RIC
T
Net
Pos
ition
by
Com
pone
ntLa
st T
en F
isca
l Yea
rs (A
ccru
al B
asis
of A
ccou
ntin
g)U
naudite
d
Fisc
al Y
ear E
nded
Jun
e 30
,
114

24750
Ex
hib
it J
-2
2017
2016
2015
2014
2013
2012
2011
2010
2009
2008
Exp
en
ses:
Gov
ernm
enta
l Act
iviti
es:
Inst
ruct
ion: R
egul
ar3,
966,
302
$
3,
757,
047
$
3,
710,
827
$
4,
205,
992
$
4,
360,
444
$
4,
943,
421
$
4,
797,
415
$
5,
089,
415
$
5,
128,
843
$
5,
906,
561
$
Sp
ecia
l Edu
catio
n1,
327,
326
1,
400,
173
1,
183,
495
1,
169,
530
1,
144,
122
1,
530,
608
1,
506,
929
1,
637,
390
1,
565,
207
1,
643,
988
O
ther
Spe
cial
Edu
catio
n25
7,72
6
27
1,79
5
27
1,93
0
25
3,57
1
20
2,10
8
40
9,81
8
44
5,89
1
44
7,05
0
43
4,06
5
45
3,78
1
O
ther
Inst
ruct
ion
61,8
13
114,
835
197,
166
112,
919
70,7
66
120,
367
127,
374
115,
932
96,8
61
79,2
91
Adul
t/Con
tinui
ng E
duca
tion
Prog
ram
s3,
920
9,13
19,
285
10,3
59
7,60
1Tu
ition
371,
920
19,5
08
44,0
72
63,3
39
5,28
06,
148
Sup
port
Serv
ices
:St
uden
t and
Inst
ruct
ion
Rel
ated
Ser
vice
s1,
690,
711
1,
542,
127
1,
535,
176
1,
572,
401
1,
459,
592
2,
169,
711
2,
117,
808
2,
167,
241
2,
041,
717
1,
955,
614
Sc
hool
Adm
inis
trativ
e Se
rvic
es36
4,31
1
36
5,92
7
40
7,29
5
44
0,06
6
35
6,56
2
34
1,41
0
35
3,87
7
38
1,80
3
38
7,93
5
45
9,00
5
O
ther
Adm
inis
trativ
e Se
rvic
es75
9,71
2
67
3,39
0
62
7,72
0
65
8,34
7
67
4,44
2
74
7,64
7
71
5,64
8
76
1,03
9
73
7,23
4
74
1,05
4
C
entra
l Ser
vice
s33
1,95
5
36
7,20
1
39
0,22
6
39
6,55
8
39
8,75
6
Pl
ant O
pera
tions
and
Mai
nten
ance
1,47
0,68
0
1,31
3,38
8
1,17
5,33
6
1,23
2,18
8
1,20
2,39
1
1,34
2,49
4
1,39
6,90
2
1,45
3,39
0
1,44
9,53
3
1,40
9,08
0
Pupi
l Tra
nspo
rtatio
n53
5,50
9
48
9,60
3
46
0,08
5
51
6,93
8
50
3,17
4
93
2,39
2
74
7,68
8
72
9,91
7
74
5,17
6
73
7,02
3
U
nallo
cate
d Be
nefit
s6,
565,
761
2,
799,
582
2,
591,
556
2,
614,
505
2,
587,
049
R
eim
burs
emen
t TPA
F Pe
nsio
n an
d So
cial
Sec
urity
919,
659
1,38
6,35
1
1,14
7,74
0
1,04
2,87
8
1,18
3,42
2
Inte
rest
on
Long
-term
Deb
t16
1,81
4
23
1,37
8
25
4,64
7
35
4,58
5
34
8,61
0
33
3,62
8
36
5,89
8
34
9,24
4
36
6,44
5
37
9,79
8
R
educ
tion
in C
ompe
nsat
ed A
bsen
ces
246,
376
(73,
136)
(35,
268)
59,2
32
Una
lloca
ted
Amor
tizat
ion
38,7
61
38,7
62
38,7
62
38,7
62
38,7
62
Cap
ital A
sset
Adj
ustm
ent D
ue T
o Ap
prai
sal
396,
835
Una
lloca
ted
Dep
reci
atio
n47
2,91
5
48
8,17
8
46
6,59
7
57
0,09
0
63
5,00
0
63
2,46
2
63
2,46
2
61
3,48
9
Tota
l Gov
ernm
enta
l Act
iviti
es E
xpen
ses
18,9
26,1
60
14,8
33,7
74
14,0
29,5
71
14,1
73,9
21
14,0
92,6
82
14,2
32,5
65
13,9
15,9
72
14,1
93,3
59
14,0
01,1
69
14,8
89,1
83
Busi
ness
-type
Act
iviti
es:
Foo
d Se
rvic
e25
2,16
9
25
6,84
2
26
2,29
4
26
6,68
9
26
3,73
4
25
8,65
6
25
4,92
8
27
8,01
8
27
9,64
5
30
1,43
3
C
omm
unity
Pro
gram
21,8
46
13,5
15
9,90
722
,522
Tota
l Bus
ines
s-ty
pe A
ctiv
ities
Exp
ense
252,
169
256,
842
262,
294
266,
689
263,
734
258,
656
276,
774
291,
533
289,
552
323,
955
Tota
l Dis
trict
Exp
ense
s19
,178
,329
$
15
,090
,616
$
14
,291
,864
$
14
,440
,610
$
14
,356
,416
$
14
,491
,221
$
14
,192
,746
$
14
,484
,892
$
14
,290
,721
$
15
,213
,138
$
Pro
gra
m R
even
ues:
Gov
ernm
enta
l Act
iviti
es:
Ope
ratin
g G
rant
s an
d C
ontri
butio
ns4,
592,
563
$
1,
691,
626
$
1,
433,
807
$
1,
337,
344
$
1,
569,
696
$
C
harg
es fo
r Ser
vice
s10
9,74
3
11
9,28
7
22
6,76
6
17
9,12
4
15
6,14
2
C
apita
l Gra
nts
and
Con
tribu
tions
395,
306
$
540,
640
$
442,
231
$
519,
555
$
488,
875
$
Tota
l Gov
ernm
enta
l Act
iviti
es P
rogr
am R
even
ues
4,70
2,30
6
1,81
0,91
3
1,66
0,57
4
1,51
6,46
8
1,72
5,83
8
395,
306
540,
640
442,
231
519,
555
488,
875
Busi
ness
-type
act
iviti
es:
Cha
rges
for S
ervi
ces
Foo
d Se
rvic
e17
9,43
7
19
2,09
3
18
1,33
7
18
3,54
8
18
6,88
0
18
1,64
9
19
5,54
9
21
4,32
6
23
5,22
8
23
8,13
5
C
omm
unity
Pro
gram
17,5
26
13,8
74
13,6
83
22,0
82
Cap
ital G
rant
s an
d C
ontri
butio
ns3,
890
19,1
90
33,9
24
Ope
ratin
g G
rant
s an
d C
ontri
butio
ns66
,425
70
,008
72
,145
74
,358
69
,719
77
,606
73
,562
67
,448
60
,503
59
,513
Tota
l Bus
ines
s-ty
pe A
ctiv
ities
Pro
gram
Rev
enue
s24
5,86
2
26
2,10
2
25
7,37
2
27
7,09
6
29
0,52
4
25
9,25
5
28
6,63
7
29
5,64
8
30
9,41
4
31
9,73
0
Tota
l Dis
trict
Pro
gram
Rev
enue
s4,
948,
168
$
2,
073,
015
$
1,
917,
945
$
1,
793,
564
$
2,
016,
362
$
65
4,56
1$
82
7,27
7$
73
7,87
9$
82
8,96
9$
80
8,60
5$
(Con
tinue
d)
TA
BE
RN
AC
LE
TO
WN
SH
IP S
CH
OO
L D
IST
RIC
T
Cha
nges
in N
et P
ositi
onLa
st T
en F
isca
l Yea
rs (A
ccru
al B
asis
of A
ccou
ntin
g)U
naudite
d
Fisc
al Y
ear E
nded
Jun
e 30
,
115

24750
Ex
hib
it J
-2
2017
2016
2015
2014
2013
2012
2011
2010
2009
2008
TA
BE
RN
AC
LE
TO
WN
SH
IP S
CH
OO
L D
IST
RIC
T
Cha
nges
in N
et P
ositi
onLa
st T
en F
isca
l Yea
rs (A
ccru
al B
asis
of A
ccou
ntin
g)U
naudite
d
Fisc
al Y
ear E
nded
Jun
e 30
,
Net
(Exp
en
se)/
Reven
ue:
Gov
ernm
enta
l Act
iviti
es(1
4,22
3,85
4)$
(1
3,02
2,86
1)$
(1
2,36
8,99
7)$
(1
2,65
7,45
4)$
(1
2,36
6,84
4)$
(1
3,83
7,25
9)$
(1
3,37
5,33
2)$
(1
3,75
1,12
8)$
(1
3,48
1,61
4)$
(1
4,40
0,30
8)$
Bu
sine
ss-ty
pe A
ctiv
ities
(6,3
07)
5,26
0(4
,922
)10
,407
26
,790
59
99,
863
4,11
519
,862
(4
,225
)
Tota
l Dis
trict
-wid
e N
et E
xpen
se(1
4,23
0,16
1)$
(1
3,01
7,60
1)$
(1
2,37
3,91
9)$
(1
2,64
7,04
7)$
(1
2,34
0,05
4)$
(1
3,83
6,66
0)$
(1
3,36
5,46
9)$
(1
3,74
7,01
3)$
(1
3,46
1,75
2)$
(1
4,40
4,53
3)$
Gen
era
l R
even
ues a
nd
Oth
er
Ch
an
ges in
Net
Assets
:
Gov
ernm
enta
l Act
iviti
es:
P
rope
rty T
axes
Lev
ied
for G
ener
al P
urpo
ses,
Net
7,38
0,66
3$
7,10
8,41
1$
6,77
8,36
2$
6,50
4,18
3$
6,50
4,18
3$
6,43
9,78
5$
6,46
0,88
4$
6,43
8,19
2$
6,26
7,45
4$
6,11
1,55
2$
T
axes
Lev
ied
for D
ebt S
ervi
ce72
2,51
7
73
3,70
0
70
1,91
2
76
6,93
6
77
9,91
4
78
7,10
2
79
8,52
7
73
7,45
8
69
3,80
3
73
3,98
8
Fed
eral
and
Sta
te A
id N
ot R
estri
cted
5,66
9,33
4
5,55
4,27
5
5,60
1,05
2
5,65
2,26
1
5,52
6,03
2
F
eder
al a
nd S
tate
Aid
Res
trict
ed75
,065
27
2,46
1
72
,477
75
,473
71
,513
Unr
estri
cted
Gra
nts
and
Con
tribu
tions
6,66
3,78
8
6,12
7,14
0
5,68
4,51
7
6,40
3,74
7
7,25
6,05
9
T
uitio
n R
ecei
ved
311,
182
151,
921
83,7
17
107,
928
43,9
01
M
isce
llane
ous
95,7
86
79,2
21
85,1
78
98,5
24
119,
556
104,
322
91,9
95
79,9
48
73,9
42
149,
810
T
rans
fers
(256
)
Can
cella
tion
of P
rior Y
ear A
ccou
nts
Rec
eiva
ble
(143
,406
)
(1
2,93
0)
Tota
l Gov
ernm
enta
l Act
iviti
es13
,943
,365
13
,748
,067
13
,238
,982
13
,097
,378
12
,857
,793
14
,306
,179
13
,630
,467
13
,023
,832
13
,533
,944
14
,295
,054
Busi
ness
-type
Act
iviti
es:
In
vest
men
t Ear
ning
s47
862
938
610
681
8
Mis
cella
neou
s99
227
T
rans
fers
256
Tota
l Bus
ines
s-ty
pe A
ctiv
ities
--
-99
227
478
629
386
106
1,07
4
Tota
l Dis
trict
-wid
e13
,943
,365
$
13
,748
,067
$
13
,238
,982
$
13
,097
,477
$
12
,858
,019
$
14
,306
,657
$
13
,631
,096
$
13
,024
,218
$
13
,534
,050
$
14
,296
,128
$
Ch
an
ge
in
Ne
t P
os
itio
n:
Gov
ernm
enta
l Act
iviti
es(2
80,4
89)
$
725,
207
$
869,
984
$
439,
924
$
490,
949
$
468,
920
$
255,
135
$
(727
,296
)$
52
,330
$
(1
05,2
54)
$
Busi
ness
-type
Act
iviti
es(6
,307
)5,
260
(4,9
22)
10,5
06
27,0
17
1,07
710
,492
4,
501
19,9
68
(3,1
51)
Tota
l Dis
trict
(286
,796
)$
73
0,46
7$
86
5,06
2$
45
0,43
0$
51
7,96
5$
46
9,99
7$
26
5,62
7$
(7
22,7
95)
$
72,2
98$
(108
,405
)$
Sour
ce: E
xhib
it A-
2
For t
he fi
scal
yea
r end
ed J
une
30, 2
015,
the
Scho
ol D
istri
ct a
dopt
ed G
ASBS
No'
s. 6
8 an
d 71
, whi
ch re
quire
d th
e Sc
hool
Dis
trict
to re
cord
its
prop
ortio
nate
sha
re o
f the
net
pen
sion
liab
ility
and
rela
ted
defe
rred
outfl
ows
and
inflo
ws
of re
sour
ces
in th
e go
vern
men
t-wid
e fin
anci
al s
tate
men
ts.
Bala
nces
prio
r to
June
30,
201
5 ar
e sh
own
as o
rigin
ally
repo
rted
and
have
not
bee
n re
stat
ed fo
r thi
s ad
optio
n.
116

24750
Ex
hib
it J
-3
2017
2016
2015
2014
2013
2012
2011
2010
2009
2008
Gen
eral
Fun
d:
Res
trict
ed2,
955,
891.
92$
3,
129,
965.
89$
2,
755,
893.
17$
2,
370,
699.
34$
1,
537,
527.
99$
1,
741,
934.
00$
95
0,41
7.00
$
1,
028,
564.
00$
1,
890,
016.
00$
76
0,05
3.00
$
Assi
gned
47,7
53.9
6
17
7,14
3.27
14
3,78
1.87
17
6,52
2.97
19
8,33
4.00
16
5,55
1.00
41
,841
.00
(577
,770
.00)
(3
20,1
75.0
0)
720,
743.
00
U
nass
igne
d(1
30,4
93.3
2)(2
57,9
63.8
4)(1
99,3
89.0
0)(1
33,8
72.0
0)33
8,06
0.87
Tota
l Gen
eral
Fun
d2,
873,
152.
56$
3,
049,
145.
32$
2,
700,
286.
04$
2,
413,
350.
31$
2,
073,
922.
86$
1,
907,
485.
00$
99
2,25
8.00
$
45
0,79
4.00
$
1,
569,
841.
00$
1,
480,
796.
00$
All O
ther
Gov
ernm
enta
l Fun
ds:
R
eser
ved
498,
959.
00$
354,
555.
00$
R
estri
cted
for:
Deb
t Ser
vice
Fun
d38
,866
.68
$
38,8
66.1
8$
0.
50$
40,8
21.0
0$
(1
2,21
2.66
)$
(1
2,21
3.00
)$
(1
2,21
3.00
)$
(1
4,36
3.00
)$
21
,250
.00
Cap
ital P
roje
cts
Fund
179,
815.
50
301,
115.
48
102,
383.
98
153,
483.
98
449,
559.
00
458,
443.
00
478,
419.
00
461,
845.
001,
081,
624.
00
Tota
l All
Oth
er G
over
nmen
tal F
unds
38,8
66.6
8$
21
8,68
1.68
$
30
1,11
5.98
$
14
3,20
4.98
$
14
1,27
1.32
$
43
7,34
6.00
$
44
6,23
0.00
$
46
4,05
6.00
$
96
0,80
4.00
$
1,
457,
429.
00$
Tota
l Dis
trict
2,91
2,01
9.24
$
3,26
7,82
7.00
$
3,00
1,40
2.02
$
2,55
6,55
5.29
$
2,21
5,19
4.18
$
2,34
4,83
1.00
$
1,43
8,48
8.00
$
914,
850.
00$
2,53
0,64
5.00
$
2,93
8,22
5.00
$
Sour
ce: E
xhib
it B-
1
In a
ccor
danc
e w
ith G
ASB
54, e
ffect
ive
for t
he fi
scal
yea
r end
ed J
une
30, 2
011,
the
desc
riptio
n an
d te
rmin
olog
y ut
ilized
to id
entif
y fu
nd b
alan
ce w
as c
hang
ed.
TA
BE
RN
AC
LE
TO
WN
SH
IP S
CH
OO
L D
IST
RIC
T
Fund
Bal
ance
s, G
over
nmen
tal F
unds
Last
Ten
Fis
cal Y
ears
(Mod
ified
Acc
rual
Bas
is o
f Acc
ount
ing)
Unaudite
d
Fisc
al Y
ear E
nded
Jun
e 30
,
117

24750
Ex
hib
it J
-4
2017
2016
2015
2014
2013
2012
2011
2010
2009
2008
Reven
ues:
Tax
Levy
8,10
3,18
0.00
$
7,
842,
111.
00$
7,48
0,27
4.00
$
7,
271,
119.
00$
7,28
4,09
7.00
$
7,
226,
887.
00$
7,25
9,41
1.00
$
7,
175,
650.
00$
6,96
1,25
7.00
$
6,
845,
540.
00$
Oth
er L
ocal
Rev
enue
500.
0014
0.98
Tuiti
on C
harg
es10
9,74
2.79
119,
286.
62
22
6,76
6.28
179,
123.
94
15
6,14
1.70
311,
182.
00
15
1,92
1.00
83,7
17.0
0
10
7,92
8.00
43,9
01.0
0
In
tere
st E
arni
ngs
2,14
9.00
645.
006,
014.
0031
,776
.00
Mis
cella
neou
s10
2,74
9.42
83,2
20.5
1
85
,178
.45
98,5
24.3
5
11
9,55
6.12
104,
322.
00
89
,846
.00
79,3
03.0
0
67
,928
.00
118,
034.
00
St
ate
Sour
ces
7,31
7,01
7.52
7,
237,
621.
39
6,84
3,53
5.46
6,
798,
850.
11
6,81
0,95
4.39
6,
581,
391.
00
6,24
2,20
1.00
5,
173,
646.
00
6,63
5,39
0.00
7,
480,
811.
00
Fede
ral S
ourc
es26
4,46
9.09
276,
741.
00
26
3,80
1.00
265,
728.
00
35
6,14
6.02
457,
374.
00
40
1,63
4.00
927,
673.
00
28
7,91
2.00
264,
123.
00
Lo
cal S
ourc
es20
,329
.00
23,9
45.0
0
25
,429
.00
Tota
l Rev
enue
15,8
97,1
58.8
2
15
,558
,980
.52
14,8
99,5
55.1
9
14
,613
,845
.40
14,7
27,0
36.2
1
14
,701
,485
.00
14,1
71,1
07.0
0
13
,466
,063
.00
14,0
66,4
29.0
0
14
,784
,185
.00
Ex
pe
nd
itu
res
:
Inst
ruct
ion
Reg
ular
Inst
ruct
ion
3,92
7,63
8.11
3,
723,
593.
76
3,72
1,59
3.88
3,
731,
279.
39
4,09
9,10
5.50
4,
210,
787.
00
4,24
9,24
8.00
4,
470,
840.
00
4,55
1,86
6.00
4,
851,
448.
00
Spec
ial E
duca
tion
Inst
ruct
ion
1,31
6,70
1.57
1,
390,
217.
64
1,18
9,13
7.09
1,
159,
123.
12
1,20
5,31
3.02
91
9,05
4.00
870,
902.
00
99
8,75
7.00
938,
948.
00
96
9,37
9.00
Oth
er S
peci
al In
stru
ctio
n25
7,72
6.47
271,
795.
14
27
1,92
9.95
253,
571.
48
20
2,10
7.90
224,
229.
00
26
9,47
5.00
284,
904.
00
24
9,95
1.00
298,
633.
00
O
ther
Inst
ruct
ion
61,8
12.5
6
11
4,83
4.74
197,
166.
12
11
2,91
8.87
70,7
65.7
7
61
,632
.00
83,1
27.0
0
72
,385
.00
69,8
47.0
0
48
,475
.00
Adul
t/Con
tinui
ng E
duca
tion
5,56
9.00
5,56
9.00
5,44
7.00
7,60
1.00
Tuiti
on
371,
920.
45
19
,508
.00
44,0
72.0
0
63
,339
.00
5,28
0.00
6,14
7.00
Supp
ort S
ervi
ces:
Stud
ent a
nd In
stru
ctio
n R
elat
ed S
ervi
ces
1,69
0,71
0.83
1,
542,
126.
60
1,53
5,17
5.67
1,
572,
401.
09
1,45
9,59
1.98
1,
380,
107.
00
1,34
7,44
7.00
1,
399,
172.
00
1,34
7,99
7.00
1,
222,
073.
00
Scho
ol A
dmin
istra
tive
Serv
ices
364,
310.
70
36
5,92
7.47
407,
294.
76
44
8,34
3.44
367,
014.
34
45
9,49
6.00
450,
348.
00
46
2,78
3.00
461,
380.
00
48
2,55
3.00
Oth
er A
dmin
istra
tive
Serv
ices
728,
149.
27
64
1,82
6.82
593,
382.
17
62
3,70
3.54
674,
442.
09
31
0,63
1.00
282,
967.
00
32
1,05
3.00
309,
165.
00
37
5,02
9.00
Cen
tral S
ervi
ces
191,
611.
00
22
1,86
5.00
239,
603.
00
25
1,04
4.00
246,
625.
00
Pl
ant O
pera
tions
and
Mai
nten
ance
1,46
6,88
0.14
1,
309,
587.
66
1,15
2,79
1.38
1,
163,
808.
23
1,13
3,48
3.60
1,
007,
477.
00
1,04
8,11
8.00
1,
128,
000.
00
1,14
3,60
3.00
1,
082,
797.
00
Pupi
l Tra
nspo
rtatio
n55
9,23
1.05
519,
834.
55
46
8,48
4.94
547,
304.
64
49
8,07
0.61
581,
363.
00
52
0,97
3.00
521,
010.
00
57
1,80
9.00
570,
259.
00
Al
loca
ted
and
Una
lloca
ted
Bene
fits
2,90
4,40
9.81
2,
773,
501.
22
2,63
1,87
3.09
2,
614,
504.
61
2,58
7,04
9.43
3,
499,
739.
00
3,28
5,77
9.00
3,
363,
447.
00
3,17
1,59
1.00
3,
734,
581.
00
Rei
mbu
rsed
TPA
F Pe
nsio
n an
d So
cial
Sec
urity
1,55
4,96
2.52
1,
386,
351.
10
1,14
7,74
0.46
1,
042,
878.
11
1,18
3,42
1.93
D
ebt S
ervi
ce:
Prin
cipa
l66
0,00
0.00
655,
000.
00
65
0,00
0.00
595,
000.
00
59
0,00
0.00
580,
000.
00
57
5,00
0.00
545,
000.
00
54
0,00
0.00
540,
000.
00
In
tere
st a
nd O
ther
Cha
rges
155,
237.
50
22
4,03
8.50
199,
687.
50
22
2,61
3.34
297,
484.
00
31
8,47
2.00
338,
587.
00
35
6,80
7.00
371,
010.
00
38
3,95
5.00
Cap
ital O
utla
y23
3,27
5.60
551,
616.
31
28
8,45
1.45
316,
624.
07
34
5,41
6.78
78,0
11.0
0
53
,992
.00
516,
056.
00
67
0,78
9.00
1,04
0,30
7.00
Tota
l Exp
endi
ture
s16
,252
,966
.58
15,4
70,2
51.5
1
14
,454
,708
.46
14,4
04,0
73.9
3
14
,713
,266
.95
13,8
42,1
17.0
0
13
,647
,469
.00
14,7
48,7
25.0
0
14
,659
,727
.00
15,8
59,8
62.0
0
Exce
ss (D
efic
ienc
y) o
f Rev
enue
s O
ver (
Und
er) E
xpen
ditu
res
(355
,807
.76)
88
,729
.01
444,
846.
73
20
9,77
1.47
13,7
69.2
6
85
9,36
8.00
523,
638.
00
(1
,282
,662
.00)
(593
,298
.00)
(1
,075
,677
.00)
Oth
er
Fin
an
cin
g S
ou
rce
s (
Us
es
):
Proc
eeds
from
Bor
row
ing
198,
648.
00
70
,850
.00
Tran
sfer
s in
179,
815.
50
12
7,24
3.93
377,
012.
00
2,
149.
0062
6.00
6,00
9.00
31,7
50.0
0
Tr
ansf
ers
out
(179
,815
.50)
(1
27,2
43.9
3)
(377
,012
.00)
(2
,149
.00)
(6
26.0
0)(6
,009
.00)
(3
2,00
6.00
)
As
sets
Acq
uire
d U
nder
Cap
ital L
ease
s17
7,69
5.97
131,
589.
64
46
,975
.00
Can
cella
tion
of P
rior Y
ear A
ccou
nts
Rec
eiva
ble
(143
,405
.62)
(1
2,93
0.00
)
Tota
l Oth
er F
inan
cing
Sou
rces
(Use
s)-
177,
695.
97
-
131,
589.
64
(1
43,4
05.6
2)
46,9
75.0
0
-
-18
5,71
8.00
70,5
94.0
0
Net
Cha
nge
in F
und
Bala
nces
(355
,807
.76)
$
26
6,42
4.98
$
444,
846.
73$
34
1,36
1.11
$
(129
,636
.36)
$
90
6,34
3.00
$
523,
638.
00$
(1
,282
,662
.00)
$
(407
,580
.00)
$
(1
,005
,083
.00)
$
Deb
t Ser
vice
as
a Pe
rcen
tage
of
Non
capi
tal E
xpen
ditu
res
5.1%
5.9%
6.0%
5.8%
6.2%
6.5%
6.7%
6.3%
6.5%
6.2%
Sour
ce: E
xhib
it B-
2
TA
BE
RN
AC
LE
TO
WN
SH
IP S
CH
OO
L D
IST
RIC
T
Cha
nges
in F
und
Bala
nces
, Gov
ernm
enta
l Fun
dsLa
st T
en F
isca
l Yea
rs (M
odifi
ed A
ccru
al B
asis
of A
ccou
ntin
g)U
naudite
d
Fisc
al Y
ear E
nded
Jun
e 30
,
118

24750
Ex
hib
it J
-5
TA
BE
RN
AC
LE
TO
WN
SH
IP S
CH
OO
L D
IST
RIC
T
Gen
eral
Fun
d - O
ther
Loc
al R
even
ue b
y So
urce
Last
Ten
Fis
cal Y
ears
(Mod
ified
Acc
rual
Bas
is o
f Acc
ount
ing)
Unaudite
d
2017
2016
2015
2014
2013
2012
2011
2010
2009
2008
Inte
rest
on
Inve
stm
ents
7,95
2.33
$
5,97
8.88
$
5,30
8.44
$
11,5
40.5
4$
16,8
49.7
0$
35,3
64.0
0$
21,5
78.0
0$
27,7
99.0
0$
17,0
76.0
0$
64,4
48.0
0$
Tuiti
on
12,9
17.4
5
311,
182.
00
151,
921.
00
83,7
17.0
0
107,
928.
00
43,9
01.0
0
Ren
tals
40,2
40.0
0
37,3
00.0
0
37,0
00.0
0
37,0
80.0
0
37,4
00.0
0
37,0
00.0
0
37,0
00.0
0
37,0
00.0
0
37,0
00.0
0
37,0
00.0
0
Ref
und
of P
rior Y
ear E
xpen
ditu
res
4,59
4.43
1,56
6.08
16,4
69.2
1
14,9
54.2
0
16,8
17.8
6
Mis
cella
neou
s42
,999
.37
34
,375
.55
26
,400
.80
34
,949
.61
35
,571
.11
31
,958
.00
31
,268
.00
14
,523
.00
13
,857
.00
16
,612
.00
Tota
l Mis
cella
neou
s R
even
ues
95,7
86.1
3$
79,2
20.5
1$
85,1
78.4
5$
98,5
24.3
5$
119,
556.
12$
415,
504.
00$
241,
767.
00$
163,
039.
00$
175,
861.
00$
161,
961.
00$
Sour
ce: D
istri
ct R
ecor
ds
Fisc
al Y
ear E
nded
Jun
e 30
,
119

Revenue Capacity Information
Revenue capacity information is intended to assist users in understanding and assessingthe factors affecting the School District's ability to generate revenues. Please refer to thefollowing exhibits for a historical view of these factors and how they relate to the SchoolDistrict's ability to generate revenues.

24750
Ex
hib
it J
-6
Year
Tota
lEs
timat
ed A
ctua
lTo
tal D
irect
En
ded
Asse
ssed
Publ
ic
Net
Val
uatio
n (C
ount
y Eq
ualiz
ed )
Scho
ol T
ax
Dec
. 31
Vaca
nt L
and
Res
iden
tial
Farm
Qfa
rmC
omm
erci
alIn
dust
rial
Val
ueU
tiliti
es (1
)Ta
xabl
eVa
lue
Rat
e (2
)
2017
6,60
7,10
0.00
$
606,
683,
300.
00$
18,4
17,1
00.0
0$
2,90
0,70
0.00
$
24,6
82,4
00.0
0$
787,
800.
00$
660,
078,
400.
00$
92.0
0$
660,
078,
492.
00$
713,
907,
087.
00$
2.00
8$
20
166,
991,
200.
00
60
6,79
9,70
0.00
17
,483
,600
.00
2,
826,
100.
00
24
,676
,800
.00
78
7,80
0.00
659,
565,
200.
00
95.0
065
9,56
5,29
5.00
69
6,25
8,09
6.00
1.
949
2015
6,80
8,70
0.00
607,
142,
100.
00
17,8
81,8
00.0
0
2,93
5,40
0.00
24,7
46,2
00.0
0
787,
800.
0066
0,30
2,00
0.00
94
.00
660,
302,
094.
00
705,
526,
331.
00
1.93
2
20
147,
249,
000.
00
60
8,48
8,60
0.00
17
,450
,900
.00
2,
901,
500.
00
25
,481
,300
.00
92
1,50
0.00
662,
492,
800.
00
566,
903.
0066
3,05
9,70
3.00
69
8,00
1,15
9.00
1.
866
2013
8,40
2,00
0.00
683,
314,
500.
00
18,1
34,9
00.0
0
2,92
3,90
0.00
21,8
56,7
00.0
0
779,
100.
0073
5,41
1,10
0.00
83
8,71
5.00
736,
249,
815.
00
716,
149,
580.
00
1.61
7
20
128,
517,
000.
00
68
6,00
7,60
0.00
19
,298
,800
.00
2,
921,
400.
00
21
,868
,200
.00
77
9,10
0.00
739,
392,
100.
00
914,
672.
0074
0,30
6,77
2.00
75
9,81
1,50
2.00
1.
602
2011
8,95
5,10
0.00
688,
883,
800.
00
16,9
05,1
00.0
0
2,94
8,30
0.00
21,0
64,4
00.0
0
779,
100.
0073
9,53
5,80
0.00
92
2,00
0.00
740,
457,
800.
00
788,
894,
651.
00
1.61
4
20
109,
204,
600.
00
69
1,73
9,70
0.00
16
,903
,500
.00
2,
949,
300.
00
21
,463
,200
.00
77
9,10
0.00
743,
039,
400.
00
1,14
7,70
9.00
744,
187,
109.
00
821,
321,
385.
00
1.58
7
20
099,
823,
200.
00
68
8,32
6,30
0.00
16
,922
,300
.00
2,
968,
600.
00
21
,185
,900
.00
77
9,10
0.00
740,
005,
400.
00
1,11
8,77
7.00
741,
124,
177.
00
864,
849,
961.
00
1.58
2
20
0810
,979
,800
.00
68
0,40
3,90
0.00
17
,835
,400
.00
2,
739,
800.
00
19
,451
,500
.00
77
9,10
0.00
732,
189,
500.
00
1,04
2,75
0.00
733,
232,
250.
00
743,
737,
175.
00
1.58
8
(1) T
axab
le V
alue
of M
achi
nery
, Im
plem
ents
and
Equ
ipm
ent o
f Tel
epho
ne, T
eleg
raph
and
Mes
seng
er S
yste
m C
ompa
nies
(2)
Tax
Rat
es a
re p
er $
100.
00 o
f Ass
esse
d Va
luat
ion
Sour
ce: B
urlin
gton
Cou
nty
Boar
d of
Tax
atio
n
TA
BE
RN
AC
LE
TO
WN
SH
IP S
CH
OO
L D
IST
RIC
T
Asse
ssed
Val
ue a
nd A
ctua
l Val
ue o
f Tax
able
Pro
perty
Last
Ten
Fis
cal Y
ears
Unaudite
d
121

24750
Ex
hib
it J
-7
Year
Tota
l Dire
ctC
ount
yTo
tal D
irect
En
ded
Loca
lR
egio
nal
Scho
ol
Tabe
rnac
leBu
rling
ton
Cou
nty
Ope
nFi
rean
d O
verla
ppin
g D
ec. 3
1Sc
hool
Scho
olTa
x R
ate
Tow
nshi
pC
ount
yLi
brar
ySp
ace
Dis
trict
Tax
Rat
e
2017
1.25
1$
0.75
7$
2.00
8$
0.
422
$
0.
363
$
0.
034
$
0.
043
$
2.
870
$20
161.
229
0.72
01.
949
0.40
2
0.35
5
0.03
3
0.04
22.
781
2015
1.18
80.
744
1.93
2
0.
381
0.
366
0.
035
0.
043
2.75
720
141.
128
0.73
81.
866
0.30
9
0.35
2
0.03
3
0.01
60.
072
$
2.
648
2013
0.98
70.
630
1.61
7
0.
257
0.
324
0.
030
0.
015
0.06
52.
308
2012
0.98
40.
618
1.60
2
0.
237
0.
317
0.
031
0.
041
0.06
12.
289
2011
0.97
80.
636
1.61
4
0.
237
0.
328
0.
032
0.
043
0.04
42.
298
2010
0.97
50.
612
1.58
7
0.
237
0.
342
0.
033
0.
045
0.06
22.
306
2009
0.96
90.
613
1.58
2
0.
237
0.
362
0.
035
0.
047
0.06
02.
323
2008
0.95
0
0.
638
1.58
8
0.
238
0.
367
0.
034
0.
047
0.05
92.
333
Sour
ce: M
unic
ipal
Tax
Col
lect
or
TA
BE
RN
AC
LE
TO
WN
SH
IP S
CH
OO
L D
IST
RIC
TD
irect
and
Ove
rlapp
ing
Prop
erty
Tax
Rat
esLa
st T
en F
isca
l Yea
rs(R
ate
per $
100
of A
sses
sed
Valu
e)U
naudite
d
Dis
trict
Dire
ct R
ate
Ove
rlapp
ing
Rat
es
122

24750
Exh
ibit
J-8
Taxa
ble
% o
f Tot
alTa
xabl
e%
of T
otal
Asse
ssed
Dis
trict
Net
As
sess
edD
istri
ct N
et
Taxp
ayer
Valu
eR
ank
Asse
ssed
Val
ueVa
lue
Ran
kAs
sess
ed V
alue
Pine
land
s Ac
res,
LLC
2,80
0,00
0.00
$
1
0.42
%Al
lenw
ood
Esta
te, L
LC2,
700,
000.
00
20.
41%
790,
400.
00$
4
0.11
%Ta
bern
acle
Equ
ities
, LLC
1,73
3,00
0.00
3
0.26
%R
usso
s Fr
uit &
Veg
Far
m In
c1,
483,
800.
00
40.
22%
Con
te E
nter
pris
es, L
LC1,
119,
100.
00
50.
17%
1,68
2,20
0.00
1
0.23
%Th
e Es
s G
roup
, Inc
978,
700.
00
6
0.15
%R
usso
s Fr
uit &
Veg
Far
m In
c95
3,20
0.00
70.
14%
Cm
att L
LC94
0,70
0.00
80.
14%
Indi
vidu
al T
axpa
yer #
186
8,00
0.00
90.
13%
1488
Rou
te 2
06 L
LC84
1,00
0.00
100.
13%
1,02
0,70
0.00
2
0.14
%In
divi
dual
Tax
paye
r #2
886,
800.
00
3
0.12
%In
divi
dual
Tax
paye
r #3
737,
900.
00
5
0.10
%In
divi
dual
Tax
paye
r #4
702,
000.
00
6
0.10
%In
divi
dual
Tax
paye
r #5
676,
100.
00
7
0.09
%A&
B Tr
ucki
ng64
6,40
0.00
80.
09%
Indi
vidu
al T
axpa
yer #
664
2,30
0.00
90.
09%
Indi
vidu
al T
axpa
yer #
763
9,40
0.00
100.
09%
Tota
l14
,417
,500
.00
$
2.
18%
8,42
4,20
0.00
$
1.
15%
2017
2008
TA
BE
RN
AC
LE
TO
WN
SH
IP S
CH
OO
L D
IST
RIC
TPr
inci
pal P
rope
rty T
ax P
ayer
sC
urre
nt Y
ear a
nd N
ine
Year
s Ag
oU
naudite
d
123

24750 Exhibit J-9
School DistrictTaxes Levied
Fiscal Year for the Percentage Collections inEnded June 30, Fiscal Year Amount of Levy Subsequent Years
2017 8,103,180.00$ 8,103,180.00$ 100.00% -2016 7,842,111.00 7,842,111.00 100.00% -2015 7,480,274.00 7,480,274.00 100.00% -2014 7,271,119.00 7,271,119.00 100.00% -2013 7,284,097.00 7,284,097.00 100.00% -2012 7,226,887.00 7,226,887.00 100.00% -2011 7,259,411.00 7,259,411.00 100.00% -2010 7,175,650.00 7,175,650.00 100.00% -2009 6,961,257.00 6,961,257.00 100.00% -2008 6,845,540.00 6,845,540.00 100.00% -
(1) School taxes are collected by the Municipal Tax Collector. Under New Jersey State Statute, a municipality is required to remit to the school district the entire property tax balance, in the amount voted upon or certified prior to the end of the school year.
Source: District Records
Collected within the Fiscal Year of the Levy (1)
TABERNACLE TOWNSHIP SCHOOL DISTRICTProperty Tax Levies and Collections
Last Ten Fiscal YearsUnaudited
124

Debt Capacity Information
Debt capacity information is intended to assist users in understanding and assessing theSchool District's debt burden and it’s ability to issue additional debt. Please refer to thefollowing exhibits for a historical view of the School District's outstanding debt and its debtcapacity.
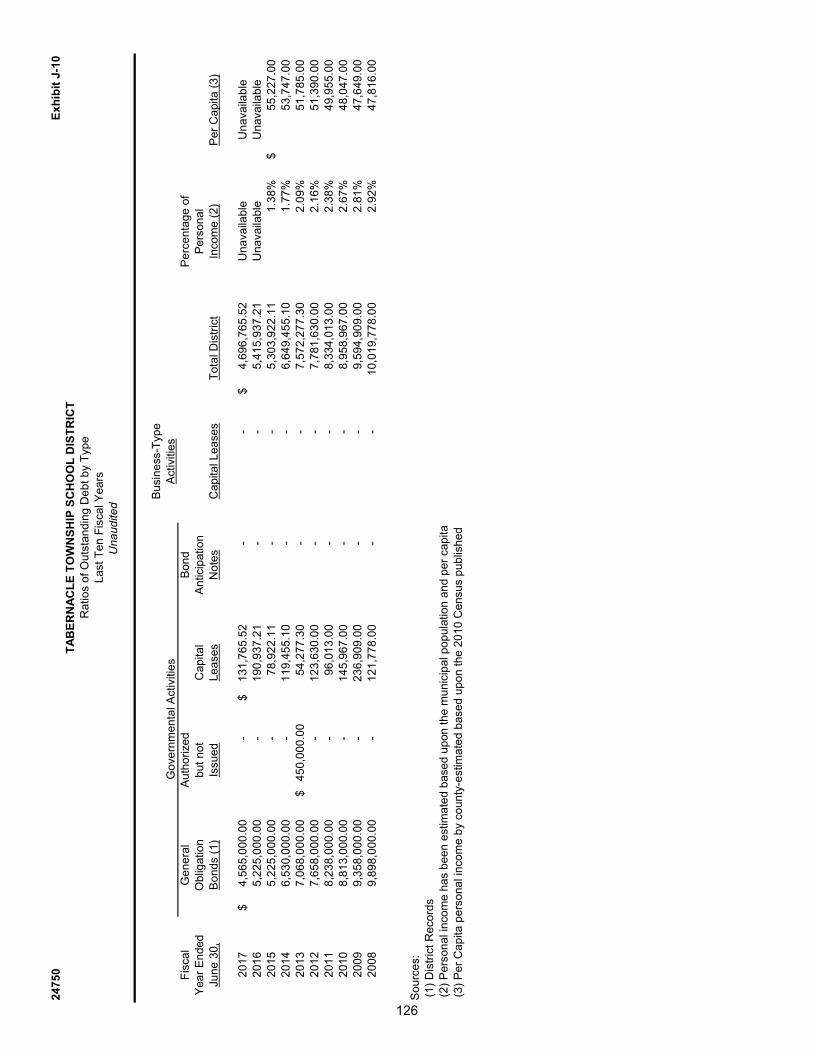
24750
Exh
ibit
J-1
0
Busi
ness
-Typ
e Ac
tiviti
esFi
scal
Gen
eral
Au
thor
ized
Bond
Pe
rcen
tage
of
Year
End
edO
blig
atio
n bu
t not
Cap
ital
Antic
ipat
ion
Pers
onal
June
30,
Bond
s (1
)Is
sued
Leas
esN
otes
Cap
ital L
ease
sTo
tal D
istri
ctIn
com
e (2
)Pe
r Cap
ita (3
)
2017
4,56
5,00
0.00
$
-
131,
765.
52$
-
-4,
696,
765.
52$
Una
vaila
ble
Una
vaila
ble
2016
5,22
5,00
0.00
-
190,
937.
21
-
-5,
415,
937.
21
Una
vaila
ble
Una
vaila
ble
2015
5,22
5,00
0.00
-
78,9
22.1
1
--
5,30
3,92
2.11
1.
38%
55,2
27.0
0$
2014
6,53
0,00
0.00
-
119,
455.
10
-
-6,
649,
455.
10
1.77
%53
,747
.00
2013
7,06
8,00
0.00
45
0,00
0.00
$
54,2
77.3
0
--
7,57
2,27
7.30
2.
09%
51,7
85.0
020
127,
658,
000.
00
-12
3,63
0.00
--
7,78
1,63
0.00
2.
16%
51,3
90.0
020
118,
238,
000.
00
-96
,013
.00
-
-8,
334,
013.
00
2.38
%49
,955
.00
2010
8,81
3,00
0.00
-
145,
967.
00
-
-8,
958,
967.
00
2.67
%48
,047
.00
2009
9,35
8,00
0.00
-
236,
909.
00
-
-9,
594,
909.
00
2.81
%47
,649
.00
2008
9,89
8,00
0.00
-
121,
778.
00
-
-10
,019
,778
.00
2.92
%47
,816
.00
Sour
ces:
(1
) Dis
trict
Rec
ords
(2) P
erso
nal i
ncom
e ha
s be
en e
stim
ated
bas
ed u
pon
the
mun
icip
al p
opul
atio
n an
d pe
r cap
ita (3
) Per
Cap
ita p
erso
nal i
ncom
e by
cou
nty-
estim
ated
bas
ed u
pon
the
2010
Cen
sus
publ
ishe
d
Gov
ernm
enta
l Act
iviti
es
TA
BE
RN
AC
LE
TO
WN
SH
IP S
CH
OO
L D
IST
RIC
TR
atio
s of
Out
stan
ding
Deb
t by
Type
Last
Ten
Fis
cal Y
ears
Unaudite
d
126

24750 Exhibit J-11
Percentage of General Net General Net Assessed
Fiscal Year Obligation Bonded Debt ValuationEnded June 30, Bonds Deductions Outstanding (1) Taxable (2) Per Capita (3)
2017 4,565,000.00$ - 4,565,000.00$ 0.69% Unavailable2016 5,225,000.00 - 5,225,000.00 0.79% 758.13$ 2015 5,880,000.00 - 5,880,000.00 0.89% 845.562014 6,530,000.00 - 6,530,000.00 0.98% 935.662013 7,068,000.00 - 7,068,000.00 0.96% 1,012.46 2012 7,658,000.00 - 7,658,000.00 1.03% 1,091.51 2011 8,238,000.00 - 8,238,000.00 1.11% 1,175.18 2010 8,813,000.00 - 8,813,000.00 1.19% 1,260.62 2009 9,358,000.00 - 9,358,000.00 1.28% 1,305.16 2008 9,898,000.00 - 9,898,000.00 1.36% 1,380.86
Sources: (1) District Records (2) Net Assessed Valuation provided by Abstract of Ratables, County Board of Taxation (3) Per Capita calculation based upon population information provided by the NJ Dept of Labor and Workforce Development
General Bonded Debt Outstanding
TABERNACLE TOWNSHIP SCHOOL DISTRICTRatios of Net General Bonded Debt Outstanding
Last Ten Fiscal YearsUnaudited
127

24750
Exh
ibit
J-1
2
TA
BE
RN
AC
LE
TO
WN
SH
IP S
CH
OO
L D
IST
RIC
TD
irect
and
Ove
rlapp
ing
Gov
ernm
enta
l Act
iviti
es D
ebt
As o
f Dec
embe
r 31,
201
6U
naudite
d
Net
Deb
tSt
atut
ory
Out
stan
ding
Net
Deb
tAl
loca
ted
toG
ross
Deb
tD
educ
tions
Out
stan
ding
Tabe
rnac
le T
owns
hip
Mun
icip
al D
ebt:
(1)
Tabe
rnac
le T
owns
hip
Scho
ol D
istri
ct
4,56
5,00
0.00
$
4,56
5,00
0.00
$
Reg
iona
l Hig
h Sc
hool
Dis
trict
2,41
3,41
8.78
2,41
3,41
8.78
Tabe
rnac
le T
owns
hip
9,93
1,69
7.85
18,6
26.8
99,
913,
070.
96$
9,91
3,07
0.96
$
16,9
10,1
16.6
3
6,
997,
045.
67
9,
913,
070.
969,
913,
070.
96
Ove
rlapp
ing
Deb
t App
ortio
ned
to
the
Mun
icip
ality
:C
ount
y of
Bur
lingt
on: (
2)So
lid W
aste
Util
ity:
Bond
s68
,116
,000
.00
68,1
16,0
00.0
0
G
ener
al:
Bond
s26
7,57
8,64
5.00
31,0
63,6
39.0
0
(3
)23
6,51
5,00
6.00
(5)
3,55
0,47
5.41
Bo
nds
Issu
ed b
y O
ther
Pub
lic B
odie
sG
uara
ntee
d by
the
Cou
nty
329,
726,
000.
0032
9,72
6,00
0.00
(4
)
665,
420,
645.
0042
8,90
5,63
9.00
236,
515,
006.
003,
550,
475.
41
682,
330,
761.
63$
435,
902,
684.
67$
246,
428,
076.
96$
13
,463
,546
.37
$
Sour
ces:
(1)
2016
Ann
ual D
ebt S
tate
men
t(2
)C
ount
y's 2
016
Audi
t Rep
ort
(3)
Incl
udes
Cas
h on
Han
d, A
ccou
nts
Rec
eiva
ble
and
Cou
nty
Col
lege
Bon
ds p
aid
with
Sta
te A
id.
(4)
Ded
uctib
le in
acc
orda
nce
with
N.J
.S. 4
0:37
A-80
.(5
)Su
ch d
ebt i
s al
loca
ted
as a
pro
porti
on o
f the
Tow
nshi
p's
shar
e of
the
tota
l 201
6 Eq
ualiz
ed V
alue
, whi
ch is
1.5
0%.
The
sour
ce fo
r thi
s co
mpu
tatio
n w
as th
e 20
16 T
able
of E
qual
ized
Val
uatio
ns, w
hich
is s
uppl
ied
by th
e N
ew J
erse
y D
ivis
ion
of T
axat
ion.
128

24750
Exh
ibit
J-1
3
Leg
al D
eb
t M
arg
in C
alc
ula
tio
n f
or
Fis
cal Y
ear
2017
Equa
lized
val
uatio
n ba
sis
(1)
713,
351,
936
$
2016
697,
035,
786
2015
707,
867,
080
2014
2,11
8,25
4,80
2$
706,
084,
934
$
Aver
age
equa
lized
val
uatio
n of
taxa
ble
prop
erty
21,1
82,5
48$
Deb
t lim
it (3
% o
f ave
rage
equ
aliz
atio
n va
lue)
(2)
4,56
5,00
0To
tal N
et D
ebt A
pplic
able
to L
imit
16,6
17,5
48$
Lega
l Deb
t Mar
gin
2017
2016
2015
2014
2013
2012
2011
2010
2009
2008
Deb
t lim
it21
,182
,548
$
21
,087
,799
$
21
,265
,090
$
21
,769
,846
$
22
,684
,981
$
23
,653
,774
$
25
,237
,930
$
25
,064
,650
$
24
,636
,915
$
22
,818
,754
$
Tota
l net
deb
t app
licab
le to
lim
it (3
)4,
565,
000
5,22
5,00
0
5,
880,
000
6,53
0,00
0
7,
518,
000
7,65
8,00
0
8,
238,
000
8,81
3,00
0
9,
358,
000
9,89
8,00
0
Lega
l deb
t mar
gin
16,6
17,5
48$
15,8
62,7
99$
15,3
85,0
90$
15,2
39,8
46$
15,1
66,9
81$
15,9
95,7
74$
16,9
99,9
30$
16,2
51,6
50$
15,2
78,9
15$
12,9
20,7
54$
Tota
l net
deb
t app
licab
le to
the
limit
as a
per
cent
age
of d
ebt l
imit
21.5
5%24
.78%
27.6
5%30
.00%
33.1
4%32
.38%
32.6
4%35
.16%
37.9
8%43
.38%
`
Sour
ces:
(1)
Equa
lized
val
uatio
n ba
ses
wer
e pr
ovid
ed b
y th
e An
nual
Rep
ort o
f the
Sta
te o
f New
Jer
sey,
Dep
artm
ent o
f Tre
asur
y, D
ivis
ion
of T
axat
ion.
(2)
Lim
it se
t by
NJS
A 18
A:24
-19
for a
K th
roug
h 8
dist
rict.
(3)
Dis
trict
Rec
ords
Fisc
al Y
ear E
nded
Jun
e 30
,
TA
BE
RN
AC
LE
TO
WN
SH
IP S
CH
OO
L D
IST
RIC
T
Lega
l Deb
t Mar
gin
Info
rmat
ion
Last
Ten
Fis
cal Y
ears
Unaudite
d
129

Demographic and Economic InformationDemographic and economic information is intended (1) to assist users in understandingthe socioeconomic environment within which the School District operates and (2) toprovide information that facilitates comparisons of financial statement information overtime and among school districts. Please refer to the following exhibits for a historical viewof the demographic and economic statistics and factors prevalent in the location in whichthe School District operates.

24750 Exhibit J-14
Per Capita Personal Personal Unemployment
Year Population (1) Income (2) Income (3) Rate (4)
2016 6,892 Unavailable Unavailable 4.7%2015 6,954 384,048,558.00$ 55,227.00$ 5.3%2014 6,979 375,100,313.00 53,747.00 5.8%2013 6,981 361,511,085.00 51,785.00 5.8%2012 7,016 360,552,240.00 51,390.00 5.2%2011 7,010 350,184,550.00 49,955.00 5.0%2010 6,991 335,896,577.00 48,047.00 5.1%2009 7,170 341,643,330.00 47,649.00 4.8%2008 7,168 342,745,088.00 47,816.00 2.7%2007 7,182 331,722,216.00 46,188.00 2.0%
Sources: (1) Population information provided by the NJ Dept of Labor and Workforce Development(2) Personal income has been estimated based upon the municipal population and per capita(3) Per Capita personal income by county-estimated based upon the 2010 Census published (4) Unemployment data provided by the NJ Dept of Labor and Workforce Development
Demographic and Economic StatisticsLast Ten Fiscal Years
Unaudited
TABERNACLE TOWNSHIP SCHOOL DISTRICT
131
24750
Ex
hib
it J
-15
Perc
enta
gePe
rcen
tage
of T
otal
of T
otal
Mun
icip
alM
unic
ipal
Empl
oyer
Empl
oyee
sR
ank
Empl
oym
ent
Empl
oyee
sR
ank
Empl
oym
ent
--
--
Info
rmat
ion
Una
vaila
ble
2008
2017
TA
BE
RN
AC
LE
TO
WN
SH
IP S
CH
OO
L D
IST
RIC
T
Prin
cipa
l Non
-Gov
ernm
enta
l Em
ploy
ers
Cur
rent
Yea
r and
Nin
e Ye
ars
Ago
Unaudite
d
132

Operating Information
Operating information is intended to provide contextual information about the SchoolDistrict's operations and resources to assist readers in using financial statementinformation to understand and assess the School District's economic condition. Pleaserefer to the following exhibits for a historical view of the factors and statistics pertinent tothe School District's operations.

24
75
0E
xh
ibit
J-1
6
2017
2016
2015
2014
2013
2012
2011
2010
(a)
2009
(a)
2008
Fu
ncti
on
/Pro
gra
m
Inst
ruct
ion
Reg
ular
& S
peci
al E
duca
tion
73
68
68
70
70
63
95
74
Oth
er In
stru
ctio
n12
12
13
14
14
16
20
21
Su
ppor
t Ser
vice
s:St
uden
t & In
stru
ctio
n R
elat
ed S
ervi
ces
77
84
512
4
4O
ther
Sup
port
Serv
ices
22
23
36
Inst
ruct
iona
l Sta
ff Tr
aini
ng3
Med
ia C
ente
r2
22
22
26
Scho
ol A
dmin
istra
tive
Serv
ices
99
10
77
12
98
Gen
eral
Adm
inis
trativ
e Se
rvic
es2
22
22
23
2Pl
ant O
pera
tions
& M
aint
enan
ce12
13
15
14
13
13
8
13
Pupi
l tra
nspo
rtatio
n11
16
15
13
13
15
16
17
Bu
sine
ss &
Oth
er S
uppo
rt Se
rvic
es3
55
44
33
4
Tota
l13
3
13
6
14
0
13
2
13
2
13
6
16
0
-
-
15
6
Sour
ce: D
istri
ct R
ecor
ds(a
) In
form
atio
n U
nava
ilabl
e
Fisc
al Y
ear E
nded
Jun
e 30
,
TA
BE
RN
AC
LE
TO
WN
SH
IP S
CH
OO
L D
IST
RIC
T
Full-
time
Equi
vale
nt D
istri
ct E
mpl
oyee
s by
Fun
ctio
n/Pr
ogra
mLa
st T
en F
isca
l Yea
rsU
na
ud
ite
d
134

24750
Exh
ibit
J-1
7
Fisc
alYe
arAv
erag
e D
aily
Av
erag
e D
aily
%
Cha
nge
in
Stud
ent
Ende
dO
pera
ting
Cos
t Per
Pe
rcen
tage
Teac
hing
Pu
pil/T
each
erEn
rollm
ent
Atte
ndan
ce
Aver
age
Dai
ly
Atte
ndan
ceJu
ne 3
0,En
rollm
ent
Expe
nditu
res
Pupi
lC
hang
eSt
aff
Rat
io(A
DE)
(AD
A)En
rollm
ent
Perc
enta
ge
2017
707
$
1
5,20
4,45
3.48
$
2
1,50
5.59
13
.96%
73
11.2
/170
9 68
3 -7
.92%
96.3
3%20
16
7
44
14,
039,
596.
70
18,
870.
43
8.41
%74
10
.1/1
770
738
0.92
%95
.84%
2015
765
1
3,31
6,56
9.51
1
7,40
7.28
-0
.04%
75
10.2
/176
3 73
0 -4
.27%
95.6
7%20
14
7
62
13,
269,
836.
52
17,
414.
48
4.25
%72
10
.6/1
797
763
-2.6
9%95
.73%
2013
807
1
3,48
0,36
6.17
1
6,70
4.30
9.
74%
75
10.0
/181
9 78
6 -1
.09%
95.9
7%20
12
8
28
12,
603,
850.
00
15,
222.
04
7.77
%83
10
.0/1
828
794
-4.8
3%95
.89%
2011
870
1
2,28
8,32
7.00
1
4,12
4.51
-5
.71%
78
11.2
/187
0 82
8 -0
.34%
95.1
7%20
10
8
73
13,
077,
928.
00
14,
980.
44
2.63
%77
11
.3/1
873
836
-2.5
7%95
.76%
2009
896
1
3,07
7,92
8.00
1
4,59
5.90
-7
.57%
80
11.2
/189
6 85
6 1.
82%
95.5
4%20
08
8
80
13,
895,
601.
00
15,
790.
46
10.7
1%85
10
.4/1
880
838
-1.7
9%95
.23%
Sour
ces:
D
istri
ct R
ecor
ds
TA
BE
RN
AC
LE
TO
WN
SH
IP S
CH
OO
L D
IST
RIC
TO
pera
ting
Stat
istic
sLa
st T
en F
isca
l Yea
rsU
naudite
d
135
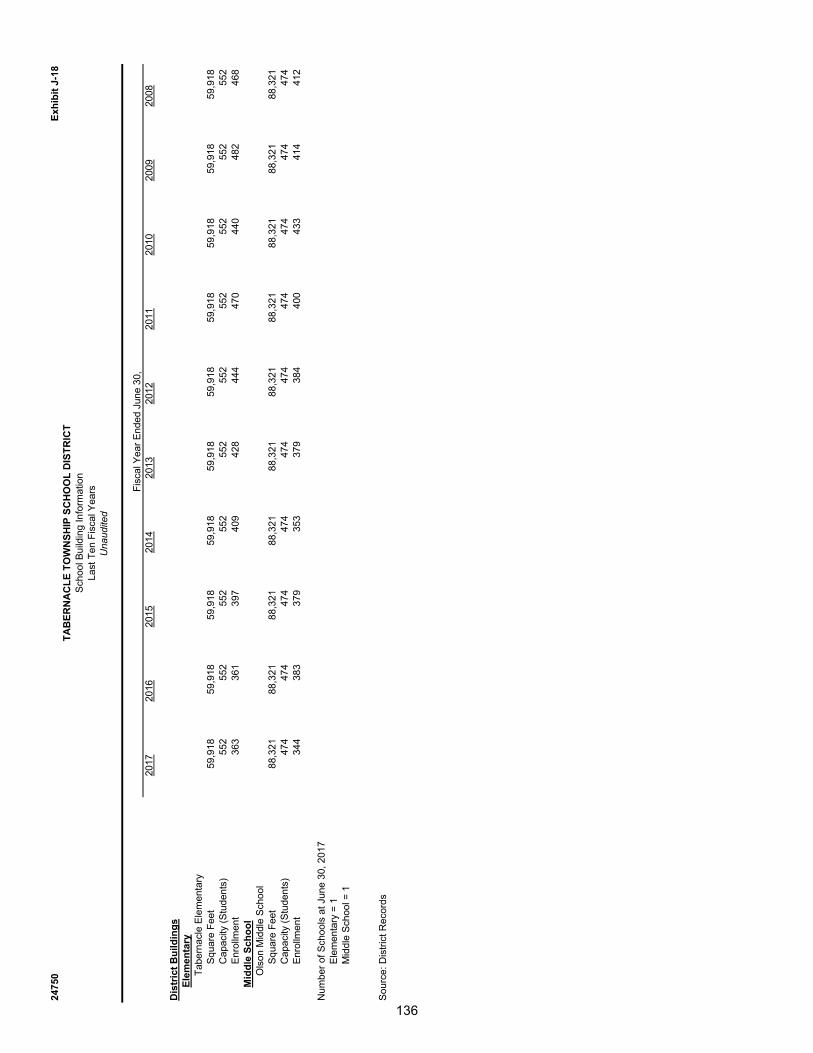
24750
Exh
ibit
J-1
8
2017
2016
2015
2014
2013
2012
2011
2010
2009
2008
Dis
tric
t B
uild
ing
sE
lem
en
tary
Tabe
rnac
le E
lem
enta
rySq
uare
Fee
t59
,918
59
,918
59
,918
59
,918
59
,918
59
,918
59
,918
59
,918
59
,918
59
,918
C
apac
ity (S
tude
nts)
552
55
2
552
55
2
552
55
2
552
55
2
552
55
2
Enro
llmen
t36
3
361
39
7
409
42
8
444
47
0
440
48
2
468
M
idd
le S
ch
oo
lO
lson
Mid
dle
Scho
olSq
uare
Fee
t88
,321
88
,321
88
,321
88
,321
88
,321
88
,321
88
,321
88
,321
88
,321
88
,321
C
apac
ity (S
tude
nts)
474
47
4
474
47
4
474
47
4
474
47
4
474
47
4
Enro
llmen
t34
4
383
37
9
353
37
9
384
40
0
433
41
4
412
Num
ber o
f Sch
ools
at J
une
30, 2
017
Elem
enta
ry =
1M
iddl
e Sc
hool
= 1
Sour
ce: D
istri
ct R
ecor
ds
Fisc
al Y
ear E
nded
Jun
e 30
,
Last
Ten
Fis
cal Y
ears
Unaudite
d
TA
BE
RN
AC
LE
TO
WN
SH
IP S
CH
OO
L D
IST
RIC
T
Scho
ol B
uild
ing
Info
rmat
ion
136

24750
Exh
ibit
J-1
9
TA
BE
RN
AC
LE
TO
WN
SH
IP S
CH
OO
L D
IST
RIC
T
Sche
dule
of R
equi
red
Mai
nten
ance
Last
Ten
Fis
cal Y
ears
Unaudite
d
* Sch
ool F
acilit
ies
Proj
ect #
(s)
2017
2016
2015
2014
2013
2012
2011
2010
2009
2008
Tabe
rnac
le E
lem
enta
ryS1
147,
114.
45$
12
5,32
3.06
$
124,
321.
11$
13
2,70
2.12
$
110,
213.
00$
29
,234
.00
$
41,3
66.0
0$
55
,424
.00
$
42,2
93.0
0$
41
,390
.00
$
Ols
on M
iddl
e Sc
hool
S233
2,19
0.47
189,
496.
29
17
9,76
2.16
180,
535.
45
10
2,47
5.00
39,7
49.0
0
48
,824
.00
72,2
08.0
0
64
,856
.00
48,5
95.0
0
Tota
l Sch
ool F
acilit
ies
479,
304.
92
31
4,81
9.35
304,
083.
27
31
3,23
7.57
212,
688.
00
68
,983
.00
90,1
90.0
0
12
7,63
2.00
107,
149.
00
89
,985
.00
Oth
er F
acilit
ies
--
--
--
--
--
Gra
nd T
otal
479,
304.
92$
31
4,81
9.35
$
304,
083.
27$
31
3,23
7.57
$
212,
688.
00$
68
,983
.00
$
90,1
90.0
0$
12
7,63
2.00
$
107,
149.
00$
89
,985
.00
$
* Sch
ool F
acilit
ies
as d
efin
ed u
nder
EFC
FA. (
N.J
.A.C
. 6A:
26-1
.2 a
nd N
.J.A
.C. 6
A:26
A-1.
3)
Sour
ce: D
istri
ct R
ecor
ds
UN
DIS
TR
IBU
TE
D E
XP
EN
DIT
UR
ES
- R
EQ
UIR
ED
MA
INT
EN
AN
CE
FO
R S
CH
OO
L F
AC
ILIT
IES
(11-0
00-2
61-X
XX
)
Fisc
al Y
ear E
nded
Jun
e 30
,
137

24750 Exhibit J-20
TABERNACLE TOWNSHIP SCHOOL DISTRICT
Insurance ScheduleJune 30, 2017
Unaudited
Coverage Deductible
Burlington County Insurance Pool Joint Insurance Fund
Property / Inland Marine / Automobile Physical Damage - JIF Self Insured Retention 250,000.00$ 500.00$ Crime - JIF Self Insured Retention 250,000.00 500.00 General Liability / Auto Liability - JIF Self Insured Retention 250,000.00 Educators Legal Liability - JIF Self Insured Retention 175,000.00 Workers Compensation - JIF Self Insured Retention 250,000.00
School Pool for Excess Liability Limits Joint Insurance Fund (SPELL JIF)
Property / Inland Marine / Automobile Physical Damage 175,000,000.00 Crime 500,000.00 Workers Compensation StatutoryGeneral Liability / Auto Liability 20,000,000.00 Educators' Legal Liability 20,000,000.00
Travelers Insurance Company
Boiler and Machinery 125,000,000.00 1,000.00 Beazley / Lloyd's of London
Pollution Legal Liability 3,000,000.00 25,000.00 AIG / Lexington Insurance Company, Inc.
Cyber Liability 1,000,000.00 25,000.00 Lloyd's of London
Violent Malicious Acts 1,000,000.00 15,000.00 Disaster Management Services 2,000,000.00 15,000.00
Non-JIF Coverage
Selective Insurance Company of America:Business Administrator/Board Secretary 100,000.00Treasurer 200,000.00
Excess and Reinsurance Carriers Involved
Property and Crime:SPELL JIF, Great American Insurance CompanyAxis Surplus Insurance CompanyWestchester Fire Insurance CompanyAlterra Excess & Surplus Insurance CompanyIronshore Specialty Insurance CompanyEvanston Insurance CompanyRSUI Indemnity CompanyJames River Insurance CompanyBRIT / Lloyd's of LondonColony Insurance CompanyArch Specialty Insurance CompanyUnited National Insurance Company
General Liability and Automobile Liability:SPELL JIF, Great American Insurance Company
Workers Compensation:SPELL JIF, Great American Insurance Company, Safety National Casualty Corp.
Educators Legal Liability:SPELL JIF, Great American Insurance Company
Source: District Records
138

SINGLE AUDIT SECTION

Exhibit K-2
REPORT ON COMPLIANCE FOR EACH MAJOR PROGRAM AND REPORT ON INTERNAL CONTROLOVER COMPLIANCE REQUIRED BY THE STATE OF NEW JERSEY CIRCULAR 15-08-OMB
INDEPENDENT AUDITOR’S REPORT
The Honorable President andMembers of the Board of EducationTownship of Tabernacle School DistrictCounty of BurlingtonTabernacle New Jersey 08088
Report on Compliance for Each State Program
We have audited the Township of Tabernacle School District’s, in the County of Burlington, State of New Jersey,compliance with the types of compliance requirements described in the New Jersey State Grant Compliance Supplement that could have a direct and material effect on the School District’s major state program for the fiscal year ended June 30, 2017. The School District's major state program is identified in the Summary of Auditor's Results section of the accompanying Schedule of Findings and Questioned Costs.
Management’s Responsibility
Management is responsible for compliance with state statutes, regulations, and the terms and conditions of its state awards applicable to its state programs.
Auditor’s Responsibility
Our responsibility is to express an opinion on compliance for the School District’s major state program based on our audit of the types of compliance requirements referred to above. We conducted our audit of compliance in accordance with auditing standards generally accepted in the United States of America; the standards applicable to financial audits contained in Government Auditing Standards, issued by the Comptroller General of the United States; audit requirements as prescribed by the Division of Administration and Finance, Department of Education, State of New Jersey; and State of New Jersey Circular 15-08-OMB, Single Audit Policy for Recipients of Federal Grants, State Grants and State Aid. Those standards, and State of New Jersey Circular 15-08-OMB, require that we plan and perform the audit to obtain reasonable assurance about whether noncompliance with the types of compliance requirements referred to above that could have a direct and material effect on a major state program occurred. An audit includes examining, on a test basis, evidence about the Township of Tabernacle School District's, in the County of Burlington, State of New Jersey, compliance with those requirements and performing such other procedures as we considered necessary in the circumstances.
We believe that our audit provides a reasonable basis for our opinion on compliance for the major state program. However, our audit does not provide a legal determination of the School District's compliance.
Opinion on Each Major State Program
In our opinion, the Township of Tabernacle School District, in the County of Burlington, State of New Jersey, complied, in all material respects, with the types of compliance requirements referred to above that could have a direct and material effect on its major state program for the fiscal year ended June 30, 2017.
140

24750 Exhibit K-2
Report on Internal Control Over Compliance
Management of the Township of Tabernacle School District, in the County of Burlington, State of New Jersey, is responsible for establishing and maintaining effective internal control over compliance with the types of compliance requirements referred to above. In planning and performing our audit of compliance, we considered the School District's internal control over compliance with the types of requirements that could have a direct and material effect on its major state program to determine the auditing procedures that are appropriate in the circumstances for the purpose of expressing an opinion on compliance for its major state program and to test and report on internal control over compliance in accordance with State of New Jersey Circular 15-08-OMB, but not for the purpose of expressing an opinion on the effectiveness of internal control over compliance. Accordingly, we do not express an opinion on the effectiveness of the School District’s internal control over compliance.
A deficiency in internal control over compliance exists when the design or operation of a control over compliance does not allow management or employees, in the normal course of performing their assigned functions, to prevent, or detect and correct, noncompliance with a type of compliance requirement of a state program on a timely basis. A material weakness in internal control over compliance is a deficiency, or combination of deficiencies, in internal control over compliance, such that there is a reasonable possibility that material noncompliance with a type of compliance requirement of a state program will not be prevented, or detected and corrected, on a timely basis. A significant deficiency in internal control over compliance is a deficiency, or a combination of deficiencies, in internal control over compliance with a type of compliance requirement of a state program that is less severe than a material weakness in internal control over compliance, yet important enough to merit attention by those charged with governance.
Our consideration of internal control over compliance was for the limited purpose described in the first paragraph of this section and was not designed to identify all deficiencies in internal control over compliance that might bematerial weaknesses or significant deficiencies. We did not identify any deficiencies in internal control over compliance that we consider to be material weaknesses. However, material weaknesses may exist that have not been identified.
The purpose of this report on internal control over compliance is solely to describe the scope of our testing of internal control over compliance and the results of that testing based on the requirements of State of New Jersey Circular 15-08-OMB. Accordingly, this report is not suitable for any other purpose.
Respectfully submitted,
BOWMAN & COMPANY LLPCertified Public Accountants& Consultants
Daniel M. DiGangiCertified Public AccountantPublic School Accountant No. CS 002376
Voorhees, New JerseyNovember 8, 2017
141

24750
Federal Grantor/ Federal Federal Carryover /Pass-through CFDA FAIN Pass-through Entity Award Grant Period Balance (Walkover)Grantor / Program Title Number Number Identifying Number Amount From To June 30, 2016 Amount
Special Revenue Fund: U.S. Department of Education: Passed-through State Department of Education: N.C.L.B.: Title I, Part A 84.010A S010A150030 NCLB513016 53,786.00$ 7-1-15 6-30-16 (17,815.00)$ Title I, Part A 84.010A S010A160030 NCLB513017 63,618.00 7-1-16 6-30-17
Total Title I, Part A (17,815.00) -
Title II, Part A, Improving Teacher Quality 84.367A S367A150029 NCLB513016 25,223.00 7-1-15 6-30-16 (7,396.00) Title II, Part A, Improving Teacher Quality 84.367A S367A160029 NCLB513017 12,115.00 7-1-16 6-30-17
Total Title II, Part A, Improving Teacher Quality (7,396.00) -
Title III 84.365A S365A160030 NCLB513017 1,935.00 7-1-16 6-30-17 - -
I.D.E.A. Part B: Special Education Cluster:
Basic 84.027 H027A160100 FT513017 179,457.00 7-1-16 6-30-17Preschool 84.173 H173A160114 PS513017 8,065.00 7-1-16 6-30-17
Total I.D.E.A. Part B Special Education Cluster - -
Total Special Revenue Fund (25,211.00) -
Enterprise Fund: U.S. Department of Agriculture: Passed-through State Department of Education: Child Nutrition Cluster: National School Lunch Program 10.555 16161NJ304N1099 Unavailable 49,105.74 7-1-15 6-30-16 (4,163.29) National School Lunch Program 10.555 171NJ304N1099 Unavailable 46,309.52 7-1-16 6-30-17 Food Distribution Program (Non-Cash Assistance) 10.555 16161NJ304N1099 Unavailable 18,685.46 7-1-15 6-30-16 3,093.84 Food Distribution Program (Non-Cash Assistance) 10.555 171NJ304N1099 Unavailable 19,432.59 7-1-16 6-30-17
Total Child Nutrition Cluster (1,069.45) -
Total Enterprise Fund (1,069.45) -
Total Federal Financial Assistance (26,280.45)$ -
The accompanying Notes to Financial Statements and Notes to the Schedules of Expenditures of Federal Awards and State Financial Assistance are an integral part of this schedule.
These funds were not audited in accordance with the Uniform Guidance since the total of allgrant expenditures did not exceed $750,000.00.
TABERNACLE TOWNSHIP SCHOOL DISTRICT
Schedule of Expenditures of Federal Awards, Schedule AFor the Fiscal Year Ended June 30, 2017
142

Exhibit K-3
Total Passed Repayment ofCash Pass-through Direct Budgetary Through to Prior Years' Accounts Unearned Due to
Received Funds Funds Expenditures Subrecipents Adjustments Balances Receivable Revenue Grantor
17,815.00$ 51,839.00 63,539.95$ 63,539.95$ (11,779.00)$ 78.05$
69,654.00 63,539.95 - 63,539.95 - - - (11,779.00) 78.05 -
7,396.00 628.00 12,115.00 12,115.00 (11,487.00)
8,024.00 12,115.00 - 12,115.00 - - - (11,487.00) - -
- 1,935.00 - 1,935.00 - - - (1,935.00) - -
142,168.00 179,357.00 179,357.00 (37,289.00) 100.007,427.00 7,522.14 7,522.14 (638.00) 542.86
149,595.00 186,879.14 - 186,879.14 - - - (37,927.00) 642.86 -
227,273.00 264,469.09 - 264,469.09 - - - (63,128.00) 720.91 -
4,163.29 37,578.00 46,309.52 46,309.52 (8,731.52)
3,093.84 3,093.84 19,432.59 18,100.01 18,100.01 1,332.58
61,173.88 67,503.37 - 67,503.37 - - - (8,731.52) 1,332.58 -
61,173.88 67,503.37 - 67,503.37 - - - (8,731.52) 1,332.58 -
288,446.88$ 331,972.46$ - 331,972.46$ - - - (71,859.52)$ 2,053.49$ -
Balance June 30, 2017Budgetary Expenditures
143

24750
Unearned RevenueState Grantor/ State Project Award Required Grant Period / Accounts Due toProgram Title Number Amount Match From To Receivable Grantor
General Fund: New Jersey Department of Education: Current Expense: Sate Aid - Public Cluster: Equalization Aid 16-495-034-5120-078 3,405,745.00$ N/A 7-1-15 6-30-16 (337,515.67)$ Equalization Aid 17-495-034-5120-078 3,405,745.00 N/A 7-1-16 6-30-17 Categorical Special Education Aid 16-495-034-5120-089 465,120.00 N/A 7-1-15 6-30-16 (46,094.26) Categorical Special Education Aid 17-495-034-5120-089 465,120.00 N/A 7-1-16 6-30-17 Adjustment Aid 16-495-034-5120-085 1,177,271.00 N/A 7-1-15 6-30-16 (116,669.75) Adjustment Aid 17-495-034-5120-085 1,177,271.00 N/A 7-1-16 6-30-17 Categorical Security Aid 16-495-034-5120-084 66,283.00 N/A 7-1-15 6-30-16 (6,568.77) Categorical Security Aid 17-495-034-5120-084 66,283.00 N/A 7-1-16 6-30-17 PARCC Readiness Aid 16-495-034-5120-098 7,330.00 N/A 7-1-15 6-30-16 (726.42) PARCC Readiness Aid 17-495-034-5120-098 7,330.00 N/A 7-1-16 6-30-17 Per Pupil Growth Aid 16-495-034-5120-097 7,330.00 N/A 7-1-15 6-30-16 (726.41) Per Pupil Growth Aid 17-495-034-5120-097 7,330.00 N/A 7-1-16 6-30-17 Professional Learning Community Aid 17-495-034-5120-101 7,150.00 N/A 7-1-16 6-30-17
Total State Aid - Public Cluster (508,301.28) -
Transportation Aid: Categorical Transportation Aid 16-495-034-5120-014 337,115.00 N/A 7-1-15 6-30-16 (33,408.72) Categorical Transportation Aid 17-495-034-5120-014 337,115.00 N/A 7-1-16 6-30-17 Additional Nonpublic School Transportation Aid 16-495-034-5120-014 1,132.00 N/A 7-1-15 6-30-16 (1,132.00) Additional Nonpublic School Transportation Aid 17-495-034-5120-014 2,849.00 N/A 7-1-16 6-30-17
Total Transportation Aid (34,540.72) -
Extraordinary Aid 16-100-034-5120-044 86,949.00 N/A 7-1-15 6-30-16 (86,949.00) Extraordinary Aid 17-100-034-5120-044 183,597.00 N/A 7-1-16 6-30-17
Total Extraordinary Aid (86,949.00) -
Reimbursed TPAF Social Security Contributions 16-495-034-5094-003 382,213.10 N/A 7-1-15 6-30-16 (18,384.16) Reimbursed TPAF Social Security Contributions 17-495-034-5094-003 388,732.52 N/A 7-1-16 6-30-17
Total Reimbursed TPAF Social Security Contributions (18,384.16) -
Total General Fund (648,175.16) -
Capital Projects Fund: School Development Authority 5130-060-14-1003 134,502.00 201,753.00$ 179,815.50 -
Debt Service Fund: New Jersey Department of Education: School Construction Debt Service Aid 17-495-034-5120-075 92,721.00 N/A 7-1-16 6-30-17 - -
Enterprise Fund: New Jersey Department of Agriculture: State School Lunch Aid 16-100-010-3350-023 2,217.10 N/A 7-1-15 6-30-16 (191.29) State School Lunch Aid 17-100-010-3350-023 2,015.65 N/A 7-1-16 6-30-17
Total Enterprise Fund (191.29) -
Total State Financial Assistance subject to Major Program Determination for State Single Audit (468,550.95) -
State Financial Assistance not subject to Calculation for Major Program Determination for State Single Audit: General Fund (Non-Cash Assistance): New Jersey Department of the Treasury: TPAF Post Retirement Medical 17-495-034-5094-001 529,352.00 N/A 7-1-16 6-30-17 Teacher's Pension & Annuity Fund 17-495-034-5094-002 613,090.00 N/A 7-1-16 6-30-17 TPAF Non-Contributory Insurance 17-495-034-5094-004 22,214.00 N/A 7-1-16 6-30-17 TPAF Long-Term Disability Insurance 17-495-034-5094-004 1,574.00 N/A 7-1-16 6-30-17
Total General Fund (Non-Cash Assistance) - -
Total State Financial Assistance (468,550.95)$ -
The accompanying Notes to Financial Statements and Notes to the Schedules of Expenditures of Federal Awards and State Financial Assistance are an integral part of this schedule.
Until Completion
Balance June 30, 2016
TABERNACLE TOWNSHIP SCHOOL DISTRICTSchedule of Expenditures of State Financial Assistance, Schedule B
For the Fiscal Year Ended June 30, 2017
144

Exhibit K-4
Total Passed- Repayment of Unearned Revenue Budgetary CumulativeCash Budgetary Through to Prior Years' (Accounts / Interfund Due to Receivable Total
Received Expenditures Subrecipients Adjustments Balances Receivable) Payable Grantor June 30, 2017 Expenditures
337,515.67$ 3,074,608.92 3,405,745.00$ (331,136.08)$ (331,136.08)$ 3,405,745.00$
46,094.26419,897.00 465,120.00 (45,223.00) (45,223.00) 465,120.00 116,669.75
1,062,806.50 1,177,271.00 (114,464.50) (114,464.50) 1,177,271.00 6,568.77
59,838.39 66,283.00 (6,444.61) (6,444.61) 66,283.00 726.42
6,617.31 7,330.00 (712.69) (712.69) 7,330.00 726.41
6,617.32 7,330.00 (712.68) (712.68) 7,330.00 6,454.81 7,150.00 (695.19) (695.19) 7,150.00
5,145,141.53 5,136,229.00 - - - (499,388.75) - - (499,388.75) 5,136,229.00
33,408.72304,337.75 337,115.00 (32,777.25) (32,777.25) 337,115.00
1,132.002,849.00 (2,849.00) 2,849.00
338,878.47 339,964.00 - - - (35,626.25) - - (32,777.25) 339,964.00
86,949.00183,597.00 (183,597.00) 183,597.00
86,949.00 183,597.00 - - - (183,597.00) - - - 183,597.00
18,384.16 359,990.89 388,732.52 (28,741.63) 388,732.52
378,375.05 388,732.52 - - - (28,741.63) - - - 388,732.52
5,949,344.05 6,048,522.52 - - - (747,353.63) - - (532,166.00) 6,048,522.52
- - - (179,815.50)$ - - - - - 21,937.50
92,721.00 92,721.00 - - - - - - - 92,721.00
191.29 1,620.07 2,015.65 (395.58) 2,015.65
1,811.36 2,015.65 - - - (395.58) - - - 2,015.65
6,043,876.41 6,143,259.17 - (179,815.50) - (747,749.21) - - (532,166.00) 6,165,196.67
529,352.00 529,352.00 529,352.00 613,090.00 613,090.00 613,090.00
22,214.00 22,214.00 22,214.001,574.00 1,574.00 1,574.00
1,166,230.00 1,166,230.00 - - - - - - - 1,166,230.00
7,210,106.41$ 7,309,489.17$ - (179,815.50)$ - (747,749.21)$ - - (532,166.00)$ 7,331,426.67$
Memo OnlyBalance June 30, 2017
145
24750 Exhibit K-5
TOWNSHIP OF TABERNACLE SCHOOL DISTRICTNotes to Schedules of Expenditures of Federal Awards and State Financial Assistance
For the Fiscal Year Ended June 30, 2017
Note 1: BASIS OF PRESENTATION
The accompanying schedules of expenditures of federal awards and state financial assistance (“the schedules”) include federal and state award activity of the Township of Tabernacle School District(hereafter referred to as the “School District”). The School District is defined in note 1 to the School District's basic financial statements. The information in these schedules is presented in accordance with the requirements of Title 2 U.S. Code of Federal Regulations (CFR) Part 200, Uniform Administrative Requirements, Cost Principles, and Audit Requirements for Federal Awards (Uniform Guidance) and State of New Jersey Circular 15-08-OMB, Single Audit Policy for Recipients of Federal Grants, State Grants and State Aid. All federal and state awards received directly from federal and state agencies, as well as federal awards and state financial assistance passed through other government agencies, are included on the schedules. Because these schedules present only a selected portion of the operations of the School District, it is not intended to and does not present the financial position and changes in operations of the School District.
Note 2: SUMMARY OF SIGNIFICANT ACCOUNTING POLICIES
The accompanying schedules are presented using the budgetary basis of accounting, with the following exceptions: programs recorded in the capital projects fund are presented on the modified accrual basis of accounting and programs recorded in the enterprise fund are presented using the accrual basis of accounting. These bases of accounting are described in note 1 to the School District's basic financial statements. Such expenditures are recognized following the cost principles contained in Title 2 U.S. Code of Federal Regulations (CFR) Part 200, Uniform Administrative Requirements, Cost Principles, and Audit Requirements for Federal Awards, and State of New Jersey Circular 15-08-OMB, Single Audit Policy for Recipients of Federal Grants, State Grants and State Aid, wherein certain types of expenditures are not allowed or are limited as to reimbursement.
Note 3: RELATIONSHIP TO BASIC FINANCIAL STATEMENTS
The basic financial statements present the general fund and special revenue fund on a GAAP basis. Budgetary comparison statements or schedules (RSI) are presented for the general fund and special revenue fund to demonstrate finance-related legal compliance in which certain revenue is permitted by law or grant agreement to be recognized in the audit year, whereas for GAAP reporting, revenue is not recognized until the subsequent year or when expenditures have been made.
The general fund is presented in the accompanying schedules on the modified accrual basis with the exception of the revenue recognition of the one or more deferred June state aid payments in the current budget year, which is mandated pursuant to N.J.S.A. 18A:22-44.2. For GAAP purposes, payments arenot recognized until the subsequent budget year due to the State deferral and recording of the one or more June state aid payments in the subsequent year. The special revenue fund is presented in the accompanying schedules on the budgetary basis which recognizes encumbrances as expenditures and also recognizes the related revenues, whereas the GAAP basis does not. The special revenue fund also recognizes the one or more June state aid payments in the current budget year, consistent with N.J.S.A. 18A:22-44.2.
146
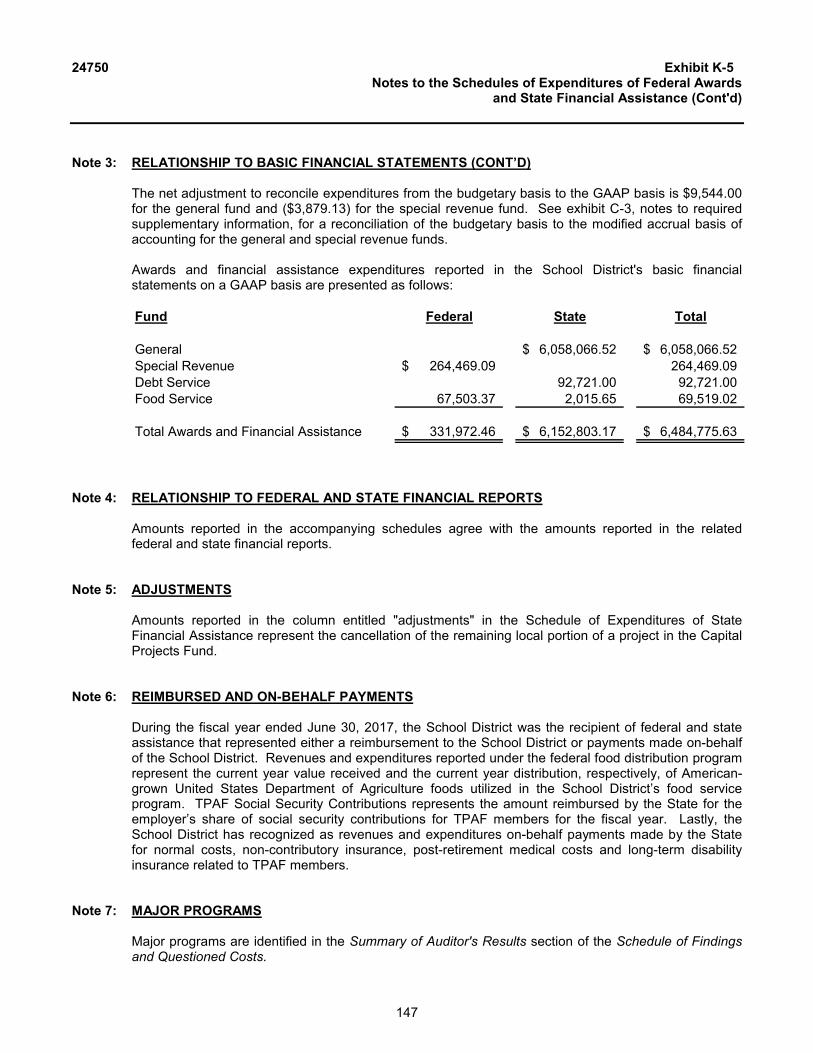
24750 Exhibit K-5Notes to the Schedules of Expenditures of Federal Awards
and State Financial Assistance (Cont'd)
Note 3: RELATIONSHIP TO BASIC FINANCIAL STATEMENTS (CONT’D)
The net adjustment to reconcile expenditures from the budgetary basis to the GAAP basis is $9,544.00for the general fund and ($3,879.13) for the special revenue fund. See exhibit C-3, notes to required supplementary information, for a reconciliation of the budgetary basis to the modified accrual basis of accounting for the general and special revenue funds.
Awards and financial assistance expenditures reported in the School District's basic financial statements on a GAAP basis are presented as follows:
Fund Federal State Total
General 6,058,066.52$ 6,058,066.52$ Special Revenue 264,469.09$ 264,469.09 Debt Service 92,721.00 92,721.00 Food Service 67,503.37 2,015.65 69,519.02
Total Awards and Financial Assistance 331,972.46$ 6,152,803.17$ 6,484,775.63$
Note 4: RELATIONSHIP TO FEDERAL AND STATE FINANCIAL REPORTS
Amounts reported in the accompanying schedules agree with the amounts reported in the related federal and state financial reports.
Note 5: ADJUSTMENTS
Amounts reported in the column entitled "adjustments" in the Schedule of Expenditures of State Financial Assistance represent the cancellation of the remaining local portion of a project in the Capital Projects Fund.
Note 6: REIMBURSED AND ON-BEHALF PAYMENTS
During the fiscal year ended June 30, 2017, the School District was the recipient of federal and state assistance that represented either a reimbursement to the School District or payments made on-behalf of the School District. Revenues and expenditures reported under the federal food distribution program represent the current year value received and the current year distribution, respectively, of American-grown United States Department of Agriculture foods utilized in the School District’s food service program. TPAF Social Security Contributions represents the amount reimbursed by the State for the employer’s share of social security contributions for TPAF members for the fiscal year. Lastly, the School District has recognized as revenues and expenditures on-behalf payments made by the State for normal costs, non-contributory insurance, post-retirement medical costs and long-term disability insurance related to TPAF members.
Note 7: MAJOR PROGRAMS
Major programs are identified in the Summary of Auditor's Results section of the Schedule of Findings and Questioned Costs.
147

148

149

24750 Exhibit K-7
TABERNACLE TOWNSHIP SCHOOL DISTRICTSchedule of Findings and Questioned Costs
For the Fiscal Year Ended June 30, 2017
Section 2- Schedule of Financial Statement Findings
This section identifies the significant deficiencies, material weaknesses, and instances of noncompliance related to the financial statements that are required to be reported in accordance with Government Auditing Standardsand with audit requirements as prescribed by the Division of Administration and Finance, Department of Education, State of New Jersey.
None.
150

24750 Exhibit K-7
TABERNACLE TOWNSHIP SCHOOL DISTRICTSchedule of Findings and Questioned Costs
For the Fiscal Year Ended June 30, 2017
Section 3- Schedule of Federal Award Findings and Questioned Costs
This section identifies the significant deficiencies, material weaknesses, and instances of noncompliance, including questioned costs, related to the audit of major Federal programs, as required by Title 2 U.S. Code of Federal Regulations Part 200, Uniform Administrative Requirements, Cost Principles, and Audit Requirements for Federal Awards (Uniform Guidance).
A Federal Single Audit was not required.
151

24750 Exhibit K-7
TABERNACLE TOWNSHIP SCHOOL DISTRICTSchedule of Findings and Questioned Costs
For the Fiscal Year Ended June 30, 2017
Section 4- Schedule of State Financial Assistance Findings and Questioned Costs
This section identifies the significant deficiencies, material weaknesses, and instances of noncompliance, including questioned costs, related to the audit of major State programs, as required by State of New Jersey Circular 15-08-OMB.
None.
152

24750 Exhibit K-8
TABERNACLE TOWNSHIP SCHOOL DISTRICTSummary Schedule of Prior Year Audit Findings
and Questioned Costs as Prepared by Management
This section identifies the status of prior year findings related to the financial statements and Federal Awards and State Financial Assistance that are required to be reported in accordance with Government Auditing Standards, Title 2 U.S. Code of Federal Regulations Part 200, Uniform Administrative Requirements, Cost Principles, and Audit Requirements for Federal Awards (Uniform Guidance), and State of New Jersey Circular 15-08-OMB.
FINANCIAL STATEMENT FINDINGS
None.
FEDERAL AWARDS
None.
STATE FINANCIAL ASSISTANCE PROGRAMS
None.
153