
Board of Directors Report Key Indicators of MWRA … of Directors Report on Key Indicators of MWRA...
57
MASSACHUSETTS WATER RESOURCES AUTHORITY Board of Directors Report on Key Indicators of MWRA Performance For Third Quarter FY2008 Frederick A. Laskey, Executive Director Michael J. Hornbrook, Chief Operating Officer June 25, 2008 Q1 Q2 Q3 Q4
Transcript of Board of Directors Report Key Indicators of MWRA … of Directors Report on Key Indicators of MWRA...

MASSACHUSETTS WATER RESOURCES AUTHORITY
Board of Directors Report
on
Key Indicators of MWRA Performance
For
Third Quarter FY2008
Frederick A. Laskey, Executive DirectorMichael J. Hornbrook, Chief Operating Officer
June 25, 2008
Q1 Q2 Q3 Q4

Board of Directors Report on Key Indicators of MWRA Performance
for Third Quarter FY2008
Table of Contents
Operations and Maintenance DITP Operations-Energy 1 DITP Operations 2 Residuals Processing 4 DITP Maintenance 5 Operations Division–Metering & Leak Detection 6 Water Distribution System–Valves 7 Wastewater Pipeline/Structures 8 Field Operations Energy Program 9 Toxic Reduction and Control 10 Field Operations – Narrative Topics 11 Laboratory Services 16 CSO Update 17
Construction Programs Projects in Construction 19 CIP Expenditures 21 Drinking Water Quality and Supply Source Water – Microbial Results 22 Source Water – Turbidity and Algae 23 Treated Water – Disinfection Effectiveness 24 Treated Water – pH and Alkalinity, Complaints 25 Bacteria and Chlorine Residual Results 26 Disinfection By-Products, UV 254 27 Water Supply/Source Water Management 28
Wastewater Quality NPDES Permit Compliance – Deer Island 29 NPDES Permit Compliance – Clinton 30 Community Flows Total Water Use – 31 Core Communities Community Wastewater Flows 32 Business Services Procurement 33 Materials Management 34 MIS Program 35 Law Dept.-Activities 36 Internal and Contract Audits 41 Other Management Workforce Management 42 MWRA Workplace Safety Program 43 Job Group Representation 44 MBE/WBE Expenditures 45 CEB Expenses 46 Cost of Debt 47 Investment Income 48
This quarterly report is prepared by MWRA staff to track a variety of MWRA performance measures for routine review by MWRA’s board of directors. The content and format of this report is expected to develop as time passes. Information is reported on a preliminary basis as appropriate and available for internal management use and is subject to correction and clarification.
Frederick A. Laskey, Executive Director Michael J. Hornbrook, Chief Operating Officer
June 25, 2008
OPERATIONS AND MAINTENANCE
3rd Quarter - FY08Deer Island Operations - Energy
Total Power Demand
02468
1012141618202224
J A S O N D J F M A M J
Pow
er D
eman
d, M
W
Actual FY08 Target FY07 Actual
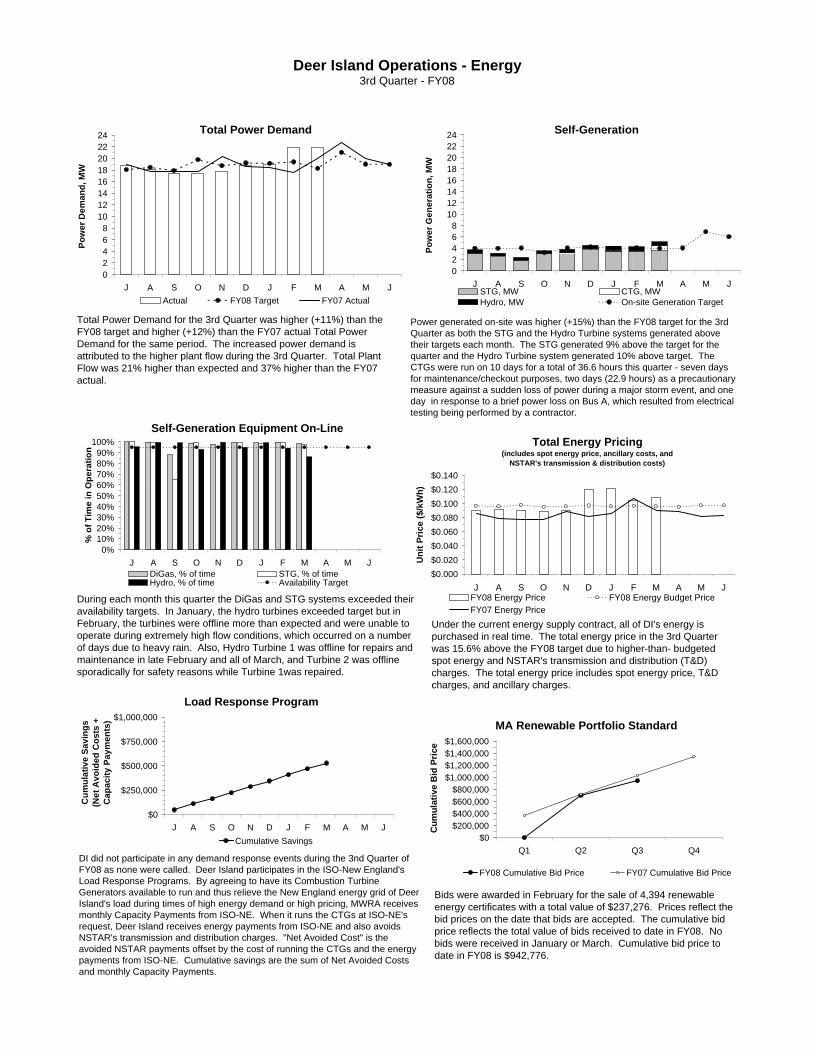
Total Power Demand for the 3rd Quarter was higher (+11%) than the FY08 target and higher (+12%) than the FY07 actual Total Power Demand for the same period. The increased power demand is attributed to the higher plant flow during the 3rd Quarter. Total Plant Flow was 21% higher than expected and 37% higher than the FY07 actual.
Self-Generation
02468
1012141618202224
J A S O N D J F M A M J
Pow
er G
ener
atio
n, M
W
STG, MW CTG, MWHydro, MW On-site Generation Target
Power generated on-site was higher (+15%) than the FY08 target for the 3rd Quarter as both the STG and the Hydro Turbine systems generated above their targets each month. The STG generated 9% above the target for the quarter and the Hydro Turbine system generated 10% above target. The CTGs were run on 10 days for a total of 36.6 hours this quarter - seven days for maintenance/checkout purposes, two days (22.9 hours) as a precautionary measure against a sudden loss of power during a major storm event, and one day in response to a brief power loss on Bus A, which resulted from electrical testing being performed by a contractor.
Self-Generation Equipment On-Line
0%10%20%30%40%50%60%70%80%90%
100%
J A S O N D J F M A M J
% o
f Tim
e in
Ope
ratio
n
DiGas, % of time STG, % of timeHydro, % of time Availability Target
During each month this quarter the DiGas and STG systems exceeded their availability targets. In January, the hydro turbines exceeded target but in February, the turbines were offline more than expected and were unable to operate during extremely high flow conditions, which occurred on a number of days due to heavy rain. Also, Hydro Turbine 1 was offline for repairs and maintenance in late February and all of March, and Turbine 2 was offline sporadically for safety reasons while Turbine 1was repaired.
MA Renewable Portfolio Standard
$0$200,000$400,000$600,000$800,000
$1,000,000$1,200,000$1,400,000$1,600,000
Q1 Q2 Q3 Q4
Cum
ulat
ive
Bid
Pric
e
FY08 Cumulative Bid Price FY07 Cumulative Bid Price
Load Response Program
$0
$250,000
$500,000
$750,000
$1,000,000
J A S O N D J F M A M J
Cum
ulat
ive
Savi
ngs
(Net
Avo
ided
Cos
ts +
Cap
acity
Pay
men
ts)
Cumulative Savings
Total Energy Pricing(includes spot energy price, ancillary costs, and
NSTAR's transmission & distribution costs)
$0.000$0.020$0.040$0.060$0.080$0.100$0.120$0.140
J A S O N D J F M A M J
Uni
t Pric
e ($
/kW
h)
FY08 Energy Price FY08 Energy Budget PriceFY07 Energy Price
Bids were awarded in February for the sale of 4,394 renewable energy certificates with a total value of $237,276. Prices reflect the bid prices on the date that bids are accepted. The cumulative bid price reflects the total value of bids received to date in FY08. No bids were received in January or March. Cumulative bid price to date in FY08 is $942,776.
DI did not participate in any demand response events during the 3nd Quarter of FY08 as none were called. Deer Island participates in the ISO-New England's Load Response Programs. By agreeing to have its Combustion Turbine Generators available to run and thus relieve the New England energy grid of Deer Island's load during times of high energy demand or high pricing, MWRA receives monthly Capacity Payments from ISO-NE. When it runs the CTGs at ISO-NE's request, Deer Island receives energy payments from ISO-NE and also avoids NSTAR's transmission and distribution charges. "Net Avoided Cost" is the avoided NSTAR payments offset by the cost of running the CTGs and the energy payments from ISO-NE. Cumulative savings are the sum of Net Avoided Costs and monthly Capacity Payments.
Under the current energy supply contract, all of DI's energy is purchased in real time. The total energy price in the 3rd Quarter was 15.6% above the FY08 target due to higher-than- budgeted spot energy and NSTAR's transmission and distribution (T&D) charges. The total energy price includes spot energy price, T&D charges, and ancillary charges.

Month
JASONDJFMAMJ
Total
Deer Island Operations & Maintenance Report
22 21 1 99.1% 176.4
97.2%
99.6%
64.415 5 0
100.0%
6.3010 10 0 96.2% 89.661 1 0
99.6%
2.173 2 1 99.6% 5.731 1 0
99.7%
4.910 0 0 100.0% 0.01 1 0
Total Hours Blended During
Month
3.200 0 0 100.0% 0.001 1 0
Count of Blending Events
Count of Blending Events Due to
Rain
Count of Blending Events Due to
Non-Rain-Related Events
Secondary, as a Percent of Total
Plant Flow
3rd Quarter - FY08Deer Island Operations
Secondary Blending Events
Deer Island Sodium Hypochlorite UseDisinfection Dosage
0.0
0.5
1.0
1.5
2.0
2.5
J A S O N D J F M A M J
mg/
L
Average Dosage, mg/L FY08 Target FY07 Actual Dosage
The disinfection dosing rate was 5% lower than the FY08 target for the 3rd Quarter. The lower dosing rate was likely due to increased plant flows resulting in a more dilute wastewater.
The overall disinfection dosing rate (target and actual) is dependent on plant flow, target effluent total chlorine residual levels, effluent quality and NPDES permit levels for fecal coliform.
Plant Flow & Rainfall
0
100
200
300
400
500
600
J A S O N D J F M A M J
MG
D
012345678910
Inches (Water E
quivalent)
Total Precipitation, inches rain Total Plant Flow, MGD8 Yr Avg Flow, MGD
Total Plant Flow for the 3rd Quarter was 21% higher than the 8-year average flow (479.2 mgd actual compared to 397.6 mgd expected). Precipitation was 64% greater than the 8-yr average for the quarter (15.3 inches actual vs. 9.35 inches expected).
Environmental/Pumping:Precipitation for the 3rd Quarter was much higher than the 8-year historical average for the quarter with a total of 15.30 inches of precipitation falling on 33 days. Precipitation for the month of February was much higher than the historical average for the month (+215%), with a record setting total of 7.94 water equivalent inches, and resulted in plant flow being 42% higher than the historical benchmark flow. Precipitation in March was also 26% higher than expected and caused plant flow for the month to be 20% higher than the benchmark.
The plant achieved a maximum average hourly flow rate of 1,306 mgd on February 13 as a result of a rain and snow event that produced 2.66 inches of precipitation. The last time the plant achieved a maximum average hourly flow rate in excess of 1,300 mgd was on June 7, 2006 during a Nor'easter storm event that produced 2.89 inches of rain and resulted in a maximum average hourly flow rate of 1,333 mgd. Pumping and treatment operations continued without incident through all storm events in February and throughout the entire quarter.
Deer Island Secondary Treatment as a Percent of Total Plant Flow
80%
82%
84%
86%
88%
90%
92%
94%
96%
98%
100%
J A S O N D J F M A M J
% S
econ
dary
Secondary, as a Percent of Total Plant FlowThere were a total of 16 separate blending events on 16 days for a total of 160.4 hours of blending during the 3rd Quarter; all were due to heavy rain, sometimes coupled with snowmelt. The 2.81 inches of precipitation (rain, snow, and ice) that fell on February 12-13 resulted in two separate blending events that spanned from February 13 through part of February 15, for a total of 41.0 hours. The 2.05 inches of rain that fell on March 7-8 resulted in a single blending event that began on March 8 and continued for more than 40.1 hours before ending on March 10.
Overall, 97.7% of the total plant flow to DITP was treated through secondary treatment during the 3rd Quarter. The Maximum Secondary Capacity for the entire quarter was 700 mgd (set on April 4, 2007).

Deer Island Operations & Maintenance Report (continued)
3rd Quarter - FY08Deer Island Operations
Residuals:The transfer of sludge to the Pelletizing Plant at the Fore River Staging Area (FRSA) via Digested Sludge Pipeline 1 was switched over to Pipeline 2 early in January for preventive maintenance purposes. Process water was then pumped into Pipeline 1 and the pipeline was flushed and then filled with water. This water will remain in the pipeline while it is offline. Additionally, the now activated Pipeline 2 will be flushed multiple times and then filled with process water on weekends and other times when sludge is not being transferred to the FRSA as a preventivemaintenance measure to minimize solids deposition.
Energy: Deer Island is nearing the final stages of completion of the solar panel project, which consists of a 100-kW, roof-mounted system on the Residual/Odor Control Building. This site was selected because it has large unobstructed roof sections that would easily accommodate photovoltaic arrays. The design/build contract was awarded in September 2007 and is currently scheduled to be completed in April.
Clinton Wastewater Treatment Plant
Soda Ash System Replacement Project: Construction is expected to be completed by the end of June.
Landfill Closure Study: The study, performed by FS&T, is complete and indicated that another three to five yearsof usage is still available in Cell 1. The study also indicated how to proceed with filling the landfill cell in order to optimize its use.
Primary Clarifiers: Staff de-iced the chain drive on Primary Collector 3. Icing caused the collector torque overload switch to trip.
Dewatering Building: Staff performed the following maintenance tasks in the Dewatering Building: flushed a suction line to Thickened Sludge P 3 to remove a grease buildup; cleared a blockage from Progressive Cavity Pump 3, which feeds digested solids to the belt press; installed a new waste grinder, flushed a suction line, and drained water from the drive gear oil reservoir on Gravity Thickener 1; cleared a blockage in the floor drains in sludge garage; replaced broken shear pins on Sludge Piston Pump 2 and Plunger Pump 2; replaced seals on the sprayer box for the belt filter press; repaired the hydraulic drive on Progressive Cavity Pump 2; adjusted the packing on Piston Pump 2; and steamed-cleaned the belt press.
Chemical Building: Staff cleaned debris from and greased the soda ash slurry pump. Staff also inspected, cleaned and tested the alum feed pumps in preparation for spring start-up for phosphorus removal; cleared blockages in both waste-activated sludge discharge lines and reassembled the piping; removed a rotary airlock on the soda ash feed system to clean out a buildup of hardened soda ash from the vibratory feeder; and installed a new motor on the sodium hypochlorite sump pump.
Digester Building: Staff unclogged Sludge Transfer Pump 1; adjusted the packing on Piston Pump 2; and cleared a blockage in the floor drain near the gas compressor.

Deer Island Residuals1st Quarter - CY08
Sludge Pumped From Deer Island
0
25
50
75
100
125
J F M A M J J A S O N D
Avg
DTP
D/T
SS
Actual Tons Pumped Contract Base Quantity (90)
Budgeted Quantity 08 Actual Average CYTD
Monthly Average % Capture of Processed Sludge
0.0%
25.0%
50.0%
75.0%
100.0%
J F M A M J J A S O N D
TSS
Monthly Avg % Capture Contract Minimum Capture CY08 YTD Avg % Capture
MWRA pays a fixed monthly amount for the calendar year to process up to 90 DTPD/TSS as an annual average. The monthly invoice is based on 90 DTPD/TSS (Dry Tons Per Day/Total Suspended Solids) times 365 days divided by 12 months. At the end of the year, the actual totals are calculated and additional payments are made on any quantity above the base amount. The base quantity of 90 DTPD/TSS was set for the 15-year term of the contract, even though, on average, MWRA processes more than 90 DTPD/TSS each year (FY08's budget was 108 DTPD/TSS).
The average total quantity of pumped sludge for the 3rd Quarter was 101 DTPD, which was lower than the FY08 budget target of 108 DTPD. The lower quantities this time of year are generally attributable to cold weather. Sludge quantities can vary based on a number of factors including cold weather, flow, changes in sludge inventory, and the performance of primary and secondary treatment. Digester upset conditions can also affect sludge quantities.
The contract requires NEFCo to capture at least 90% of the solids delivered to the facility. Although the daily average percentage capture rate of solids continued to be steady, NEFCo did fall just below the minimum requirement in March (89.01%). Staff brought this to NEFCo's attention and expect the capture rate to meet the minimum contract requirement going forward.

Deer Island Maintenance3rd Quarter - FY08
Productivity initiatives include increasing predictive Proactive initiatives include completing 100% of all preventivemaintenance tasks. Accomplishing this initiative should maintenance tasks and increasing preventive maintenance result in a decrease in the overall maintenance backlog. kitting. These tasks should result in lower maintenance costs
for maintenance.
Deer Island's FY08 predictive maintenance (PdM) goal is completion of 90% of all PdM work orders. Deer Island is moving forward Deer Island's FY08 preventive maintenance goal is completion of with an aggressive predictive maintenance program and again 100% of all PM work orders from Operations and Maintenance. met the goal in the 3rd quarter. The goal was met again in the 3rd quarter.
Deer Island's FY08 goal is to increase PdM work orders Deer Island's FY08 preventive maintenance kitting goal is 100% of all PM to 12% of total work orders. The industry is moving toward work orders. Steady progress has been made and staff are identifyingincreasing predictive maintenance work to reduce down time and all PM schedules that do not include materials and will not require kitting. better predict when repairs are needed. The goal was reachedagain in the 3rd quarter.
The industry average for maintenance backlog is 3-6 weeks. Overtime was $35K over budget for the third quarter and is now Deer Islands FY08 goal is to stay within industry average. $47K over for the year. This quarter's overtime was spent on The backlog has risen this quarter as a result of "spring cleaning" preparing the Residuals systems for cleaning; gathering information work orders. There is currently one medium-voltage electrician for the motor control center electrical survey; Liquid Train tank work; and one M&O specialist vacancy. These vacancies are and controlling backlog. contributing to the higher backlog.
Predictive Maintenance
-5%
0%
5%
10%
15%
20%
Q1 Q2 Q3 Q4
% o
f tot
al W
ork
Ord
ers
Preventive Maintenance Compliance
70%
75%
80%
85%
90%
95%
100%
Q1 Q2 Q3 Q4
% o
f WO
s C
ompl
eted
Best in Class Target
Industry Benchmark
Predictive Maintenance Compliance
10%20%30%40%50%60%70%80%90%
100%
Q1 Q2 Q3 Q4
% o
f WO
's C
ompl
eted
Overtime Spending
$0
$100
$200
$300
$400
$500
$600
$700
Q1 Q2 Q3 Q4
Ove
rtim
e ($
1,00
0) OT Goal
Proactive InitiativesProductivity Initiatives
FY08 Goal
FY08 Goal
Maintenance Project Backlog in Crew Weeks
0
2
4
6
8
10
12
Q1 Q2 Q3 Q4
Cre
w W
eeks
Industry average 3-6 weeks
Preventive Maintenance Kitting
0%
20%
40%
60%
80%
100%
Q1 Q2 Q3 Q4
% o
f PM
wor
k or
ders
FY08 Goal

Month J A S O N D J F M A M JLeaks Detecte 0 1 0 0 1 0 0 0 0Leaks Repaire 0 0 1 0 0 1 0 0 0Backlog 0 1 0 0 1 0 0 0 0
Avg. Lag 0.0 8.0 34.0 34.0 29.0 30.5 30.5 30.5 30.5Time
Of the 183 revenue meters installed, seven experienced down time greater than the 5% target. For the 3rd Quarter, down time is defined by any individual meter having less than 2,766 data points.
Operations Division Metering3rd Quarter - FY08
MWRA's leak backlog for FY08 remains at zero and was so for the entire quarter; no leaks were detected in the 3rd Quarter. The Pipeline Program's goal is to repair all leaks found during the fiscal year.
WATER METERS
The target for revenue water deliveries calculated using meters is 100%. During the 3rd Quarter, meter actuals accounted for 99.5% of flow; only 0.5% of total revenue water deliveries were estimated. Estimates are generated for meters that are out of service due to instrumentation problems or in-house and/or capital construction projects. The following is the breakdown of estimations:In-house/Capital Construction Projects - 0.0%Instrumentation Failure - 0.5%
During the third quarter, out of a possible 1,598,688 data points, only 12,068 points were missed resulting in a system-wide up time of 99.25%. Staff continue to work with the contractor and meter system vendors to improve performance, resolve velocity issues and reduce estimates.
Water Distribution System
WASTEWATER METERS
Percent of Total Revenue Water Deliveries Calculated Using Meters
0%
20%
40%
60%
80%
100%
J A S O N D J F M A M J% of Flow Metered
System Uptime
0%
25%
50%
75%
100%
J A S O N D J F M A M JTarget % In-Service
Individual Meter Uptime
0
50
100
150
200
J A S O N D J F M A M JTarget Meters with > 95% Uptime
During the third quarter, 40.18 miles of water mains were inspected; this brings the total for the fiscal year to 186.78 miles.
Miles Surveyed for Leaks
0
50
100
150
200
250
300
350
J A S O N D J F M A M J
Monthly Cumulative Annual Target

FY08 to Date FY08 TargetsMain Line Valves 1,265 86.8% 84%Blow-Off Valves 1,132 91.2% 94%Air Release Valves 1,324 91.5% 86%Control Valves 51 94.0% 92%
Water Distribution System Valves3rd Quarter - FY08
BackgroundValves are exercised, rehabilitated, or replaced in order to improve their operating condition. This work occurs year round. Valve replacements occur in roadway locations during the normal construction season, and in off-road locations during the winter season. Valve exercising can occur year round but is often displaced during the construction season. This is due to the fact that a large number of construction contracts involving rehabilitation, replacement, or new installation of water lines requires valve staff to operatevalves and assist with disinfection, dechlorination, pressure-testing, and final acceptance. Valve exercising can also be impacted due to limited redundancy in the water system; valve exercising cannot be performed in areas where there is only one source of water to the community meters or flow disruptions will occur.
Operable PercentageType of Valve Inventory #
Main line valve exercising has been down somewhat this fiscal year because of the need to assign valve staff to other higher-priority projects. Valve staff have spent time rebuilding two control valves (Oak Hill Control Valve and Shaft 9 PRV ); working on major flushing projects to re-activate long-isolated segments of the Spot Pond East and West Supply Mains on Beacon St. in Brookline to the Shaft 7B PRV Vault at Chestnut Hill; and flushing Sections 4, 5, 6, 11 and 12 NLS Mains in Somerville and Medford to switch supply to Somerville Meters 33 and 91 from the Shaft 8 NLS PRV supply source to the Shaft 9A NLS PRV supply source. Staff also have been required to provide extensive support on other major valve replacement projects on NHS Sections 13, 48 and 70, as well as other CIP projects.
Main Line Valves Replaced
0
5
10
15
20
25
30
J A S O N D J F M A M J
# of
Val
ves
Blow-Off Valves Replaced
0
5
10
15
20
J A S O N D J F M A M J
# of
Val
ves
Key to Symbols:FY2008 Monthly TotalFY2008 Cumulative Total
During the 3rd Quarter, staff exercised 467 main line valves bringing the total for the fiscal year to 748; the goal for the fiscal year is 1,100.
Staff exercised three main line valves this quarter, bringing the total for the fiscal year to 12; the FY08 goal is 20.
During the 3rd Quarter, staff exercised 231 blow-off valves, which brings the total for the fiscal year to 416, exceeding the FY08 goal of 375.
Staff replaced four blow-off valves during the 3rd Quarter. This brings the total for the fiscal year to seven. The FY08 goal is 12.
Blow-Off Valves Exercised
0
100
200
300
400
500
J A S O N D J F M A M J
# of
Val
ves
Main Line Valves Exercised
0
250
500
750
1000
1250
1500
J A S O N D J F M A M J
# of
val
ves

Inspections Maintenance
Wastewater Pipeline and Structure Inspections and Maintenance3rd Quarter - FY08
Pipeline Inspections
0
5
10
15
20
25
30
35
40
J A S O N D J F M A M J
Mile
s
Monthly Inspections
Pipeline Cleaning
0
5
10
15
20
25
30
35
40
J A S O N D J F M A M J
Mile
s
Hydraulic Cleaning Mechanical Cleaning
Target = 3 miles monthly or 36 miles / 15% of the system annually.
Structure Inspections
0
100
200
300
400
500
600
700
J A S O N D J F M A M J
# of
Str
uctu
res
Monthly Inspections
Target = 54 monthly or 650 / 15% of the system annually.
Manhole Rehabilitation
0
20
40
60
80
100
120
J A S O N D J F M A M J
# of
Man
hole
s
Monthly Inspections
F&C Target = 9 monthly or 108 / 10% of the system annually.
Inverted Siphon Inspections
0
10
20
30
40
50
60
J A S O N D J F M A M J
# of
Sip
hon
Bar
rels
Monthly Inspections
Target = 4 monthly or 48 / 38% of the system annually.
Inverted Siphon Cleaning
0
10
20
30
40
50
60
70
J A S O N D J F M A M J
# of
Sip
hon
Bar
rels
Monthly Cleaning
Target = 3 monthly or 36 / 33% of the system annually.
Target = 2.67 miles monthly or 32 miles / 13% of the system annually.
Staff inspected one siphon barrel this quarter, which brings the total for the fiscal year to 34.
Staff internally inspected 5.78 miles of MWRA sewer pipeline in this quarter, bringing the total for FY08 to 26.45 miles. Staff also inspected .22 miles of pipeline in Everett and Chelsea as part of the Community Assistance Program.
Staff inspected 44 structures in the 3rd Quarter, including the 12 CSO structures.
Staff cleaned 2.91 miles of MWRA sewer pipeline and removed 30.5 cubic yards of grit and debris in the 3rd Quarter. Staff also cleaned a total of .55 miles of sewer pipeline in Everett, Medford, and Chelsea part of the Community Assistance Program.
As part of the Manhole Rehabilitation Program, staff replaced one manhole frame and cover.
Staff cleaned 28 siphon barrels during the 3rd quarter, which brings the total for the fiscal year to 65, well above the FY08 goal of 36.
YTD Actual Target

Field Operations Energy Program3rd Quarter - FY08
Quarterly Totals for Hydro Production at Cosgrove Hydroelectric Generation Facility
0
500
1000
1500
2000
2500
Q1 Q2 Q3 Q4
Quarter
mW
h
FY08 Quarters FY08 YTD Cumulative Total
In the 3rd Quarter, the Cosgrove Hydroelectric Station generated a net of 749 mWh; the resulting revenue produced was $51,870. Generation is up from the same quarter last year. In the past, Cosgrove was shut down during half-plant operations (mid-November through mid-February), but this year plant staff kept some flow going through Cosgrove. Therefore, hydroelectric power generation this year has been higher during both the 2nd and 3rd quarters than in previous years. Total power generated to date in FY08 is 2,113.4 mWh; total revenue to date in FY08 is $127,748.
In the 3rd Quarter, Oakdale Station's hydroelectric plant generated 939 mWh; the resulting revenue produced was $69,541. Generation in the 3rd Quarter was 26% higher than during the same period in FY07 because summer and fall 2007 were drier than the previous year and more water was transferred transferred from the Quabbin Reservoir to the Wachusett Reservoir. (Oakdale's operating protocol dictates that power is generated when water is transferred from Quabbin to Wachusett unless conditions result in flows that are in excess of generating capability.) Total power generated to date in FY08 is 11,240 mWh; total revenue to date in FY08 is $823,716.
Quarterly Hydro Production at the Oakdale Hydroelectric Generation Facility
0.00
2000.00
4000.00
6000.00
8000.00
10000.00
12000.00
Q1 Q2 Q3 Q4
Quarters
mW
h
FY08 Quarters FY08 YTD Cumulative Total
Energy Program Highlights
MWRA Wind Power Consultant: Last year, Black & Veatch began work on the wind power consulting services contract.The scope of services required short-listing of four MWRA facilities with the highest potential for wind power generation and toperform an in-depth wind power site assessment at each of those locations. Thus far, the Nut Island Headworks, the BraintreeWeymouth Intermediate Pump Station (IPS), the Carroll Water Treatment Plant, and the Southborough Facility are the mostviable facilities for wind power. MWRA received a design and construction grant totaling $500,000 from the MassachusettsTechnology Council (MTC) for a turbine at Nut Island. A public meeting was held at Nut Island in December to present theconcept to the surrounding community. A number of issues were raised and are being considered. Black & Veatch iscontinuing to work on the next phase of the Nut Island turbine, such as interconnection issues, permitting, etc. John J. Carroll Water Treatment Plant (CWTP) Photovoltaic Feasibility Study: A feasibility study was completed for aproject to install photovoltaic (solar) panels at the CWTP to generate electricity. Staff submitted a grant application to MTC toobtain $250,000 for construction. Although MWRA did not receive a grant, MTC did suggest that there are other grantsavailable, specifically for solar installation. Staff are pursuing a grant through the Commonwealth Solar Program.
Loring Road Hydroelectric Generation Feasibility Study: MTC awarded a $50,000 grant to MWRA to conduct a feasibilitystudy for installing a hydroelectric turbine in the Loring Road facility to harness the energy generated when the hydraulic gradeline drops approximately 80 feet between Norumbega and Loring Road. The feasibility study was completed during the 3rdQuarter and MWRA applied for and was awarded an MTC design and construction grant.
CWTP Energy and Lighting Audits: National Grid (NGRID) is continuing an energy audit of the CWTP that began in the 2ndQuarter. NGRID is funding 50% of the audit cost. In the preliminary phase, NGRID’s contractor visited the plant, investigatedenergy usage, and made preliminary recommendations for 10 energy conservation measures. These recommendations werereviewed by Operations staff and the contractor. The contractor is performing a more detailed technical and economicanalysis of each measure. MWRA will be under no obligation to accept any of the recommendations but any equipmentrecommended, if installed, will automatically qualify for the utility rebate program. In addition, staff are moving to implementrecommendations resulting from a lighting audit that was conducted during the 1st Quarter.
Chelsea Facility Energy Audit: NSTAR, the facility's energy provider, is conducting the audit. A preliminary walk-throughwas conducted in January 2008. NSTAR will provide energy benchmarking training to MWRA staff in May 2008. Soon afterthe training, NSTAR will begin work on final audit recommendations and will provide automatic rebates for up to 50% of anymeasures implemented as a result of the audit.

EPA Required SIU Monitoring Eventsfor FY08: 190YTD : 175
Required Non-SIU Monitoring Eventsfor FY08: 63YTD : 29
SIU Connections to be SampledFor FY08: 368YTD: 438
EPA Required SIU Inspectionsfor FY08: 217YTD: 194
SIU Permits due to ExpireIn FY08: 84YTD: 61
Non-SIU Permits due to Expirefor FY08: 253YTD: 206
SIU Non-SIU SIU Non-SIU SIU Non-SIU SIU Non-SIUJul 0 6 0 1 0 2 0 9Aug 3 8 * 1 2 0 1 4 11Sep 6 9 0 2 0 1 6 12Oct 8 20 2 4 0 1 10 25Nov 5 20 1 2 6 4 12 26Dec 6 33 1 0 0 0 7 33Jan 12 53 2 4 1 4 15 61Feb 4 17 0 1 0 1 4 19Mar 2 11 1 1 0 1 3 13Apr 0 0May 0 0Jun 0 0
% YTD 75% 85% 13% 8% 11% 7% 61 209
46 177 8 17 7 15 61 209
Toxic Reduction and Control3rd Quarter - FY08
Number of Days to Issue a Permit0 to 120 121 to 180 181 or more Total Permits Issued
Significant Industrial Users (SIUs) are MWRA's highest priority industries due to their flow, type of industry, and/or their potential to violate limits. SIUs are defined by EPA and require a greater amount of oversight. EPA requires that all SIUs with flow be monitored at least once during the fiscal year. The “SIU Monitored” data above reflects the number of industries monitored. However, many of these industries have more than one sampling point and the “SIU Connections Sampled” data reflect samples taken from multiple sampling locations at these industries.
The annual goal is set at the beginning of the fiscal year but it can fluctuate due to the actual number of SIUs at any given time. During the course of the year, some SIUs do not discharge and cannot be monitored. TRAC's monitoring plan requires one additional sampling event for 40% of the SIUs and two additional sampling events for 10% of the SIUs. TRAC also monitors one-third of the non-SIUs each year.
SIU and Non-SIU permits are issued with durations of two to five years, depending on the category of industry, varying the number of permits that expire in a given year.
Copper, lead, and molybdenum are metals of concern for MWRA as their concentrations in its biosolids have, at times, exceeded regulatory standards for unrestricted use as fertilizer. Cooling tower usage typically causes a seasonal spike in molybdenum concentrations due to the blowdown on large AC systems that use corrosion inhibitors containing molybdenum. Levels drop again following the end of the cooling season. The hotter the season, the higher the spike. TRAC has an ongoing program to persuade cooling tower operators to switch to phosphate-based corrosion inhibitors. TRAC will continue its voluntary molybdenum reduction program, which has decreased influent loads significantly since 1995.
EPA requires MWRA to issue or renew 90% of SIU permits within 120 days of receipt of the application or the permit expiration date - whichever is later. EPA also requires the remaining 10% of SIU permits to be issued within 180 days. * TRAC also issued 318 Group Permits to printers and photoprocessors in August 2007.
Copper Concentrations in Biosolids (mg/l)
0
500
1000
1500
A M J J A S O N D J F MCopper DEP Type 1 Limit Previous 12 Months
Molybdenum Concentrations in Biosolids (mg/l)
0
10
20
30
40
50
60
70
80
A M J J A S O N D J F M
Molybdenum DEP Type 1 LimitEPA Interim Limit Previous 12 Months
Lead Concentrations in Biosolids (mg/l)
0
50
100
150
200
250
300
350
A M J J A S O N D J F M
Lead DEP Type 1 Limit Previous 12 Months
Inspections, Monitoring Events, Permits Issued, Year to Date
0
50
100
150
200
250
300
350
400
450
500
SIUs Monitored Non-SIUs Monitored SIU ConnectionsSampled
SIUs Inspected SIU Permits Issued Non-SIU PermitsIssued

Field Operations Highlights 3rd Quarter - FY08
Western Water Operations & Maintenance
• Carroll Water Treatment Plant (CWTP): Treatment Train A was activated and Train B was isolated to support the “half-plant” maintenance availability period. In preparation, staff flushed the upper portion of the Hultman Aqueduct. After flushing, flow was transitioned from the MetroWest Tunnel to the Upper Hultman. Operations & Maintenance staff then completed maintenance tasks associated with the maintenance availability period for Train B. In addition to the cleaning of the contactors and the storage tank, work included completing the installation of the new sodium hypochlorite diffusers, repairing a failed mud valve in the storage tank and sealing interior and exterior hatches. The contractor completed extending the 30-inch finished water suction line within the B-side storage tank. Staff completed filling, disinfecting and sampling Train B and CWTP was back to full-plant operations on February 20. In addition, staff replaced the calibration columns on the sodium hypochlorite, aqua ammonia and hydrofluosilic acid metering pumps. The new columns are made of PVC, replacing the original acrylic ones. Staff upgraded the valve actuator on the first of four 72-inch butterfly valves at the ozone effluent channel. The upgrade included an optical feedback unit to improve flow control through the plant. Also, staff provided training on the emergency generator starting SOP to support the Demand Response Program.
• Cosgrove Intake and Power Station: One year ago, the jacking bolts on all four sliding sleeve
valves were replaced after a series of mechanical failures. At that time, the bronze jacking bolts on Valve 2 were replaced with Delrin bolts. The hope was that this synthetic material would provide better service in a submerged environment. In addition, modifications were made to the valve actuators to dampen the number of times the valve moved while maintaining a set flow. Operations staff reconfigured the transmission system to lower the stilling basin and allow entry. Staff inspected the two valves with the most operating hours, one with bronze bolts and one with Delrin bolts and found both to be in good condition. Delrin jacking bolts were installed in both valves and staff will continue to monitor their performance. Also, staff ran the emergency generator and isolated the 13.8-kV line feeding the station to support the crest gate contractor coring access through a vault and supported the emergency generator service contractor with replacement of the engine’s propane vaporizers.
• Norumbega Covered Storage Tank: Staff supported the design/build contractor with the five-
year internal and external inspection of the storage tank by taking cells in and out of service, dewatering the influent and effluent chambers, and joint lock out/tag out of valves. The inspection will continue into the beginning of the next quarter. Also, staff diagnosed and repaired the uninterruptible power supply (UPS) for the control building.
• Oakdale Power Station: A tree fell on NGRID’s high-voltage line, which created a short circuit
at the station causing extensive damage to electrical equipment in the substation and the power station itself. Staff replaced the battery charger; ran a new 1,000-foot-long, 110/220-volt feed to the substation; replaced several molded case circuit breakers; replaced several fuses; made repairs to the oil/water separator; and replaced the electrical meter. Troubleshooting and repairs to the 66-kV circuit breaker continues and will be completed early next quarter. The electrical maintenance contractor has tested all of the protective relays in the power station. Repairs were also made to the telephone lines at the station. Once all repairs have been completed, staff will test run the hydro turbine. Also, staff repaired the field exciter rheostat for the hydro turbine’s generator; replaced a faulty heater on the 66-kV main circuit breaker, and replaced a faulty locking relay for the hydro turbine circuit breaker.
• Weston Facility: Staff started demolition and renovation work in the water treatment process
areas to provide working and storage space for the Emergency Services Unit. Metro Water Operations & Maintenance
• Water Pipeline Program: Water Pipeline is once again on track to meeting its yearly objectives
and goals. Water Pipeline staff have installed 20 valves and retrofitted seven blow-offs and will meet and possibly exceed program goals for this fiscal year. Leaks have been few and the two leaks found this fiscal year have been repaired. Water Pipeline has supported other departments on several projects such as sludge line repairs at Fore River, sewer repairs in Stoneham, drain installation at the Chelsea Facility, relocating water pipes at Fore River and leak repairs at Chelsea Creek and Columbus Park Headworks.

Metro Water Operations & Maintenance (Continued)
• Spot Pond Water Withdrawal: Winchester began pumping water from Spot Pond on January 2 and stopped on February 11. The total volume of water pumped was 112.5 million gallons.
• Phase 2 Pump Station Rehabilitation Contract: Work continues at Belmont, Brattle Court, and
Hyde Park Pump Stations. One pump is available for normal operation at Belmont and Hyde Park. Spring Street and Newton Street Stations are both fully available and in service to supply water in conjunction with Brattle Court and Hyde Park, respectively. A pressure reducing valve (PRV) that supplies water from the Northern Extra High Service Area to the Intermediate High (IH) Service Area is in service with the Belmont Station and out of service for construction. The Arlington Covered Reservoir continues to provide water storage in the IH during this period.
• Phase 6 Valve Replacement Contract: Several of the water storage tanks have been isolated
and reactivated for valve installations. In January, Bellevue Tank 2 was isolated and Tank 1 was activated. The Southern Extra High (SEH) Service Area operates at a grade line approximately 25 feet (10 psi) lower with Tank 1 in service. Tank 2 was then returned to service in conjunction with Tank 1. They were both operating about 25 feet lower than normal. On March 13, Bellevue Tank 2 was returned to its normal operating range and Tank 1 was returned to standby mode. The Walnut Hill Tank was taken out of service for valve installation work, with Turkey Hill tank providing service to the Northern Extra High (NEH) service area. Walnut Hill was returned to service on March 31. Turkey Hill will be isolated and taken out of service to allow valve work to be done in early April.
• Dig Safe Pilot Program: The Dig Safe Pilot Program related to MWRA water pipelines within
the City of Chelsea continues successfully. MWRA received 48 notices, 11 of which were of an emergency nature. A total of eight mark-outs were required this quarter.
• Meter 97 in Medford-Leaking Valve Incident: On March 25, during routine valve exercising, a
leak was discovered on one of the valves at Meter 97 (Second Street at Middlesex Avenue) in Medford. Medford Water was notified and the meter was isolated. The issue turned out to be a corroded drain plug in the body of the valve. Metro staff were able to install a new plug and return the meter to service the next day. No water quality complaints were received as a result of the incident.
Wastewater Operations & Maintenance
• CSO, Headworks, and Pumping: The Prison Point Optimization Plan has been ongoing.
SCADA training at Prison Point, Cottage Farm and Somerville Marginal has been completed. The influent flow meter at Somerville Marginal was repaired and updated. Detailed training schematics for Chelsea Screen House are in draft stage for the training modules. SCADA upgrades at Caruso Pump Station are completed; SCADA training at Caruso Pump Station and Chelsea Screen House has also been completed.
Technical Inspection • Staff inspected 5.78 miles (30,564 linear feet) of MWRA interceptor during the 3rd Quarter.
Staff also inspected 44 structures and one siphon barrel. Staff inspected .22 miles (1,120 linear feet) of community pipeline, as well.
Wastewater Pipeline
• Staff cleaned 2.91 miles (15,428 linear feet) of MWRA interceptor and removed 30.5 cubic
yards of debris in the 3rd Quarter. Staff rehabilitated one manhole and cleaned 28 siphon barrels. Staff also cleaned .55 miles (2,940 linear feet) of community pipeline.
TRAC
• Sampling Procedures: TRAC’s Monitoring Section worked with Deer Island’s Department of
Laboratory Services, ENQUAD, and Clinton staff to work out the details and procedures to sample the Nashua River at a location upstream of the Clinton Plant. This project was implemented for the first time to meet the new monthly Clinton toxicity protocols that use more stringent and detailed guidelines and techniques for equipment cleanliness when sampling for metals in the river upstream of the plant.
• TRAC-IS Replacement Progress: The PIMS Project Team conducted a Conference Room
Pilot from March 10 to March 21 to help develop business process models that will use the PIMS software. The pilot also identified software bugs and gap workarounds, and refined the configuration of the software. All TRAC groups were represented. The Project Team

TRAC (Continued)
documented its findings and provided extensive feedback to the vendor, who will make updates and improvements to the software based on the. Testing continues.
• Emerging Technology: TRAC staff met with the MIS, other Field Operations staff, and
representatives from IKON to discuss options available for utilizing TRAC’s existing copier as a scanner and “portal” to send hard-copy documents to the new PIMS system utilizing the document management functionality.
Metro Equipment and Facility Maintenance
Equipment Maintenance Program
• Hough’s Neck Pump Station: Mechanics and electricians replaced one of two facility pumps;
one was pumping less than design capacity because of a severely worm impeller. Another rebuilt unit was available in inventory, which eliminated downtime. The second unit was able to maintain incoming flows during replacement that was completed within several hours.
• Prison Point: Mechanics replaced the hydraulic motor and transmission that drives the dry
weather flow screen. The original unit was more than 20 years old and started leaking fluid. • Columbus Park Headworks: Mechanics and machinists rehabilitated the Horizontal Conveyor
Screw 3, which had worn beyond repair. The unit is no longer available as a direct replacement. A longer screw shaft was purchased and modified to fit. It was retrofitted by cutting to length and installing new bushings and couplings. This screw moves grit from the collection channels to the ejection system.
• Loring Road: Electricians worked closely with the Water Valve and Pipeline staff to remove
and replace all valve actuator batteries. All the valves were exercised and tested both mechanically and electrically to ensure proper operation and reliability.
Projects Development and Service Contracts
• Service Contract Development Updates: Crane Maintenance Service, Contract OP-51 –Fourth round of inspections is in progress. Elevator Service Contract for Deer Island, Contract OP-85 – New contract was awarded to Associated Elevator Companies. Elevator Service Contract for Various Authority Facilities, Contract OP-87 – Contract was awarded to Associated Elevator Companies. Fire Alarm and Fire Sprinkler Systems Service, Contract OP-50 – Staff reviewed the third quarterly inspection reports of fire alarm systems and the contractor will perform repairs at various facilities to correct deficiencies. New Hydraulic Service, Contract OP-79 – Staff summary is in circulation to award the contract to R Zoppo, Inc. Boiler and Water Heater Service, Contract OP-63 – Water, chemical and glycol treatment of boilers completed at various water and wastewater facilities. Fuel Storage Tank Maintenance Service, Contract OP-48 – Second annual inspection of fuel storage tank monitoring systems to be completed in April 2008. The failed digital monitoring system at Columbus Park Headworks was replaced with SCADA-compatible system. Air Compressor Service, Contract OP-49 – Second annual inspection of compressor systems in progress. Renewal of air receiver tank certification process being coordinated with FM Global.
• Project Developments: Chelsea Headworks Ductwork Repair, Contract OP-77 –
Contractor completed modifications to increase exhaust fan capacity. Nut Island Fire Alarm Replacement - Evaluation and design of system components and wiring to be replaced in the future. Site visits were completed and consultant will start design in April 2008. Caruso Pumping Station Pump Shaft Replacement Design - The task order scope for assessment and evaluation of the pumps was completed and a kick-off meeting was held at Caruso Pump Station on March 25.
Grounds/Custodial Maintenance
• Snowplowing and Sanding: Grounds crews were utilized to plow, sand and maintain access
during the winter at the water facilities. Pre-treating walks, filling sand barrels, clearing storm drains, clearing fuel fills and vaults that require access by operational staff are all activities performed during and after winter snowfall.
• Fence Work: Fence repairs are ongoing, especially after the winter months. Repairs were
made to the fence at Loring Road, Caruso Pump Station and the Chelsea Facility. Gate adjustments and repairs were made at the IPS and Walnut Hill. The fence litter control fabric

Metro Equipment and Facility Maintenance (Continued) Operations Support
was re-secured at the Somerville CSO. Repairs were made to fences at Hough’s Neck Pump Station and Shaft 7D.
• Grounds Work: Four grounds maintenance and landscaping contracts were advertised for
bidding that will include approximately 40 water and wastewater sites. Easement clearing has now become a primary core task for the Grounds staff. The work includes sites at both water and wastewater locations and around metering equipment. Easements were cleared and the WASM 4 pipeline was cleared. Easement clearing for water main crossings is in progress, and signs are being produced in-house to replace damaged and missing signs. Spring cleaning was performed by Grounds crews in advance of the new grounds maintenance contracts. Many sites were attended to and include Hingham, IPS, Commonwealth Avenue, Spring Street Pump Station., Prison Point, Hayes Pump Station., DeLauri, Alewife Pump Station, Cottage Farm, and Arlington.
• Custodial Work: Staff continue to maintain numerous locations at water and wastewater
stations. Extra cleaning and effort is required at wastewater facilities after wet-weather activations, which were more frequent these past couple of months. Additional duties include seasonal steam-cleaning and extra facility cleanings during special events or visitor tours. Crews steam cleaned walls at several facilities including Newton Street Pump Station, Commonwealth Avenue Pump Station, Belmont and Gillis.
Facility Maintenance
• Masonry Work: Bollards and a concrete berm were installed at the IPS to protect ductwork and other equipment in the screenings and grit room. Pump bases were restored at the Gillis Pump Station and the New Neponset Pump Station. A severe crack in the wall of the sampling room at Prison Point was repaired. Based on a safety review, the garage floor at Chelsea Headworks was repaired and coated to a smooth finish to protect from chemical, oil, and grease. A large floor crack was found and repaired in the garage floor at Nut Island. Masons worked with electricians to repair concrete around numerous conduits coming up into the truck bay at Nut Island.
• Carpentry Work: Facility Specialists are erecting a shed near the pier to store the fertilizer
product from the Pelletizing Plant. This will eliminate the need to use Building 11. Downspouts were replaced at the Alewife Brook Pump Station. Aluminum material was used in lieu of copper with the same aesthetic value.
• Painting Work: Graffiti removal work was performed at Fox Point. There was extensive graffiti
along the back walls, sides, and fronts of both buildings. All graffiti was documented and pictures were submitted to Security before removal. Graffiti was also removed at Gatehouse 2 at the Chestnut Hill Reservoir. The Dudley Road Pump Station interior was completely painted to protect against moisture and condensation on the new piping and the pumps. During inclement weather, bookcases were made for Vehicle Maintenance and the Warehouse, and the old cabinets salvaged from the old Quincy and Braintree Weymouth Pump Stations.
Emergency Planning
• Staff participated in an EPA-led initiative to develop Mutual Aid Agreements to expedite
emergency response to Hurricane Katrina-type disasters. A draft model agreement for Massachusetts water suppliers, called MA WARN (Water Agency Response Network), was completed in August with input from MWRA staff. Broad circulation of this draft to other Massachusetts utilities is expected in the coming months and several large utilities have joined to date. Staff briefed the Advisory Board on the topic in November. Several communities, including BWSC, have already entered into this agreement.
• Staff prepared purchase specifications for mobile analytical equipment and water quality
sensors as authorized by a recent DHS grant award. • A desktop drill was held for Field Operations staff in February to simulate a water supply
interruption at the Carroll Water Treatment Plant.

Operations Support (Continued)
• A severe hurricane drill is being planned for April. Staff are working to refine estimates of probable damage at potentially flooded coastal areas.
• As of March, the backup EOC at the CWTP is fully operational and the backup OCC links to
operate the Metropolitan area facilities in the event of OCC failure in Chelsea are operational. Operations Engineering • Staff continued providing support on major capital and in-house projects with significant third
quarter activity on the water pump stations project, Phase 6 valve rehabilitation, CVA redundancy improvements, Section 22 redundancy and SCADA implementation at wastewater facilities.
• Staff executed an Operations Plan for the scheduled shutdown and internal inspection of
Norumbega Tanks Cells beginning in March. Notification was also made through the Advisory Board. The series of individual cell inspections is expected to be completed by the end of April.
• Staff are developing Operations Plans for start-up of the rehabilitated Belmont Pump Station. SCADA • Through March, controls have been successfully upgraded at all field sites to the point that site
functions are now controllable from the OCC in Chelsea. Functional acceptance tests and punch list items continue to be resolved.
• Bids have been received and the second construction contract (SCADA improvements at
Headworks) was awarded in January; a construction kick-off meeting was held in February. Staff are coordinating field activities as work begins in the headworks.
Wastewater Metering • In January, staff completed preparing year-end 2007 flows for CEB preparation and
assessment development. A staff summary was prepared for February for a correction to Canton flows for the past two years as a result of a recently identified field issue.
• In March, some recent flow testing information has identified further flow edits necessary at
some field sites. Some additional site issues involving some 2007 meter relocations and other minor field changes are also still being reviewed to determine the need to make further CY2007 changes.
• Staff also continued to work aggressively on reducing the erratic velocity issues at some meter
sites. A temporary flow testing contractor has been conducting tests at some problem sites throughout the third quarter.
Water Quality Assurance
• In January, staff completed a draft of the annual water quality monitoring program description
for submission to DEP. • In February, staff helped complete the annual half-plant operation and cleaning of the ozone
contactors and tanks. This included sampling of the solids and biofilms in the normally inaccessible areas and development of revised treatment strategies for the relocated chlorine application points.
• In the third quarter, staff participated in the scheduled diver entry to Norumbega Tanks for
internal structural inspection. Staff monitored the sanitary aspects of the operation and provided additional water quality monitoring.
80
Laboratory Services3rd Quarter - FY08
Percent On-Time Results
75%
80%
85%
90%
95%
100%
J A S O N D J F M A M J
3-Year Average Goal FY08
Turnaround Time
0123456789
1011
J A S O N D J F M A M J
Day
s
3-Year Average Goal FY08
Quarterly Compliance Rating
0%
20%
40%
60%
80%
100%
S D M J3-Year Average Goal FY07
Tests Completed
0
5
10
15
20
25
30
J A S O N D J F M A M J
Thou
sand
s
Budget 3-Year Average FY08
Value of Services Rendered
$0
$100
$200
$300
$400
$500
$600
J A S O N D J F M A M J
Thou
sand
s
Budget 3-Year Average FY08
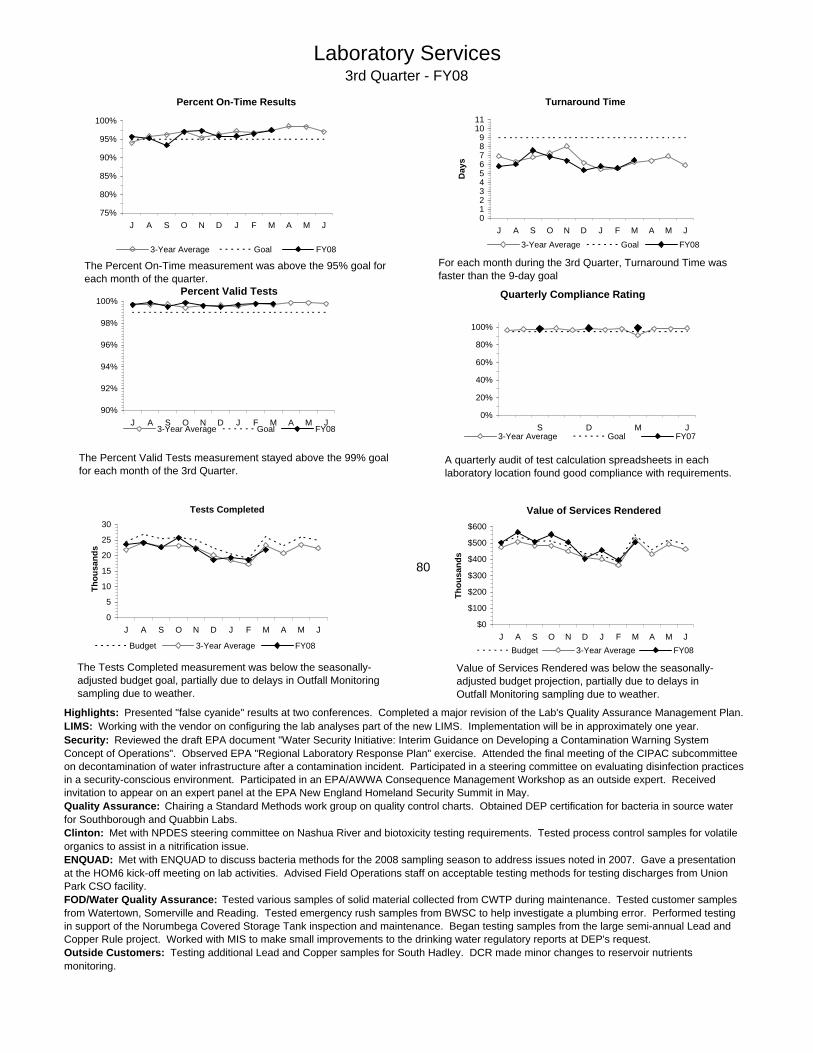
The Percent On-Time measurement was above the 95% goal for each month of the quarter.
The Percent Valid Tests measurement stayed above the 99% goal for each month of the 3rd Quarter.
The Tests Completed measurement was below the seasonally- adjusted budget goal, partially due to delays in Outfall Monitoring sampling due to weather.
For each month during the 3rd Quarter, Turnaround Time was faster than the 9-day goal
A quarterly audit of test calculation spreadsheets in each laboratory location found good compliance with requirements.
Value of Services Rendered was below the seasonally- adjusted budget projection, partially due to delays in Outfall Monitoring sampling due to weather.
Percent Valid Tests
90%
92%
94%
96%
98%
100%
J A S O N D J F M A M J3-Year Average Goal FY08
Highlights: Presented "false cyanide" results at two conferences. Completed a major revision of the Lab's Quality Assurance Management Plan. LIMS: Working with the vendor on configuring the lab analyses part of the new LIMS. Implementation will be in approximately one year. Security: Reviewed the draft EPA document "Water Security Initiative: Interim Guidance on Developing a Contamination Warning System Concept of Operations". Observed EPA "Regional Laboratory Response Plan" exercise. Attended the final meeting of the CIPAC subcommittee on decontamination of water infrastructure after a contamination incident. Participated in a steering committee on evaluating disinfection practices in a security-conscious environment. Participated in an EPA/AWWA Consequence Management Workshop as an outside expert. Received invitation to appear on an expert panel at the EPA New England Homeland Security Summit in May.Quality Assurance: Chairing a Standard Methods work group on quality control charts. Obtained DEP certification for bacteria in source water for Southborough and Quabbin Labs. Clinton: Met with NPDES steering committee on Nashua River and biotoxicity testing requirements. Tested process control samples for volatile organics to assist in a nitrification issue. ENQUAD: Met with ENQUAD to discuss bacteria methods for the 2008 sampling season to address issues noted in 2007. Gave a presentation at the HOM6 kick-off meeting on lab activities. Advised Field Operations staff on acceptable testing methods for testing discharges from Union Park CSO facility. FOD/Water Quality Assurance: Tested various samples of solid material collected from CWTP during maintenance. Tested customer samples from Watertown, Somerville and Reading. Tested emergency rush samples from BWSC to help investigate a plumbing error. Performed testing in support of the Norumbega Covered Storage Tank inspection and maintenance. Began testing samples from the large semi-annual Lead and Copper Rule project. Worked with MIS to make small improvements to the drinking water regulatory reports at DEP's request. Outside Customers: Testing additional Lead and Copper samples for South Hadley. DCR made minor changes to reservoir nutrients monitoring.

CSO Update 3rd Quarter - FY08
North Dorchester Bay Tunnel and Related Facilities: The tunnel contractor commenced full mining operations on January 15, 2008, with two shifts that have since progressed with no substantial interruption. As of March 31, the contractor had mined 4,640 feet or 43% of the proposed 10,832-foot (2.1-mile) tunnel. As the mining proceeds, the contractor simultaneously installs a full circumferential tunnel liner using 10-inch thick, bolted and gasketed pre-cast concrete segments. The lining system is designed to provide long-term structural strength and water-tightness. The contractor continuously removes tunnel muck produced from the mining operation to various disposal sites that were arranged by pursuant to the contract provisions. The contractor has also made substantial progress constructing the CSO and stormwater diversion structures and tunnel drop shafts at existing CSO outfalls, restoring and improving the surface of Moakley Park where much of the construction to date has taken place, and cleaning and rehabilitating existing sewers and outfall pipes to prepare them for tunnel mining below them and for connections to the tunnel. The contractor has completed all of the drainage work at Outfall BOS087, where BWSC eliminated CSO discharges a few years ago. BOS087 now serves as a storm drain outfall but will be closed as part of the North Dorchester Bay CSO plan. Work at construction drop shafts and CSO and stormwater diversion structures at Outfalls BOS086 and BOS085 is well underway and is scheduled to be complete by this spring. The contractor has also commenced work at Outfalls BOS084 and BOS083 and plans to complete the work in these areas by summer 2008. Work at Outfalls BOS082 and BOS081 is scheduled to commence in fall 2008 and be complete by spring 2009. Work is also currently underway to provide an emergency access shaft approximately halfway along the proposed tunnel alignment. MWRA’s design consultant completed field investigations and the Design Report in 2007 and submitted the 100% design plans and contract specifications on March 31, 2008. In addition, the consultant has commenced bathymetric surveys in North Dorchester Bay and internal inspections and core samplings of the CSO outfalls as part of the CSO Outfall sedimentation study. This study is intended to develop recommendations for ensuring that the outfalls will remain operationally reliable after the CSO storage tunnel is brought on line and discharges through the outfalls become infrequent. Design of the tunnel-related facilities is on schedule and MWRA plans to award the related construction contract by March 2009. East Boston Branch Sewer Relief: MWRA is currently reviewing the 100% design submission for Contract 6257 and plans to advertise the bid documents in April 2008. Contract 6257 involves installation of approximately 2.5 miles of new sewer interceptor along Border, Condor, East Eagle and Chelsea Streets and along Marginal, Orleans and Bremen Streets, primarily using micro-tunneling methods with limited open-cut sections. MWRA expects to issue the Notice to Proceed for Contract 6257 by June 30, 2008, in compliance with Schedule Seven. Final easement drawings were received in February 2008. In parallel with these final design efforts, MWRA has continued to meet with outside agencies and property owners to coordinate the work and to obtain necessary construction permits and easements. The design consultant will submit the 50% plans and specifications for Construction Contract 6841 in April 2008. This contract involves replacement and upgrade of approximately one mile of sewer line in the upstream reaches of the East Boston interceptor system, primarily using the pipe-bursting method. MWRA plans to complete final design and advertise this construction contract by September 2008. MWRA has scheduled all construction contracts to be complete by June 2010, in compliance with Schedule Seven. Brookline Connection and Cottage Farm Overflow Chamber Interconnection and Gate Controls: MWRA advertised the construction contract on March 15, 2008, and bids are scheduled to be opened on April 24, 2008. An 8(m) permit and a Direct Connection permit were issued in February and March, respectively. The Boston Conservation Commission issued an Order of Conditions on February 1 and the Cambridge Conservation Commission is expected to issue its Order of Conditions in early April. DCR has not yet issued a permit for construction in response to MWRA’s application of November 6, 2007. Staff maintain contact with DCR. MWRA intends to award the construction contract by June 2008. Charles River Interceptor Gate Controls and Additional Interceptor Connections: This project is intended to optimize hydraulic conditions within the interceptor system associated with the Cottage Farm CSO facility to minimize CSO discharges at Cottage Farm and at hydraulically-related CSO outfalls along the Charles River. On January 16, the Board approved the award of a design contract for this project and on January 31, MWRA issued the Notice to Proceed. The design consultant submitted the Project Work Plan, Schedule and QA/QC Plan on March 12 and the Hydraulic Modeling Work Plan on March 25. Preliminary design work is ongoing and the preliminary design report is due in January 2009. Optimization Study of Prison Point CSO Facility: MWRA has completed the upgrades to the SCADA system and the implementation and testing of the new operational control strategies intended to minimize treated discharges to the Inner Harbor. Staff are preparing a report on the results of the start-up and testing program that

will also include proposed new discharge limits for the Prison Point facility. Staff plan to submit the report to EPA and DEP and propose new limits to the Federal District Court by the end of April 2008. South Dorchester Bay Sewer Separation: BWSC is continuing with private inflow source removal (downspout disconnections) in the tributary areas to further reduce stormwater inflow to the sewer system. Since 2006, BWSC has metered flows in the separated sewer system and conducted hydraulic evaluations to verify whether hydraulic performance goals have been met. BWSC has completed its metering program and is evaluating the meter data to determine the effectiveness of it downspout removal program. Morrissey Boulevard Storm Drain: A component of the North Dorchester Bay CSO control plan, this project is intended to direct some of the North Dorchester Bay stormwater away from MWRA’s CSO storage tunnel to maximize the level of stormwater control along the South Boston beaches. As previously reported, BWSC has completed the first construction contract, which involved a new diversion chamber that will allow stormwater flows now discharging to the South Boston beaches at Outfall BOS087 to be diverted to Savin Hill Cove in storms greater than the 1-year design storm. In smaller storms, the stormwater will be diverted to the North Dorchester Bay CSO storage tunnel. BWSC has continued to make progress with the second, much larger, construction contract, which it commenced in September 2007. This contract primarily involves installation of the large storm drain (a 12-foot by 12-foot box conduit) along Morrissey Boulevard from Kosciuszko Circle to a new outlet at Savin Hill Cove. The contract is on schedule for Substantial Completion by June 2009, in compliance with Schedule Seven. Reserved Channel Sewer Separation: This project is intended to minimize CSO discharges to the Reserved Channel by separating combined sewer systems in adjacent areas of South Boston. Implementation of the recommended sewer separation plan will reduce the number of overflows from as many as 37 to 3 in a typical year. BWSC has substantially completed the data collection phase of this project. BWSC expects to receive the preliminary design report from its design consultant this spring. The report will define the size, extent and location of new storm drains and sewers necessary to separate the sewers tributary to the four existing CSO outfalls along the Reserved Channel. It will also define the level of stormwater inflow that BWSC must remove from the sewer system to effect the required levels of control at the outfalls. BWSC will submit the preliminary design report and detailed cost estimate to MWRA when they are available. BWSC has informed MWRA that the project cost estimate to lay the new storm drains through the congested residential and commercial streets and tight utility corridors that characterize the Reserved Channel area may be as much as $57 million more than the $63.1 million in MWRA’s Proposed FY09 CIP budget. MWRA will review the design plans and detailed cost estimate when they are received from BWSC with the Preliminary Design Report to determine how to proceed with this project. Bulfinch Triangle Sewer Separation: The project goal is to minimize CSO discharges to the Charles River by separating combined sewer systems in the area of Boston roughly bounded by North Station, Haymarket Station, North Washington Street, Cambridge Street and immediate environs. The recommended sewer separation plan is intended to reduce the number of overflows to the Charles River, reduce overflows to the Prison Point CSO facility and close Outfall BOS049. Field investigations, building inspections and survey work are substantially complete. BWSC received the final Preliminary Design Report from its design consultant in September 2007 and has authorized final design activities, which are now underway. MWRA continues to review the Preliminary Design Report, the preliminary design plans, and the updated cost estimate it received from BWSC. The cost estimate has increased significantly, approximately $2 million above the $4.7 million budget in MWRA’s Proposed FY09 CIP budget. MWRA is reviewing the estimates and the preliminary design plans. Brookline Sewer Separation: This project will separate sewers in several areas of Brookline, totaling 72 acres, where there are remaining combined sewers tributary to MWRA’s Charles River Valley Sewer. The project is intended to reduce discharges to the Charles River from the Cottage Farm facility. The Town of Brookline submitted its preliminary design report to MWRA in late December 2007and has commenced final design services. The report includes a detailed cost estimate that is substantially higher than the concept plan estimate in MWRA’s CIP budget. Much of the higher cost is due to the necessary depth of the new sewers that will be constructed and Brookline’s recommendation to use microtunneling. Cambridge/Alewife Brook Sewer Separation: On October 16, 2007, DEP issued a decision rejecting a final administrative appeal request related to the Alewife Brook CSO control plan and sustaining the wetlands Superseding Order of Conditions it had issued to the City of Cambridge for Contract 12, which includes the CAM004 stormwater outfall and wetland basin. On November 14, 2007, citizen petitioners filed an appeal of this DEP decision in Massachusetts Superior Court, in part, requesting the Court to enjoin the City of Cambridge from taking any action toward construction of any portion of the project until the matters of the court appeal are resolved. Despite this appeal and motion, MWRA and the City of Cambridge expect to finalize their negotiations soon on changes to their CSO Memorandum of Understanding and Financial Assistance Agreement to incorporate the full scope of the revised sewer separation plan as presented in the July 2003 Final Variance Report, along with updated costs, a cost share, and new project schedules. Upon approval by MWRA's Board of Directors, MWRA and the City of Cambridge plan to move forward with implementation of the Alewife Brook CSO projects.

CONSTRUCTION PROGRAMS

Blue Hills Covered Storage Design Build ProjectProgress - March 2008
0%
20%
40%
60%
80%
100%
A-07 M-07 J-07 J-07 A-07 S-07 O-07 N-07 D-07 J-08 F-08 M-08
Planned Actual
North Dorchester Bay CSO Tunnel/ShaftsProgress - March 2008
0.0%
20.0%
40.0%
60.0%
80.0%
100.0%
A-07 M-07 J-07 J-07 A-07 S-07 O-07 N-07 D-07 J-08 F-08 M-08
Planned Actual
Projects In Construction - 1March 2008
(Progress Percentages based on Construction Expenditures)
Project Summary: This project includes of a 20 million gallon covered storage facility at the Blue Hills Reservation, providing sufficient distribution storage to the communities of MWRA’s Southern High Storage Area.
Status and Issues: During March, the contractor continued prefabbing and setting rebar mats for the walls in Tank 2. The contractor resumed placing concrete for Tank 2 walls and began forming walls in Tank 1. Wall sleeves, embedded items, forming and placing concrete was finished for the remainder of the Valve Vault walls. The contractor continued installing the 48” ductile iron water line, 12” collector pipe for tank underdrain systems and drainage aggregate layer between the valve vault and tanks. The importing of fill material to the site continued for use in building up the western slope for the reservoir.
Project Summary: Construction of 10,872 LF of 17-ft diameter segment lined storage tunnel with 7 diversion structure/drop shafts and associated sewer and drainage separation pipework.
Status and Issues: During March, the contractor mined across Marine Park from Sta 27+24 near P Street to 45+40 near M Street in Boston Blue Clay and some sand/gravel seams. The contractor mined at an average rate of 90 lf/day, up 23 lf/day from the previous month. At -085 the contractor continued Hydraulic Control Vault fitout and continued installing interconnecting hydraulic, power, communication and control utilities. At -086 the contractor completed CSO cleaning operations, continued Hydraulic Control Vault fitout and continued installing interconnecting hydraulic, power, communication and control utilities. Schedule performance continues to be ahead of schedule, with mining reaching 41.7%.
East Boston Branch Relief Sewer Progress - March 2008
0%
20%
40%
60%
80%
100%
A-07 M-07 J-07 J-07 A-07 S-07 O-07 N-07 D-07 J-08 F-08 M-08
Planned Actual
Project Summary: Construction of 14,500 feet of replacement sewers primarily by microtunneling.
Status and Issues: The contract is on schedule with the construction bid to be advertised in April and a notice to proceed date before June 30th. This is a court ordered project and notice to proceed schedule. Construction duration will be for 24 months and the latest engineering estimate is $55.1 million.
BW Replacement Pump StationProgress - March 2008
0%
20%
40%
60%
80%
100%
A-07 M-07 J-07 J-07 A-07 S-07 O-07 N-07 D-07 J-08 F-08 M-08
Planned Actual
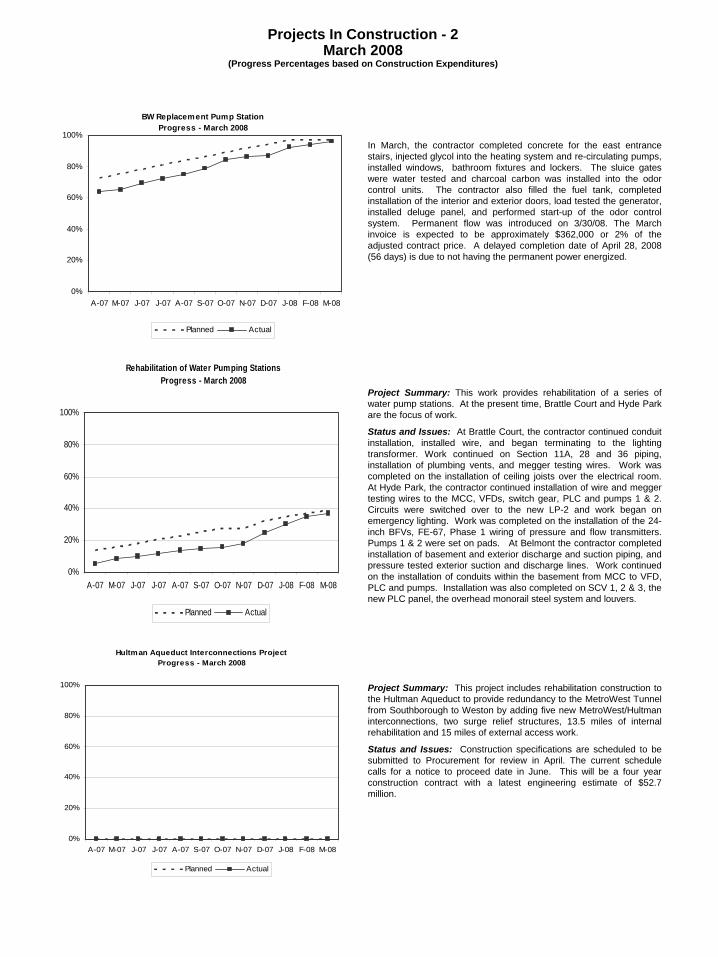
In March, the contractor completed concrete for the east entrance stairs, injected glycol into the heating system and re-circulating pumps, installed windows, bathroom fixtures and lockers. The sluice gates were water tested and charcoal carbon was installed into the odor control units. The contractor also filled the fuel tank, completed installation of the interior and exterior doors, load tested the generator, installed deluge panel, and performed start-up of the odor control system. Permanent flow was introduced on 3/30/08. The March invoice is expected to be approximately $362,000 or 2% of the adjusted contract price. A delayed completion date of April 28, 2008 (56 days) is due to not having the permanent power energized.
Projects In Construction - 2March 2008
(Progress Percentages based on Construction Expenditures)
Rehabilitation of Water Pumping StationsProgress - March 2008
0%
20%
40%
60%
80%
100%
A-07 M-07 J-07 J-07 A-07 S-07 O-07 N-07 D-07 J-08 F-08 M-08
Planned Actual
Project Summary: This work provides rehabilitation of a series of water pump stations. At the present time, Brattle Court and Hyde Park are the focus of work.
Status and Issues: At Brattle Court, the contractor continued conduit installation, installed wire, and began terminating to the lighting transformer. Work continued on Section 11A, 28 and 36 piping, installation of plumbing vents, and megger testing wires. Work was completed on the installation of ceiling joists over the electrical room. At Hyde Park, the contractor continued installation of wire and megger testing wires to the MCC, VFDs, switch gear, PLC and pumps 1 & 2. Circuits were switched over to the new LP-2 and work began on emergency lighting. Work was completed on the installation of the 24- inch BFVs, FE-67, Phase 1 wiring of pressure and flow transmitters. Pumps 1 & 2 were set on pads. At Belmont the contractor completed installation of basement and exterior discharge and suction piping, and pressure tested exterior suction and discharge lines. Work continued on the installation of conduits within the basement from MCC to VFD, PLC and pumps. Installation was also completed on SCV 1, 2 & 3, the new PLC panel, the overhead monorail steel system and louvers.
Hultman Aqueduct Interconnections ProjectProgress - March 2008
0%
20%
40%
60%
80%
100%
A-07 M-07 J-07 J-07 A-07 S-07 O-07 N-07 D-07 J-08 F-08 M-08
Planned Actual
Project Summary: This project includes rehabilitation construction to the Hultman Aqueduct to provide redundancy to the MetroWest Tunnel from Southborough to Weston by adding five new MetroWest/Hultman interconnections, two surge relief structures, 13.5 miles of internal rehabilitation and 15 miles of external access work.
Status and Issues: Construction specifications are scheduled to be submitted to Procurement for review in April. The current schedule calls for a notice to proceed date in June. This will be a four year construction contract with a latest engineering estimate of $52.7 million.
CIP Expenditures
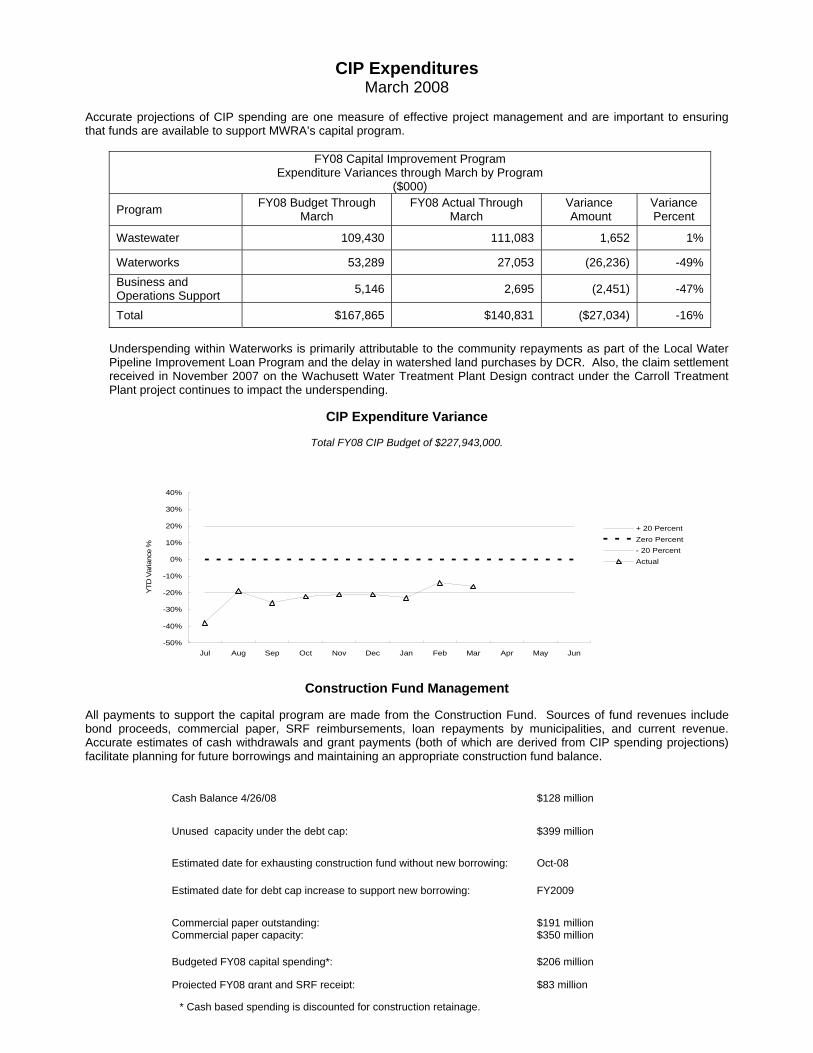
March 2008 Accurate projections of CIP spending are one measure of effective project management and are important to ensuring that funds are available to support MWRA’s capital program.
FY08 Capital Improvement Program Expenditure Variances through March by Program
($000)
Program FY08 Budget Through March
FY08 Actual Through March
Variance Amount
Variance Percent
Wastewater 109,430 111,083 1,652 1%
Waterworks 53,289 27,053 (26,236) -49% Business and Operations Support 5,146 2,695 (2,451) -47%
Total $167,865 $140,831 ($27,034) -16%
Underspending within Waterworks is primarily attributable to the community repayments as part of the Local Water Pipeline Improvement Loan Program and the delay in watershed land purchases by DCR. Also, the claim settlement received in November 2007 on the Wachusett Water Treatment Plant Design contract under the Carroll Treatment Plant project continues to impact the underspending.
CIP Expenditure Variance
Total FY08 CIP Budget of $227,943,000.
-50%
-40%
-30%
-20%
-10%
0%
10%
20%
30%
40%
Jul Aug Sep Oct Nov Dec Jan Feb Mar Apr May Jun
YTD
Var
ianc
e %
+ 20 PercentZero Percent- 20 PercentActual
Construction Fund Management All payments to support the capital program are made from the Construction Fund. Sources of fund revenues include bond proceeds, commercial paper, SRF reimbursements, loan repayments by municipalities, and current revenue. Accurate estimates of cash withdrawals and grant payments (both of which are derived from CIP spending projections) facilitate planning for future borrowings and maintaining an appropriate construction fund balance.
Cash Balance 4/26/08 $128 million
Unused capacity under the debt cap:
$399 million
Estimated date for exhausting construction fund without new borrowing: Oct-08
Estimated date for debt cap increase to support new borrowing: FY2009
Commercial paper outstanding: Commercial paper capacity:
$191 million $350 million
Budgeted FY08 capital spending*: $206 million
Projected FY08 grant and SRF receipt: $83 million
* Cash based spending is discounted for construction retainage.

DRINKING WATER QUALITY AND SUPPLY

Wachusett Reservoir Fecal Coliform Levels Before Disinfection
0
10
20
30
Mar-07 Jun-07 Sep-07 Dec-07 Mar-08
Feca
l Col
iform
(cfu
/100
mL)
Maximum Standard
Quabbin Reservoir Fecal Coliform Levels Before Disinfection
0
10
20
30
Mar-07 Jun-07 Sep-07 Dec-07 Mar-08
Feca
l Col
iform
(cfu
/100
mL)
Maximum Standard
Source Water – Microbial Results3rd Quarter - FY08
BackgroundTotal coliform bacteria are monitored in both source and treated water to provide an indication of overall bacteriological activity. Most coliforms are harmless. However, fecal coliform, a subclass of the coliform group, are identified by their growth at temperatures comparable to those in the intestinal tract of mammals. They act as indicators of possible fecal contamination. The Surface Water Treatment Rule for unfiltered water supplies requires that no more than 10% of source water samples prior to disinfection over any six-month period have more than 20 fecal coliforms per 100ml.
Sample Site: Quabbin ReservoirQuabbin Reservoir water is sampled at the Ware Disinfection Facility (WDF) raw water tap before entering the CVA system. MWRA met the six-month running average standard for fecal coliform continuously at this location during the past year.
All samples collected during the 3rd Quarter were below 20 cfu/100ml. For the current six-month period, 0.0% of the samples exceeded a count of 20 cfu/100ml.
Sample Site: Wachusett ReservoirWachusett Reservoir water is sampled before it enters the MetroWest/Metropolitan Boston systems at the CWTP raw water tap in Marlborough.
All samples collected during the 3rd Quarter were below 20 cfu/100ml. For the current six-month period, 0.0% of the samples exceeded a count of 20 cfu/ 100ml.
Wachusett ReservoirSix-Month Running Average
0.0% 0.0% 0.0% 0.0% 0.0% 0.0% 0.0% 0.0% 0.0% 0.0% 0.0% 0.0% 0.0%0%
2%
4%
6%
8%
10%
12%
Mar-07 Jun-07 Sep-07 Dec-07 Mar-08
Perc
ent o
f Sam
ples
Exce
edin
g 20
cfu
/100
ml
Maximum Standard

Source Water – Algae
Algal levels in Wachusett Reservoir are monitored by DCR and MWRA. These results, along with taste and odor complaints, are used to make decisions on source water treatment for algae control.
Taste and odor complaints at the tap may be due to algae, which originate in source reservoirs, typically in trace amounts. Occasionally, a particular species grows rapidly, increasing its concentration in water. When Synura, Anabaena, or other nuisance algae bloom, MWRA may treat the reservoir with copper sulfate, an algaecide. During the winter and spring, diatom numbers may increase. While not a taste and odor concern, consumers using filters may notice more frequent changing of the filters is needed. Diatom levels are currently low.
No samples had been taken since January 9, 2008 as significant ice cover on the reservoir prevented safe algae sampling. On March 4, algae sampling resumed at the Wachusett Reservoir due to the ice cover melting. Algal levels were low for the quarter.
Quabbin Reservoir Average and Maximum Daily Turbidity Levels Leaving
Quabbin Reservoir
0.0
0.5
1.0
1.5
2.0
Mar-07 Jun-07 Sep-07 Dec-07 Mar-08
Tu
rbid
ity (N
TU)
)
Daily MaximumDaily Average
Maximum Standard
Source Water – Turbidity3rd Quarter - FY08
Background
Turbidity is a measure of suspended and colloidal particles, including clay, silt, organic and inorganic matter, algae and microorganisms. The effects of turbidity depend on the nature of the matter that causes the turbidity. High levels of particulate matter may have a higher chlorine demand or may protect bacteria from the disinfectant effects of chlorine, thereby interfering with the disinfectant residual throughout the distribution system.
Samples for turbidity from Quabbin Reservoir are collected at the Ware Disinfection Facility before chlorination. Samples from Wachusett Reservoir are taken at the CWTP’s inlet (raw water line) before treatment. The Massachusetts Department of Environmental Protection standard for source water turbidity for unfiltered water supply systems is a maximum of 1.0 NTU; the EPA standard is a maximum of 5.0 NTU. Maximum turbidity results at Quabbin and Wachusett were within DEP standards for the quarter.
Wachusett ReservoirAverage and Maximum Daily Turbidity Levels Leaving
Wachusett Reservoir
0.0
0.5
1.0
1.5
2.0
Mar-07 Jun-07 Sep-07 Dec-07 Mar-08
Tu
rbid
ity (N
TU)
)
Daily MaximumDaily Average
Maximum Standard
Total Algae at Wachusett ReservoirMaximum Level
0
600
1200
1800
2400
3000
Mar-07 Jun-07 Sep-07 Dec-07 Mar-08
asu/
mL
Total Diatoms at Wachusett ReservoirMaximum Level
0
600
1200
1800
2400
3000
Mar-07 Jun-07 Sep-07 Dec-07 Mar-08
asu
/ml

Giardia CT Percent AchievementWare Disinfection Facility
0
200
400
600
800
1000
1200
1400
Mar-07 Jul-07 Nov-07 Mar-08
% C
T Ac
hiev
ed
Regulatory Minimum Standard
Quabbin Reservoir at Ware Disinfection Facility (CVA Supply):Chlorine dose remained at 1.3 mg/L. CT was met each day this quarter, as well as every day for the last fiscal year.
Giardia CT Percent AchievementWare Disinfection Facility
0
200
400
600
800
1000
1200
Jan-08 Feb-08 Mar-08
% C
T Ac
hiev
ed
Regulatory Minimum Standard
Cryptosporidium InactivationCarroll Water Treatment Plant
Performance Ratio Overall Target >1
0.0
1.0
2.0
3.0
4.0
Mar-07 Jun-07 Sep-07 Dec-07 Mar-08
MWRA Operating Goal
Cryptosporidium InactivationCarroll Water Treatment Plant
Performance Ratio Overall Target >1
0.0
1.0
2.0
3.0
4.0
Jan-08 Feb-08 Mar-08
MWRA Operating Goal
Treated Water – Disinfection Effectiveness3rd Quarter - FY08
Background
With the activation of the Carroll Water Treatment Plant (CWTP), MWRA now reports on both regulatory required 99.9% inactivation for Giardia, and its voluntary operating goal of 99% inactivation for Cryptosporidium. MWRA calculates hourly CT inactivation rates and reports daily CT inactivation rates at maximum flow, as specified by EPA regulations. The concentration (C) of the disinfectant over time (T) yields a measure of the effectiveness of disinfection. CT achievement for Giardia assures CT achievement for viruses, which have a lower CT requirement. The required CT for ozonated water varies with water temperature.
Wachusett Reservoir – MetroWest/Metro Boston Supply:To avoid confusion with the regulatory requirements, inactivation of Cryptosporidium is reported as Performance Ratio (PR). A PR of 1 demonstrates inactivation of 99% of Cryptosporidium based on site-specific data. PR was maintained above 1 at all times the plant was providing water into the distribution system. CT calculation for Giardia is conservative; subsequently, more inactivation occurs than is being reported. Compliance with the Giardia standard is expressed as percent of required CT achieved; 100% is the minimum allowed.
Train B was shut down on January 9, 2008 for winter maintenance. On February 11, Train B was refilled and disinfected following American Water Works Association standards. Water Quality samples taken on February 18 and 19 were absent of total coliform. Train B was placed back in service on February 20. All scheduled plant maintenance was successfully completed.
Giardia CT was met each day this quarter. Ozone dose at the CWTP varied between 2.3 to 3.6 mg/L for the quarter.
Giardia CT Percent AchievementCarroll Water Treatment Plant
0
200
400
600
800
1000
1200
Mar-07 Jul-07 Nov-07 Mar-08
% C
T Ac
hiev
ed
Regulatory Minimum Standard
Giardia CT Percent AchievementCarroll Water Treatment Plant
0
200
400
600
800
1000
1200
Jan-08 Feb-08 Mar-08
% C
T Ac
hiev
ed
Regulatory Minimum Standard

Treated Water – pH and Alkalinity Compliance3rd Quarter - FY08
MWRA adjusts the alkalinity and pH of Wachusett water to reduce its corrosivity, which minimizes the leaching of lead and copper from service lines and home plumbing systems into the water. MWRA’s target for distribution system pH is 9.3; the target for alkalinity is 40 mg/l. Per DEP requirements, samples from the CWTP Fin B tap have a minimum compliance level of 8.9 for pH and 37 mg/L for alkalinity. Samples from 27 distribution system taps have a minimum compliance level of 8.8 for pH and 37 mg/L for alkalinity. For no more than nine days in a six-month period may results be below these levels. Quality Assurance staff and Operators test pH and alkalinity daily at the CWTP Fin B tap. Distribution system samples are collected in March, June, September, and December.
Distribution system samples were collected on March 25, 2008; sample pH ranged from 9.4 to 9.7 and alkalinity ranged from 41 to 43 mg/L. No sample results were below DEP limits for this quarter.
Alkalinity at CWTP Fin BAverage of Operator and QA Grab Samples
34
37
40
43
46
Jan/08 Mar/08 May/08 Jul/08 Sep/08 Nov/08
mg/
L
Minimum Compliance Level (37 mg/L)
pH Daily Average at CWTP Fin BAverage of On-line and Grab Sample Results
8.7
8.9
9.1
9.3
9.5
9.7
9.9
Jan/08 Mar/08 May/08 Jul/08 Sep/08 Nov/08
pH H
Minimum Compliance Level
Drinking Water Quality Customer Complaints: Taste, Odor, or Appearance
BackgroundMWRA collects information on water quality complaints that typically fall into four categories: 1.) discoloration due to MWRA or local pipeline work; 2.) taste and odor due to algae blooms in reservoirs or chlorine in the water; 3.) white water caused by changes in pressure or temperature that traps air bubbles in the water; or 4.) “other” complaints including no water, clogged filters or other issues. When nuisance algae bloom, such as Synura or Anabaena, MWRA treats the reservoirs with copper sulfate, an algaecide.
MWRA routinely contacts communities to classify and tabulate water complaints from customers. This count, reflecting only telephone calls to towns, probably captures only a fraction of the total number of customer complaints. Field Operations staff have improved data collection and reporting by keeping track of more kinds of complaints, tracking complaints to street addresses and circulating results internally on a daily basis.
OutcomeCommunities reported 28 complaints during the 3rd Quarter. Of these 28, 12 were for “discolored water” - two of these were “white water” complaints; 11 were for “taste and odor”; and five were ”other” complaints, including four for “no service” .
FY2008Last yearFY2007
FY2006
Water Quality Complaints
0
25
50
75
100
Mar/07 May/07 Jul/07 Sep/07 Nov/07 Jan/08 Mar/08
# of
Com
plai
nts
DiscoloredTaste & OdorWhite WaterOther
Trends in Water Quality ComplaintsFY06 - FY2008
0100200300400500600
Jul
AugSep Oct
Nov Dec Jan
FebMar
AprMay
Jun
# of
Com
plai
nts Last year
FY2007
FY2006
FY2008

Bacteria & Chlorine Residual Results for Communities in MWRA Testing Program3rd Quarter - FY08
While all communities collect bacteria samples for the Total Coliform Rule (TCR), 38 systems (including Deer Island and Westboro State Hospital) use MWRA’s Laboratory for TCR compliance testing. These systems collect samples for bacteriological analysis and measure water temperature and chlorine residual at the time of collection. The other 10 MWRA customer communities (including Lynn’s GE plant) have their samples tested elsewhere and these towns should be contacted directly for their monthly results.
There are 140 sampling locations for which MWRA is required to report TCR results. These locations include a subset of the community TCR locations, as well as sites along MWRA’s transmission system, water storage tanks and pumping stations.
The TCR requires that no more than 5% of all samples may be total coliform positive in a month (or that no more than one sample be positive when less than 40 samples are collected each month). Public notification is required if this standard is exceeded.
Escherichia coli (E.coli) is a specific coliform species that is almost always present in fecal material and whose presence indicates likely bacterial contamination of fecal origin. If E. coli are detected in a drinking water sample, this is considered evidence of a critical public health concern. Additional testing is conducted immediately and joint corrective action by DEP, MWRA, and the community is undertaken. Public notification is required if follow-up tests confirm the presence of E. coli or total coliform. MWRA considers a disinfectant residual of 0.2 mg/L a minimum target level at all points in the distribution system.
HighlightsIn the 3rd Quarter, none of the 5,069 community samples (0.0% system-wide) submitted to MWRA labs for analysis tested positive for coliform. None of 2,098 (0.0%) MWRA samples tested positive for total coliform. No sample tested positive for E.coli. All 39 systems that submitted chlorine residual data maintained an average disinfectant residual of at least 0.2 mg/L. Only 1.7% of the system samples had a disinfectant residual lower than 0.2 mg/L for the quarter.
Town Samples Tested for Coliform (a)
Total Coliform # (%) Positive
E.coli % Positive
Public Notification Required?
Minimum Chlorine Residual (mg/L)
Average Chlorine Residual (mg/L)
ARLINGTON 178 0 (0%) 0.0% 0.90 1.74BELMONT 112 0 (0%) 0.0% 1.04 1.84BOSTON 742 0 (0%) 0.0% 0.00 1.96BROOKLINE 221 0 (0%) 0.0% 1.01 1.96CHELSEA 130 0 (0%) 0.0% 0.09 1.47DEER ISLAND 52 0 (0%) 0.0% 0.98 1.86EVERETT 130 0 (0%) 0.0% 0.11 1.09FRAMINGHAM 216 0 (0%) 0.0% 0.30 1.84LEXINGTON 117 0 (0%) 0.0% 1.32 2.27LYNNFIELD 18 0 (0%) 0.0% 0.50 1.34MALDEN 210 0 (0%) 0.0% 1.16 1.25MARBLEHEAD 72 0 (0%) 0.0% 0.43 1.71MARLBOROUGH (b) 156 0 (0%) 0.0% 1.20 1.94MEDFORD 221 0 (0%) 0.0% 0.62 1.87MELROSE 126 0 (0%) 0.0% 0.02 1.04MILTON 97 0 (0%) 0.0% 1.25 1.67NAHANT 30 0 (0%) 0.0% 0.08 1.34NEEDHAM (b) 122 0 (0%) 0.0% 0.05 0.49NEWTON 276 0 (0%) 0.0% 0.55 1.98NORTHBOROUGH 48 0 (0%) 0.0% 0.12 1.52NORWOOD 117 0 (0%) 0.0% 0.43 1.63QUINCY 299 0 (0%) 0.0% 0.58 1.89READING 130 0 (0%) 0.0% 1.34 1.82REVERE 170 0 (0%) 0.0% 1.00 1.86SAUGUS 104 0 (0%) 0.0% 1.47 1.86SOMERVILLE 260 0 (0%) 0.0% 0.60 2.29SOUTH HADLEY FD1 (c) 48 0 (0%) 0.0% 0.04 0.43SOUTHBOROUGH 30 0 (0%) 0.0% 0.18 1.30STONEHAM 91 0 (0%) 0.0% 0.10 1.66SWAMPSCOTT 54 0 (0%) 0.0% 0.70 1.72WAKEFIELD (b) 143 0 (0%) 0.0% 0.32 1.43WALTHAM 216 0 (0%) 0.0% 0.22 1.84WATERTOWN 130 0 (0%) 0.0% 0.57 1.70WELLESLEY (b) 108 0 (0%) 0.0% 0.08 0.59WESTBORO HOSPITAL 15 0 (0%) 0.0% 1.13 1.66WESTON 48 0 (0%) 0.0% 0.77 1.70WINCHESTER (b) 65 0 (0%) 0.0% 0.15 0.89WINTHROP 72 0 (0%) 0.0% 0.20 1.60WOBURN (b) 195 0 (0%) 0.0% 0.07 0.84Total: 5569 0 (0%)
MASS. WATER RESOURCES AUTHORITY (d) 2098 0 (0%) 0.0% 0.1 1.79(a) The number of samples collected depends on the population served and the number of repeat samples required.(b) These communities are partially supplied, and may mix their chlorinated supply with MWRA chloraminated supply.(c) Part of the Chicopee Valley Aqueduct System. Free chlorine system.
TCR results by Community
(d) MWRA sampling program includes a subset of community TCR sites as well as sites along the transmission system, tanks and pumping stations. Some MWRA TCR sites which are entry points to the community had low chlorine residuals due to various reasons.

Treated Water Quality: Disinfection By-Product (DBP) Levels in Communities 3rd Quarter - FY08
Background
Total Trihalomethanes (TTHMs) are by-products of disinfection treatment with chlorine. Chlorination levels, the presence of organic precursors (measured by UV absorbance), pH levels, the contact time of water with chemicals used for disinfection, and temperature, all affect TTHM levels. TTHMs are of concern due to their potential adverse health effects at high levels. EPA’s running annual average (RAA) standard is 80 ug/L. Haloacetic Acids (HAAs) are also regulated (RAA is 60 ug/L) but compliance is not of significant concern for MWRA’s system (data not shown). The switch from chlorine to ozone for primary disinfection and the consolidation of treatment has lowered DBP formation and made results more uniform. DEP has approved consolidating MetroWest/ Metropolitan Boston programs since MWRA now provides fully treated water to both. This change was implemented in July 2005. DEP requires that compliance samples be collected quarterly. MWRA samples more frequently at some locations. Partially served communities are responsible for their own compliance monitoring and reporting and must be contacted directly for their results.
Absorbance, measured as UV-254, is a surrogate measure of reactive organic matter. Regulated DBPs have dropped to very low levels with the CWTP coming on-line. However, UV-254 levels remain useful for estimating ozone dosage and serving as a trigger for Quabbin transfer consideration.
Bromate is tested monthly per DEP requirements for water systems that treat the water with ozone. Bromide in the raw water may be converted into bromate following ozonation. EPA’s RAA MCL standard for bromate is 10 ug/L. The current RAA for Bromate = 0.0 ug/L.
Outcome
The running annual average for TTHMs at compliance locations (represented as the line in the top two graphs below) remained below current standards. TTHM levels at all sampling locations for the MetroWest/Metropolitan Boston communities have declined dramatically since August 2005 following activation of the CWTP, which uses ozone rather than chlorine for primary disinfection. The RAA for TTHMs = 3.3 ug/L. CVA’s TTHM levels are also below current standards. Haloacetic acid (HAA) levels are below regulatory standards. UV-254 levels are currently around 0.06 A/cm.
MWRA TTHM Compliance ProgramMetroWest/Metropolitan Boston
0102030405060708090
Q1-06 Q2-06 Q3-06 Q4-06 Q1-07 Q2-07 Q3-07 Q4-07 Q1-08
Aver
age
(ug/
L)
Qtrly TTHM Avg Running Annual Avg
RAA MCL
TTHM Running Annual AveragesAt Compliance Locations For CVA
0
20
40
60
80
100
120
Q1-06 Q2-06 Q3-06 Q4-06 Q1-07 Q2-07 Q3-07 Q4-07 Q1-08
Aver
age
(ug/
L)
Chicopee S.Hadley Wilbraham
RAA MCL
UV 254Wachusett Reservoir Source Water
Grab Data
0.02
0.04
0.06
0.08
0.10
0.12
Mar-07 Jun-07 Sep-07 Dec-07 Mar-08
A/c
m

System Withdrawals
150
200
250
300
350
31-Mar-07 30-Jun-07 30-Sep-07 31-Dec-07 31-Mar-08Monthly Avg Safe Yield10 Year Monthly Avg
Water Supply and Source Water Management3rd Quarter - FY08
BackgroundA reliable supply of water in MWRA’s reservoirs depends on adequate precipitation during the year and seasonal hydrologic inputs from watersheds that surround the reservoirs. Demand for water typically increases with higher summer temperatures and then decreases as temperatures decline. Quabbin Reservoir was designed to effectively supply water to the service areas under a range of climatic conditions and has the ability to endure a range of fluctuations. Wachusett Reservoir serves as a terminal reservoir to meet the daily demands of the Greater Boston area. A key component to this reservoir's operation is the seasonal transfer of Quabbin Reservoir water to enhance water quality during high demand periods. On an annual basis, Quabbin Reservoir accounts for nearly 50% of the water supplied to Greater Boston. The water quality of both reservoirs (as well as the Ware River, which is also part of the System Safe Yield) depend up on implementation of DCR's DEP-approved Watershed Protection Plans.
OutcomeQuabbin Reservoir was at 97.9% of capacity as of March 31, 2008. This is an increase of 5.60 feet since January 1, 2008. This represents an increase of more than 42 billion gallons in storage and an increase of more than 10% in reservoir capacity. The reservoir level is above the normal operating range for this period of the year. The Wachusett Reservoir elevation rose to 393.85 feet by March 31, which has caused a delay in the completion of the crest gate project. The reservoir elevation will be returned to the normal operating band of 390-391.5 feet after the completion of this project.
Monthly Precipitation
0
2
4
6
8
10
12
Mar May Jul Sep Nov Jan-08 MarActual Long-Term Average
System Yield
0
200
400
600
800
1000
1200
1400
Mar May Jul Sep Nov Jan-08 Mar
Monthly Yield Long-Term Average
Quabbin Reservoir Levels With Drought Emergency Planning Stages
0.0
20.0
40.0
60.0
80.0
100.0
Jan/0
0
Aug/00
Mar/01
Oct/01
May/02
Dec/02
Jul/0
3
Feb/04
Sep/04
Apr/05
Nov/05
Jun/0
6
Jan/0
7
Aug/07
Mar/08
Per
cent
Ful
l
Normal
Below Normal
Drought Emergency Stage 3
Drought Emergency Stage 2
Drought Emergency Stage 1
Warning
Water Transfers
0
50100
150200
250300
350400
450
Mar/07 May/07 Jul/07 Sep/07 Nov/07 Jan/08 Mar/08
MG
D
Ware to Quabbin Quabbin to Wachusett
River Releases
0
100
200
300
400
500
600
700
800
900
1000
Mar/07 May/07 Jul/07 Sep/07 Nov/07 Jan/08 Mar/08
MG
D
Swift River Release Nashua River Release

WASTEWATER QUALITY

NPDES Permit Compliance: Deer Island Treatment Plant
NPDES Permit Limits3rd Quarter - FY08
March
Febru
ary
JanuaryEffluent Characteristics Units Limits
3rd Quarter FY08 YTDViolations
Dry Day Flow: mgd 297.7 303.1 308.9 0cBOD: Monthly Average mg/L 6.1 8.6 7.3 0 Weekly Average mg/L 7.3 12.0 9.9 0TSS: Monthly Average mg/L 8.1 18.8 16.9 0 Weekly Average mg/L 9.2 27.0 29.5 0TCR: Monthly Average ug/L 40 41 40 0
Daily Maximum ug/L 40 80 40 0Fecal Coliform: Daily Geometric Mean col/100mL 7.2 501.3 164.6 0
Weekly Geometric Mean col/100mL 10.1 17.4 53.4 0% of Samples >14000 % 0 0 0 0Consecutive Samples >14000 # 0 0 0 0
pH: SU 6.2-6.6 6.0-6.7 6.0-6.9 0PCB, Aroclors: Monthly Average ug/L 0Acute Toxicity: Mysid Shrimp % >100 >100 >100 0
Inland Silverside % >100 >100 >100 0Chronic Toxicity: Sea Urchin % 25 50 50 0
Inland Silverside % 100 100 100 0
1.5
0
0
000
0000
43625
March
Febru
ary
January
0
0
403045456
00
UNDETECTED
50
6311400014000
50
6.0-9.03
0.0000450
00
Effluent Characteristics Units Limits Violations
1.5
0
10
The acute toxicity test simulates the short-term toxic effects of chemicals in wastewater effluent on marine animals. The test measures the concentration (percent) of effluent that kills half the test organisms within four days. The higher the concentration of effluent required, the less toxic the effluent. For permit compliance, the effluent concentration that causes mortality to mysid shrimp and inland silverside must be at least 50%. Acute toxicity permit limits were met for the 3rd Quarter for both the inland silverside and mysid shrimp.
Typically, effects of chronic exposures differ from those of acute exposures. Because of this, chronic toxicity responses are not necessarily related to acute toxicity. The chronic toxicity test simulates the long-term toxic effects of chemicals in wastewater effluent on marine animals. To meet permit limits, 1.5% effluent concentration must show no observed effect on the growth and reproduction of the test species. Chronic toxicity permit limits were met for the 3rd Quarter for both the inland silverside and sea urchin.
pH
5.0
6.0
7.0
8.0
9.0
J A S O N D J F M A M J
pH
Maximum Daily Limit (9.0)Minimum Daily Limit (6.0)
Organic Compound Loadings
0
10
20
30
40
50
J A S O N D J F M A M J
Load
ing
(lbs/
day)
VOA PCB Pesticides 2-YR Avg
pH is a measure of the alkalinity or acidity of the effluent. Fluctuations in pH do not have an adverse effect on marine environments. Because of the pure oxygen used in the activated sludge reactor, the effluent pH tend to be at the lower pH range. pH measurements for the 3rd Quarter were within the daily limits.
An important wastewater component to be monitored in the effluent is organic compounds, including volatile organic acids, pesticides, and polychlorinated biphenyls.
Acute Toxicity
0102030405060708090
100
J A S O N D J F M A M J
Effl
uent
con
cent
ratio
n (%
)
Inland SilversideMysid ShrimpMonthly Avg Minimum Limit (50%)
Chronic Toxicity
0
20
40
60
80
100
J A S O N D J F M A M J
Effl
uent
con
cent
ratio
n (%
)
Inland SilversideSea UrchinMonthly Avg Minimum Limit (1.5%)
There have been no permit violations at the Deer Island Treatment Plant to date in Fiscal Year 2008.
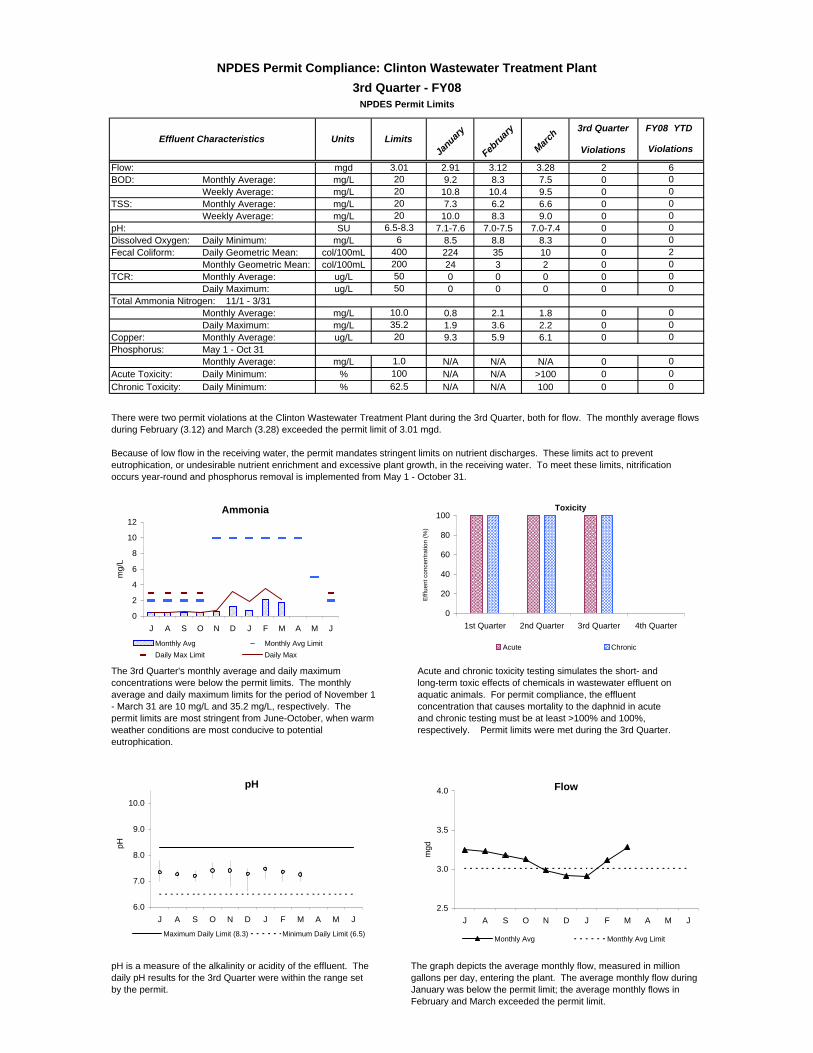
3rd Quarter FY08 YTD
Violations
Flow: mgd 2.91 3.12 3.28 2BOD: Monthly Average: mg/L 9.2 8.3 7.5 0 Weekly Average: mg/L 10.8 10.4 9.5 0TSS: Monthly Average: mg/L 7.3 6.2 6.6 0 Weekly Average: mg/L 10.0 8.3 9.0 0pH: SU 7.1-7.6 7.0-7.5 7.0-7.4 0Dissolved Oxygen: Daily Minimum: mg/L 8.5 8.8 8.3 0Fecal Coliform: Daily Geometric Mean: col/100mL 224 35 10 0
Monthly Geometric Mean: col/100mL 24 3 2 0TCR: Monthly Average: ug/L 0 0 0 0
Daily Maximum: ug/L 0 0 0 0Total Ammonia Nitrogen: 11/1 - 3/31
Monthly Average: mg/L 0.8 2.1 1.8 0Daily Maximum: mg/L 1.9 3.6 2.2 0
Copper: Monthly Average: ug/L 9.3 5.9 6.1 0Phosphorus: May 1 - Oct 31
Monthly Average: mg/L N/A N/A N/A 0Acute Toxicity: Daily Minimum: % N/A N/A >100 0Chronic Toxicity: Daily Minimum: % N/A N/A 100 0
January
February
March
NPDES Permit Compliance: Clinton Wastewater Treatment Plant
NPDES Permit Limits3rd Quarter - FY08
0
3.0120
6400
0
1.0
10.0
10062.5
200
035.220
0
00
00
0
0000
202020
6.5-8.3
6
5050
Effluent Characteristics Units LimitsViolations
02
0
There were two permit violations at the Clinton Wastewater Treatment Plant during the 3rd Quarter, both for flow. The monthly average flows during February (3.12) and March (3.28) exceeded the permit limit of 3.01 mgd.
Because of low flow in the receiving water, the permit mandates stringent limits on nutrient discharges. These limits act to prevent eutrophication, or undesirable nutrient enrichment and excessive plant growth, in the receiving water. To meet these limits, nitrification occurs year-round and phosphorus removal is implemented from May 1 - October 31.
Acute and chronic toxicity testing simulates the short- and long-term toxic effects of chemicals in wastewater effluent on aquatic animals. For permit compliance, the effluent concentration that causes mortality to the daphnid in acute and chronic testing must be at least >100% and 100%, respectively. Permit limits were met during the 3rd Quarter.
The 3rd Quarter's monthly average and daily maximum concentrations were below the permit limits. The monthly average and daily maximum limits for the period of November 1 - March 31 are 10 mg/L and 35.2 mg/L, respectively. The permit limits are most stringent from June-October, when warm weather conditions are most conducive to potential eutrophication.
pH
6.0
7.0
8.0
9.0
10.0
J A S O N D J F M A M J
pH
Maximum Daily Limit (8.3) Minimum Daily Limit (6.5)
Flow
2.5
3.0
3.5
4.0
J A S O N D J F M A M J
mgd
Monthly Avg Monthly Avg Limit
pH is a measure of the alkalinity or acidity of the effluent. The daily pH results for the 3rd Quarter were within the range set by the permit.
The graph depicts the average monthly flow, measured in million gallons per day, entering the plant. The average monthly flow during January was below the permit limit; the average monthly flows in February and March exceeded the permit limit.
Toxicity
0
20
40
60
80
100
1st Quarter 2nd Quarter 3rd Quarter 4th Quarter
Effl
uent
con
cent
ratio
n (%
)
Acute Chronic
Ammonia
0
2
4
6
8
10
12
J A S O N D J F M A M J
mg/
L
Monthly Avg Monthly Avg LimitDaily Max Limit Daily Max

COMMUNITY FLOWS

MGD Jan Feb Mar Apr May Jun Jul Aug Sep Oct Nov Dec AverageCY2006 158.305 158.563 159.814 161.991 166.013 175.903 189.446 189.942 175.866 165.227 156.078 150.623 167.385CY2007 155.061 161.227 158.519 157.376 171.642 185.297 190.539 195.762 190.260 169.111 153.066 150.887 169.949CY2008 153.011 152.183 149.899 0.000 0.000 0.000 0.000 0.000 0.000 0.000 0.000 0.000 151.687
MG Jan Feb Mar Apr May Jun Jul Aug Sep Oct Nov Dec TotalCY2006 4,907.441 4,439.761 4,954.227 4,859.730 5,146.393 5,277.092 5,872.840 5,888.199 5,275.991 5,122.038 4,682.351 4,669.320 61,095.384CY2007 4,806.893 4,514.365 4,914.084 4,721.268 5,320.891 5,558.920 5,906.704 6,068.612 5,707.813 5,242.433 4,591.980 4,677.497 62,031.459CY2008 4,743.336 4,413.302 4,646.877 0.000 0.000 0.000 0.000 0.000 0.000 0.000 0.000 0.000 13,803.516
Total Water Use: MWRA Core Customer Communities
Total Water Use: MWRA Core CustomersArlington, Belmont, BWSC, Brookline, Chelsea, Everett, Framingham, Lexington, Malden, Medford, Melrose, Milton, Newton,
Norwood, Quincy, Reading*, Revere, Somerville, Stoneham, Waltham, Watertown, Winthrop
140
150
160
170
180
190
200
210
Jan Feb Mar Apr May Jun Jul Aug Sep Oct Nov Dec
MG
D
CY2006 CY2007 CY2008*Full service began in 2007

2 MWRA's wastewater metering system replacement began in March 2004 and was completed in March 2005. Therefore, wastewater flows for each month during this period are an average of the three prior years. Flow data is preliminary and subject to change pending additional MWRA and community review.
4 Based on CY2006 to CY2008 average wastewater flows as of 05/08/08.
How CY2008 Community Wastewater Flows Through Two Months Could Effect FY2010 Sewer Assessments 1,2,4
1 MWRA uses a 3-year moving flow average to calculate sewer assessments. Three-year averaging smoothes the impact of year-to-year changes in community flow share, but does not eliminate the long-term impact of changes in each community's relative contribution to the total flow.
Changes in flow shares are only a part of the assessment calculation as illustrated by the estimated impact of flow share
changes on FY2010 sewer assessments.
But as MWRA's sewer assessments are a ZERO-SUM calculation, a community's assessment is strongly influenced by the
RELATIVE change in CY2006 to CY2008 flow share compared to CY2005 to CY2007 flow share, compared to all other communities
in the system.
FY2010 sewer assessments will use a 3-year average of CY2006 to CY2008 wastewater flows compared to PFY2009 assessments that
used a 3-year average of CY2005 to CY2007 wastewater flows.
3 Add this figure to the projected FY2010 system-wide average sewer rate increase of 8.8% (February 2008) to estimate each communitiy's FY2010 sewer assessment change from FY2009.
Change in community absolute flow
10.3%8.4%
7.6%17.6%
5.5%7.1%
14.1%10.9%
13.9%5.6%
14.4%2.2%
8.1%17.7%
14.7%2.6%
13.0%13.8%
13.0%21.4%
12.2%3.3%
7.3%21.3%
8.8%13.3%
12.9%18.6%
11.5%11.3%
15.1%10.2%
14.4%10.2%
13.3%14.0%
12.0%6.2%6.0%
4.1%12.7%
11.1%7.0%
-5.0% 0.0% 5.0% 10.0% 15.0% 20.0% 25.0%
Arlington
Ashland
Bedford
Belmont
Boston (BWSC)
Braintree
Brookline
Burlington
Cambridge
Canton
Chelsea
Dedham
Everett
Framingham
Hingham S.D.
Holbrook
Lexington
Malden
Medford
Melrose
Milton
Natick
Needham
Newton
Norwood
Quincy
Randolph
Reading
Revere
Somerville
Stoneham
Stoughton
Wakefield
Walpole
Waltham
Watertown
Wellesley
Westwood
Weymouth
Wilmington
Winchester
Winthrop
Woburn
Change in community flow share
-0.1%-1.8%
-2.5%6.5%
-4.4%-3.0%
3.4%0.5%
3.2%-4.3%
3.6%-7.4%
-2.0%6.6%
3.9%-7.0%
2.4%3.1%
2.4%10.0%
1.7%-6.4%
-2.8%9.9%
-1.4%2.7%
2.3%7.5%
1.0%0.9%
4.3%-0.1%
3.6%-0.1%
2.7%3.3%
1.5%-3.8%-3.9%
-5.7%2.1%
0.7%-3.1%
-15.0% -12.0% -9.0% -6.0% -3.0% 0.0% 3.0% 6.0% 9.0% 12.0%
Estimated variance from average system assessment as a result of flow share change 3
-0.0%
-0.8%
-1.7%
3.8%
-2.6%
-1.9%
2.1%
0.3%
2.0%
-2.7%
1.9%
-4.9%
-1.2%
3.3%
2.4%
-3.2%
1.5%
1.9%
1.4%
6.1%
1.0%
-3.0%
-1.7%
6.4%
-0.9%
1.6%
1.2%
4.2%
0.6%
0.5%
2.6%
-0.1%
2.3%
-0.1%
1.7%
1.8%
0.9%
-2.0%
-2.3%
-2.9%
1.1%
0.4%
-2.3%
-8.0% -6.0% -4.0% -2.0% 0.0% 2.0% 4.0% 6.0% 8.0%
Arlington
Ashland
Bedford
Belmont
Boston (BWSC)
Braintree
Brookline
Burlington
Cambridge
Canton
Chelsea
Dedham
Everett
Framingham
Hingham S.D.
Holbrook
Lexington
Malden
Medford
Melrose
Milton
Natick
Needham
Newton
Norwood
Quincy
Randolph
Reading
Revere
Somerville
Stoneham
Stoughton
Wakefield
Walpole
Waltham
Watertown
Wellesley
Westwood
Weymouth
Wilmington
Winchester
Winthrop
Woburn
System Change +10.4
Flow Impacts7/23/2008

BUSINESS SERVICES

Procurement: Purchasing and Contracts Third Quarter FY08
Background: Goal is to process 85% of Purchase Orders and 80% of Contracts within Target
timeframes.
Outcome: Processed 84% of purchase orders within target; Avg. Processing Time was 5.971 days vs. 5.25 days in Qtr 3 of FY07. Processed 68% (19 of 28) contracts within target timeframes; Avg. Processing Time was 138 days vs. 172 days in Qtr 3 of FY07.
Purchasing
Purchase Orders - Percent in Target
0
10
20
30
40
50
60
70
80
90
100
JAN FEB M ARCH
• Purchasing Unit processed 2292 purchase orders, 157 less than the 2449 processed in Qtr 3 of FY07, for a total value of $7,187,668 vs. a dollar value of $8,265,203 in Qtr 3 of FY07.
• The target was not achieved for the $0 - $500 category due to sourcing of additional vendors,
confirmation of pricing, and confirmation of vendor part numbers and item availability, and the $2k – $5k category due to price confirmation and delay in receiving paperwork from vendors.
Contracts, Change Orders and Amendments
• Procurement processed 28 contracts with a value of $35,501, 275 and 13 amendments with a value of
$559,461. • Nine contracts were not processed within target timeframes. Reasons include: significant changes to
specifications, procurement process review, superseding priorities and rebidding. Two contracts were executed within two weeks of target timeframe.
• Twenty-nine change orders were executed during the period, but several were large balancing change
orders at the end of jobs, and are recorded as credits or negative numbers. The dollar value of all non-credit change orders during the 3rd quarter FY08 was $1,171,641 and the value of credit change orders was ($100,995). The net dollar value of all change orders was $1,070,646.
• In addition, staff reviewed 92 proposed change orders and 44 draft change orders.
NO. TARGET PERCENT IN TARGET
$0 - $500 1036 4 DAYS 82.7%
$500 - $2K 775 7 DAYS 87.0%
$2K - $5K 248 10 DAYS 80.2%
$5K - $10K 92 25 DAYS 82.6%
$10K - $25K 90 30 DAYS 85.6%
$25K - $50K 31 60 DAYS 93.6%
OVER $50K 20 80 DAYS 95.0%

• Allows for the reduction of the value of inventory as items are surplused.
Items Base Value July-07
Current Value w/o Cumulative
New Adds
Reduction / Increase To
Base
Consumable Inventory Value 6,670,582 6,566,855 -103,727
Spare Parts 6,481,356 6,470,214 -11,142Inventory Value Total Inventory Value 13,151,938 13,037,169 -114,769
3rd Quarter, FY08Materials Management
Inventory Value - All SitesInventory goals focus on: Maintaining optimum levels of consumables and spare parts inventory Adding new items to inventory to meet changing business needs Reviewing consumables and spare parts for obsolescence Managing and controlling valuable equipment and tools via the Property Pass Program The FY08 goal is to reduce consumable inventory from the July '07 base level ($6.67million) by 2.0% (approximately $133,411), to $6.53 million by June 30, 2008 (see chart below).
Items added to inventory this quarter include:- Deer Island - relays, heaters, connectors, lamp modules, rotary assemblies, bearings, ball valves, nipples and exciter assemblies for Electrical, Maintenance, Plumbing and I&C.- Chelsea - digital displays and dust caps for Scada and Maintenance. - Southboro - rust remover, conduit, bleach and sodium thiosulfate for Operations.
Surplus efforts are ongoing with the Chelsea, Deer Island and Southboro warehouses for both spare parts andconsumables.
Property Pass Program: Over the past quarter numerous, obsolete items (including computers, monitors, printers, fax machines, copiers, and miscellaneous electronics) have been recycled through our established recycling vendor. Also, 32 tons of metal equipment.has been scrapped providing a monetary return of $5,162. Tool/equipment audits continue throughout Operations and surplusing efforts are ongoing.
The service level is the percentage of stockrequests filled. The goal is to maintain a servicelevel of 96%. Staff issued 11,135 (97.9%) of the11,350 items requested in Q3 from the inventorylocations for a total dollar value of $516,899.
Materials Service Level
84%
88%
92%
96%
100%
J A S O N D J F M A M J
Per
cent
Note: New adds are items added at an inventory location for the first time for the purpose of servicing a group/department to meettheir business needs/objectives.
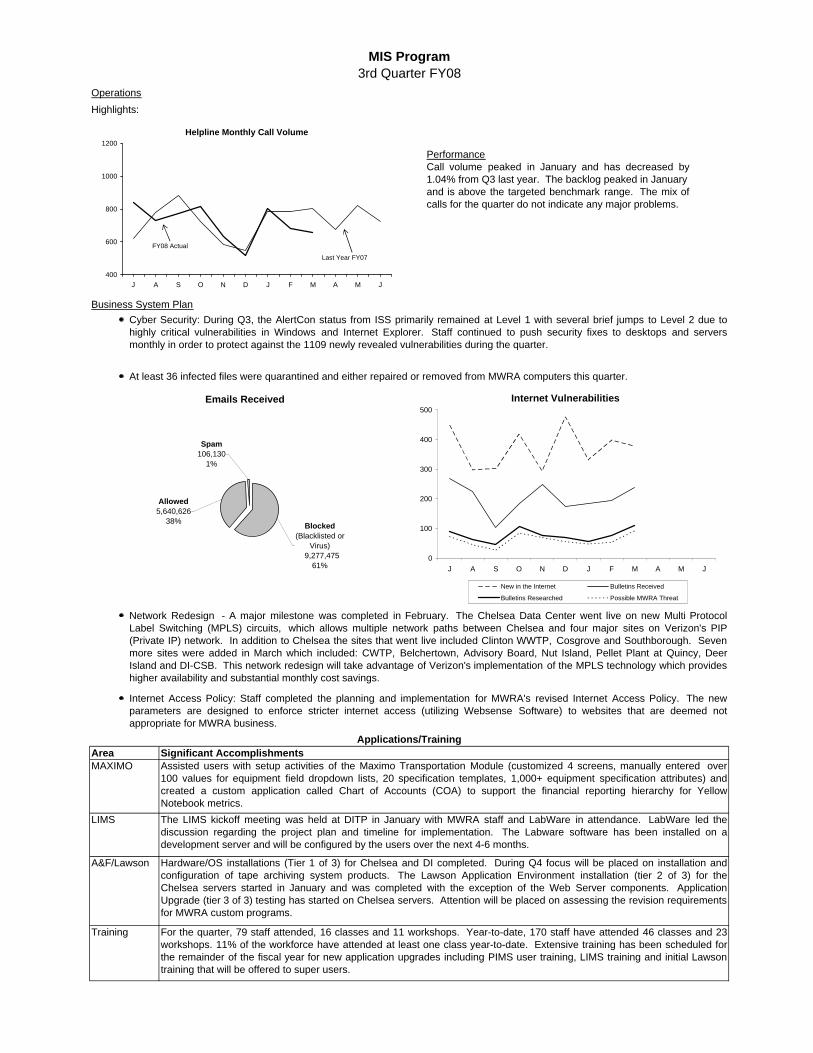
OperationsHighlights:
Business System Plan
Area
The LIMS kickoff meeting was held at DITP in January with MWRA staff and LabWare in attendance. LabWare led thediscussion regarding the project plan and timeline for implementation. The Labware software has been installed on adevelopment server and will be configured by the users over the next 4-6 months.
LIMS
MIS Program3rd Quarter FY08
Cyber Security: During Q3, the AlertCon status from ISS primarily remained at Level 1 with several brief jumps to Level 2 due tohighly critical vulnerabilities in Windows and Internet Explorer. Staff continued to push security fixes to desktops and serversmonthly in order to protect against the 1109 newly revealed vulnerabilities during the quarter.
PerformanceCall volume peaked in January and has decreased by1.04% from Q3 last year. The backlog peaked in January and is above the targeted benchmark range. The mix ofcalls for the quarter do not indicate any major problems.
At least 36 infected files were quarantined and either repaired or removed from MWRA computers this quarter.
Significant Accomplishments
Network Redesign - A major milestone was completed in February. The Chelsea Data Center went live on new Multi ProtocolLabel Switching (MPLS) circuits, which allows multiple network paths between Chelsea and four major sites on Verizon's PIP(Private IP) network. In addition to Chelsea the sites that went live included Clinton WWTP, Cosgrove and Southborough. Sevenmore sites were added in March which included: CWTP, Belchertown, Advisory Board, Nut Island, Pellet Plant at Quincy, DeerIsland and DI-CSB. This network redesign will take advantage of Verizon's implementation of the MPLS technology which provideshigher availability and substantial monthly cost savings.
Training For the quarter, 79 staff attended, 16 classes and 11 workshops. Year-to-date, 170 staff have attended 46 classes and 23workshops. 11% of the workforce have attended at least one class year-to-date. Extensive training has been scheduled forthe remainder of the fiscal year for new application upgrades including PIMS user training, LIMS training and initial Lawsontraining that will be offered to super users.
Hardware/OS installations (Tier 1 of 3) for Chelsea and DI completed. During Q4 focus will be placed on installation andconfiguration of tape archiving system products. The Lawson Application Environment installation (tier 2 of 3) for theChelsea servers started in January and was completed with the exception of the Web Server components. ApplicationUpgrade (tier 3 of 3) testing has started on Chelsea servers. Attention will be placed on assessing the revision requirementsfor MWRA custom programs.
A&F/Lawson
Internet Access Policy: Staff completed the planning and implementation for MWRA's revised Internet Access Policy. The newparameters are designed to enforce stricter internet access (utilizing Websense Software) to websites that are deemed notappropriate for MWRA business.
Applications/Training
Assisted users with setup activities of the Maximo Transportation Module (customized 4 screens, manually entered over100 values for equipment field dropdown lists, 20 specification templates, 1,000+ equipment specification attributes) andcreated a custom application called Chart of Accounts (COA) to support the financial reporting hierarchy for YellowNotebook metrics.
MAXIMO
Helpline Monthly Call Volume
400
600
800
1000
1200
J A S O N D J F M A M J
FY08 Actual
Last Year FY07
Internet Vulnerabilities
0
100
200
300
400
500
J A S O N D J F M A M J
New in the Internet Bulletins Received
Bulletins Researched Possible MWRA Threat
Emails Received
Blocked (Blacklisted or
Virus) 9,277,475
61%
Spam106,130
1%
Allowed 5,640,626
38%

Legal Matters 3rd Quarter FY2008
PROJECT ASSISTANCE COURT AND ADMINISTRATIVE ORDERS
• Boston Harbor Litigation and CSO: Filed Quarterly CSO Progress Report and CSO Annual Report with the Court.
• NPDES: Reviewed and Revised draft proposals for Supplemental Environmental Projects and draft
Stipulation and Order related to blending enforcement action. Reviewed draft letter requesting that Deer Island Treatment Plant's inner harbor outfalls not be included in its next NPDES permit. Drafted letter requesting that EPA and DEP provide a copper limit, which is consistent with the Massachusetts Surface Water Quality Standards Regulations and the interim limit set forth in the Clinton Administrative Order, in Clinton Wastewater Treatment Plant's next NPDES permit. Drafted letter notifying EPA and DEP that the flow to DITP is likely to exceed DITP's secondary process limit of at least 700 MGD several days after rain events during extreme wet periods which include high groundwater and high river and stream conditions. Reviewed draft of letter notifying EPA and DEP of dry weather overflow at BOS013 due to break in MWRA's sewer pipe.
• Braintree Weymouth Consent Order: Submitted semi-annual report to DEP in accordance with the
Administrative Consent Order. Submitted letter to DEP indicating that MWRA completed the last milestone set forth in Braintree Weymouth Administrative Consent Order by commencing operation of the Braintree-Weymouth Replacement Pump Station on March 30, 2008.
• Administrative Order (Clinton Wastewater Treatment Plant): Drafted letter requesting that MWRA be
relieved of the annual copper optimization reporting requirement set forth in the Administrative Order. • Upper Neponset Valley Relief Sewer: Submitted January and February (final) progress summaries for
the Upper Neponset Valley Relief Sewer project to DEP.
REAL ESTATE AND CONTRACT
• North Dorchester Bay CSO: Met with staff and Massport concerning Massport application for payment of relocation and improvement costs under Conley Terminal MOU. Met with DCAM staff to review, revise and obtain permanent Grant of Easement from DCAM to BWSC.
• Telecommunications: Met with attorney for T-Mobile to finalize agreement for installation of telecom tower at Walnut Hill. Revised initial agreement with Metropcs for tower installation.
• Fore River Railroad Corporation: Continued negotiation with MBTA on concerning construction of
pedestrian crossing and drainage facilities at FRRC railroad easement. Met with staff concerning lease of new engine house.
• Section 97A, East Boston: Continued negotiation with MBTA on terms of construction license.
• East Boston Branch Sewer Relief: Reviewed titles to easement properties. Reviewed and revised
easement survey plans. Prepared license agreements with Boston Parks Department and Boston Public Schools. Prepared easement agreement with BWSC.
• Northern High Service Pipeline, Section 70: Relocation of Water Main, Shops at Saugus:
Finalized all plans, easement agreements and closing documentation. Attended closing and obtained recorded easement agreement between Shops at Saugus, MWRA and DCAM.

• Redmond Property, 425 Pearl Street, Braintree: Finalized Purchase and Sale Agreement. Prepared escrow agreement, release deed, waiver of right of first refusal, settlement statement. Reviewed closing documentation. Attended preliminary house inspection. Various conferences and correspondence with Town of Braintree concerning payment of taxes and future tax-exempt status. Conducted closing. Obtained title insurance. Reviewed environmental report.
• South Sudbury: Various conferences with DCR concerning preparation of TR-1 form for surplusing
South Sudbury property. Met with staff concerning survey of South Sudbury area, location of future easements, and preparation of easement plans.
• DCR Watershed Lands: Review of Burzenski, Mass. Audubon and Gabler properties.
• Advised on warranty and other contract matters for Operations Division and Procurement staff; met with
U.S. Attorney, Army Corps of Engineers and N-Star staff with regard to a possible resolution of the permit issue for the Deer Island Cross Harbor Cable; drafted a proposed Memorandum of Understanding with the state Plumbing Board; drafted a Community Assistance Release and Indemnity Agreement for use in community assistance projects; researched historic materials, reviewed relevant statutes and provided a memorandum regarding the obligation of the MWRTA to continue providing water to Lancaster Mills; met with representatives of the manufacturer of the Ozone Generators at the Carroll Treatment Plant to attempt resolution of certain warranty issues; engaged in discussions with opposing counsel concerning damage sustained to authority equipment and the liability therefore; provided support, including deposition transcript review, other miscellaneous document review, conferences with opposing and co-counsel, attendance and support at depositions, in the Seaver and Chappy litigations, and provided other support in the Unifirst litigation; reviewed legislation relative to act to protect the public trust and safeguard of ocean resources. reviewed draft of the federal legislation "Sewage Overflow Community Right-To-Know Act"; reviewed and approved 14 Section 8(m) permits. Recorded various Orders of Conditions, Orders of Taking, Certificates of Compliance, Extension permits at various Registries of Deeds for MWRA engineers and staff.
ENVIRONMENTAL
• Reviewed and analyzed with respect to impacts on the MWRA proposed amendments to two key environmental laws.
• Researched and responded to staff inquiries on various issues including retention of documents, legal
requirements for wetlands replication, product inventory requirements for underground storage tanks and interpretation of enabling act with respect to private water companies.
• Tracked developments in the Beede Superfund case to which the MWRA is a responsible party;
conferred with other parties on response strategies. • Initiated extensive review of documents related to contamination associated with Lynn water line project
in response to public records request.
LABOR, EMPLOYMENT AND ADMINISTRATIVE New Matters: Two demands for arbitration were filed. One Massachusetts Commission Against Discrimination (“MCAD”) charge was filed. One Equal Employment Opportunity Commission (“EEOC”) charge was filed. Matters Concluded: Received an arbitration decision in favor of the MWRA.

LITIGATION/TRAC New Matters: Two new cases were reported in the Third Quarter of FY 2008.
• Plymouth Rock Assurance Corp v. Keyspan, Inc. & MWRA: On February 11, 2008, Plymouth Rock Assurance Corporation filed a subrogation claim in Small Claims Court against both MWRA and Keyspan, seeking $2,618.15 for alleged damage to the insured’s car caused by a loose metal cover on a roadway construction site in Revere. On February 29, 2008, the Law Division moved to dismiss on the grounds that MWRA can only be sued in Superior Court. In addition, with assistance from Susan Brazil in Finance and Mark Johnson in Construction and Engineering, Law was able to document that the location of the accident was not an MWRA construction site. With that information, we persuaded the plaintiff’s attorney to voluntarily dismiss his claim against MWRA. The plaintiff filed its voluntary motion on March 10, 2008. On March 20, the Clerk of the Small Claims Court confirmed by telephone that the Court had dismissed MWRA from the case.
• RE: (Current Employee): United States Bankruptcy Court District of Rhode Island: The trustee of
Chapter 13 Plan of bankruptcy court notified MWRA of the Order relating to a current MWRA employee and her wage garnishment action in Bankruptcy court in Rhode Island. MWRA is to deduct a sum from employee’s monthly wages and forward the sum to Trustee until debt has been satisfied.”
Significant Developments: The Chappy Corp. v. MWRA, et al.: A Status Conference was held in this construction case on January 30, 2008. The case has been assigned for trial on May 9, 2008. Verizon New England v. MWRA and On-Target: This property damage claim arising out of damage to an un-marked telephone cable line which MWRA struck during scheduled valve replacement work has been scheduled for trial on May 16, 2008. MWRA has cross-claimed against On-Target for its failure to mark the location of Verizon's subsurface cable. Seaver Electric Company v. J.F. White Co., et al.: The deposition of plaintiff in this construction case began on January 31, 2008. Robert Knox v. MWRA, et al.: Trial of the automobile accident case has been scheduled for September 3, 2008. Chutehall Construction Co., Ltd. v. MWRA: On February 12, 2008, the Law Division filed its Appellee Brief in the Appeals Court, in response to Chutehall Construction’s appeal from a Superior Court decision upholding MWRA’s $10,000 penalty. Chutehall is attempting to challenge MWRA’s administrative enforcement process on constitutional grounds, and is also claiming that procedural errors were made in this particular case. The Law Division’s brief argues that Chutehall’s arguments have no merit, as found by the Superior Court. The Appeals Court will be scheduling this matter for oral argument in the near future. Concluded Cases: Two cases were reported closed during the Third Quarter of FY 2008. Plymouth Rock Assurance Co. a/s/o VanBuskirk v. MWRA and Keyspan: On February 11, 2008, Plymouth Rock Assurance Corporation filed a subrogation claim in Small Claims Court against both MWRA and Keyspan, seeking $2,618.15 for alleged damage to the insured’s car caused by a loose metal cover on a roadway construction site in Revere. On February 29, 2008, the Law Division moved to dismiss on the grounds that MWRA can only be sued in Superior Court. In addition, with assistance from Susan Brazil in Finance and Mark Johnson in Construction and Engineering, Law was able to document that the location of the accident was not an MWRA construction site. With that information, we persuaded the plaintiff’s attorney to voluntarily dismiss his claim against MWRA. The plaintiff filed its voluntary motion on March 10, 2008. On March 20, the Clerk of the Small Claims Court confirmed by telephone that the Court had dismissed MWRA from the case.

John Russo v. The Dow Co., Inc. & MWRA: In 2004, Russo filed suit against MWRA and its contractor, the Dow Company, for allegedly causing harm to, and failing to repair, a storm drain on Russo’s property in the course of construction of a water main on Ballard Street, Saugus, MA. MWRA sought to have Dow’s insurer, Charter Oak Insurance, defend MWRA in this matter, but Charter Oak refused on the grounds that Russo had no evidence that repairing his storm drain had anything to do with the water main construction project. MWRA and Dow sought summary judgment on the same grounds. MWRA also filed a Third-Party Complaint against Charter Oak. The Superior Court denied Summary Judgment on the grounds that Russo claimed the MWRA and Dow had caused damage when they offered to assist the Town of Saugus by sending a TV camera in the drain, and then by using a Vactor-Jet to clear debris out of the drain. MWRA subsequently discovered that in 2005, Russo filed a separate lawsuit against the Town of Saugus alleging nuisance and negligence. MWRA successfully moved to consolidate the two suits, and also filed a Third-Party Complaint against the Town of Saugus, alleging that Saugus had misinformed the MWRA and induced MWRA staff to attempt to Vactor-Jet a pipe that the town knew had already collapsed. Saugus attempted to enter into a separate settlement with Russo, and sought summary judgment on MWRA’s Third-Party Complaint on the grounds that its settlement with Russo would bar any contribution claim by the MWRA. MWRA successfully defeated that summary judgment motion as MWRA's claims were not sufficiently related to the claims which the Town had settled. Ultimately, the parties agreed to a global settlement, in which the Town, through its insurers, paid Russo $95,000. MWRA and Charter Oak each paid Russo $10,750. Subpoenas: During the Third Quarter of FY 2008, one subpoena was received and two subpoenas were pending at the end of Third Quarter FY 2008. Public Records: During the Third quarter of FY 2008, thirteen new public records requests were received and eight requests were closed at the end of Third Quarter FY 2008.
SUMMARY OF PENDING LITIGATION MATTERS
TYPE OF CASE/MATTER
As of Mar 2008
As of Dec 2007
As of Sep 2007
Construction/Contract/Bid Protest (other than BHP) 5 5 5 BHP Claims/Contract Cases 0 0 1 Tort/Labor/Employment 9 10 11 Environmental/Regulatory/Other 2 2 2 Eminent Domain/Real Estate 1 1 1 Total – All Defensive Cases 17 18 20
Affirmative Cases: MWRA v. (current employee)
1
1 1
Other Litigation matters (restraining orders, etc.) MWRA v. (former employee) MWRA v. (former employee)
2 2 2
Total – All Pending Lawsuits 20 21 23
Significant claims not in suit: CDM Walnut Hill
1 1 1
Bankruptcy 1 1 1 Wage Garnishment 6 5 5 TRAC Appeals 4 5 8 Subpoenas 2 5 3 Public Records Requests 13 4 18 TOTAL - ALL LITIGATION MATTERS 47 42 59

TRAC New Appeals No new appeals were received in the 3rd Quarter FY 2008. Pre-Hearings Held Two pre-hearings were held in the 3rd Quarter FY 2008.
• Offset Prep, Inc. 07-08
• Brigham & Women’s Hospital 07-09 Status Conference Held One status conference was held in 3rd Quarter FY 2008.
• Duralectra, Inc. 07-02 Joint Motion to Dismiss No cases were dismissed by Joint Motion to Dismiss in the 3rd FY 2008. Joint Stipulations of Dismissals No cases were dismissed by Joint Stipulation after fine was paid in the 3rd Quarter FY 2008.
Joint Stipulations of Dismissals – Claims Dismissed No cases were dismissed by Joint Stipulations of Dismissal, claims dismissed in the 3rd Quarter FY 2008. Hearings Held No hearings were held in the 3rd Quarter FY 2008. Settlement By Agreement of Parties One case was settled by Agreement of Parties in 3rd Quarter FY 2008.
• Orient Heights Chiropractic; 06-08 Tentative Decisions Issued No Tentative Decisions were issued in 3rd Quarter FY 2008. Final Decisions Issued No Final Decisions were issued during the 3rd Quarter FY 2008.

Internal & Contract Audit Program Third Quarter FY08
INTERNAL AUDIT PROGRAM Status of Internal Audit Recommendations Recommendations closed in 3rd Quarter: 8
Assignments with Recommendations Pending Implementation
Report Title (date)
Recommendations Pending Implementation
Closed Recommendations
Chemical Delivery Procedures (5/5/04) 1 4 Evaluating Consultant Performance (6/22/04) 1 1 Field Operations Maintenance Management Practices (9/16/05) 4 8 Accounts Payable Activities (10/11/05) 6 6 Controls Over Gasoline & Diesel Fuel (5/3/06) 1 15 Field Crew Practices (11/14/06) 1 8 Financial & Management Controls of the Fore River Railroad (3/1/07) 2 5 Fore River Pelletizing Plant contract S345 (11/19/07) 2 3
Total Recommendations 18 50 The Internal Audit Department follows up on open recommendations on continuous basis. All pending recommendations have target implementation dates. When a recommendation has not been acted on in 48 months the appropriateness of the recommendation is re-evaluated during a subsequent audit. National surveys of government organizations indicate that on average 82% of audit recommendations are completed. On closed assignments 92% of Internal Audit’s recommendations have been implemented. CONTRACT AUDIT PROGRAM Number of Reviews Completed and Cost Savings - FY03 to FY08
Description
FY04 FY05 FY06 FY07 FY08 3Q TOTAL
Consultant Reviews Cost Disclosure Statement Reviews
78 32 63 43 35 251
Preliminary Field Reviews
1 4 6 2 0 13
Incurred Cost Audits 9 9 12 10 7 47 Contractor Reviews Construction Labor Burden Reviews
13 10 8 8
11 50
Change Order/Claim Audits
4 0 0 0 1 5
Contractor Financial Reviews
3 4 0 2 4 13
Cost Savings Consultant Cost Savings
$779,945 $483,968 $768,394 $358,341 $19,230 $2,409,878
Contractor/Vendor Cost Savings
$900,721 $1,551,139 $456,968 $637,378 $1,975,265 $5,521,471
Internal Audits $183,840 $183,840Total Cost Savings $1,680,666 $2,035,107 $1,225,362 $1,179,559 $1,994,495 $8,115,189
The Internal Audit Department’s target is to achieve at least $1 million in cost savings each year. Cost savings vary each year based upon many factors. In some cases, cost savings for one year may be the result of work in prior years. Commencing in FY07 cost savings will include the dollar impact, if measurable, of internal assignments.

OTHER MANAGEMENT
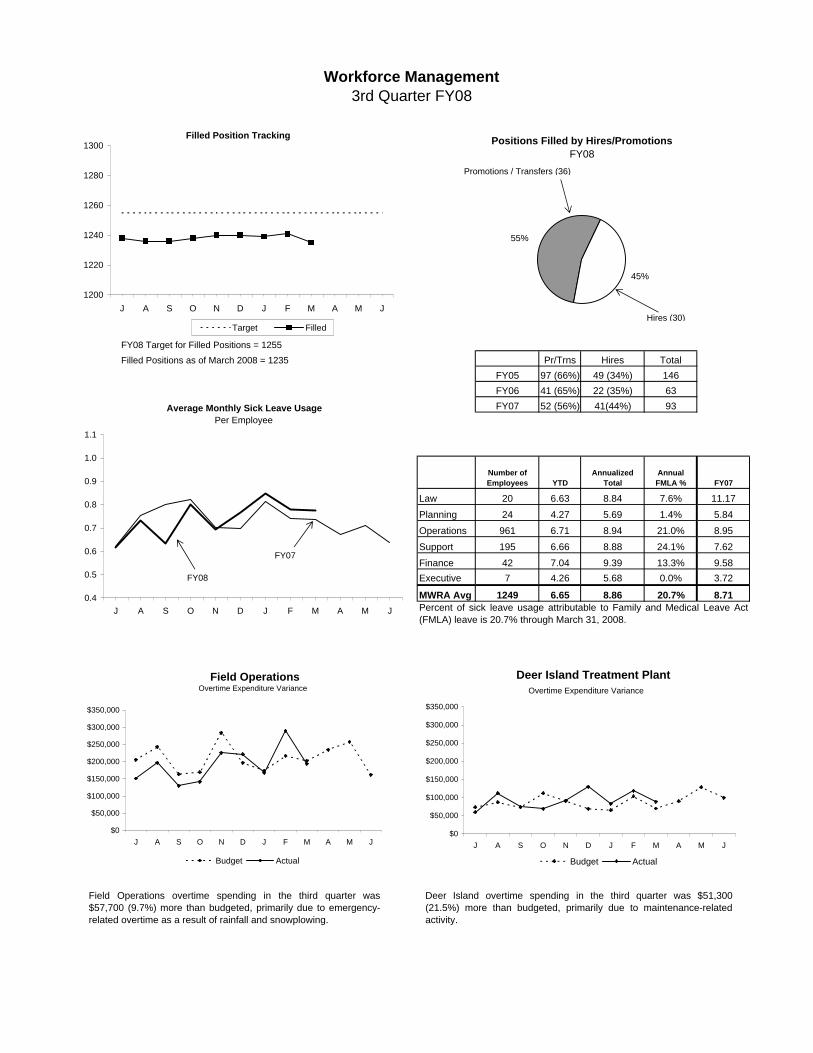
Pr/Trns Hires TotalFY05 97 (66%) 49 (34%) 146FY06 41 (65%) 22 (35%) 63FY07 52 (56%) 41(44%) 93
YTD FY07
Law 20 6.63 8.84 7.6% 11.17Planning 24 4.27 5.69 1.4% 5.84Operations 961 6.71 8.94 21.0% 8.95Support 195 6.66 8.88 24.1% 7.62Finance 42 7.04 9.39 13.3% 9.58Executive 7 4.26 5.68 0.0% 3.72
MWRA Avg 1249 6.65 8.86 20.7% 8.71
Workforce Management3rd Quarter FY08
FY08 Target for Filled Positions = 1255Filled Positions as of March 2008 = 1235
Percent of sick leave usage attributable to Family and Medical Leave Act(FMLA) leave is 20.7% through March 31, 2008.
Number of Employees
Annualized Total
Annual FMLA %
Positions Filled by Hires/PromotionsFY08
45%
55%
Promotions / Transfers (36)
Hires (30)
Average Monthly Sick Leave UsagePer Employee
0.4
0.5
0.6
0.7
0.8
0.9
1.0
1.1
J A S O N D J F M A M J
FY07
FY08
Filled Position Tracking
1200
1220
1240
1260
1280
1300
J A S O N D J F M A M J
Target Filled
Field Operations
$0
$50,000
$100,000
$150,000
$200,000
$250,000
$300,000
$350,000
J A S O N D J F M A M J
Overtime Expenditure Variance
Budget Actual
Deer Island Treatment Plant
$0
$50,000
$100,000
$150,000
$200,000
$250,000
$300,000
$350,000
J A S O N D J F M A M J
Overtime Expenditure Variance
Budget Actual
Field Operations overtime spending in the third quarter was$57,700 (9.7%) more than budgeted, primarily due to emergency-related overtime as a result of rainfall and snowplowing.
Deer Island overtime spending in the third quarter was $51,300(21.5%) more than budgeted, primarily due to maintenance-relatedactivity.

Workplace Safety3rd Quarter FY08
1
2
3
Workers Compensation Claims Highlights
Lost TimeMedical Only
Light Duty Returns
1 TRAC employee to own position
“Recordable" incidents are all work-related deaths and illnesses, and those work-related injuries which result in loss of consciousness,restriction of work or motion, transfer to another job, or require medical treatment beyond first aid.
"Lost-time" incidents, a subset of the recordable incidents, are only those incidents resulting in any days away from work, days ofrestricted work activity or both - beyond the first day of injury or onset of illness.
The “Historical Average” is computed using the actual MWRA monthly incident rates for FY99 through FY07. The “Upper” and “LowerHistorical Ranges” are computed using these same data – adding and subtracting two standard deviations respectively. FY08 actualincident rates can be expected to fall within this historical range.
3 Metro employees to Acting Stock Clerk positions1 Western Ops employee to Acting Stock Clerk position
6 12
18
Light Duty Returns:
YTD ReturnsNew
New Closed Open Claims
1 DITP employee to own position
14 7 4216 23
Lost Time Injury & Illness Rates
0
2
4
6
8
10
12
J A S O N D J F M A M J
Inci
dent
s pe
r 200
,000
hou
rs w
orke
d
Historical AverageLower Historical RangeUpper Historical RangeFY08 Actual Lost Time
Recordable Injury & Illness Rates
0
2
4
6
8
10
12
J A S O N D J F M A M J
Inci
dent
s pe
r 200
,000
hou
rs w
orke
d
Historical AverageLower Historical RangeUpper Historical RangeFY08 Actual Recordable

Underutilized Job Groups - Workforce Representation Employees Minorities Minority Females Female
as of as of Achievement Over or Under As of Achievement Over or UnderJob Group 3/31/2008 3/31/2008 Level Under utilized 3/31/2008 Level Under utilizedAdministrator A 19 2 1 1 3 4 -1Administrator B 24 0 4 -4 6 7 -1Clerical A 51 24 10 14 44 12 32Clerical B 43 7 10 -3 17 3 14Engineer A 86 16 11 5 13 11 2Engineer B 57 9 5 4 8 20 -12Craft A 120 15 21 -6 0 8 -8Craft B 150 28 19 9 4 7 -3Laborer 56 13 9 4 4 7 -3Management A 98 18 19 -1 31 37 -6Management B 57 9 12 -3 13 27 -14Operator A 70 6 7 -1 3 2 1Operator B 78 8 11 -3 4 3 1Para Professional 61 10 27 -17 27 52 -25Professional A 38 2 6 -4 23 9 14Professional B 181 43 30 13 80 80 0Technical A 47 15 10 5 3 11 -8Technical B 14 4 3 1 4 5 -1
Total 1250 229 215.0 56/-42 287 305 64/-82
AACU Candidate Referrals For Underutilized PositionsJob Group Title # of Vac. Requisition
Int. / Ext.Promotions/
TransfersAACU Ref. External
Position Status
Clerical B Inventory Control Specialist 2 Int 2 0 2 Promo - W/FMaterials Handler 1 Int 0 0 Pending
Craft A M&O Specialist 2 Ext 0 0 Hire-H/MW.S.S. General Foreman 1 Int 1 0 Promo - W/MW.S.S. Foreman 1 Int 0 0 PendingElectrical Operations Sup. 1 Int / Ext 0 0 Pending
Craft B Jr. Instrument Technician 1 Ext 0 3 PendingPlumber/Pipefitter 2 Int / Ext 1 4 Trans/Hire - W/MInstrumentation Specialist 1 Ext 0 0 Pending
Laborers Skilled Laborer 1 Int / Ext 0 1 Hire-W/MOMC Laborer 2 Ext 0 3 PendingBuilding & Grounds Worker 1 Ext 0 0 Pending
Management A Controller 1 Ext 0 0 InterviewingDesign Manager 2 Int 0 0 PendingSr. Program Mgr. Electrical 1 Ext 0 0 Pending
Operator A Research Vessel Operator 1 Ext 0 3 PendingOperator B Operator 1 Ext 0 0 Pending
0
50
100
150
200
250
300
350
400
J A S O N D J F M A M J
Total minorities employedat MWRA
Number of minorities to match 2 - Factor analysis
Shortfall of minorities in underutilized job groups
0
50
100
150
200
250
300
350
400
J A S O N D J F M A M J
Number of females tomatch 2-factor analysis
Total females employed at MWRA
Shortfall of females inunderutilized job
Female - Affirmative Action Plan Minority - Affirmative Action Plan Goals
MWRA Job Group Representation Quarter 3, FY 2008
Highlights:At the end of Q3 FY08, 9 job groups or a total of 42 positions are underutilized by minorities as compared to 9 job groups or a total of 36 at the end of Q3 FY07; for females 11 job groups or a total of 82 positions are underutilized by females as compared to 9 job groupsor a total of 49 at the end of Q3 FY07. During Q3, 2 minorities were hired and 2 minorities terminated. During this same period, 0 females were hired and 2 females terminated.

MBE/WBE Expenditures Third Quarter FY2008
Background: MBE/WBE targets are determined based on annual MWRA expenditure forecasts in the procurement
categories noted below. MBE/WBE percentage goals, resulting from a 2002 Availability Analysis, are applied to the MWRA CIP and CEB expenditure forecasts. As a result of the Availability Analysis, the category of Non-Professional Services is included in Goods/Services. Consistent with contractor reporting requirements, MBE/WBE expenditure data is available through March.
Construction
0
2
46
8
10
J A S O N D J F M A M J
Mill
ions
M BE WBE
MBE Goal $9,451,207
WBE Goal $4,699,495
Professional
0
400
800
1200
1600
J A S O N D J F M A M JTh
ousa
nds
M BE WBE
MBE Goal $1,578,475WBE Goal $1,268,496
Goods/Services
0
300
600
900
1,200
1,500
J A S O N D J F M A M J
Thou
sand
s
M BE WBE
WBE Goal $498,115MBE Goal $572,628
FY08 spending and percentage of goals achieved, as well as FY07 performance are as follows: MBE WBE FY08 Year-to-Date FY07 FY08 Year-to-Date FY07
Amount Percent Amount Percent Amount Percent Amount Percent
Construction 5,646,199 59.7% 4,303,492 55.1% 2,419,081 51.5% 3,789,881 97.6% Professional Svc. 1,472,205 93.3% 1,602,317 117.6% 492,232 38.8% 773,737 70.7% Goods & Svcs. 1,150,675 200.9% 1,188,886 164.2% 464,113 93.2% 312,234 49.6% Total $8,269,079 71.3% $7,094,695 71.7% $3,375,426 52.2% $4,875,852 86.9%

MWRA FY08 CEB Expenses through March 2008
Through March 2008, total revenue was $433.8 million, $11.3 million or 2.7% more than budgeted. Total expenses were $416.3 million, $0.7 million or 0.2% less than budgeted. Expenses – • Direct Expenses totaled $146.5 million, $3.8 million or 2.5% less than budgeted. • Wages and Salaries are $1.6 million or 2.4% less than budgeted as a result of lower regular pay due to
fewer than budgeted filled positions. • Overspending for Chemicals of $213,000 or 3.4% more than budgeted mostly due to higher net usage
for ferric and ferrous chloride, hydrogen peroxide, Polymer, and hydrofluosilicic acid offset by sodium hypochlorite usage and soda ash. Some of this overspending is timing.
• Energy and Utility expenses are $553,000 or 2.8% lower than budgeted mostly due to lower diesel fuel purchases, and lower water and natural gas usage, offset by higher electricity.
• Maintenance spending overall is $246,000 or 1.4% more than budgeted. Overspending in both Support and Operations of $393,000 mostly due to timing, offset by Emergency Preparedness of $146,000 lower spending for special equipment materials and services.
• Professional Services expense is $833,000 or 15.2% less than budgeted mainly due to underspending for security in Emergency Preparedness Department and lab and testing analysis in ENQUAD.
• Other Services is under budget by $862,000 or 5.1% of which $657,000 is for sludge pelletization and $84,000 is for grit and screenings, both related to lower quantities.
• Other Materials overspending of $331,000 or 12.6% due to timing for vehicle purchase/replacements offset by lower computer hardware and lab and testing supplies.
• Indirect Expenses are $183,000 or 0.5% less than budget due to lower spending for insurance payments/claims and BECo payment offset by an overaccrual of watershed expenses in FY07 and higher PILOT than budgeted.
• Debt Service totaled $236.6 million, $3.3 million or 1.4% more than budgeted as a result of higher variable rate payment of $2.6 million, higher SRF obligation of $588,000 and lower debt service assistance of $0.2 million.
Revenue and Income – • Other User Charges and Other Revenue totaled $18.8 million combined; the majority of the $9.6 million
variance is for Reading entrance fee ($7.8 million) which was not budgeted, higher than budgeted receipt for the Renewable Portfolio Standard (RPS) credits for the Deer Island energy program, miscellaneous revenue relating to NStar Rebate Energy Efficiency Program.
• Investment Income through March totaled $26.7 million, $1.6 million or 6.4% more than budgeted partly due to the effect of higher than budgeted interest rates year-to-date, and higher fund balances.
Period 9 YTDBudget
Period 9 YTDActual
Period 9 YTDVariance % FY08
Approved%
Expended
EXPENSESWAGES AND SALARIES 65,081,001$ 63,519,247$ (1,561,754)$ -2.4% 88,091,461$ 72.1%OVERTIME 2,817,093 2,817,046 (47) 0.0% 3,864,290 72.9%FRINGE BENEFITS 12,185,327 11,614,831 (570,496) -4.7% 16,271,444 71.4%WORKERS' COMPENSATION 1,042,200 837,283 (204,917) -19.7% 1,400,000 59.8%CHEMICALS 6,328,226 6,541,553 213,327 3.4% 8,702,932 75.2%ENERGY AND UTILITIES 19,655,927 19,103,428 (552,499) -2.8% 26,532,695 72.0%MAINTENANCE 17,890,038 18,136,382 246,344 1.4% 25,768,810 70.4%TRAINING AND MEETINGS 168,184 148,876 (19,308) -11.5% 222,252 67.0%PROFESSIONAL SERVICES 5,484,282 4,650,913 (833,369) -15.2% 7,869,287 59.1%OTHER MATERIALS 2,633,483 2,964,494 331,011 12.6% 5,022,858 59.0%OTHER SERVICES 17,037,207 16,174,969 (862,238) -5.1% 22,893,395 70.7%TOTAL DIRECT EXPENSES 150,322,968$ 146,509,022$ (3,813,946)$ -2.5% 206,639,424$ 70.9%
INSURANCE 1,875,003$ 1,688,923$ (186,080)$ -9.9% 2,500,000$ 67.6%WATERSHED/PILOT 17,405,361 17,534,394 129,033 0.7% 23,207,147 75.6%BECo PAYMENT 3,233,700 3,106,700 (127,000) -3.9% 4,347,200 71.5%MITIGATION 1,064,418 1,055,225 (9,193) -0.9% 1,419,223 74.4%ADDITIONS TO RESERVES 1,240,991 1,240,991 - 0.0% 1,654,655 75.0%RETIREMENT FUND 3,174,997 3,185,241 10,244 0.3% 4,233,329 75.2%POST EMPLOYEE BENEFITS 5,324,172 5,324,175 3 0.0% 7,098,896 75.0%TOTAL INDIRECT EXPENSES 33,318,642$ 33,135,649$ (182,993)$ -0.5% 44,460,450$ 74.5%
DEBT SERVICE 246,211,002$ 249,353,005$ 3,142,003$ 1.3% 330,627,700$ 75.4%DEBT SERVICE ASSISTANCE (12,937,500) (12,735,020) 202,480 -1.6% (17,250,000) 73.8%TOTAL DEBT SERVICE 233,273,502$ 236,617,985$ 3,344,483$ 1.4% 313,377,700$ 75.5%
TOTAL EXPENSES 416,915,112$ 416,262,656$ (652,456)$ -0.2% 564,477,574$ 73.7%
REVENUE & INCOMERATE REVENUE 388,348,374$ 388,348,374$ -$ 0.0% 517,797,832$ 75.0%OTHER USER CHARGES 5,487,919 12,921,548 7,433,629 135.5% 7,565,475 170.8%OTHER REVENUE 3,632,774 5,847,778 2,215,004 61.0% 5,241,223 111.6%INVESTMENT INCOME 25,045,533 26,660,356 1,614,823 6.4% 33,873,044 78.7%
TOTAL REVENUE & INCOME 422,514,600$ 433,778,056$ 11,263,456$ 2.7% 564,477,574$ 76.8%
March 2008Year-to-Date

Cost of Debt March 2008
MWRA borrowing costs are a function of the fixed and variable tax exempt interest rate environment, the level of MWRA’s variable interest rate exposure and the perceived creditworthiness of MWRA. Each of these factors has contributed to decreased MWRA borrowing costs since 1990.
Average Cost of MWRA Debt
Fixed Debt ($3,898) 4.67% Variable Debt ($699) 4.06% SRF Debt ($997) 0.92% Weighted Average Debt Cost ($5,594) 3.93% Most Recent Senior Fixed Debt Issue
February 2007 2007 Series A & B ($848) 4.34%
Weekly Average Interest Rates vs. Budget
MWRA currently has nine variable rate debt issues with $615 million outstanding, excluding commercial paper and the seven floating rate issues which have been swapped to fixed rate. Variable rate debt has been less expensive than fixed rate debt in recent years, as short term rates have remained lower than long term rates on MWRA debt issues. Short term rates have been relatively constant during the first half of fiscal year 2008, but market conditions began to change in January. MWRA’s issuance of variable rate debt, although consistently less expensive in recent years, results in exposure to additional interest rate risk as compared to fixed rate debt.
Weekly Average Interest Rate on MWRA Variable Rate DebtIncludes Iiquidity support and remarketing fees
0.00%
0.50%1.00%
1.50%
2.00%2.50%
3.00%3.50%
4.00%
4.50%5.00%
5.50%
6.00%6.50%
7.00%
7/4 8/1 8/29 9/26 10/24 11/21 12/19 1/16 2/13 3/13 4/10 5/8 6/5 7/2
Week Ending
Inte
rest
Rat
e
BudgetFY07 ActualFY08 Actual
2/074.34%
3/025.23%
10/005.03%
10/917.08%
1/907.67%
3/926.98%12/92
6.58%
4/935.89%
11/935.66%8/94
6.15%
12/955.34%
11/965.78%
11/975.40%
1/985.04%*
12/984.30%**
1/994.33%**
2/006.11%
3/005.52%**
8/024.39%**
12/024.71%
1/044.64%
9/044.17%
5.05%6/04
4.22%4/05
3/064.61%4.00%
5.00%
6.00%
7.00%
8.00%
1/90 12/90 11/91 10/92 9/93 8/94 7/95 6/96 5/97 4/98 3/99 2/00 1/01 12/01 11/02 10/03 9/04 8/05 7/06 6/07 5/08
Inte
rest
Rat
e
30 Year M unicipal Utility Rate M WRA Issue - Date and TIC
MWRA Fixed Rate Debt vs. 30 Year Municipal Utility Interest Rate
*1/98 Issue is 40 Year Debt**Synthetic Fixed Rate

Investment Income March 2008
Actual interest income varies from budgeted amounts because either fund balances or interest rates are greater or lower than budgeted.
YTD Investment Income vs Budget ($000)
YTD Investment Income Variance
Combined Impact on Investment Income
Fund
Average Budgeted Balance
Average Actual
Balance Variance Impact Budget Actual Impact Impact %
Combined Reserves $89,297 $89,790 $494 $8 4.98% 4.98% $6 $14 0.42%
Construction $93,562 $92,089 ($1,473) ($50) 4.50% 4.87% $257 $207 6.51%
Debt Service $100,192 $107,373 $7,181 $244 4.50% 4.82% $262 $507 14.86%
Debt Service Reserves $272,290 $274,830 $2,541 $93 5.08% 4.85% ($462) ($369) -3.53%
Operating $55,650 $50,973 ($4,677) ($167) 4.44% 4.50% $31 ($136) -7.27%
Revenue $45,092 $78,375 $33,282 $1,133 4.55% 4.85% $191 $1,324 85.43%
Redemption $35,410 $35,410 $0 ($0) 4.54% 4.80% $68 $68 5.57%
Total $691,492 $728,840 $37,347 $1,260 4.79% 4.84% $354 $1,615 6.4%
Impact on Investment Income due to Variance in Interest Rates
Impact on Investment Income due to Variance in Fund Balances
-20%
-10%
0%
10%
20%
Jul Aug Sep Oct Nov Dec Jan Feb Mar Apr May Jun
YTD
Var
ianc
e %
Total Variance Zero Variance


